poverty measurement in india - india environment portal
TRANSCRIPT
Ministry of Rural Development
Working Paper No. 1/2020
POVERTY MEASUREMENT IN INDIA: A STATUS UPDATE
Dr. SEEMA GAUR
&
Dr. N SRINIVASA RAO
September 2020
Note: Authors are Principal Economic Adviser and Economic Adviser respectively in the
Department of Rural Development.

2
Abstract
This paper provides an overview of estimation of poverty by various expert groups in India. It
also discusses the limitations of below poverty line (BPL) approach in India. It also provides an
overview of other poverty measures at international level particularly Global Multidimensional
Poverty Index (MPI) and their assessment about India. The paper concludes by reviewing present
approaches and options for poverty measurement.
Disclaimer: Views expressed in this paper are exclusively of the author(s) and not of any other
individual or the Ministry of Rural Development. It has been prepared in good faith on the basis
of information available at the date of publication.

3
1. INTRODUCTION
Poverty elimination has remained a major challenge right from independence and lies at the core
of India's national development agenda to create a just and equitable society. Given the limited
resources, reliable estimation of poverty is the first step towards eradication of poverty as a basic
input for design, implementation and monitoring of anti poverty programmes. Poverty
measurement is also important to serve as a barometer of the extent of the success of strategies
for inclusive growth and poverty reduction.
Poverty can be defined as a condition in which an individual or household lacks the financial
resources to afford a basic minimum standard of living. However, the perception regarding what
constitutes poverty may vary over time and across countries. The conventional approach to
measuring poverty is to specify a minimum expenditure (or income) required to purchase a
basket of goods and services necessary to satisfy basic human needs. This expenditure is called
the poverty line. The basket of goods and services necessary to satisfy basic human needs is the
Poverty Line Basket (PLB). Poverty can be measured in terms of the number of people living
below this line (with the incidence of poverty expressed as the head count ratio (HCR) or the
poverty ratio - number of poor to the total population expressed as percentage). Globally,
countries use different measures for measuring poverty but the underlying principle remains the
same - a poverty line is calculated based on of consumption required for maintaining some
minimum standard of living in the country. However, complexities of measuring incidence of
poverty in a comparable manner over time and across regions have given rise to alternative
approaches also such as measures of the depth of poverty and of its severity.
2. METHODOLOGY OF ESTIMATION
India has a long history of studies on measurement of poverty. The erstwhile Planning
Commission was the nodal agency in India for estimation of poverty. Based on the methodology
suggested by the Expert Groups/Committees set up by the Planning Commission from time to
time, India has undertaken periodic assessments of the incidence of poverty since the 1960s.
The poverty ratio in India has been measured from an exogenously determined poverty line
quantified in terms of per capita consumption expenditure over a month and the class distribution
of persons obtained from the large sample survey of consumer expenditure data of the National
Sample Survey Office (NSSO). Households with consumption expenditures below the poverty
line are said to be “Below the Poverty Line (BPL)” and deemed poor. Consumption is measured
in terms of a collection of goods and services known as reference Poverty Line Baskets (PLB).
Thus, estimation of poverty in India has been based on two critical components:

4
Information on the consumption expenditures and its distribution across households is
provided by the NSS consumption expenditure surveys;
These expenditures by households are evaluated with reference to a given poverty line.
a) Poverty Line Estimation
The first step in estimating poverty is to define and quantify a poverty line.
Pre-Independence Poverty Estimation
i) Poverty and Unbritish Rule in India (1901): Dadabhai Naoroji’ in his book ‘Poverty and
Un-British Rule in India,’ made the earliest estimate of poverty line at 1867-68 prices
(₹16 to ₹35 per capita per year) based on the cost of a subsistence diet for the emigrant
coolies during their voyage living in a state of quietude.
ii) National Planning Committee’s (1938): In 1938, the National Planning Committee set
up under the chairmanship of Jawaharlal Nehru suggested a poverty line (ranging from
₹15 to ₹20 per capita per month) based on a minimum standard of living.
iii) The Bombay Plan (1944): Bombay Plan1 proponents suggested a poverty line of ₹75
per capita per year, which was much more modest than that of the NPC.
Post- Independence Poverty Estimation
Various expert groups constituted by the Planning Commission have estimated the number of
people living in poverty in India:
i) Working Group (1962): The poverty line in India was quantified for the first time in
1962 by this Group in terms of a minimum requirement (food and non-food) of
individuals for healthy living. The Group appeared to have taken into account the
recommendation of balanced diet made by the Nutrition Advisory Group of the Indian
Council of Medical Research (ICMR) in 1958. The Group formulated the separate poverty
lines for rural and urban areas (₹20 and ₹25 per capita per month respectively in terms of
1960-61 prices) without any regional variation. The poverty line excluded expenditure on
health and education, both of which, it was assumed, were to be provided by the State.
Although not official poverty lines, these were widely used in the 1960s and 1970s to
estimate the poverty ratio at national and state level.
ii) Study by VM Dandekar and N Rath (1971): Although this was not a study
commissioned by the Planning Commission, the origins of India’s poverty line lie in the
seminal work of two economists, V N Dandekar and N Rath, who first established the
consumption levels required to meet a minimum calorie norm of an average calorie norm
of 2,250 calories per capita per day. They made the first systematic assessment of
poverty in India, based on National Sample Survey (NSS) data. Unlike previous scholars
who had considered subsistence living or basic minimum needs criteria as the measure of
poverty line, they derived poverty line from the expenditure adequate to provide 2250
1 It was a set of a proposal of a small group of influential business leaders in for the development of the post-independence
economy of India.

5
calories per day in both rural and urban areas. Expenditure based Poverty line estimation
generated a debate on minimum calorie consumption norms. They found poverty lines to
be Rs. 15 per capita per month for rural households and Rs. 22.5 per capita per month for
urban households at 1960‐61 prices.
iii) Task Force on “Projections of Minimum Needs and Effective Consumption
Demand” headed by Dr. Y. K. Alagh (1979): This Task Force was constituted in 1977
and it submitted its report in 1979. Official poverty counts began for the first time in
India based on the approach of this Task Force. Poverty line was defined as the per capita
consumption expenditure level to meet average per capita daily calorie requirement of
2400 kcal per capita per day in rural areas and 2100 kcal per capita per day in urban
areas. The average calorie requirements were estimated as a population–weighted
average of the age-gender-activity specific calorie allowances recommended by the
Nutrition Expert Group (1968) by reference to the 1971 population Census. Based on
1973-74 prices, the Task Force set the rural and urban poverty lines at Rs. 49.09 and Rs.
56.64 per capita per month at 1973-74 prices. These lines were based on the assumption
of different PLBs for rural and urban consumption.
iv) Lakdawala Expert Group (1993): Until the 1990s, no attempt was made to capture differences
in prices or differences in consumption patterns across states or over time. Poverty estimates were
revised with each quinquennial NSS survey and price indices were used to adjust for price
changes over time. This methodology for estimating poverty at national and state level was
regarded by some as inappropriate in giving a representative picture of the incidence of poverty in
the country. In 1989, The Planning Commission constituted the Lakdawala Expert Group
to "look into the methodology for estimation of poverty and to re-define the poverty line,
if necessary". The Expert Group submitted its report in 1993. It did not redefine the
poverty line and retained the separate rural and urban poverty lines recommended by the
Alagh Committee at the national level based on minimum nutritional requirements.
However, it disaggregated them into state-specific poverty lines in order to reflect the
inter-state price differentials. It suggested their updating using the Consumer Price Index
of Industrial Workers (CPI-IW) in urban areas and Consumer Price Index of Agricultural
Labour (CPI-AL) in rural areas rather than using National Accounts Statistics. This
assumed that the basket of goods and services used to calculate CPI-IW and CPI-AL
reflect the consumption patterns of the poor. These recommendations led the erstwhile
Planning Commission to adopt the practice of calculating poverty levels in rural and
urban areas in the states using state-specific poverty lines together with the national
estimates from 1997 to 2004-05. Over the years, this method lost credibility. The price
data were flawed and successive poverty lines failed to preserve the original calorie
norms.
v) Tendulkar Expert Group (2009): In 2005, another expert group chaired by Suresh
Tendulkar was constituted to review the methodology for poverty estimation. It was to do
address the three key shortcomings of the previous methods: (i) Poverty estimates being
linked to the 1973-74 poverty line baskets (PLBs) of goods and services did not reflect
significant changes in consumption patterns of poor over time; (ii) Issues with the
adjustment of prices for inflation, both spatially (across regions) and temporally (across

6
time); and (iii) Presumption of provision of health and education by the State only. The
Expert Group submitted its report in 2009. It did not construct a poverty line and adopted
the officially measured urban poverty line of 2004-05 (25.7%) based on Expert Group
(Lakdawala) methodology. It worked backward for specifying poverty lines that
generated such a poverty rate. The Tendulkar Committee suggested several changes to
the way poverty was measured. Firstly, it recommended a shift away from basing the
poverty lines from calorie norms used in all poverty estimations since 1979 and towards
target nutritional outcomes instead2. Secondly, instead of two separate PLBs for rural and
urban poverty lines, it recommended a uniform all-India urban PLB across rural and
urban India. Thirdly, it recommended using Mixed Reference Period (MRP) based
estimates, as opposed to Uniform Reference Period (URP) based estimates used in earlier
methods for estimating poverty. It recommended incorporation of private expenditure on
health and education while estimating poverty. It validated the poverty lines by
checking the adequacy of actual private consumption expenditure per capita near the
poverty line on food, education and health by comparing them with normative
expenditures consistent with nutritional, educational and health outcomes respectively.
Instead of monthly household consumption, consumption expenditure was broken up into
per person per day consumption, resulting in the figure of Rs 32 and Rs 26 a day for
urban and rural areas. The national poverty line for 2011-12 was estimated at Rs. 816 per
capita per month for rural areas and Rs. 1,000 per capita per month for urban areas.
vi) Rangrajan Committee (2014): Due to widespread criticism of Tendulkar Committee
approach as well as due to changing times and aspirations of people of India, Rangarajan
Committee was set up in 2012. This Committee submitted its report in June 2014. It
reverted to the practice of having separate all-India rural and urban poverty line baskets
and deriving state-level rural and urban estimates from these. It recommended separate
consumption baskets for rural and urban areas which include food items that ensure
recommended calorie, protein & fat intake and non-food items like clothing, education,
health, housing and transport. This committee raised the daily per capita expenditure to
Rs 47 for urban and Rs 32 for rural from Rs 32 and Rs 26 respectively3 at 2011-12 prices.
Monthly per capita consumption expenditure of Rs. 972 in rural areas and Rs. 1407 in
urban areas is recommended as the poverty line at the all India level. The government did
not take a call on the report of the Rangarajan Committee.
b) Use of Consumption Expenditure Surveys
Poverty line estimation in India has been based on the consumption expenditure and not on the
income levels due to difficulties in assessing incomes of self-employed people, daily wage
laborers etc, large fluctuations in income due to seasonal factors, additional side incomes as well
as data collection difficulties in largely rural and informal economy of India. Since households
may be able to access credit markets or household savings and thereby smooth their
consumptions to some degree, consumption expenditures may be able to provide a better basis
2 As it found a poor correlation between food consumed and nutrition outcomes. 3 Recommended by Tendulkar Committee.

7
for determining a household’s actual standard of living. Hence, most of the Poverty Estimation
Committees proposed that per capita consumption expenditure or household expenses were the
right statistical choice for calculating poverty in India.
Incidence of poverty is estimated by the Planning Commission on the basis of the large sample
surveys on household consumer expenditure conducted by the National Sample Survey
Organisation (NSSO) on a quinquennial basis. The NSSO regularly conducts survey on
household consumer expenditure, in which households are asked about their consumption of last
30 days and is taken as the representative of general consumption. This was considered a much
better data to estimate the incidence of poverty at national and sub-national levels by adjusting
for inter-state and inter-region differences in price changes over time. Estimates of consumption
expenditure seen in the National Accounts Statistics and as inferred from the sample surveys of
the National Sample Survey Organisation show a large and growing variance. Hence,
increasingly, reliance was placed on the NSSO’s sample surveys on consumption expenditure by
households, a much better method to adjust for inter-state and inter-region differences in price
changes over time, and the use of the better recall period introduced in the NSSO’s surveys.
Data Collection Method for NSSO Expenditure Survey
Uniform Resource Period (URP): Till 1993-94, the poverty line was based on URP data,
which involved asking people about their consumption expenditure across a 30-day recall
period, i.e, information was based on the recall of consumption expenditure in the previous 30
days.
Mixed Reference Period (MRP): From 1999-2000 onwards, the NSSO switched to an MRP
method which measures consumption of five low-frequency items (clothing, footwear,
durables, education and institutional health expenditure) over the previous year, and all other
items over the previous 30 days.
Release of Poverty Line Estimates
The erstwhile Planning Commission released the estimates of poverty as number of persons
below poverty line as a percentage of Indian population for the years 1973-74, 1977-78, 1983,
1987-88, 1993-94, 1999-2000, 2004- 05, 2009-10 and 2011-12 respectively. In July 2013, based
on the Tendulkar poverty line, Planning Commission released poverty data for 2011-12. The
number of poor in the country was pegged at 269.8 million or 21.9% of the population. After
this, no official poverty estimates in India have been released.
3. LIMITATIONS OF “BELOW POVERTY LINE (BPL)” APPROACH
It is clear that the process for establishing poverty line estimation has been in constant flux. The
use of a minimum adequate norm of nutrition as a key criterion for defining the poverty line has
come in for criticism, both for the level at which it has been fixed and for the inadequacy of the
expenditure level of households at which these norms are likely to be met in providing a

8
minimum standard of living. As such, conceptual and empirical approaches to the measurement
of poverty and the interpretation of data are not universally accepted.
Discussion on determining the nutritional or calorie norm in which the poverty line is rooted has
been long and complex. Common sense suggests that poverty line should vary over regions
mainly because of the variations of the tastes and preferences and the price structures over the
regions. Hence, determining components of Poverty Line Basket (PLB) has been one of the key
challenge of poverty line estimation in India due to price differentials (of constituents of basket)
which vary from state to state and period to period. Further, consumption patterns, nutritional
needs and prices of components keep on changing as per dynamics of macro economy and
demography. Large divergences opened up between the poverty rates calculated by “direct”
method on the basis of actual calorie intakes vis-à-vis the minimum requirements, and the
“indirect” method based on per capital expenditures vis-à-vis the periodically updated poverty
lines. A significant %age of house-holds above the expenditure-based poverty line was unable to
meet the minimum calorie requirements. This called into question the practice of defining a
“poor household” solely on the basis of its per capital monthly expenditure vis-à-vis a poverty
line expenditure cut off without considering the household’s access to a wide set of dimensions.
As shortcomings of poverty measurements by various Committees became apparent, another
question arose whether poverty is only about consumption? Poverty encompasses other factors
such as poor health or malnutrition, lack of clean water or electricity, poor quality of work and
limited education access. The multi-dimensional character of poverty was recognized. However,
the deprivations faced by poor in various fields such as education, health, sanitation etc are not
accounted in Below Poverty Line approach. Further, public expenditure on social services like
education, health and food security had increased substantially in recent years, which was not
captured, by design, in the NSSO’s Consumer Expenditure Surveys and the poverty line derived
from these is thus lower than the services actually consumed. The actual ‘well- being’ of the
household will be higher than what is indicated by the poverty line. However, even the
Rangrajan Committee set up in 2012 missed the opportunity to go beyond the expenditure-based
poverty rates and look into the possibility of a wider multi-dimensional view of poverty.
In the above context, Standing Committee on Finance (Minutes of the Nineteenth sitting on 19th
the 31st May, 2010) has pointed out:
“The existing poverty line approach has its inherent limitations and may not capture important
aspects of the real living conditions of the people. This is also abundantly evident from the fact that
though States like Assam, Andhra Pradesh and J&K have a high malnourishment ratio, the poverty
estimates of these States, as per the Planning Commission’s figures are much lower. This leads us to
the key question of appropriate criteria to estimate poverty and its various facets. …The Committee
cannot help expressing regret over the fact that the criteria / approach recommended by various
expert groups set up from time to time for defining and determining “poverty” or “poverty line” thus
far have only left question marks and have failed in capturing the actual incidence of poverty in the
country. Important aspects such as ill health, low educational attainments, geographical isolation,
powerlessness or dis-empowerment in civil society, caste or gender based inherent disadvantages etc.
remain to be conclusively captured in identifying and enumerating the poor. The wide variation in

9
determining the population of the poor is illustrated by the fact that as per one of the expert groups
appointed recently, the BPL population in the country would be as much as 80% as per the existing
calorie norm of 2,400, while as per another norm it is only 37.2%.”
It was also mentioned that “The Committee are sanguine that the poverty ratio needs to be
estimated objectively and realistically and the criteria therefore should stretch beyond the current
norm which lays emphasis on calorific value and reflect faithfully the changing nutritional
profile and living status of the masses. Government programmes can be more effectively
delivered if the multiple dimensions of poverty are recognized and the criteria nuanced
accordingly”.
4. BPL CENSUS FOR IDENTIFICATION OF POOR HOUSEHOLDS
Identification of poor households is a prerequisite for proper targeting of beneficiaries under pro-
poor programmes. While the erstwhile Planning Commission estimated poverty, actual
identification of the “Below the Poverty Line (BPL)” households in rural areas was done by the
Ministry of Rural Development (MoRD) since 1992. The Ministry provided financial and
technical support to the States / UTs to conduct the BPL census through door-to-door survey
with 100% coverage of rural households. BPL Census was done in 1992 for 8th Five Year Plan,
in 1997 for 9th Five Year Plan and in 2002 for 10th Five Year Plan. The BPL census of 1992
used an income criterion to determine poverty with the annual income cut-off fixed at Rs. 11,000
per household. The BPL Census of 1997 was conducted in two stages. First, some families were
excluded on the basis of certain criteria. In the second stage, each remaining household was
interviewed to determine its total consumer expenditure, and was identified as a BPL household
if its per capita consumer expenditure was below the poverty line set by the planning
Commission. Given the difficulty in identifying the poor or persons below the poverty line based
on income and consumption expenditure-based criteria, 2002 BPL Census was based on the an
indicator-based scoring approach4 to classifying households as poor and non-poor. The BPL
Censuses generated criticisms across the three major categories: methodological drawbacks in
identification, data quality and corruption, and data content.
For identification of BPL families in urban areas, the Ministry of Housing and Urban Poverty
Alleviation is the nodal agency which issues guidelines for carrying out house to house survey
by the States/Union Territories on the basis of State specific poverty lines indicated by Planning
Commission.
5. SOCIO-ECONOMIC CASTE CENSUS SURVEY (SECC) 2011
4 Score Based Ranking of rural households for which 13 socio-economic parameters on various aspects (like size of
landholding, type of house, availability of clothing, ownership of consumer durables, food security, access to sanitation,
education attainment, migration, etc) were used, each parameter having a score between 0-4.
10
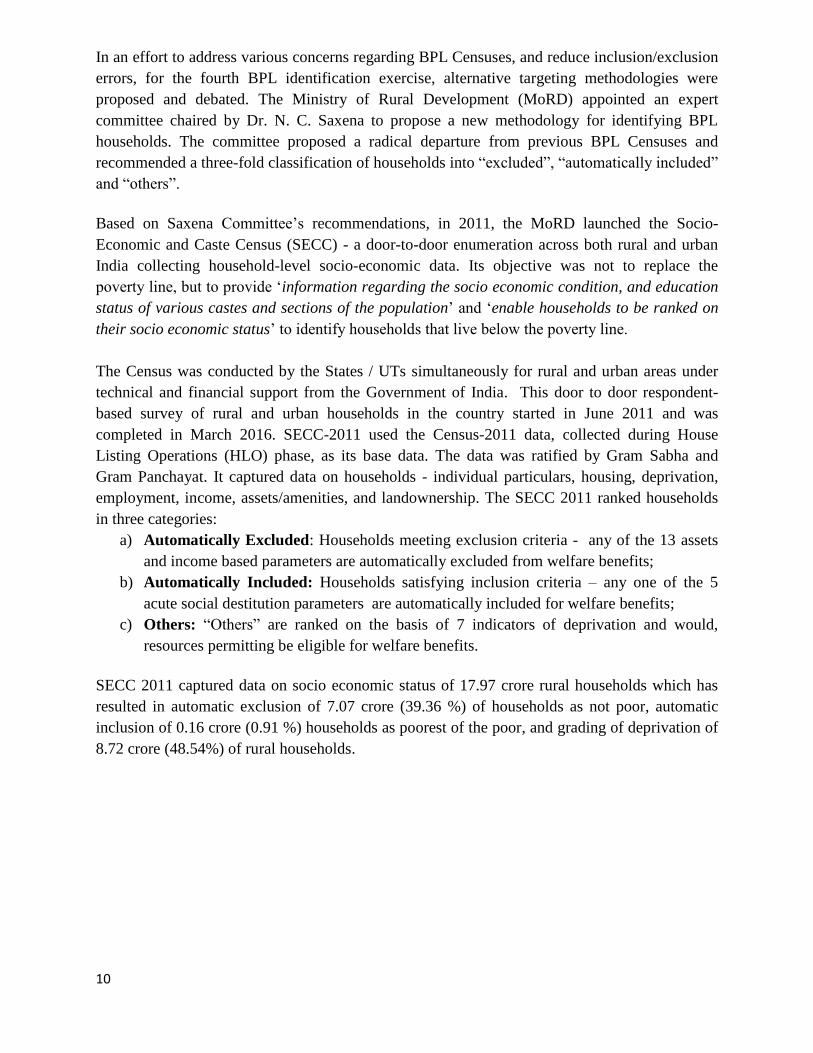
In an effort to address various concerns regarding BPL Censuses, and reduce inclusion/exclusion
errors, for the fourth BPL identification exercise, alternative targeting methodologies were
proposed and debated. The Ministry of Rural Development (MoRD) appointed an expert
committee chaired by Dr. N. C. Saxena to propose a new methodology for identifying BPL
households. The committee proposed a radical departure from previous BPL Censuses and
recommended a three-fold classification of households into “excluded”, “automatically included”
and “others”.
Based on Saxena Committee’s recommendations, in 2011, the MoRD launched the Socio-
Economic and Caste Census (SECC) - a door-to-door enumeration across both rural and urban
India collecting household-level socio-economic data. Its objective was not to replace the
poverty line, but to provide ‘information regarding the socio economic condition, and education
status of various castes and sections of the population’ and ‘enable households to be ranked on
their socio economic status’ to identify households that live below the poverty line.
The Census was conducted by the States / UTs simultaneously for rural and urban areas under
technical and financial support from the Government of India. This door to door respondent-
based survey of rural and urban households in the country started in June 2011 and was
completed in March 2016. SECC-2011 used the Census-2011 data, collected during House
Listing Operations (HLO) phase, as its base data. The data was ratified by Gram Sabha and
Gram Panchayat. It captured data on households - individual particulars, housing, deprivation,
employment, income, assets/amenities, and landownership. The SECC 2011 ranked households
in three categories:
a) Automatically Excluded: Households meeting exclusion criteria - any of the 13 assets
and income based parameters are automatically excluded from welfare benefits;
b) Automatically Included: Households satisfying inclusion criteria – any one of the 5
acute social destitution parameters are automatically included for welfare benefits;
c) Others: “Others” are ranked on the basis of 7 indicators of deprivation and would,
resources permitting be eligible for welfare benefits.
SECC 2011 captured data on socio economic status of 17.97 crore rural households which has
resulted in automatic exclusion of 7.07 crore (39.36 %) of households as not poor, automatic
inclusion of 0.16 crore (0.91 %) households as poorest of the poor, and grading of deprivation of
8.72 crore (48.54%) of rural households.

11
Socio-Economic and Caste Census (SECC)
7
Criteriato measure
Deprivations
1
2
3
4
5
6
7
Households with only one room with no solid walls and roof
Households with no adult male aged 15-59
Female Headed households
Households with differently-abled members
Households with no able bodied members
SC/ST households with no literate memberabove the age of 25
Landless households deriving major portion of their income from manual labour
Unlike BPL Censuses, SECC-2011 allows for the first time to track the deprivation of
households and address gaps effectively with focus on multi-dimensionality of poverty. Being
outside the Census Act, it provides a rare opportunity to know the specific deprivation of each
household. The Sumit Bose Committee (2017) recommended using SECC 2011 data to identify
beneficiaries for all centrally sponsored, central and state government schemes as far as possible.
The Government has used SECC data for identification of beneficiary households while
implementing its social welfare programmes including Pradhan Mantri Aawas Yojana-Gramin,
Deendayal Antyodaya Yojana-National Rural Livelihood Mission, Pradhan Mantri Jan Arogya
Yojana-Ayushman Bharat, Pradhan Mantri Sahaj Bijli Har Ghar Yojana, and Pradhan Mantri
Ujjwala Yojana. It is also being used by several state governments to implement National Food
Security Act. ?
Use of SECC data in the implementation of Government programmes allows for evidence based
developmental interventions. With the use of SECC data, the programme specific priority list is
generated keeping in view the fiscal space of the welfare programme for targeting specific pro-
poor interventions. The selection of beneficiaries gets validated through Gram Sabhas, while
identity is established through Aadhaar wherever legally allowed. This leads to selection of right
beneficiaries and minimizes duplication and fraud. This has substantially enhanced the
effectiveness of government‘s efforts to tackle multi-dimensional poverty, going beyond income
or expenditure based poverty.
6. INTERNATIONAL INDICES TO MEASURE POVERTY
In recent years, international research agencies and institutions have, based on evidence
suggested a transformational change in the rate of poverty decline in India. Both in terms of
income and decline of chronic poverty as also in terms of multi-dimensional poverty, the
performance of India over the last two decades has attracted global attention.

12
World Bank defines poverty as deprivation in well-being comprising many dimensions. It
includes low incomes and the inability to acquire the basic goods and services necessary for
survival with dignity. Out of 17 Sustainable Development Goals (SDGs), to which India is
committed, the first two are “ending poverty in all forms and hunger". SDG1 is, by 2030 to
reduce at least by half the proportion of men, women and children of all ages living in poverty in
all its dimensions according to national definitions. India has not only committed to achieving
the Sustainable Development Goals (SDGs), it was a leading proponent of the first goal that
addresses the issue of poverty. This goal commits the signatories to eliminating poverty
according to the common international poverty line of $1.25 per person per day (at 2005
Purchasing Power Parity or PPP) and cutting it in half “according to national definitions” (goals
1.1 and 1.2, respectively). The UN’s 2030 Agenda for Sustainable Development reaffirmed the
importance of multi-dimensional approaches to poverty eradication that go beyond economic
deprivation. Various international efforts to measure poverty along with implications for India
are briefly discussed below:
a) Global Multi Dimensional Poverty Index (MPI)
Launched in 2010 by the United Nations Development Program (UNDP) and the Oxford Poverty
and Human Development Initiative (OPHI), the MPI is a measure of multidimensional poverty
covering more than 100 developing countries5. It goes beyond income as the sole indicator for
poverty and tracks deprivation across three dimensions and 10 indicators as indicted below:
i). Education: Years of schooling and child enrollment (1/6 weightage each, total 2/6);
ii). Health: Child mortality and nutrition (1/6 weightage each, total 2/6);
iii). Standard of living: Electricity, flooring, drinking water, sanitation, cooking fuel and assets
(1/18 weightage each, total 2/6).
Global MPI: Dimensions, Indicators & Weights
H e a l t h
E d u c a t i o n
L i v i n g S t a n d a r d s
Child Mortality
Nutrition
Years of Schooling
School Attendance
Cooking Fuel
Sanitation
Drinking Water
Housing
Electricity
Assets
1/3
1/3
1/3
1/6
1/6
1/6
1/6
1/18
1/18
1/18
1/18
1/18
1/18
Dim
en
sio
ns
of
Po
ve
rty
Weight Structure Indicators
(Based on Global MPI Reports)
5 The Global MPI is released at the High-Level Political Forum (HLPF) on Sustainable Development of the United
Nations in July every year.

13
A person is multi-dimensionally poor if she/he is deprived in one third or more (means 33% or
more) of the weighted ten indicators. Those who are deprived in one half or more of the
weighted indicators are considered living in extreme multidimensional poverty. The MPI ranges
from 0 to 1, higher values implying higher poverty. It is the product of the incidence of poverty
(proportion of poor people) and the intensity of poverty (average deprivation score of poor
people). Presently, it is the most comprehensive measure of multidimensional poverty compared
to the conventional methodology that measures poverty only in income or monetary terms.
Global Multi-dimensional Poverty Index (MPI) 20186 frames India as a success story devoting a
separate chapter to India. It says, “India has made momentous progress in reducing multidimensional
poverty. The incidence of multidimensional poverty was almost halved between 2005/06 and 2015/16,
climbing down to 27.5%. The global Multidimensional Poverty Index (MPI) was cut by half due to faster
progress among the poorest. Thus within ten years, the number of poor people in India fell by more than
271 million – a truly massive gain. The scale of India’s scale of multi-dimensional poverty reduction has
global implications that could parallel China’s progress.”
Global MPI 2018 on India shows that during 2005-06 to 2015-16:
Among 10 selected countries, India (and Cambodia) reduced their MPI values the fastest and
did not leave the poorest groups behind. Fastest poverty reduction in India was among the
country's most vulnerable (including Muslims and residents of the poorest states)
suggesting they are "catching up" with the rest of society.
India (along with Ethiopia and Peru) significantly reduced deprivations in all 10 indicators,
namely nutrition, sanitation, child mortality, drinking water, years of schooling, electricity,
school attendance, housing, cooking fuel and assets.
India demonstrates the clearest pro-poor pattern at the sub-national level: the poorest regions
reduced multidimensional poverty the fastest in absolute terms. Poverty reduction in rural
areas outpaced that in urban areas. Improvement in average attainment in all the above 10
indicators among the bottom 40 % exceeded that among the total population.
Global MPI 2020 Report 7 indicates that India8 is 62nd among 107 countries with an MPI score
of 0.123 and 27.9%9 population identified as multi-dimensionally poor, the number was 36.8%
for rural and 9.2% for urban India. There were wide variations across states. District level data
reveals deep pockets of poverty but also impressive progress across the country
6 Global MPI for India for 2018, 2019, 2020 has utilised the National Family Health Survey (NFHS) 2015-16 data, conducted
under the aegis of Ministry of Health and Family Welfare (MoHFW) and International Institute for Population Sciences (IIPS).
7 Country Briefing 2020:India 8 For India, the MPI used data from the third and fourth rounds of the National Family Health Survey (NFHS) to measure
multidimensional poverty across 640 districts. It is the first large-scale index disaggregated to both state and district levels, by
rural and urban areas, age groups, scheduled castes and tribes, and religious groups. This means that for the first time, granular
information about who is poor and where they live is available to policymakers. 9 As PER Global MPI 2020 Report, Headcount ratio per World Bank S 1.9 a day was 21.2% in 2011 and national measure was
21.9% in 2011.

14
The Global MPI Reports are providing a more complete picture of who is deprived, how they
are deprived, and where they live. They also capture the significant progress India has made in
reducing multidimensional poverty across the country. Global MPI is also part of Government
of India’s decision to monitor the performance of the country in 29 select Global Indices10 under
the “Global Indices to Drive Reforms and Growth (GIRG)”11 exercise.
b) World Bank Poverty Line
Presently, the World Bank defines extreme poverty as living on less than $1.90 a day, measured
in 2011 purchasing power parity prices12. However, measuring poverty through headcount ratios
fails to capture the intensity of poverty – individuals with consumption levels marginally below
the poverty line are counted as being poor just as individuals with consumption levels much
further below the poverty line. World Bank has developed the ‘poverty gap index’ as an
alternative way of measuring poverty that measures the intensity of poverty, by calculating the
amount of money required by a poor household in order to reach the poverty line. In other words,
it calculates the income or consumption shortfall from the poverty line. The “poverty gap index”
is denied as the mean shortfall in income or consumption from the International Poverty Line
($1.90 a day in 2011 international dollars) counting the non-poor as having zero shortfall,
expressed as a %age of the poverty line13. Poverty gap for India is reported at 4.3% in 2011
down from 20% in 1977, according to the World Bank collection of development indicators,
compiled from officially recognized sources. There is a clear positive correlation between the
incidence of poverty and the intensity of poverty but is far from perfect. For example, India and
Bolivia have relatively similar poverty gaps (mean shortfall is close to 4% of the poverty line),
but they have very different poverty rates (the share of population in poverty in India is 21%,
while in Bolivia it is 7.7%).
c) World Poverty Clock (WPC)
WPC is a systematic analytical framework to measure progress towards SDGs by World Data
Lab14. The World Poverty Clock (WPC) provides real-time poverty estimates until 2030 for
(almost) every country in the world. The World Poverty Clock (WPC) is a global model that
tracks poverty in real time. It uses publicly available data on income distribution, production and
consumption and bridges the common decadal gaps between large-scale surveys and censuses.
According to the WPC, for the last quarter century, the percentage of the world’s population
living below the extreme poverty line has reduced from 36% to 10% in 2015. That represents a
reduction from about 1.9 billion people living in extreme poverty to about 736 million in 2015.
10 NITI Aayog Press Note on Global Multidimensional Poverty Index and India, 7 Sep 2020, PIB Delhi. 11 Its objective is to fulfil the need to measure and monitor India’s performance on various important social and
economic parameters and enable the utilisation of these Indices as tools for self-improvement, bring about reforms
in policies, while improving last-mile implementation of government schemes. 12 Word Bank defines three poverty lines. 1) International Poverty Line set at $1.90/day – which remains the headline poverty
threshold, and continues to define the Bank’s goal of ending global extreme poverty by 2030. 2) Lower middle-income
International Poverty Line, set at $3.20/day; and 3) Upper middle-income International Poverty Line, set at $5.50/day. 13 International dollars are adjusted for inflation over time and for price differences between countries. 14 World Data Lab is an analytical NGO and data refinery enterprise. Its advisory board includes representatives from World
Bank, brooking institution and academia.

15
While much of that progress is attributable to declines in South-East Asia and East Asia,
particularly China, the declines in this decade are due in substantial degree to South Asia,
particularly India. World Poverty Clock shows real-time poverty trends in India, which are based
on the latest data, of the World Bank, among others. As per recent estimates, the country is on
track to ending extreme poverty by meeting its SDGs by 2030. Current poverty level for India is
shown as 4% based on USD 1.9 $ poverty line.
7. CURRENT “LEVEL” OF POVERTY IN INDIA
The last official estimate of Poverty in 2011-12 was released by Planning Commission at
21.92%, which was estimated using Tendulkar Committee approach. After that, no estimates
have been officially released. SDG 2019 Report by Niti Ayog also mentions Tendulkar Poverty
Line of 21.92% adopted in 2011 as the official poverty line. It is interesting to know that Global
MPI Reports 2019 and 2020 show India’s poverty line for 2011-12 as 21.2% ( for the year 2011-
12), based on World Bank’s 1.90$ poverty line for extreme poverty, quite close to Tendulkar
Committee based Poverty line. Some developments in recent years are briefly discussed below:
a) Task Force set up by Niti Ayog
In 2015, Niti Ayog set up a Task Force on Poverty under the then Vice-Chairman, Niti Ayog,
Prof Arvind Panagariya15. The Task Force deliberated the issue of whether a Poverty Line is
required. It was stated that Poverty line and the poverty ratio have three potential uses:
identification of poor; allocation of expenditure on anti-poverty programs across states or
regions; and tracking poverty over time and across regions. In India, identification of poor is
done by the State Governments based on information from Below Poverty Line (BPL) censuses
of which the latest is the Socio-Economic Caste Census 2011 (SECC 2011). Allocation of
expenditures on anti-poverty programs is also done using instruments other than the poverty
ratio. Universal programs such as those under the Mahatma Gandhi National Rural Employment
Guarantee Act (MGNAREGA) and Sarva Shiksha Abhiyan (SSA) are available to all making the
question of allocation moot. Hence, the main objective behind the measurement of poverty is the
need for tracking overall progress in combating poverty over time and space.
Based on the work of the Task force and deliberations with states, the report of the Task Force
was submitted in July, 2016. The task force suggested four options for tracking the poor.
i) Continue with the Tendulkar poverty line;
ii) Switch to the Rangarajan or other higher rural and urban poverty lines;
iii) Track progress of the bottom 30% of the population;
iv) Track progress along specific components of material poverty such as nutrition, housing,
drinking water, sanitation, electricity and connectivity.
It was suggested that options (iii) and (iv) enrich our understanding of the progress in combating
various dimensions of poverty but they do not substitute the poverty ratio approach.
15 Government of India (2016b).

16
Improvements in expenditure levels of various deciles would not tell us precisely what the
incidence of poverty is without specification of a poverty line. Likewise, there is no agreed
approach to aggregating across various dimensions of poverty to arrive at a single indicator of
poverty. The advantage of the level of expenditure as an indicator of poverty is that it is
something we can directly observe and it closely correlates with poverty along different
dimensions. Hence it appears that while there are additional complementary approaches to
tracking poverty, none of them can substitute the poverty line based approach. Without reference
to a poverty line, we cannot determine whether a given household has exited poverty. Tracking
reduction in poverty requires a poverty line.
This leaves to decide between options (i) and (ii) above. Main criticism of the Tendulkar line is
that being rather low, it risks depriving many worthy households from government programmes
by classifying them as above poverty line (APL) households. The counterargument, however, is
that if the objective is to assess whether we are making progress in bringing households out of
extreme poverty, it calls for setting the poverty line at a level that allows households to get two
square meals a day and other basic necessities of life. It is the households below this minimum
acceptable subsistence level whose welfare should concern us the most and whose progress we
must monitor. Put differently, if we set the poverty line at too high a level, we would be tracking
what percentage of population that has already achieved a certain level of comfort has been made
yet further comfortable. It will fail to inform us about the households in abject poverty. Thus,
the sole objective behind the poverty line should be to track progress in combating extreme
poverty and not to identify specific households/individuals as poor for purposes of government
benefits. Hence, it makes more sense to set it at a level just sufficient for accessing the basic
necessities of life. On this ground, the case against the Tendulkar line is weakened. Setting the
poverty line at a level at which the individual has comfortable existence will not allow us to
assess the progress in the fortunes of those in abject poverty. The Task Force, therefore,
recommended that the final decision on this question needs to be informed by further
deliberations by paying adequate attention to the above aspect.
b) Updatation of SECC Data
Issue arises whether Socio Economic Caste Census (SECC) offer an alternative to Poverty line.
SECC allows schemes to be targeted for each of the inclusion criteria or deprivation indicator.
To an extent, SECC data is more robust and in tune with ground reality than the traditional
poverty line, which is based on consumption expenditure of households – Poverty line basket
(PLB). The threshold consumption expenditure is based on a certain assumption of what people
need to meet their basic needs. Since it is normative, it is also subject to debate and controversy.
Secondly, the threshold is also based on household consumption survey on sample basis and not
a census of each and every household, unlike SECC. Thirdly, the SECC data is also extremely
granular, with locality and house number as well as details of family members, occupation, level
of education, kind of house, ownership of selected gadgets, among other things. The SECC is
therefore useful for identifying potential beneficiaries of social programs such as affordable
housing, electricity, water and toilets but not for tracking overall poverty over time. The SECC

17
does not collect information on the overall income or expenditure of the household, which may
suggest whether a family is BPL. Even if we started collecting such information, over time, there
is high risk of household responses getting biased since they know that their responses determine
whether or not they would receive benefits under various social schemes. To maintain the utility
of SECC 2011 data, it requires updating in order to capture consolidated view of benefits
delivered, change in socio-economic status and use of updated data to deliver pro poor public
welfare programmes efficiently. Thus, the multi-dimensional SECC data could be used for
identifying beneficiaries in various schemes, while poverty estimates are relevant for tracking
progress in combating overall poverty.
c) Setting up Social Registry
Social Registry is a dynamic information system on beneficiaries and benefits - to promote
inclusion of intended beneficiaries as well as synergies among welfare programmes. It is being
implemented in many countries- Chile, Brazil and Turkey - forerunners in implementing Social
Registry. Sumit Bose Committee had recommended leveraging the potential of SECC data from
simple database to becoming core of a social registry information system. It was considered that
repeated mounting of standalone SECC would be unnecessary drain on public resources and
could be avoided. It can be used for effective implementation of multiple programmes by using
potential of SECC and Adhar through development of integrated MIS interface with individual
social programmes. In India, Social registry like systems are presently being implemented in
some states such as Samagra in MP and and Bhimashah in Rajasthan.
c) Multidimensional Poverty Index by Niti Ayog
NITI Aayog has constituted a Multidimensional Poverty Index Coordination Committee
(MPICC) with members from relevant Line Ministries and Departments16. Experts from OPHI
and UNDP, as the publishing agency, have also been onboarded for their technical expertise.
Preparation of a MPI Parameter Dashboard to rank States and UTs, and a State Reform Action
Plan (SRAP) are at an advanced stage of development. The exercise is aimed at compelling
states to take aggressive poverty reductions measures by competing with each other. The results
are also expected to feed into the UNDP’s Multidimensional Poverty Index (MPI).
e) Shared Prosperity Goal: Tracking progress of Bottom 30-40%
In addition to the goal of poverty reduction, in 2013, the World Bank Group has adopted the
shared prosperity goal that defines it as growth of real income of the bottom 40 %. It has
strengthened the Bank’s focus on inclusive growth, the bottom income deciles, and the broad
development agenda that includes inequality. India too could consider tracking the improvements
in the average standards of living of the bottom 30% - 40% of the population17 over time as a
complement to Poverty Line /MPI. We could then track progress in combating poverty by
16 Namely Ministry/ Department of Power, WCD, Telecommunication, MoSPI, Rural Devleopment, Petroleum & Natural Gas,
Food & Public Distribution, Drinking Water & Sanitation, Education, Housing & Urban Affairs, Health & Family Welfare, and
Financial Services. Economic Adviser, DoRD has been recently nominated on this group. 17 Defined in terms of per capita income or household consumption as poor.

18
analyzing progress in the average and median real expenditures of the bottom 3 or 4 deciles of
the population over time. This approach reverses the conventional approach. Instead of taking a
threshold level of absolute expenditure as the poverty line and tracking the change in the
proportion of the population below it over time, it takes a fixed proportion of the population at
the bottom to be poor and tracks change in the fortunes of this population over time.
8. FIGHTING EXTREME POVERTY
It is well accepted now globally as well in India that poverty is multi-dimensional and only
through a concerted effort on its various dimensions, a real dent on poverty can be made. Global
evidence indicates that India is on track for the fastest pace of poverty reduction and meeting its
poverty elimination goals by 2030. A two pronged strategy18 is in place to eliminate poverty,
which lies at the core of India's national development agenda. Maintaining an average annual
GDP growth rate of 8 % in real terms is a critical element of the strategy for the creation of
remunerative jobs for new entrants to the labour market as well as those facing redundancy in
agriculture or other sectors. Secondly, targeted programmes19 aim to directly attack various
facets of poverty and help the poor. They facilitate income growth for the economically
disadvantaged by developing agriculture infrastructure and support services, creating productive
assets, and developing skills and entrepreneurship. Social protection measures and mitigation of
risks from natural and other disasters aim to ensure that unforeseen exigencies do not disrupt the
poverty reduction efforts.
Over the last few years, thrust on the poor and deprived households is reflected across a range of
interventions covering food security20, nutrition support21, housing for all with basic amenities,
education for all, universal health coverage, road connectivity, social security, employment,
livelihood diversification, skill development, etc. Pradhan Mantri Jan Dhan Yojana is ensuring
financial inclusion of poor households by providing universal access to banking facilities, access
to credit and insurance cover. Pradhan Mantri Jan Arogya Yojana (PMJAY) popularly known as
Ayushman Bharat Yojana Scheme aims to provide universal health protection to poor and
vulnerable population. Quality homes for the deprived under the PMAY with basic amenities
like LPG, electricity, drinking water, toilet, etc. are helping to bridge the deprivation gap. The
thrust on durable assets that generate incomes (farm ponds, wells, goat shed, cattle shed, housing
support, etc.) through individual beneficiary schemes under the Mahatma Gandhi National Rural
Employment Guarantee Scheme (MGNREGS) for the poor households is a key intervention for
faster poverty reduction. With over 6 crore households mobilized into Self Help Groups under
the DAY-NRLM, the country is witnessing large scale social capital formation across the rural
India. Use of the SECC 2011 data for beneficiary selection along with the use of IT/Direct
Benefit Transfer (DBT), Aadhaar, geo-tagging, and other governance and financial reforms has
transformed the delivery of benefits to the poor. The expansion of all- weather rural roads under
the Pradhan Mantri Gram Sadak Yojana (PMGSY) has strengthened the ability of deprived
18 Niti Ayog and United Nations (2020b). 19 Financed by higher revenues from faster growth. 20 Through National Food Security Act (NFSA), 2013. 21 Through Mid-day Meal Scheme (MDMS).

19
households to leverage markets to their advantage. The poor in India are experiencing
transformational changes in the way they live and access various services through digital means
such as Common Service Centers (CSCs).
9. WAY FORWARD
There are two critical issues in the discourse on poverty in India. One relates to poverty
measurement. Second relates to effective poverty elimination.
Poverty measures compare people in a society, in order to assess the extent of unacceptable
disadvantages that exist. Yet any poverty measure is itself imperfect. Imperfections stem
primarily from two factors: data limitations and the diversity of human lives being assessed more
so in a vast country likes India. Further, perceptions of what defines basic human needs vary
widely according to income, level of development, sociopolitical beliefs and other factors. This
is why views on how the poverty line should be defined vary widely. This makes the choice of a
poverty line difficult. Poverty lines have to be recalibrated depending on changes in income,
consumption patterns and prices. In India, poverty measurement has repeatedly led to
contentious debates on poverty line. Despite these shortcomings, conceptually having a poverty
line22 and related poverty estimates help to concentrate the public policy discourse around an
agreed set of numbers as well as to track the progress in combating poverty.
Over time, priorities have shifted with development in India. Today, aspiring poor seek
betterment in education, health, housing, skills and consumption, and not merely minimum food
and shelter. Therefore, poverty is now not just about basic food to keep body and soul together
but about living standards -sanitation, housing, piped water, electricity, education, health, and
jobs. Poverty line assessment if it were to be done presently cannot be based on minimum
expenditure on subsistence basket as done in the past. Further, the current corona pandemic has
underscored the criticality of certain "essentials" - access to quality healthcare, education and
awareness, water and sanitation facilities, adequate nutrition, and the need for living spaces
where social distancing can be practiced. The World Bank has classified India as a lower
middle-income country and the corresponding poverty line would be PPP $3.2 (2011 prices),
which translates into roughly a consumption level of Rs 75 per person per day. Over time, India
will need to adjust to the new reality of the transition to a lower middle- income country, in
which poverty does not mean living at the edge of hunger but, rather, lack of income to take
advantage of the opportunities thrown up by a growing economy.
Further, deprivations in different areas are positively correlated with one another. It may be
people who lack resources, also lack education, access to sanitation and clean water and
healthcare. These intersections of deprivation also add critically important dimensions to
understanding poverty, and in directing public policy to tackle it. In India, there is also a growing
recognition for the need for a multidimensional approach to move towards the vision of a
22 Most of the existing measures of poverty, viz., Head Count Ratio (HCR), Poverty Gap Index (PGI), Squared Poverty Gap
Index (SPGI), Sen’s Index of Poverty (SPI), FosterGreer-Thorbecke Index (FGTPI) etc., depend on the poverty line.

20
poverty free India. Global MPI is already providing useful information on deprivations in various
areas and at disaggregated level. Current project to develop Multi-dimensional Poverty Index
(MPI) spearheaded by Niti Ayog may be expected to provide poverty indices at national, states
and lowers levels of granularity with focus on multidimensionality. While multidimensional and
income measures of poverty capture different and sometimes divergent information, using them
in a complementary manner may provide a more complete view of poverty and better insights for
policy action.
It is also important to differentiate between chronic poverty and sporadic poverty: the former, a
result of generations of deprivation and the latter, a consequence of a sudden crises or short-term
shock like current Corona pandemic. Studies of poverty have generally focused on the state of
being poor, rather than on the ‘dynamics of poverty’ – movement into and out of poverty, and
the processes and factors that determine this. Why are a large number of people in India
persistently poor? What enables those who are poor to escape from poverty? Why do a large
number of people who are not poor become poor? Studying poverty dynamics to answer these
questions can bring new understanding of poverty and well-being.
Second aspect relates to focus on poverty elimination. Crossing a minimum income or
consumption threshold does not imply that the lack of education or health will not force
households back into poverty. Evidence shows that India is successfully addressing
multidimensional poverty through diverse range of interventions. Alongside the average level of
poverty, some of the important socioeconomic indicators such as literacy, education, and health
have shown considerable improvement. Global MPI reports indicate what has succeeded and
where are the significant gaps for future policy formulation. However, the progress in poverty
reduction and improvement in the socioeconomic indicators in India has been marked by
substantial inequalities. Poverty is concentrated both spatially and among social and economic
groups, and those most vulnerable to poverty include landless labourers, marginal farmers,
socially backward classes and people living in remote areas. Global MPI reports have also
highlighted wide disparities across states, districts and social groups. The two-fold strategy of
enabling the economy grows rapidly (with high employment intensity) on sustained basis and
attacking poverty and address disparities through social welfare programmes remains relevant.
Ministry of Rural Development’s programmes focusing both on alleviating the poverty of
households through MNREGA, NRLM, PMAY, DDUGKY, and the poverty of regions through
PMGSY, SPRM, SAGY are on right track.
The role of rural infrastructure in poverty reduction cannot be overemphasized. Better
infrastructure promotes the shift from low-productivity casual labour in agriculture to more
productive casual work in the nonfarm sector. It is also key to higher wages and assists in
improving literacy rates and school attendance. Thus, the poverty reduction payoffs to higher
investment in rural infrastructure especially in backward poor states are likely to be high.
Mission Antyodaya 2020 findings have comprehensively highlighted the gaps in socio-,
economic infrastructure at the Gram Panchayat level and may be used for interventions that
address Gram Panchayat specific gaps. Markets and value chains for products can diversify

21
rural economies and bring down poverty on an even faster scale. Gains in health, education and
nutrition outcomes can be manifold through communitized approach to participatory
development involving both PRIs and community organizations like the Women SHGs.
At global level also, India’s success in addressing multidimensional poverty is critical for the
realization of the ambitious sustainable development goals (SDGs) that aim to leave no one
behind. As the use of evidence-based policy-making has become widely advocated, it is
important to collect and use accurate data and relevant insights, to drive the design of welfare
programmes as well as ascertain their impact. SECC 2011 has already proved its immense
potential for beneficiaries targeting in several social welfare programmes. It needs to be updated
at the earliest to avoid exclusion and inclusion errors as data tends to become obsolete. A
dynamic Social Registry would be highly useful to attainment of India’s poverty elimination
objectives. It would help policymakers make evidence-based decisions by identifying trends and
intervention hotspots, which mean public resources officials could be directed more effectively.
The more complete picture provided by the MPI would help monitor the effectiveness of poverty
reduction efforts, to understand which components of multidimensional poverty are improving,
and which are not.
10. BIBLIOGRAPHY
Alkire Sabina and Maria Emma Santos (2010). Multidimensional poverty index, Oxford
Poverty and Human Development Initiative, July.
Dandekar V.M. and N. Rath (1971), ‘Poverty in India’, Economic and Political Weekly, Vol. 6,
Nos. 1 & 2, January 9.
Datta, K. (2010). Index of Poverty and Deprivation in Context of Inclusive Growth. Indian
Journal of Human Development, 4 (1), 45-73.
Dev Mahendra S (2005). “Calorie Norms and Poverty”, Economic & Political Weekly, 40(8):
789-92.
Government of India (2016a). ‘Report of the Expert Group on Socio-Economic Caste Survey”, ,
Ministry of Rural Development, New Delhi.
Government of India (2016b). Eliminating Poverty: Creating Jobs and Strengthening Social
Programs, Occasional Paper No. 2, 21. March, NITI Aayog, New Delhi.
Government of India (2014). Report of the Expert Group to Review The Methodology For
Measurement Of Poverty, Planning Commission, New Delhi.
Government of India (2009a). ‘Report of the Expert Group to Review the Methodology for
Estimation of Poverty’, Chaired by S.D. Tendulkar, Planning Commission, New Delhi.

22
Government of India (2009b). ‘Report of the Expert Group to Advise the Ministry of Rural
Development on the Methodology for Conducting the Below Poverty Line (BPL) Census for
11th Five Year Plan’, Ministry of Rural Development, New Delhi.
Government of India (1993). Report of the Expert Group on Estimation of Proportion and
Number of Poor, Planning Commission.
Government of India (1979). Report of the Task Force on Projection of Minimum Needs and
Effective Consumption Demands, Planning Commission, New Delhi.
NITI Aayog (2020a). Press Note on Global Multidimensional Poverty Index and India, 7 SEP.
Report of the Expert Group on SECC
Niti Ayog and United Nations (2020b). SDG India Index and Dashboard 2019-20. New Delhi.
Sharma Savita (2004). “Poverty Estimates in India: Some Key Issues”, ERD Working Paper No
51, Asian Development Bank, Manila.
***