poverty profile of the people's republic of china
TRANSCRIPT
POVERTY PROFILE
of the
PEOPLE’S REPUBLIC OF CHINA
Asian Development Bank
May 2004

(i)
ABBREVIATIONS
ACCYL All-China Communist Youth LeagueABC Agriculture Bank of ChinaACWF All-China Women’s FederationADB Asian Development BankADBC Agriculture Development Bank of ChinaADTA Advisory Technical Assistance provided by the ADBAusAID Australian Agency for International DevelopmentCANGO China Association for NGO CooperationCASS Chinese Academy of Social SciencesCBC Construction Bank of ChinaCCP Chinese Communist PartyCFPA China Foundation for Poverty AlleviationCFamPA China Family Planning AssociationCGAP Consultative Group to Assist the PoorestCICETE China International Center for Economic and Technical ExchangesCIDA Canadian International Development AgencyCNC China National CharitiesCPD China Population DailyCPWF China Population Welfare FoundationDAC Development Assistance Committee of the OECDDFID Department for International Development of the United Kingdom,FFW Food-for-work program (may include cash payments instead of food)FPC Funding of Poor Cooperatives projectsGB Grameen BankGDP gross domestic productGNP gross national productGONGO Government Organized Non-Government OrganizationGTZ German Agency for Technical Co-operationHDI Human Development IndexIBRD International Bank for Reconstruction and DevelopmentICBC Industrial and Commercial Bank of ChinaIFC International Finance CorporationIFPRI International Food Policy Research InstituteINGO International Non-Government OrganizationJICA Japan International Co-operation AgencyLGOP State Council Leading Group Office of Poverty Alleviation and DevelopmentLGP State Council Leading Group of Poverty Alleviation and DevelopmentMCA Ministry of Civil AffairsMDG Millennium Development GoalMII Ministry of Information IndustryMLSS Minimum Living Standard SchemeMOA Ministry of AgricultureMOC Ministry of CommunicationsMOE Ministry of EducationMOF Ministry of FinanceMOFCOM Ministry of CommerceMOPH Ministry of Public HealthMOLSS Ministry of Labor and Social ServicesMOR Ministry of RailwaysMST Ministry of Science and Technology
(ii)
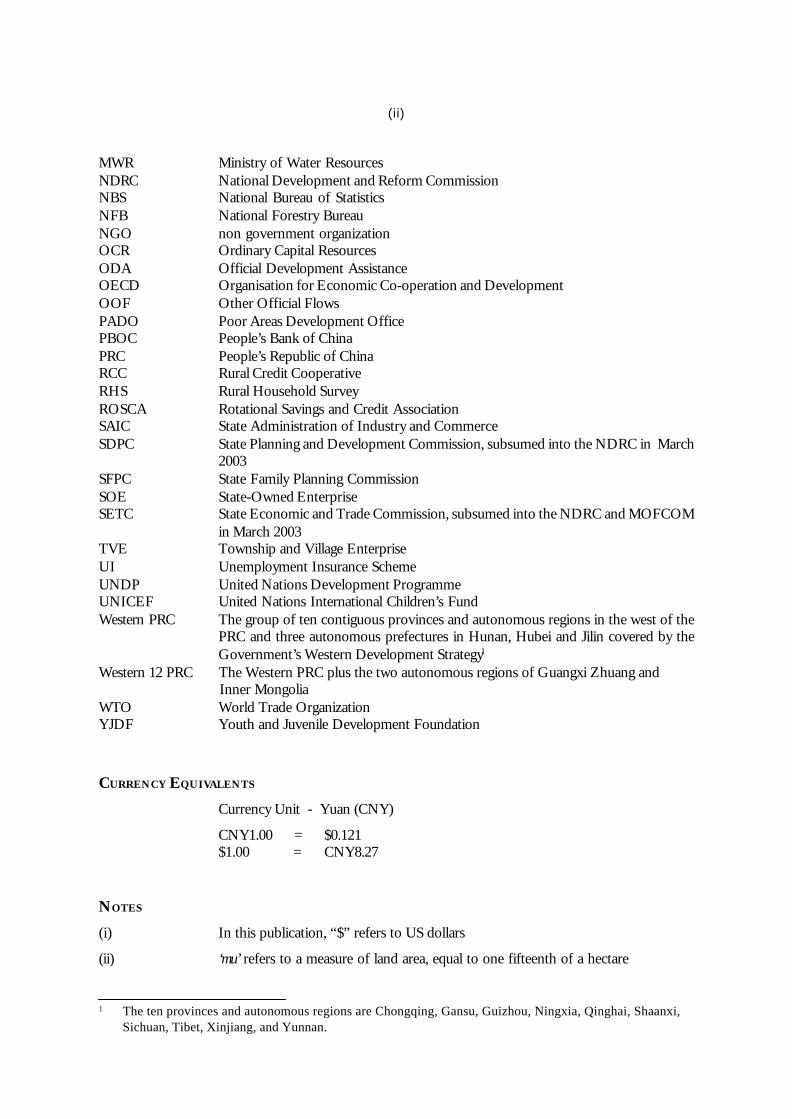
MWR Ministry of Water ResourcesNDRC National Development and Reform CommissionNBS National Bureau of StatisticsNFB National Forestry BureauNGO non government organizationOCR Ordinary Capital ResourcesODA Official Development AssistanceOECD Organisation for Economic Co-operation and DevelopmentOOF Other Official FlowsPADO Poor Areas Development OfficePBOC People’s Bank of ChinaPRC People’s Republic of ChinaRCC Rural Credit CooperativeRHS Rural Household SurveyROSCA Rotational Savings and Credit AssociationSAIC State Administration of Industry and CommerceSDPC State Planning and Development Commission, subsumed into the NDRC in March
2003SFPC State Family Planning CommissionSOE State-Owned EnterpriseSETC State Economic and Trade Commission, subsumed into the NDRC and MOFCOM
in March 2003TVE Township and Village EnterpriseUI Unemployment Insurance SchemeUNDP United Nations Development ProgrammeUNICEF United Nations International Children’s FundWestern PRC The group of ten contiguous provinces and autonomous regions in the west of the
PRC and three autonomous prefectures in Hunan, Hubei and Jilin covered by theGovernment’s Western Development Strategy1
Western 12 PRC The Western PRC plus the two autonomous regions of Guangxi Zhuang and Inner Mongolia
WTO World Trade OrganizationYJDF Youth and Juvenile Development Foundation
CURRENCY EQUIVALENTS
Currency Unit - Yuan (CNY)
CNY1.00 = $0.121$1.00 = CNY8.27
NOTES
(i) In this publication, “$” refers to US dollars
(ii) ‘mu’ refers to a measure of land area, equal to one fifteenth of a hectare
1 The ten provinces and autonomous regions are Chongqing, Gansu, Guizhou, Ningxia, Qinghai, Shaanxi,Sichuan, Tibet, Xinjiang, and Yunnan.
(iii)
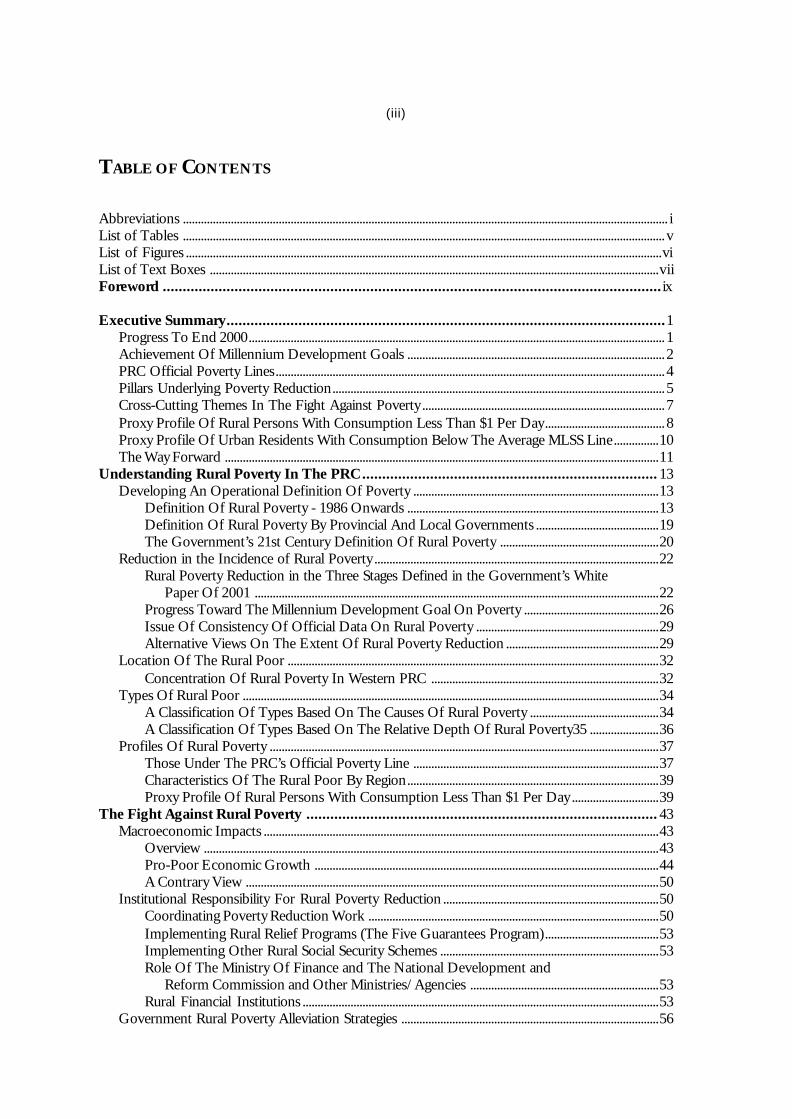
TABLE OF CONTENTS
Abbreviations .................................................................................................................................................................. iList of Tables ................................................................................................................................................................. vList of Figures ...............................................................................................................................................................viList of Text Boxes ......................................................................................................................................................viiForeword ............................................................................................................................. ix
Executive Summary..............................................................................................................1Progress To End 2000........................................................................................................................................... 1Achievement Of Millennium Development Goals ...................................................................................... 2PRC Official Poverty Lines.................................................................................................................................. 4Pillars Underlying Poverty Reduction............................................................................................................... 5Cross-Cutting Themes In The Fight Against Poverty ................................................................................. 7Proxy Profile Of Rural Persons With Consumption Less Than $1 Per Day........................................ 8Proxy Profile Of Urban Residents With Consumption Below The Average MLSS Line...............10The Way Forward .................................................................................................................................................11
Understanding Rural Poverty In The PRC .......................................................................... 13Developing An Operational Definition Of Poverty ..................................................................................13
Definition Of Rural Poverty - 1986 Onwards ....................................................................................13Definition Of Rural Poverty By Provincial And Local Governments .........................................19The Government’s 21st Century Definition Of Rural Poverty .....................................................20
Reduction in the Incidence of Rural Poverty ...............................................................................................22Rural Poverty Reduction in the Three Stages Defined in the Government’s White
Paper Of 2001 .......................................................................................................................................22Progress Toward The Millennium Development Goal On Poverty .............................................26Issue Of Consistency Of Official Data On Rural Poverty .............................................................29Alternative Views On The Extent Of Rural Poverty Reduction ...................................................29
Location Of The Rural Poor ............................................................................................................................32Concentration Of Rural Poverty In Western PRC ............................................................................32
Types Of Rural Poor ...........................................................................................................................................34A Classification Of Types Based On The Causes Of Rural Poverty ...........................................34A Classification Of Types Based On The Relative Depth Of Rural Poverty35 .......................36
Profiles Of Rural Poverty ..................................................................................................................................37Those Under The PRC’s Official Poverty Line ..................................................................................37Characteristics Of The Rural Poor By Region....................................................................................39Proxy Profile Of Rural Persons With Consumption Less Than $1 Per Day .............................39
The Fight Against Rural Poverty ........................................................................................ 43Macroeconomic Impacts ....................................................................................................................................43
Overview ........................................................................................................................................................43Pro-Poor Economic Growth ...................................................................................................................44A Contrary View ..........................................................................................................................................50
Institutional Responsibility For Rural Poverty Reduction ........................................................................50Coordinating Poverty Reduction Work .................................................................................................50Implementing Rural Relief Programs (The Five Guarantees Program)......................................53Implementing Other Rural Social Security Schemes .........................................................................53Role Of The Ministry Of Finance and The National Development and
Reform Commission and Other Ministries/Agencies ...............................................................53Rural Financial Institutions .......................................................................................................................53
Government Rural Poverty Alleviation Strategies ......................................................................................56

(iv)
Government Poverty Alleviation ............................................................................................................56The Government’s 2001-2005 Targets And Strategies For Poverty Reduction .................................67Civil Society-Based Poverty Reduction ..........................................................................................................69
Informal Networks .....................................................................................................................................70Private Sector Support For Poverty Reduction...................................................................................70NGO-Supported Activities .......................................................................................................................71Research Institutes ......................................................................................................................................75International NGOs ...................................................................................................................................76
Assistance From International Donors..........................................................................................................77Asian Development Bank .........................................................................................................................78World Bank ....................................................................................................................................................79United Nations Development Programme (UNDP) ........................................................................80Other UN And Regional Agencies .........................................................................................................81Bilateral Donor Assistance ........................................................................................................................81
Rising Total Cost Per Unit Of Rural Poverty Reduction..........................................................................83Understanding Urban Poverty ............................................................................................ 85
Urban Poverty As A Recently Perceived Problem ......................................................................................85Defining The Urban Poor ..................................................................................................................................85Trends In The Incidence Of Urban Poverty ..............................................................................................88Numbers And Location Of The Urban Poor .............................................................................................90
The Floating Migrant Population And Poverty ..................................................................................92Types Of Urban Poor .........................................................................................................................................94Profiles Of Urban Poverty ................................................................................................................................94
The Fight Against Urban Poverty ....................................................................................... 97Macroeconomic Background ............................................................................................................................97
Structural Unemployment As A Cause Of Urban Poverty .............................................................97General Overview ..................................................................................................................................... 100
Institutional Responsibility For Urban Poverty ........................................................................................ 102The Responsibilities Of The Cities ..................................................................................................... 102Ministry Of Civil Affairs ........................................................................................................................ 102Ministry Of Labor And Social Security ............................................................................................. 103
Urban Poverty Alleviation Mechanisms...................................................................................................... 103Funding For Urban Poverty Reduction.............................................................................................. 104
Civil Society-Based Programs For Poverty Alleviation........................................................................... 105Assistance From International Donors....................................................................................................... 106
Vulnerable Groups In Rural And Urban Areas .................................................................. 109Women And Girls ............................................................................................................................................. 109Minority Nationalities....................................................................................................................................... 112The Disabled Poor ............................................................................................................................................ 112
Conclusions and Recommendations ................................................................................. 1152000 – Before And After................................................................................................................................. 115Pillars Underlying Poverty Reduction.......................................................................................................... 116Cross-Cutting Themes In The Fight Against Poverty ............................................................................ 118The Way Forward .............................................................................................................................................. 119
Appendixes ....................................................................................................................... 121Appendix 1: Regional Characteristics From Year 2000 NBS Rural Household Survey ................ 121Appendix 2: Detailed Profile Of Urban Residents With Per Capita Annual
Consumption Expenditure Less Than 2,310 Yuan And Urban Non-PoorWith Annual Expenditure Greater Than 2,310 Yuan..................................................... 127
Appendix 3: ADB Activities In Poverty Reduction In The PRC ........................................................ 131Bibliography ..................................................................................................................... 139Index ................................................................................................................................ 145
(v)
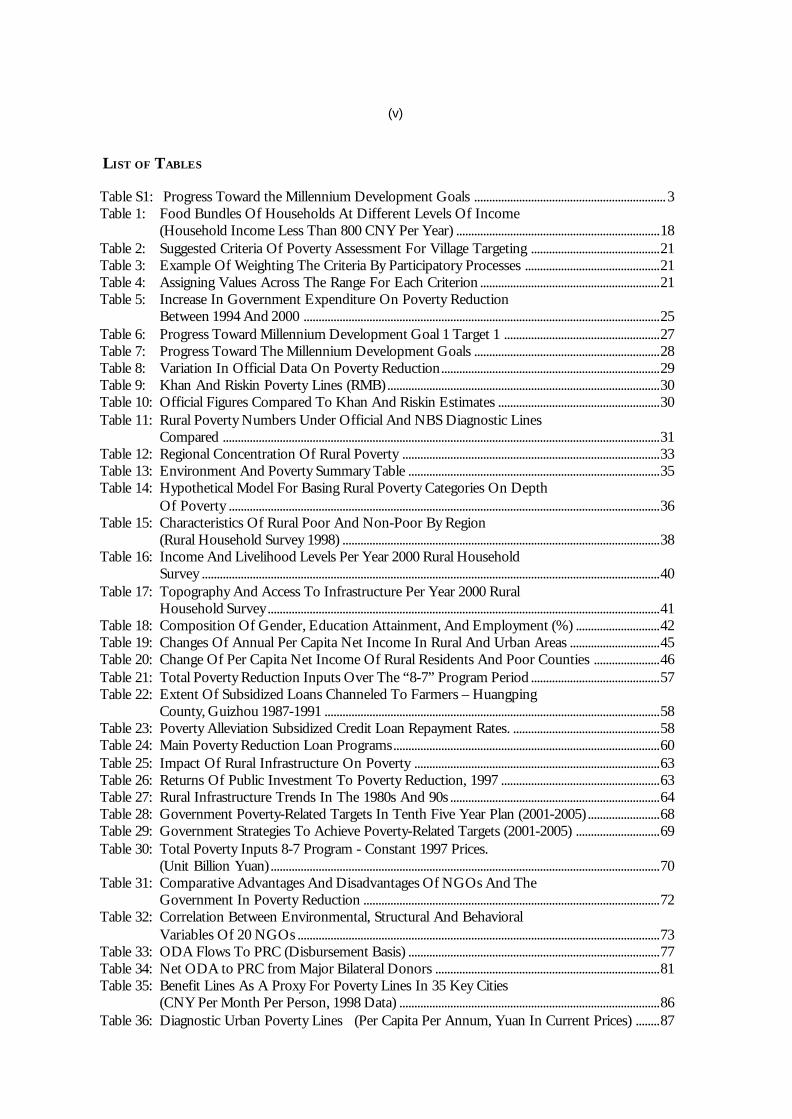
LIST OF TABLES
Table S1: Progress Toward the Millennium Development Goals ................................................................ 3Table 1: Food Bundles Of Households At Different Levels Of Income
(Household Income Less Than 800 CNY Per Year) ....................................................................18Table 2: Suggested Criteria Of Poverty Assessment For Village Targeting ...........................................21Table 3: Example Of Weighting The Criteria By Participatory Processes .............................................21Table 4: Assigning Values Across The Range For Each Criterion ............................................................21Table 5: Increase In Government Expenditure On Poverty Reduction
Between 1994 And 2000 .......................................................................................................................25Table 6: Progress Toward Millennium Development Goal 1 Target 1 ....................................................27Table 7: Progress Toward The Millennium Development Goals ..............................................................28Table 8: Variation In Official Data On Poverty Reduction.........................................................................29Table 9: Khan And Riskin Poverty Lines (RMB) ...........................................................................................30Table 10: Official Figures Compared To Khan And Riskin Estimates ......................................................30Table 11: Rural Poverty Numbers Under Official And NBS Diagnostic Lines
Compared ..................................................................................................................................................31Table 12: Regional Concentration Of Rural Poverty ......................................................................................33Table 13: Environment And Poverty Summary Table ....................................................................................35Table 14: Hypothetical Model For Basing Rural Poverty Categories On Depth
Of Poverty ................................................................................................................................................36Table 15: Characteristics Of Rural Poor And Non-Poor By Region
(Rural Household Survey 1998) ..........................................................................................................38Table 16: Income And Livelihood Levels Per Year 2000 Rural Household
Survey .........................................................................................................................................................40Table 17: Topography And Access To Infrastructure Per Year 2000 Rural
Household Survey ...................................................................................................................................41Table 18: Composition Of Gender, Education Attainment, And Employment (%) ............................42Table 19: Changes Of Annual Per Capita Net Income In Rural And Urban Areas ..............................45Table 20: Change Of Per Capita Net Income Of Rural Residents And Poor Counties ......................46Table 21: Total Poverty Reduction Inputs Over The “8-7” Program Period ...........................................57Table 22: Extent Of Subsidized Loans Channeled To Farmers – Huangping
County, Guizhou 1987-1991 ................................................................................................................58Table 23: Poverty Alleviation Subsidized Credit Loan Repayment Rates. .................................................58Table 24: Main Poverty Reduction Loan Programs.........................................................................................60Table 25: Impact Of Rural Infrastructure On Poverty ..................................................................................63Table 26: Returns Of Public Investment To Poverty Reduction, 1997 .....................................................63Table 27: Rural Infrastructure Trends In The 1980s And 90s ......................................................................64Table 28: Government Poverty-Related Targets In Tenth Five Year Plan (2001-2005) ........................68Table 29: Government Strategies To Achieve Poverty-Related Targets (2001-2005) ............................69Table 30: Total Poverty Inputs 8-7 Program - Constant 1997 Prices.
(Unit Billion Yuan) ..................................................................................................................................70Table 31: Comparative Advantages And Disadvantages Of NGOs And The
Government In Poverty Reduction ...................................................................................................72Table 32: Correlation Between Environmental, Structural And Behavioral
Variables Of 20 NGOs .........................................................................................................................73Table 33: ODA Flows To PRC (Disbursement Basis) ....................................................................................77Table 34: Net ODA to PRC from Major Bilateral Donors ...........................................................................81Table 35: Benefit Lines As A Proxy For Poverty Lines In 35 Key Cities
(CNY Per Month Per Person, 1998 Data) .......................................................................................86Table 36: Diagnostic Urban Poverty Lines (Per Capita Per Annum, Yuan In Current Prices) ........87
(vi)
Table 37: Urban Poverty Trend As Compiled By NBS ..................................................................................89Table 38: Urban Poverty Rates...............................................................................................................................89Table 39: Urban Poverty Patterns, 1998, As Per Analysis Of Professor A Hussain
and Others.................................................................................................................................................91Table 40: Sensitivity Of The Urban Poverty Rate............................................................................................92Table 41: Comparative Urban Poverty Rates - Migrants And Locals 1999 ..............................................93Table 42: Labor Market Trends 1995-2001 ........................................................................................................98Table 43: Distribution Of Urban Employment By Ownership 1994-2001..............................................98Table 44: Urban Income Distribution Pattern 1995 ..................................................................................... 101Table 45: Output Elasticity Of Employment In Urban Industries, 1988-1995 ................................... 101Table 46: Year-On-Year Change In Urban Employment (%) .................................................................... 101Table 47: Distribution By Gender Of Educational Levels Of Migrant Workers In
The Pearl River Delta Triangle (%) ................................................................................................. 110
LIST OF FIGURES
Figure S1 Rural Poverty Reduction ......................................................................................................................... 1Figure S2 Recent Rural Poverty Numbers............................................................................................................. 5Figure S3 Pace of Rural Poverty Reduction ......................................................................................................... 5Figure S4 Cost per Rural Person Freed from Poverty ....................................................................................... 8Figure S5 Rural Education Levels Achieved ......................................................................................................... 9Figure S6 Urban Education Levels Achieved .....................................................................................................10Figure 1 Three Stages of Poverty Reduction ...................................................................................................22Figure 2 Reduction per Annum per Stage.........................................................................................................23Figure 3 Second Stage Annual Reduction in Rural Poverty .........................................................................24Figure 4 Third Stage Annual Reduction in Poverty .......................................................................................25Figure 5 Distribution of Rural Poor by County Type ...................................................................................26Figure 6 Pace of Rural Poverty Reduction by County Type........................................................................26Figure 7 1999 National Poverty Counties – Rural Net Income Distribution.........................................31Figure 8 Indicators of Regional Disparity ........................................................................................................32Figure 9 Poverty Reduction Rates by Region...................................................................................................34Figure 10 Income Composition of the Poor .....................................................................................................37Figure 11 National Average Rural Income Composition for 2001 ..............................................................39Figure 12 Education Attainment ...........................................................................................................................42Figure 13 Annual GDP Growth by Sector (1995-2002) .................................................................................44Figure 14 Rural and Urban Per Capita Income Growth .................................................................................44Figure 15 Rural and Urban Population Income Changes ...............................................................................45Figure 16 Annual Change Rates of Rural Poverty Reduction and Rural Income
Compared ..................................................................................................................................................45Figure 17 Rural and Urban Income Distribution..............................................................................................47Figure 18 Decomposition of Income Inequality in Terms of the Gini Co-efficient .............................47Figure 19 Institutional Framework for Poverty Reduction Policy-Making and
Program Implementation......................................................................................................................51Figure 20 Composition of the LGP .....................................................................................................................52Figure 21 Government Poverty Alleviation Funding .......................................................................................57Figure 22 Government Poverty Funding Composition ..................................................................................59Figure 23 Trends in Government Poverty Funding and Poverty Reduction ............................................67Figure 24 Government Cost per Rural Person Freed from Poverty ...........................................................67Figure 25 Composition of Rural Poverty Reduction Expenditure ..............................................................69Figure 26 Trends in Total Poverty Funding and Poverty Reduction ...........................................................83Figure 27 Cost per Rural Person Freed from Poverty .....................................................................................83

(vii)
Figure 28 1988 and 1995 Urban Poverty Rates .................................................................................................88Figure 29 Regional Variation in Urban Poverty Reduction ............................................................................90Figure 30 Urban and Rural Poverty Reduction trends.....................................................................................90Figure 31 Regional Distribution of Urban and Rural Poor ...........................................................................92Figure 32 Education Levels of Poor and Non-Poor .......................................................................................94Figure 33 Estimated Distribution of Urban Employment by Sector .........................................................99Figure 34 Minimum Living Standard Scheme Trends .................................................................................. 104Figure 35 Gender Comparison of Higher Education Levels Achieved by
Working-Age Farmers ......................................................................................................................... 109Figure 36 Cost per Rural Person Freed from Poverty .................................................................................. 115Figure 37 Pace of Rural Poverty Reduction by County ............................................................................... 116
LIST OF TEXT BOXES
Box 1 Technical Calculation of Poverty Line by NBS ..............................................................................16Box 2 Rural Poverty Definitions Applied by Local Governments in Shaanxi
Province in 1998 ......................................................................................................................................19Box 3 The Roles of Ministries and Government Agencies in Poverty Reduction...........................54Box 4 Institutional Issues of Trickle Down and Regional Development ...........................................58Box 5 Explanation of the “Funding of Poor Cooperatives” Projects.................................................61Box 6 Poverty Alleviation Office Microcredit Experiments ...................................................................62Box 7 Globalization and Increasing Unemployment in the Textile Industry ....................................97Box 8 Public-Private Sector Initiatives to Combat Urban Poverty: The Case
of Shanxi ................................................................................................................................................ 105


(ix)
FOREWORDPoverty Profile of the People’s Republic of China discusses thecharacteristics of poverty and the history of the fightagainst it in the People’s Republic of China (PRC) from1978 to current times. Exciting developments have takenplace in diagnosing, measuring and reducing poverty, butthese have been largely the preserve of a narrow band ofprofessionals – specialized public servants, aidpractitioners, economists, statisticians and sociologists.This is a background reader aimed at spreading thisknowledge to a wider audience with varied interests andoccupational skills. The increased awareness of povertyand its dynamics that this Profile offers can serve asadditional filter for decision makers whose actions add tothe economic and social development and foster pro-poorgrowth in the PRC.
As a compendium on PRC poverty, this Profile has drawnon a wide range of information sources. The informationhas come mainly from donor agency publications (AsianDevelopment Bank (ADB), World Bank, United NationsDevelopment Programme, International Food PolicyResearch Institute, Department for InternationalDevelopment of the United Kingdom, the NetherlandsMinistry of Foreign Affairs and others), PRC agencies(notably the National Bureau of Statistics, the StateCouncil Leading Group Office of Poverty Alleviation andDevelopment and the China Foundation for PovertyAlleviation), and academics. In addition to internationalacademics, the Profile has benefited from the growingnumber of research publications written by PRCnationals. Particular mention should be made of thePoverty Monitoring Report of Rural China produced annuallyby the National Bureau of Statistics.
The Profile was compiled during a dynamic period ofdomestic policy development in the PRC under which theleadership placed more emphasis on fighting poverty andextended the official view of poverty to the urban poor.
Unquestionably, as soon as this Profile is published therewill be more to add, both in terms of detail but also interms of fundamental analysis.
This Profile has benefited extensively from initial draftingand periodic commenting from a range of ADB staff.Advice from the ADB’s Economics and ResearchDepartment helped to fine tune the coverage of povertylines and its Policy Briefs informed the discussion on thecausal relationship between types of public sectorinvestment and poverty reduction.
David Sobel, Senior Country Programs Specialist at theADB’s Resident Mission in the PRC, took responsibilityfor authoring substantive parts of the initial drafts and forthe overall management of the development of the finalversion of this Profile. He provided hands-on guidanceand editorial comment under the direction of BruceMurray, ADB Country Director for the PRC.
The ADB’s consultant, Tony Voutas, and his supportstaff at Asia Pacific Access, Beijing, undertook the corework in finalizing this publication.
Although the Profile was the result of an extensiveparticipatory effort, it should be noted that the viewsreflected within this publication do not necessarily reflectthose of the Asian Development Bank.


Executive Summary 1
EXECUTIVE SUMMARY
The new millennium has become a turning point in the People’sRepublic of China (PRC)’s war on poverty. Prior to this:
(i) spectacular progress had been made in reducingabsolute rural poverty levels to one eighth of whatthey were in 1978 when the economic reformprocess commenced – nearly all people haveenough to eat and some clothing;
(ii) urban poverty had become a serious problem,whereas previously poverty was a rural issue;
(iii) the inequitable distribution of the benefits ofrapid economic growth has contributed to theincidence of rural poverty being higher in thecentral and western regions than along the eastcoast;
(iv) poverty had been perceived largely as “income”poverty;
(v) the ongoing poverty reduction effort wasexperiencing the law of diminishing returns – it wasbecoming progressively more difficult to addressabsolute poverty;
(vi) philanthropic resources from non-governmentorganizations (NGOs), commercial enterprises,communities and individuals had been mobilized tocomplement and accelerate the Government’sefforts to reduce poverty.
Looking beyond this point into the first 10 years of the 21st century,the PRC has:
(i) recognized that poverty is a multidimensionalconcept;
(ii) accepted that for rural poverty the voices of thepoor must be listened to through a participatoryprocess by which village development plans will beprepared and monitored and NGOs will bemobilized to complement the Government’spoverty reduction efforts;
(iii) decided that those officials responsible for areadevelopment plans have to make a paradigm shiftso that village development plans coming frombelow are integrated into the planning process thatthey manage;
(iv) demonstrated a commitment to develop theWestern region where most of the rural poor liveby investing heavily in infrastructure, addressing
environmental problems and encouraging businessinvestment in the region;
(v) chosen to put more effort into retraining and re-employing many people who have lost their jobsthrough state owned enterprise (SOE) restructuring;
(vi) decided to progressively allow the floatingpopulations of cities to access urban socialdevelopment services which were previouslyrestricted to registered urban residents;
(vii) expanded the Minimum Living Standard Guaranteeto provide support to many more urban poor; and
(viii) considered and is currently pilot testing how socialwelfare schemes administered at city level can beimproved and made financially self-sustaining.
PROGRESS TO END 2000No matter which indicative measure of poverty is used,the PRC has made remarkable progress in reducing ruralpoverty. Three trend lines are used in Figure S1 to illustratethis progress from the mid 1980s through to the end ofthe century, although the PRC’s fight against povertystarted well before 1986. The lower line records thedecline in the numbers of rural poor using the ratheraustere official rural poverty line (625 yuan net income percapita per annum in year 2000 prices). The middle linerecords poverty numbers using $1 a day income at 1993purchasing power parity (PPP) values as per the WorldBank’s estimate of the yuan PPP equivalence (879 yuannet income per capita per annum in year 2002 prices).
Source: For $1 a day, Country Assistance Strategy for PRC: World Bank,December 2002; and for Official numbers, Poverty Monitoring Report of RuralChina 2002: NBS December 2002.
Figure S1: Rural Poverty Reduction
0
50
100
150
200
250
300
350
400
1986 1988 1990 1992 1994 1996 1998 2000
Ru
ral P
oo
r (m
illio
n)
Official number ofrural poor withincome of lessthan $0.67/day
Number of ruralpoor withconsumption ofless than $1/day
Number of ruralpoor with incomeof less than$1/day

2 Poverty Profile of the People’s Republic of China
The poor have compelling reasons not to consume alltheir income, sparing some for maintenance orreplacement of their few tools of production, social andpast financial obligations and catastrophes. Thusconsumption rather than income is often seen as a bettermetric for poverty. The top line in Figure S1 captures allthose rural people who have not been able to achieve $1per day consumption (1993 PPP equivalence). While theoverall trend of the top line is down, reduction in thenumbers stalled from 1996 onwards to 1999 (being thelast year for which an estimate is currently available).
The PRC is not making the same progress with urbanpoverty, however. Government figures on urban povertytrends before the 1990s are not readily available. Usingone measure of urban poverty - the National Bureau ofStatistics (NBS) diagnostic line which was 1,875 yuanincome per capita per annum in 2000 prices - the numberof poor holding official urban residency status over the1991 to 2000 period has oscillated between 15.3 and 10million. Such oscillations would have in large part beendriven by the pattern of lay-offs from SOEs as the publicsector underwent structural reform.Actual urban poverty is higher than these figures whenfloating populations are included, as urban migrants aretwice as likely to be poor as official urban residents.
ACHIEVEMENT OF MILLENNIUMDEVELOPMENT GOALSThe Millennium Summit in September 2000 was a majormilestone in the global fight against poverty. Not onlydid member states of the United Nations reaffirm theircommitment to tackle poverty globally but they agreedon an unambiguous set of goals and targets, the pursuitof which within developing countries with developedcountry assistance, would make a massive step towardeliminating poverty and achieving sustainabledevelopment. Of particular note was that participants atthe Summit were able to agree to metrics for assessingprogress towards each of the goals. With one exception,all metrics were benchmarked against the situationpertaining to 1990.
By 2002, the PRC had performed well against most ofthe Millennium Development Goals (MDG). This can beseen from Table S1.Looking at the first goal and taking both rural and urbanpoverty reduction together, the PRC has the distinctionof already achieving Target 1 of the MDGs. That goalis to halve, between 1990 and 2015, the proportionof people whose income is less than $1 a day. While
debate and research continue on the appropriateconversion of a dollar at purchasing power parity (PPP)into the PRC currency, the World Bank’s most recentcalculation equates a dollar a day to 879 yuan in 2002prices taking into account the 2002 rural price index. Onthis basis, the PRC reached this target in the mid 1990’s.Poverty reduction has continued so that by 2000, theproportion of rural poor with less than a dollar a dayincome was cut to one third of the level in 1990.While there were good reasons for setting a simple targetfor worldwide compliance, the simplification means thatthe $1 a day measure is applied to both rural and urbanpoor. Yet most studies on poverty in the PRC find thaturban poverty line is from 2-3 times more than the ruralpoverty line. Thus it can be expected that only a minorityof the urban poor will be on net incomes below a dollara day. The $1 measure is 60% less austere than the PRC’sofficial rural poverty line and 47% more austere than theNBS’s diagnostic urban poverty line. It thus understatesurban poverty. Furthermore, the $1 a day concept wasdeveloped to have a working definition by which tocompare poverty levels between countries rather thanmeasuring poverty within a single country.Looking at the other MDGs, compared to 1990 the PRCis at least half way to removing its gender disparity inprimary education. By 2001, the PRC was movingsteadily towards two health-related goals - the under-fivemortality rate had been reduced by one quarter and thematernal mortality rate by over a half.Nonetheless there are some goals and targets whereprogress has been slow. This has been the case incombating HIV/AIDS, eliminating gender disparity insecondary education, improving the proportion of thepopulation with access to safe drinking water andreversing environmental degradation.The commendable progress towards achieving theMDGs has in no way reduced the PRC’s resolve toeradicate poverty. The PRC’s new leadership underPresident Hu Jintao and Premier Wen Jiabao hasreaffirmed the Government’s priority concern withreducing poverty and reiterated that 2010 is the deadlinefor eradicating extreme rural poverty. A silent revolutionis occurring in the way poverty is being tackled. Topdown planning of poverty programs are being replacedby highly participatory processes involving the poorthemselves and those that service the poor at local levels.It is now accepted that the poor are best placed to definepoverty and their needs to redress poverty. The principleof listening to the voices of the poor has become policy.

Executive Summary 3
Table S1: Progress Toward the Millennium Development Goals
a World Bank. 2003. China Country Assistance Strategy 2003-2005. Washington, DC.b UNDP. 2003. Human Development Report 2003. New York, data are preliminary and subject to revision.Source: UNDP. 2003. Human Development Report 2003. New York.
Goals and Targets Status in the PRCGoal 1: Eradicate Extreme Poverty and HungerTarget 1: Halve, between 1990 and 2015, the proportion of peoplewhose income is less than one dollar a day.
• Rural population below $1 per day: 31.3% in 1990; xxx11.5% in 2000a
Target 2: Halve, between 1990 and 2015, the proportion of people whosuffer from hunger.
• Undernourished people: 16.0% in 1990; 9.0% in 2000
Goal 2: Achieve Universal Primary EducationTarget 3: by 2015, children everywhere, boys and girls alike, will be ableto complete a full course of primary schooling.
• Net primary enrolment ratio: 97.0% in 1990; 93.0% inxxx2001b• Youth literacy rate: 95.3% in 1990; 97.9% in 2001
Goal 3: Promote Gender Equality and Empower WomenTarget 4: Eliminate gender disparity in primary and secondary educationpreferably by 2005 and to all levels of education no later than 2015.
• Ratio of girls to boys in primary education: 86% inxxx1990; 92% in 2001• Ratio of girls to boys in secondary education: 83% inxxx2001
Goal 4: Reduce Child MortalityTarget 5: Reduce by two-thirds, between 1990 and 2015, the under-fivemortality rate.
• Under-5 mortality rate (per 1,000 live births): 49 inxxx1990; 39 in 2001• Infant mortality rate (per 1,000 live births): 38 in 1990;xxx31 in 2001
Goal 5: Improve Maternal HealthTarget 6: Reduce the maternal mortality ratio by three-quarters between1990 and 2015.
• Maternal mortality (per 100,000 live births): 88.9 inxxx1990; 39 in 2001.• Proportion of births attended by skilled health workersxxxin hospital births: 50.6% in 1990; 89.0% in 2001
Goal 6: Combat HIV/AIDS, Malaria, and Other DiseasesTarget 7: Have halted by 2015, and begun to reverse, the spread ofHIV/AIDS.Target 8: Have halted by 2015, and begun to reverse, the incidence ofmalaria and other major diseases.
• HIV/AIDS incidence rate (age 15-49) as of 2001 isxxx0.11%, around 790,000 cases• Malaria (per 100,000 people): 1 in 2000• Tuberculosis (per 100,000 people): 107 in 2001
Goal 7: Ensure Environmental SustainabilityTarget 9: Integrate the principles of sustainable development intocountry policies and programs and reverse the loss of environmentalresources.
• Land covered by forest: 15.6% in 1990; 17.5% in 2001• Carbon dioxide emissions (per capita): 2.1 tons inxxx1990; 2.3 tons in 1999
Target 10: Halve, by 2015, the proportion of people without sustainableaccess to safe drinking water.
• Rural population with clean water source: 60% inxxx1990; 66% in 2000• Urban population with clean water source: 99% inxxx1990; 94% in 2000
Target 11: Have achieved, by 2020, a significant improvement in thelives of at least 100 million slum dwellers
• Urban population with access to improved sanitation:xxx56% in 1990; 69% in 2000
Goal 8: Develop a global partnership for developmentTarget 12: Deal comprehensively with the debt problems of developingcountries through national and international measures
• Total debt service (as % of exports of goods andxxxservices):10.6% in 1990; 4.2% in 2001
Target 13: Provide access to affordable essential drugs in developingcountries
• Population with sustainable access to affordablexxxessential drugs: 80-94% in 1999
Target 14: Make available the benefits of new technologies, especiallyinformation and communications
• Telephone mainlines and cellular subscribers (per 100xxxpeople): 0.6 in 1990; 24.8 in 2001

4 Poverty Profile of the People’s Republic of China
PRC OFFICIAL POVERTY LINESThe meaning of “rural poverty” has evolved. In the 1980sand 1990s, the PRC highlighted income poverty. As thePRC enters the 21 st century, this definition is beingexpanded to include non-income forms of poverty and toallow villagers themselves to define who are the poorhouseholds in their midst. This expansion, approvedofficially after a State Council Leading Group Office ofPoverty Alleviation and Development (LGOP) led studysupported by the ADB, includes infrastructure factors(deprivation of access to transportation, drinking waterand electricity) and health and education factors (lowlevels of women’s health and deprivation of education forgirls). This new definition will be used to target thegovernment’s specific poverty reduction programs at poorvillages and poor households. For practical administrativereasons, however, the PRC will probably continue to useincome poverty as its indicator of the total number ofpoor people.
Income poverty was clearly defined by the Governmentfirst in the mid-1980s, and more scientifically redefined in1993. It was defined based on the cost of a basic minimumsubsistence package of food plus a proportionate amountfor essential non-food items. Annual adjustments weremade using changes in the national rural retail price index.
Depending on the country, people are classified as poor ifeither their annual per capita net income or their annualper capita consumption expenditure is below the officialpoverty line. These two measures are not the same withthe latter being higher than the former. This is because thepoor, like everyone else, need a margin above their basicsustenance consumption to repay debt, save againstlivelihood shocks, invest to ensure continued householdproduction and cover social obligations.
The PRC uses the income per head measure, which ismore austere than the consumption expenditure per headapproach. In 2002 prices, the official rural poverty line was627 yuan annual net income per capita. Using this povertyline, the number of rural poor was officially estimated as28.2 million in 2002, or about 3% of the rural population.This is a very low poverty line compared to internationalpractice and only represents a basic level of survival.
In 2000, a research paper published in the official Journalof China Statistics indicated that the minimum per capitaexpenditure needed to assure basic consumption of ruralpeople under current prices and living styles was 860 yuanper annum. This research led to a re-think within NBSand other relevant government agencies. The result hasbeen that since 2002 official statements about povertyhave not only referred to the absolute poor (the 28.2
million in 2002) but also to “low income” rural dwellers.
Such statements include this new category as beneficiariesin the fight to eradicate absolute poverty by 2010. TheNBS definition of this category, in terms of the per capitaincome per annum in 2002 prices of the rural populationis those below 869 yuan but above 627 yuan – the absolutepoverty line.
The official count of rural people in the low incomespectrum in 2002 is 60 million or 6.2% of the total ruralpopulation. Thus the combined total of absolute ruralpoor and low income rural dwellers in 2002 was 88.2million representing 9.2% of the rural population.
The official 869 yuan benchmark distinguishing the rurallow income and poor people from the rest of the ruralpopulation is very close to the World Bank’s calculation ofa dollar a day in PPP values as being 879 yuan in year 2002prices. With careful use of words, this near equivalenceprovides a basis for a shared understanding betweendonors and the government on the size of the problem.Admittedly the government will continue to apply the 869yuan figure to those rural people whose income is lessthan that per annum, whereas the World Bank and otherdonors will use the comparative dollar a day figure for twodifferent measures – those whose income is less than thebenchmark and those whose expenditure is less than thebenchmark.
The PRC has no official urban poverty line. Variousgovernment agencies, including NBS, have had toestimate the number of urban poor for diagnosticreasons. The National Bureau of Statistics’s (NBS’s)diagnostic urban poverty line was 1,875 yuan income percapita in year 2000 prices. This is exactly three times theofficial rural poverty line in the same year. Using the NBSmeasure, 10.5 million official urban residents werecategorized as poor in 2000, 3.1% of urban population. Ifthe floating population is 80 million (and there are nohard figures on the size of floating population), and if thefloating population is 50% more likely to be poor thanpermanent urban residents as shown in an ADB urbanpoverty study, then the incidence of urban poverty in year2000 using the NBS measure was 3.4% – the same as theofficial incidence of rural poverty in 2000.
The PRC also has a variety of other urban poverty linesset as benchmarks below which a person is entitled topoverty relief benefits. Responsibility for financialassistance to the urban poor under the Minimum LivingStandard Scheme (MLSS) lies primarily with citygovernments. Under the MLSS, each city sets its ownpoverty or benefits line. Not surprisingly, poorer citiestend to use harsher definitions of poverty and richer citiesmore lenient definitions. For instance, in 2000, Beijing’s

Executive Summary 5
benefit line was 3,360 yuan per capita per annum whereasChongqing set its line at 2,028 yuan.
In recent official statements, the Government isabbreviating its references to those receiving MLSS as theurban poor. Given that 21 million urban residents receivedMLSS assistance in the first half of 2003 and given thatnot all those entitled to assistance have yet been covered bythe MLSS, it is probable that one of the official measuresof urban poverty puts the number of urban poor in excessof 21 million. This number, like the MLSS itself, wouldexclude migrant workers and their dependents living inurban areas.
PILLARS UNDERLYING POVERTYREDUCTIONThe process of making the fight against poverty in the PRCmore effective benefits from assessing what worked andwhat did not work in the past. From 1986 through to theend of 2000, the Government pursued a geographically-targeted approach to rural poverty reduction. Poor countieswere eligible for subsidized loans, food-for-work programs,and special development funds. These counties were calledthe national poverty counties and renamed in 2001 as keycounties for national poverty reduction and developmentwork. For most of the 1990s and onwards, 592 out of atotal of 2,074 counties were eligible recipients of thistargeted assistance. With some minor variations, these 592counties were re-designated in 2001 as key counties fornational poverty reduction and development work.Geographical targeting remained but this was now overlaidwith finer targeting criteria focused on poor villages andpoor households that were developed because of the lessonslearned from the past.
national poverty counties and other counties between 1997and 2000. A key finding is that the poverty reduction ratein national poverty counties was lower than for the othercounties. There are lessons that can be learned or postulatedfrom this which include:
(i) economic growth has had a major impact on povertyreduction irrespective of targeting;
(ii) rural poverty in the national poverty counties isconcentrated spatially and is more inextricable relativeto rural poverty in other counties;
(iii) there has been a weakening of the Government’stargeted effort away from the rural poor within thenational poverty counties;
(iv) the prime drivers for reducing rural poverty in theshort term may be upward trends in real agriculturalprices and the availability of off-farm employment(targeted programs delivered directly to poor villagescan only have minor impact on these drivers);
(v) past efforts at targeting did not sufficiently emphasizethe integration of the poorer communities intoexisting and new growing markets through improvedroad connections.
Figure S2 and Figure S3 show the trend in rural povertyreduction according to the official poverty line for
So how are the pillars underlying poverty reductionworking and how might they be better utilized? TheWorld Bank has calculated that for every 1% growth inthe GDP in the PRC, rural poverty declines by around0.8%. With the PRC being one of the world’s fastestgrowing economies (GDP growth between 1995 and2000 averaged 8.6%), poverty reduction has beenconsiderable. Macroeconomic growth creates demandfor the products and for the labor of poor people, andenables the Government to collect more tax revenues.With increased revenues, the Government has been able
Figure S3: Pace of Rural Poverty Reductionbased on the Government's Poverty Line
15.4
18.2
5.6
16.7
20.0
6.3
0
5
10
15
20
25
1997->1998 1998->1999 1999->2000
Yea
r-on
-yea
r %
red
uctio
n
National Poverty Counties All Other Counties
26
24
22
20
18
16
17
15
0
10
20
30
40
50
Mill
ion
pers
ons
1997 1998 1999 2000
Figure S2: Recent Rural Poverty Numbersper Government's Official Poverty Line
National Poverty Counties All Other Counties

6 Poverty Profile of the People’s Republic of China
to finance larger scale poverty reduction programs,improved infrastructure linking remoter areas to bustlingmarkets, improved education and the development anddissemination of improved production technologies inagriculture and industry. Under present linkages in theeconomy all these public investments impact on povertyreduction. A recent research paper by the InternationalFood Policy Research Institute (IFPRI) examining trendsin the PRC in the late 1990s found that among physicalinfrastructure options, public investment in roads had thehighest returns to poverty reduction (3.2 persons for every10,000 yuan invested) and for social infrastructureoptions, education had the highest returns (8.8 persons forevery 10,000 yuan invested).
The link between physical infrastructure development andpoverty reduction needs to be explained. A roadinvestment, for instance, in an area with povertyconcentrations is likely to improve both agricultural andnon-agricultural activity and expand off-farmemployment. Poor farmers will have more produce to selland will earn more from off-farm work. This is the directincome distribution effect. In addition, higher productivityand expanded employment contribute to economicgrowth. This in turn affects the supply and prices ofgoods which the poor consume or sell. This is the indirectgrowth effect. The direct and indirect effects combinedallow the poor to increase their net income and raise theirconsumption levels, and thus move out of poverty.
Income distribution patterns, however, favor eastern overcentral and western provinces, city over rural populations,and non-household entities over households. Eachpercent of GDP growth in the eastern provincesproduced considerably more rural poverty reduction thanin the northwestern and southwestern provinces, forinstance. The first message for policymakers is to realizethe potential for accelerating poverty reduction throughemphasizing pro-poor sustainable economic growth. Suchgrowth is likely to be characterized by: (i) the increasedprovision of off-farm income earning opportunities forpoor farmers which in part can be facilitated by loweringthe barriers small and private businesses, especially theiraccess to credit; (ii) promoting the rural economy throughmore favorable agricultural pricing policies; (iii) redressingthe regressive nature of the taxation and fee burden onfarmers; (iv) greater integration of rural areas into regional(meaning regions within the PRC) and national marketswhich will involve providing more physical infrastructureto poor areas (especially integrated road networks thatinclude and link expressways to rural roads to township tovillage roads) and improving their social (particularlyhealth and education) and regulatory infrastructure; (v)
expanding opportunities for the western region to tradewith Central and Southeast Asia; (vi) reform of the fiscalsystem between levels of government on the basis ofequity and adequate funding of obligations delegated tolower levels of government and (vii) ensuring greaterequity in access to financial and human capital and naturalresources.
Second, there is considerable scope for improvements ingovernance to accelerate poverty reduction. This wouldreduce the leakage of targeted poverty reduction fundsaway from the rural poor. It would induce more efficientand effective use of limited financial and human resourcesby the cash-strapped lower levels of government. Newapproaches adopted since 2001 to “listen to the voices ofthe poor” through participatory village developmentplanning will contribute to the dynamics driving goodgovernance.
The results of a study conducted under the LeadingGroup Office on Poverty Alleviation and Development(LGOP) and assisted by the ADB that examined whatprimary indicators rural poor people would themselvesuse to define poverty and what relative weightings theywould give these indicators. The overall result from awidely dispersed sample of the rural poor was that theindicators of importance to them could be grouped intothree categories – personal income and housing, physicalinfrastructure, and health and education. They gave nearlyequal weighting to each of these categories.
For the urban poor, improvements in governance areplaying, and will continue to play, a more prominent role.Progress is being made with extending the coverage, andbuilding the sustainability, of social welfare safety nets. Anexample of this is the increase in coverage of the MLSSfrom 4 million urban poor at the beginning of 2001 toover 21 million in the first half of 2003. Regulatorybarriers that impede the access of floating populations tourban commercial opportunities and social services,especially education and health services, are being lowered.More effective labor markets are being developed, and re-training of laid-off SOE employees is being increased.
Thirdly, social development has provided the poor withenhanced human capital. Research in the PRC hasconsistently confirmed that education status is closelycorrelated with the incidence of poverty. An analysis ofdata collected in the NBS’s 1988 and 1995 ruralhousehold income surveys show a qualitative change inthe impact of education on rural poverty. In 1988, thepresence in the household of at least one adult withformal education, no matter to what level, was stronglycorrelated with a reduced poverty incidence. In 1995,

Executive Summary 7
however, lower rural poverty incidence shifted to beingclosely correlated with how many years an adult in thehousehold had received education. The recent IFPRIresearch paper confirmed that for the PRC, publicinvestment in education had high returns in terms ofpoverty reduction.The PRC’s policy on education has been to achieveuniversal education up to grade 9 - that is to the end ofmiddle school. Teaching resources and enrollments havebeen expanding at secondary school level while remainingrelatively static at the primary school level. Householdsocio-economic surveys conducted as part ofinfrastructure project preparation for ADB financing inthe PRC indicate the severe burden education fees andcontributions place on poor families. The high educationfee barrier is often given by poor rural parents as thereason their children have dropped out of school. Thesame surveys show that for the poor families, girls tend tobe withdrawn from school at an earlier age than boys. Thisexclusion of the young poor from obtaining a basiceducation is, in effect, condemning another generation topoverty.Health is often both a cause and a result of poverty.Various socioeconomic studies at village level suggest thattime out from the production economy because ofsickness, or in order to perform care and reproductionroles, are closely correlated to the incidence of ruralpoverty. It is women primarily that perform these roles.Heavier physical and psychological burdens are falling onpoor women largely because of the feminization ofagriculture, and the additional time and effort needed indegrading environments to collect water, fuel, fodder, wildculinary plants and medicinal herbs and to graze animals.The result is a decline in women’s ability to performeffectively and efficiently in the care and reproductioneconomy. This decline often goes unseen by macro-planners because it is not captured by GDP or similareconomic aggregates. Other indicators of health, such ashigh Maternal Mortality Rate (MMR), Infant MortalityRate (IMR) and Reproductive Tract Infection Rate (RTI)among poor women, reflect the difficulties of their andtheir families’ escape from poverty.Health sector studies have shown that the greaterproportion of the PRC’s infections and parasitic diseasesafflict the poor. Among the rural population, the poorestquartile suffers three times the infectious disease rate ofthe most wealthy quartile.The primary obstacle to improved health among the poorappears to be user fee levels. For instance, pilot schemes innational minority counties have shown that where userfees for in-hospital birthing are waived for poor women,
the rate of homebirths, MMR and IMR all droppedsubstantially. Considerable scope exists to escalate the waron poverty by making primary and secondary health-careservices accessible to the poor in both rural and urbanareas.
The revenue base of local governments, particularly inpoor areas, is weak. Insufficient funds are available to paysalaries and deliver even the most basic services like healthand education. Because of the mismatch between revenuesources and expenditure responsibilities, localgovernments respond by levying many fees and charges.This is a regressive form of taxation, driven by a limitedrevenue base. Pro-poor fiscal reform is required at thesub-provincial level that aligns revenues and expenditures,improves the governance and efficient use of fiscalresources and includes a targeted fiscal transfercomponent.
CROSS-CUTTING THEMES IN THEFIGHT AGAINST POVERTYThree crosscutting themes have added, and will continueto add, focus and effectiveness to the three pillarsunderpinning poverty reduction identified above - pro-poor economic growth, social development and goodgovernance. The first theme is the promotion of the roleof the private sector. One of the primary causes of urbanpoverty has been loss of employment. Between 1996 and2000, SOEs and urban collectives shed 47 million jobs.Also during that period, the net growth in the urbaneconomically active population was at least 10 million.Conversely, one of the primary factors reducing ruralpoverty has been access by at least one household memberto off-farm employment, in many cases meaning migrantlabor to the economic powerhouse cities in the easternregion. Creating new jobs is a necessary pre-requisite toreducing both urban and rural poverty.
Urban employment has been growing at an average of2.4% per annum since 1994. Pertinent to povertyreduction is the fact that the dynamics of employmentgrowth have changed. Over this period, the state andcollective sectors have been shedding jobs, and since 1997,have been doing so at an accelerated rate. It has been theprivate and mixed ownership sectors that have generatednew jobs, not only soaking up the majority of thosedisplaced from the public sector, but also achieving amodest net increase in total urban employment.The PRC’s macroeconomic policies, legal frameworks andurban safety net systems have progressively placed moreimportance on building an enabling environment for theprivate sector. This theme is now part of theGovernment’s vision for the future.

8 Poverty Profile of the People’s Republic of China
The second crosscutting theme that sharpens povertyreduction focus is the pursuit of environmentalsustainability. Decelerating success rates of moving peopleout of poverty have characterized the history of ruralpoverty reduction in the PRC as simpler forms of povertywere resolved and the more inextricable forms remained.This is reflected in Figure S4.
Figure S4 shows how, on a three year rolling basis, theannual outlay on targeted rural poverty reduction perrural person freed from poverty has doubled in real termsover the 8-7 program period (1994-2000). Much of theremaining rural poverty is linked to poor and oftendegraded environments – increased land degradation,high altitudes, steeply sloping lands, poor soils in karstand loess country, increased frequency of floods,extended periods of drought, reduced quality of water,and growing deserts.PRC has over 2000 years of history of taming nature on agargantuan scale. Today’s leaders of the PRC are noexception. Blanket policies to ban logging and returnsteeply sloping lands to forest are being strictlyimplemented. Massive schemes are underway to reforestbare hills and loess slopes and plant special grasses thatwill reverse desertification. Major water controlinfrastructure has been built on both the Yangtze andYellow Rivers. A scheme will divert large volumes ofwater from the Yangtze to the Yellow River in the northwhere dryness has been a major constraint ondevelopment. Donors, on a much more modest scale,have been assisting the PRC’s efforts in targetingenvironmental sustainability. One of the donors – theNetherlands – has sponsored a study which may help thedonor community target their environmental projects/
programs for greater pro-poor impact. This studyquantifies the extent to which each form ofenvironmental degradation more adversely affects thepoor than the non-poor in the PRC.
The third crosscutting theme that can sharpen povertyreduction efforts is regional cooperation and integrationfor development. Most of the rural poor are located in thewestern region. Producers in the west have a locationaldisadvantage in terms of distance, and the limitedavailability and lower standards of roads and rail withconsequential high transport costs, compared to thecentral and especially the eastern region. This makes itdifficult for them to access global markets and the richdomestic markets along the eastern seaboard. For thewestern region, greater cooperation and integration withthe markets in Southeast Asia and Central Asia and, in thelonger term, South Asia provide a platform for growth. Inthe west, such growth will expand demand for theproduce of the rural poor and generate employmentopportunities for both the urban and rural poor. TheGovernment has recognized this and throughparticipating in multilateral forums, pursuing bilateraltrade diplomacy and building physical infrastructure isputting in place a framework for enhanced regionalcooperation and integration. Donors are financingprojects and programs to support the establishment ofthis framework.
PROXY PROFILE OF RURALPERSONS WITH CONSUMPTIONLESS THAN $1 PER DAY
The World Bank has estimated a dollar a day in PPPvalues to be equivalent to 879 yuan net income per capitaper annum in year 2002 prices. This measure can beapplied to a person’s income or expenditure. Manydevelopment assistance practitioners and academics agreethat consumption is the better of the two. What is theprofile of those rural persons in the PRC who cannotachieve a dollar a day consumption?
No such profile has been derived from hard data.Fortunately, a proxy exists. The NBS, operating within theofficial framework of the “poor and the low income”rural people, re-analyzed their year 2000 rural householdsurvey data to establish a profile of all those unable toconsume 860 yuan per annum. Eight hundred and sixtyyuan in year 2000 prices is close to the World Bank’s 879yuan in 2002 prices – close enough for the NBS profileresults to reflect the condition of those who meet the“less than $1 a day consumption” definition of poverty.
Figure S4 :Cost per Rural Person freed from Poverty(rolling three year average)
0
1000
2000
3000
4000
5000
6000
7000
1994–96* 1995–97 1996–98 1997–99 1998–2000
Yu
an (
1997
co
nst
ant
pri
ces)
Government cost per person freed Total cost per person freed

Executive Summary 9
In relating the NBS profile, for reasons of brevity thoserural persons unable to consume 860 yuan per annum in2000 will be called the poor, and those with higherconsumption will be called the non-poor. This in no wayimplies that the NBS agrees to classify them as poor.
According to the NBS profile, the rural poor had, onaverage, only 43% of the net cash income of the non-poor. This was largely due to their lower level ofparticipation in off-farm wage labor. They also had lowerreturns to agriculture per unit of arable land. Poorer landquality and remoteness are probable contributing factors.The poor had one third less fixed assets to devote toproduction than did the non-poor. This handicap wasreflected in lower grain yields, 44% less net incomederived from animal husbandry and 77% less incomederived from aquaculture. The latter two activities requirecapital investment.
Housing standards are observable indicators of welfare.The per capita access of the poor to higher qualityreinforced concrete housing was only 30% of that of thenon-poor. Another indicator is the percentage of livingexpenditure a household devotes to acquiring food,known as the Engel coefficient. For the poorer group thiswas 66%, compared with 44% for the non-poor.
The data showed that topography, gender and ethnicityare linked to poverty. Over one third (36 %) of the poorwere living in mountainous areas whereas less than onequarter (22%) of the non-poor did so. Women weremarginally more prevalent among the poor compared tothe non-poor. This result understates the extent to whichwomen are more likely to be poor than men because thehousehold survey methodology does not analyze intra-household division of wealth and income. Differenceswere explicit, however, with respect to ethnicity. Twentyfive per cent of the poor group belonged to minorityvillages whereas for the non-poor only 12% did so. Thissuggests that poverty incidence among minorities isdouble that for the Han majority.
Policies over the last two five-year plan periods thataimed at enlarging domestic demand, and the “8-7”poverty reduction program, have almost removed anydistinction between the poorer group and the non-poor inrespect of road connections and electricity supply to theirvillages. While connections and supply are in place, there iswide variation in standards that flows through todifferentiated transport and production costs.Nonetheless, supply of these two types of infrastructure is
approaching total coverage. Ninety three per cent of thepoor and 96% of the non-poor lived in villages connectedto a highway. There was also little difference between thetwo groups in respect of proximity to primary schools, withthe poor half a per cent better off than the non-poor.Thirteen to 14% of the sampled rural population were morethan 2 kms from the nearest such school.
The profiles of the poor and the non-poor differedsignificantly in terms of other infrastructure. Theproportions of poor households: (i) able to drink safewater (58%), (ii) located within 2 kms of the nearest healthclinic (57%); and (iii) with access to a telephone in the samevillage (77%) were 8.3, 10.5 and 12.8% lower respectivelythan for the non-poor.
Levels of education achieved, as a proxy measure of humanresource skills, showed that the poor were at a considerabledisadvantage to the non-poor. Compared to the better-offmajority, the poor had almost double the incidence ofilliteracy or semi-literacy. Figure S5 highlights the educationalgap at various levels of completed schooling. Nine percentof the children of the poor aged between 7 and 15 werenot enrolled at schools. This was double that for the sameage non-poor children.
Consistent with data on sources of income, thepredominance of agricultural employment among thepoor was 12% higher than for the non-poor. Theproportion of poor engaged in industry and tertiaryservices was half that of the non-poor. It is clear thatgreater access to off-farm employment is associated witha reduced incidence of poverty.
Figure S5: Rural Education Levels Achieved
0
1020
30
40
50
60
70
80
90
100
At leastIlliterate or
semi-literate
At leastPrimarySchool
At leastJuniorMiddleSchool
At leastSeniorMiddleSchool
At leastSpecial
secondary
% o
f R
HS
Sam
ple
Poor Non-Poor
Source: Year 2000 NBS Rural Household Survey

10 Poverty Profile of the People’s Republic of China
PROXY PROFILE OF URBANRESIDENTS WITH CONSUMPTIONBELOW THE AVERAGE MLSS LINEEach city determines at what level of income deprivationit will step in and support its registered residents under theMLSS. From the PRC perspective, these determinationscan be seen as pragmatic, benefits-based urban povertylines. They vary markedly between cities. In 2000, theaverage of these minimum living standard lines in thePRC’s 31 provincial capitals plus 4 other major cities was2,365 yuan (year 2000 prices). This average is about twoand a half times the World Bank’s dollar a day benchmark.It is consistent with a number of research conclusions thaturban absolute poverty lines are generally two to threetimes higher than those for rural communities.
Benefits under the MLSS are payable when an urbanresident’s income falls below the declared minimum livingstandard line. Conceptually, however, MLSS assistance ismeant to enable the urban poor to purchase absolute basicliving necessities. Thus a profile of urban residents whoseconsumption cannot exceed the average MLSS line may bea more accurate representation of the urban poor thanone of those with incomes less than the line.
While a profile of urban residents who could not achieve2,365 yuan consumption is not apparently available, onecapturing those who could not reach a consumption levelof 2,310 yuan (in 1998 prices) is. These cut off levels areso close that one can serve as a proxy for the other.
NBS analyzed the 1998 urban household survey data tocompile a detailed profile of those registered urbanresidents below and those above a benchmark of 2,310yuan per-capita expenditure per annum. In the followingdescription, those below the consumption line are referredto as the urban poor, and those above as the non-poor.
Economic profiling has shown sharp distinctions betweenthe urban poor and the non-poor. This in part reflectswidening gaps in wealth within urban communities. Theaverage disposable income of the urban poor was only44% of that of the non-poor. The poor only spent onethird of what the non-poor spent on consumption. Thedata show that despite meager incomes, the poor hadtwice the propensity to save out of their disposableincomes (0.36) than the non-poor. Expenditure on food asa proportion of total living expenditures - that is the Engelcoefficient - was much higher for the urban poor (at 57%)than for the urban non-poor (at 44%).Most of the urban poor were in the eastern region(43.4%), whereas less than half that proportion (19.1%)
were in the western region. It was the central region thathad the highest incidence of urban poverty (14.3%). Poorhouseholds were confronted with greater difficulty inmaking ends meet partly because their dependency ratioswere 17% higher than for the non-poor. Probably relatedto this household structure, the poverty incidence amongurban children (0-14 years old) was higher than for olderage groups.There was a marginally higher incidence of poverty amongfemales (12.1%) than for males (11.7%). Like the genderdata for rural households, these figures probablyunderstate the incidence of poverty affecting women. Thisis because of the method of data collection which focuseson the household, averaging behavioral indicators amongall household members, without delving into intra-household differences.An analysis of skill levels as reflected in educationattainment levels showed that the urban poor wereconsiderably less educated than the non-poor. Figure S6shows that the gap between the education achievementlevels of the poor and non-poor was widest at for thosewho have at least completed senior high school. Theaverage gap at identical achievement levels between juniorhigh and university for the poor and non-poor was 10.4%.The proportion of the poor who had at least completedsenior high school was 70% of that for the non-poor. Theproportions for the poor lessened progressively at higherlevels of education. The proportion of the poor with atleast university qualifications was only 29% of that for thenon-poor.
Sector of employment was an important explanatoryvariable for poverty. The proportion of the non-poor
Source: Year 1998 NBS Urban Household Survey
Figure S6: Urban Education Levels Achieved
0
10
20
30
40
50
60
70
80
90
100
At leastIlliterate or
semi-literate
At leastPrimaryschool
At leastJunior high
school
At leastSenior high
school
At leastSpecial ortechnicalschool
At leastCollege
At leastUniversity
% o
f U
rban
Hou
seho
ld S
ampl
e
Non-Poor Poor

Executive Summary 11
with household members serving the Government, theParty, official social organizations, or health, cultural,educational and scientific agencies was generally double ormore that for the poor. In contrast, the proportion of theurban poor waiting for employment or disabled was threetimes more than for the non-poor. The able-bodied urbanpoor lucky enough to have a job were more prevalent thanthe non poor in relatively unskilled occupations such asgeneral laboring, baby-sitting and domestic service.
THE WAY FORWARDThe PRC Government is committed to reduce anderadicate remnant and relatively inextricable rural povertyand the more recent blight of urban poverty. Relevantstrategies and targets are contained in the Tenth Five YearPlan (2001-2005) and the Outline for Poverty Alleviation andDevelopment of China’s Rural Areas (2001-2010). The mix ofstrategies tightens the focus, attacks underlying causes likeenvironmental degradation, seizes on employmentgeneration as a primary and immediate poverty reductionweapon, supports upgrading of education levels as afurther weapon, capitalizes on the motive force of thepoor themselves, allocates considerably more resourcesinto poverty reduction, and strengthens and extendswelfare safety nets to help those who cannot, temporarilyor permanently, help themselves.
Between 2001 and 2005, 16.5 million hectares of grasslandwill be resuscitated to prevent desertification and soilerosion will be brought under control in over 25 millionhectares of degraded land. Priority will be given toreducing poverty in remote and mountainous areas,minority areas and old revolutionary base areas. Fivehundred and ninety two countries have been designated bythe national government as key counties for povertyreduction development work. Official area planning and
resource allocation will be integrated with the newparticipatory poor village development planning process.Off-farm income opportunities for the rural poor will beexpanded through the development of small towns.Demand for the produce of the poor will be increased bypromoting industries which process, store and transportagricultural products. Access to markets will be improvedby constructing infrastructure, particularly in the West. Thisoverall thrust will be underwritten with greater Governmentgrants and credits.
In its fight against urban poverty, the Government has setitself ambitious targets to be achieved by 2005 in generatingsufficient new urban employment opportunities to limitunemployment. Private sector, labor-intensive businesseswill be promoted, especially in the tertiary sector. Barrierswill be lowered, and incentives offered, to people wishingto start their own businesses. The present system of skillsretraining of displaced workers and re-employment centerswill be expanded. Urban living standards will be augmentedin terms of access to housing, education and health.Particular efforts will be directed at creating a sound andsustainable social security system that can support thosewith unemployment, medical, pension, old-age and disabilityneeds.
While the Government is mobilizing its own resources in afocused fight against poverty, it is also reaching out forsupport from NGOs. The Government welcomes anexpansion in the role of NGOs in the area of povertyreduction. The Government is also seeking enhancedcooperation with international development partners, bothofficial and non-government, to add value to the nation’spoverty reduction program, not only by supplying financialand expert resources, but also by proposing and testinginnovative methodologies.


Understanding Rural Poverty 13
UNDERSTANDING RURAL POVERTY IN THE PRC
DEVELOPING AN OPERATIONAL DEFINITION OF POVERTYWhen the People’s Republic of China (PRC) was established on 1 October 1949, it inherited an impoverished populace torn by yearsof international and civil war. Poverty predominated throughout the land. For the next half century, the Government led the countrythrough reconstruction and then development phases with the result that only patches of poverty remained at the end of 2000. Asstated by the PRC’s cabinet - the State Council - on 18 June 2001, these patches are intolerable to society, the Chinese CommunistParty (CCP) and the Government. The year 2001 marked the launch of a new, sharply focused ten-year strategy to continue the taskof poverty reduction.
“Poverty” is a word with an evolving meaning. In the 1980sand 1990s, it was seen as not having enough income toprovide for the bare minimum of food, clothing and shelterneeded for survival. This aspect is “income poverty”. Nowit is generally agreed that poverty has many dimensions.The central element is deprivation - deprivation of theopportunities and choices necessary to enable persons toachieve and enjoy a basic level of welfare in terms of humandevelopment. This deprivation is characterized by materialshortage, inadequate education and health, weak socialsupport networks, insecurity and vulnerability, low self-confidence, and powerlessness.2 Clearly, deprivation is amatter of degree. Poverty can range from what can betermed “absolute poverty” to various degrees of relativepoverty.For the 21st Century, the PRC is moving towards the use ofmulti-dimensional definitions of poverty, indeed one thatis largely defined by the poor themselves. In the mid-1980s,poverty reduction efforts were focused on “incomepoverty”. At that time, when the Government formulatedits poverty reduction program, rationing scarce resourcesto the program had to be linked to the Government’sdefinition of poverty. It is a norm of institutional behaviorin the PRC that when the Government classifies thepopulace into groups, that classification carries benefitsand/or obligations. There is no point in the Governmentmaking a classification for classification’s sake. The necessaryrationing of scarce Government resources was achievedby adopting an austere definition of poverty and thenconstraining the number of counties that would qualify forpoverty program support.
In the mid-1980s, poverty was a rural phenomenon. Atthat time, mobility between rural and urban areas was verylimited and citizens holding urban residency permits wereguaranteed a job, housing, access to health, education andsocial services and a basic subsistence in food andclothing through a subsidy system when necessary.
Definition of Rural Poverty - 1986 onwardsThe income approach to defining Rural Poverty
The basic unit in society suffering from poverty is theindividual or the household. Definitions of rural povertylogically start by assessing what level of physical and non-physical resources need to be placed under the commandof a farmer or a household for her/him/it to access abare-survival standard of living on a sustainable basis.The income approach is to identify and price a basicsurvival consumption package comprising a foodcomponent and a non-food component (clothing, shelterand essential goods and services). The resulting monetaryfigure becomes the poverty line and is expressed in percapita terms. In the 1980s and 1990s, the PRC was one ofa number of developing countries that followed thisapproach.
While this calculation method sounds simple enough,different institutions and individuals have applied thesame standard approach to defining the poverty line in thePRC and have arrived at different answers. This remainsan area of debate between the key agencies involved inaddressing poverty, multilateral and bilateral donors, andacademics.
2 Wu, Guobao. 2001. The Tenth-Five Poverty Reduction DevelopmentStrategy Study of Rural China. Beijing: China Academy of SocialScience; and World Bank. 2001. World Development Report 2000/2001. Washington, DC.

14 Poverty Profile of the People’s Republic of China
Should a Poverty Line be measured by net income orconsumption?
After deriving the monetary value of a basic survivalpackage, the next logical question is whether fieldobservations of the poverty line should measure netincome of rural individuals or their consumption. Thesetwo measures are not the same. The net annual income ofindividuals can vary significantly year on year because offactors such as weather change, shifts in agriculturalprices, and degree of insect damage of crops.Consumption tends to be more stable over time asindividuals and families attempt to maintain the standardof living to which they have become accustomed. Theindividual or household finances his/her/its regularstandard of consumption expenditure from net income,savings, borrowings and/or social support. He/she/it willalso want to direct part of net income into productiveinvestment. In normal years, the individual or householdwill try to save part of the income so as to lowervulnerability to livelihood shocks or reduce debt incurredin managing past shocks. This is especially true for poorhouseholds. Thus the income needed to sustainexpenditure on a survival consumption package is likely tobe higher than the monetary cost of that package. Thislikelihood is supported by several field surveys in poorcounties that report a higher headcount of the poor usingthe consumption expenditure interpretation of thepoverty line when compared to using the net incomeinterpretation.
The PRC has opted for the net income interpretation.This is a practical approach as the data regularly collectedfrom all its counties, townships and villages enablesreadings on net rural incomes per capita. Rural householdconsumption surveys, on the other hand, are conductedon very small samples. The year 2001 rural householdsurvey conducted by the NBS covered 67,340 householdsrepresenting a 0.028% coverage of all rural households.
Notwithstanding small sample size, the rural householdsurveys are a resource from which an estimate can madeof the per capita net income a poor household needs toearn before its consumption expenditure is able toencompass the minimum basic survival package.
Targeting the Government’s Poverty ReductionEffortsOnce an income line for individual poverty is determined,a Government has to decide how it will target its directinterventions to help the poor. The main target choicesare: individual; household; functional unit or socialorganization to which individual belongs; or functional
administrative/geographic unit in which the individuallives. Excepting for the level of individual, all otherchoices cover units encompassing several to multitudes ofindividuals. The PRC, with its long established hierarchyof the center, provinces, prefectures, counties andtownships, decided in the mid 1980s that the target unitfor its poverty reduction programs would be the countiesin which a comparatively high number of rural poor lived.
Having chosen the county as the target level, the nextquestion for policy makers was how to define a povertycounty. The PRC chose to apply the poverty line derivedfor the rural individual to the county as a whole byaveraging the net income of all rural inhabitants of thecounty. If the average was below the individual povertyline, then the county was eligible to be classified as apoverty county.
Mathematically, this approach would capture most of thePRC’s rural poor if rural incomes were fairly equallydistributed within each county. This was the case underthe rural commune system operating until the early 1980s,with its fixed prices for produce and pre-determinedcommune member incomes calibrated only slightly by awork point system. Policy makers in 1985 were operatingagainst the very recent backdrop of the commune era.However with the end of the commune system and theadvent of new opportunities to pursue income fromproduce sales in free markets, rural income disparitieswithin counties emerged. Farmers in former communeslocated on fertile river valleys within easy access of majorcities were able to improve their income rapidly, whilethose living in mountainous areas or arid zones had morelimited ability to seize these new opportunities.
Under conditions of rural income inequality within acounty, applying the individual poverty line to the averagefor a whole county becomes a less accurate means oftargeting the poor. For example, per capita net incomeover the large geographic areas that make up countiesmight disguise intense poverty in high altitude, karst, dryor flood-prone locations when these are interspersed byrich river valleys. Also, the number of absolute poor intwo counties can be large and identical, yet the differencesin rural income distribution between the two counties canmake one eligible for poverty county status and the otherineligible. Several such cases have been identified invarious research papers.
The First Set of Definitions and Selection ofNational Poverty CountiesIn the mid-1980s a mixed set of poverty lines wasadopted to choose nationally designated poor countiesthat would be eligible for financial support under the

Understanding Rural Poverty 15
Central Government’s poverty reduction program. Thebasic eligibility standard was set at 150 yuan, or less, netincome per capita of the rural population in 1985 prices.Eligibility standards were relaxed for special categories ofcounties. The PRC leadership has long felt a strongobligation to assist development in those inaccessiblemountain areas where the Red Army took refuge in the1930s and 1940s. The leadership has also had anideological and pragmatic commitment to improving thelivelihoods of national minorities. Thus the eligibility levelfor the national poverty reduction program was lifted to200 yuan net income per capita for counties in oldrevolutionary base areas and counties with large minoritypopulations. An even more lenient eligibility standard of300 yuan net income per capita was extended to somecounties in very important revolutionary base areas andfor a few minority counties with severe difficulties in InnerMongolia, Xinjiang, and Qinghai. Poor counties werechosen from among those that met the criteria. Proof ofthe criteria relied on per capita net income data for 1985collected by the NBS3.
Because of the scarcity of otherwise unallocated budgetfunds, the Government was unable to designate all eligiblecounties as national poverty counties. According to 1985data from the Ministry of Agriculture (MOA), of the 82counties where the per capita net income was below 150yuan in 1986, 24 were not designated as poor. This meantthat while there were poor people in many counties, onlythose living in nationally-designated key counties wouldgain access to the geographically targeted povertyreduction programs financed by the Central Government.Furthermore, it is likely that provincial pressures were atwork to ensure some balance in the distribution ofnational poverty fund entitlements among provinces bethey in the more developed coastal regions or in thedisadvantaged West, notwithstanding that the latter hadthe highest incidence of poverty.
In 1988, the mix of poverty lines was enlarged further.The Central Government determined poverty standardsfor counties in pastureland regions based on income datafrom 1984 to 1986. Pastureland counties where theaverage net income per capita was below 300 yuan andsemi-pastureland counties where the average net incomewas below 200 yuan were eligible for official classificationas national poverty counties. Also in 1989 when Hainanbecame a separate province, three of its counties joinedthe national poverty ranks. By the end of 1989, 331 of thePRC’s 2,449 counties (14%) had been accorded national
poverty county status.The number of poverty lines was made even morenumerous by the socially responsible action of provincialand lower levels of government to participate directly inthe fight against poverty. They set their own eligibility criteriafor poverty status. For instance, between 1986 and 1988the provinces variously defined rural poverty lines as beingbetween 200 and 500 yuan average per capita net income.On this basis, by 1988 they had declared another 372counties as poverty stricken and eligible for specialdevelopment programs financed by the provincialgovernments.
A More Rigorous Definition and Selection ofNational Poverty CountiesShortcomings in the targeting of poverty programs between1986 and the early 1990s led to adjustment of both thepoverty lines and poor county designations in 1993. Theseadjustments followed from new, more rigorous povertycalculations made by NBS (see Box 1).
The NBS calculations outlined in Box 1 set the nationalpoverty line in 1993 prices at 400 yuan net income percapita of the rural population. This is equivalent to 625yuan in 2000 prices. In 1993, this line was used to redefineeligibility as a national poverty county. In the same yearthe Government began gearing up for a major assault onpoverty under the new “8-7” program. Approximatelyeighty million rural poor remained and they were to befreed from poverty over the seven year period 1994-2000.Hence the name “8-7”. While the NBS calculations set theeligibility criterion for new candidates for national povertycounty status, the Government was faced with decidingthe continued eligibility of the 331 counties accorded thisstatus between 1986 and 1989. Partly on politicalconsiderations, the Government opted for a “4-in, 7-out”formula - that is 400 yuan net income per capita for newcandidates and 700 yuan net income per capita as a ceilingfor continued eligibility on counties already grantednational poverty status. Counties whose development hadlifted net income per capita of the rural population above700 yuan in 1993 were expected to graduate from nationalpoverty status.
Under a strict application of the “4-in, 7-out” formula,326 counties qualified for national poverty county status.Counties that were meant to graduate were reluctant to doso, and political expediency eventually allowed many topostpone their graduation. Other factors entered thedecision making such as grain production, other
3 The NBS samples 60-100 households per county in about one third ofthe nation’s counties. Income data for other counties are based onadjusted data from the Ministry of Agriculture.

16 Poverty Profile of the People’s Republic of China
Box 1: Technical Calculation of Poverty Line by NBSIn order to determine the poverty line in a more scientificmanner, NBS divided necessary living expenditures into twoparts: food expenditure and non-food expenditure (clothing,housing, communication, fuel, medicine, education,entertainment, and others). The minimum income necessaryfor food expenditure was calculated based on a fixed foodbundle that was considered enough to maintain a minimumdaily caloric intake necessary for subsistence. Non-foodexpenditures, which are harder to measure, were calculatedas a fixed percentage of food expenditures using an Engel’scoefficient (ratio of food expenditures to total expenditures)of 0.6. This coefficient was chosen because it wascomparable to that used in calculating poverty lines in othercountries and also was equal to the average share ofexpenditures spent on food in the PRC by rural householdsin 1984, when many of the poor were just escaping frompoverty.In calculating necessary food expenditure, NBS used aminimum daily caloric intake level of 2,100 kilocalories asrecommended by PRC’s Center for Preventative Medicine.The food bundle contained only necessities and not itemsconsidered harmful (alcohol, cigarettes, candy) and wasintended to reflect actual consumption patterns. NBS used1984 household survey data to determine the actual sharesof grain, vegetables, fruit, meat, poultry, seafood, dairyproducts, oil, sugar, salt, and other items to be included inthe bundle.Having determined the food bundle, NBS used thefollowing equation to generate weighted prices to calculateminimum food expenditure:
Pi = P’i x Ri + P”i x (1 - Ri)
where Pi is the weighted price of the food item i; P’i is theofficial (planned) retail price of item i; Pi
” is thepurchasing (market) price of item i; and R i is theproportion of consumption of item i from ownproduction. The minimum expenditure for food can becalculated from these weighted prices and the amount ofdifferent food items in the bundle. Adding the minimumnon-food expenditures from the Engel’s coefficient, thepoverty line in 1984 was calculated to be 199.6 yuan.For other years, NBS adjusted the 1984 poverty line toaccount for inflation using the national rural retail priceindex. In 1990, however, the prices used to value self-consumed production in calculating incomes changedfrom the planned price to a weighted purchasing price,and the poverty line was readjusted accordingly. Since theearly 1990s, these poverty lines have been the officialpoverty lines and used to estimate the poor populationand to re-determine, in 1993, the nationally designatedpoverty counties for the Government’s 1994-2000targeted assistance program.
economic production, arable land, access to ruralinfrastructure, education an health demographics andrecent natural disasters. The net result of the classificationand reclassification process was the designation of 592national poverty counties.
In retrospect, the “4-in, 7-out” formula could beinterpreted as a Government decision that set an upperrange of poverty - a line above which a county could beconsidered relatively safe from falling back into poverty.This upper range line of 700 yuan for net per capitaincome of the rural community is equivalent to 1,094yuan in 2000 prices.
Consideration of Less Austere Poverty Lines
The national government has considered arguments foracknowledging less austere definitions of the ruralpoverty line. The problem of changing the definition ismulti-faceted. Obviously there is the question of whichline validly reflects income poverty within the PRC. Alsothere is the uncomfortable statistical fact that shouldhigher poverty line be applied, the number of thoseofficially classified as still in poverty would increasedramatically. The political presentational aspects ofadopting a less austere threshold are understandablydifficult. As an example of this difficulty, in 2001 theGovernment, proud of its “8-7” program, gaveconsiderable publicity to proclaiming broad achievementof its objective of enabling all poverty-stricken people inrural areas to have enough to eat and wear by the end ofthe 20th Century. Such broad achievement could not beclaimed if the official line were to be revalued upwards to,for instance, $1 a day mark.
The “$1 a Day” Option
One higher poverty line for the PRC that has been floatedin official and academic forums has been “$1 a day”,meaning originally $1 per day using 1985 purchasingpower parity (PPP) prices rather than market or officialforeign currency exchange rates. PPP theoretically enablesa comparative calculation so that each country’s currencycan be equated by reference to how many units of thecurrency are required to buy a set list of goods. The $1per day figure does not relate to the cost of a basket ofgoods that are absolutely essential to sustain humanlivelihood. Rather the research behind the World Bank’s1990 World Development Report found that coincidentallythe national poverty lines of many of the countriesstudied for the report hovered around the $1 a day markwhen converted into US dollars using 1985 PPP prices.The “$1 a day” has a distinct public relations appeal in theinternational press. For the 2000/2001 World DevelopmentReport, the poverty lines of 33 countries were converted

Understanding Rural Poverty 17
into $ using 1993 PPP prices. The ten lowest poverty lineswere then averaged and the result was $1.08 cents per day.This figure was rounded to $1 per day in 1993 PPP prices.On mathematical grounds, comparative poverty linereadings using the former measure of $1 per day in 1985PPP prices cannot be compared with figures generated byusing $1.08 per day in 1993 PPP prices.
The World Bank in its recent Country Assistance Strategy forthe PRC,4 when covering poverty reduction trends,equated $1 per day in 1993 PPP prices to 879 yuan netincome per capita per annum in 2002 prices. This is 40%less austere than the official rural poverty line. The $1 aday line has international status and credibility. It isembedded in the Millennium Development Goals(MDGs) approved by world leaders at the MillenniumSummit held at UN headquarters in September 2000. It isregularly used in the annual World Development Indicatorspublished by the World Bank. This level of internationalstatus facilitates its use by donors in the PRC withoutdonors appearing to the Government as foreign agenciesfoisting their own metrics on a sovereign countryparticularly when such metrics result in high povertynumbers. There is thus a tendency for the World Bank,the ADB and other donors to draw on the $1 a daybenchmark when poverty mapping and targeting projectbeneficiaries in their assistance programs to the PRC.
There are technical issues with the use of $1 a day todefine PRC rural poverty levels. It was designed formaking international comparisons and derived byaveraging poverty lines in a selection of low incomecountries. The PRC was not included in this selection. Asan averaging exercise of some other countries’ povertylines, it does not reflect a verifiable absolute poverty linewith respect to a basket of goods and services foradequate livelihood within a specific domestic economy.
There is another issue. Controversy abounds over thecorrect PPP conversion factors to use for the PRC.Applying PPP conversion factors used by three differentagencies - the World Bank, UN-ESCAP and the IMF - $1per day converted to 1999 current prices ranged from 725yuan per capita to 1,860 yuan per capita net rural income.An international project is currently underway to try to setstandard PPP conversion factors, but an agreed outcomeis not yet forthcoming. For various reasons, however, thePRC Government has decided not to participate in PPPsurveys. It has, however, confirmed participation in amulti-country capacity building ADB TechnicalAssistance to strengthen national statistical offices in the
collection of data from which PPP comparisons can bemade.
Higher Line using Same Methodology
Recently in 2001, several PRC researchers5 have re-calculated the poverty line using NBS’s own methodology,but updating the base year for determining the content ofthe food bundle. (NBS used 1984). The steps in onecalculation were to:
(i) take the average food bundle consumed by ruralhouseholds with less than 800 yuan per capita peryear as per NBS household survey data;
(ii) price the food bundle in 1995 prices and quantifyits calorific value;
(iii) scale the kilo-calorie per day food bundle back to2,100 and adjust the total price of the food bundleaccordingly;
(iv) convert the price to year 2000 values by usingchanges in the rural consumer price index; and
(v) apply the same Engels coefficient (ratio of foodexpenditures to total expenditures) used earlier byNBS to expand the total price to allow for non-food expenditures.
The results of this calculation were that the poverty line inthe year 2000, expressed in terms of price of a minimumbasic needs consumption package, was 858 yuan - seeTable 1.
Recent research indicates that NBS has decided tocomplement its annual update of the official rural povertyline with a diagnostic line unrelated to benefitentitlements under official poverty reduction programs.6
The conceptual separation of a benefits line from adiagnostic line improves statistical analysis of poverty inpart because it shows the sensitivity of poverty numbersto variations in levels of the line. The method used tocalculate the diagnostic line was almost identical to thatexplained in the previous paragraph. The one point ofdifference is that NBS selected the contents of theminimum food basket with reference to the averagepattern of consumption of various food items by thebottom 25% of the rural households ranked by incomeper capita. This slice of rural consumers encompassedboth the poor and low-income households. By applyingthis method, the resulting NBS diagnostic line came out at865 yuan in year 2000 prices (869 in 2002
4 World Bank. 2003. People’s Republic of China: Country AssistanceStrategy. Fiscal Years 2003-05. Washington, DC.
5 Tang, P., Laiyun Sheng and Pingping Wang. 2001. Poverty Monitoringin Rural China. Beijing.
6 Hussain, Athar. 2001. Draft Report on Poverty Profile and SocialSecurity in China. London: Asia Research Centre, London Schoolof Economics.

Scal
ing
dow
n Q
uant
ities
Food
type
Q
uant
ity
Pric
e C
alorie
s C
alor
ies p
er K
ilo
Exp
endi
ture
N
ew Q
uant
ity
New
Cal
orie
s N
ew E
xpen
ditu
re
(k
g/ye
ar)
(yua
n/kg
) (K
-ca/
day)
(y
uan/
year
) (k
g/ye
ar)
(K-c
a/da
y)
(yua
n/ye
ar)
1. G
rain
Whe
at
82.2
1.14
77
6.3
9.5
93.6
7 77
.5
732.
1 88
.34
Ri
ce
56.8
1.27
53
8.4
9.5
72.1
2 53
.6
507.
7 68
.02
C
orn
22.8
1.00
21
6.5
9.5
22.7
5 21
.5
204.
2 21
.46
M
illet
0.
9 1.
00
9.1
9.6
0.94
0.
9 8.
5 0.
89
Po
tato
52
.6 0.
20
149.
7 2.
9 10
.51
49.6
14
1.2
9.91
Oth
er g
rain
17
.8 0.
94
144.
4 8.
1 16
.73
16.8
13
6.2
15.7
8 2.
Bea
ns
So
ya
1.9
2.00
18
.2 9.
9 3.
70
1.7
17.2
3.
49
H
ybrid
s 0.
1 1.
92
0.6
9.0
0.13
0.
1 0.
6 0.
13
O
ther
bea
ns
0.1
2.10
0.
6 9.
3 0.
13
0.1
0.5
0.12
3.
Bea
n pr
oduc
ts 1.
7 2.
06
4.6
2.7
3.56
1.
6 4.
3 3.
36
4. V
eget
able
s 72
.3 1.
09
49.5
0.7
78.7
5 68
.1
46.7
74
.27
5. S
auce
s 11
.9 0.
84
8.1
0.7
9.97
11
.2
7.7
9.40
6.
Oil
O
il 3.
0 8.
06
74.3
24.7
24.2
6 2.
8 70
.0
22.8
8
Fat
1.6
8.26
38
.2 24
.7 12
.80
1.5
36.0
12
.07
7. M
eats
Pork
7.
4 9.
44
80.0
10.8
69.7
6 7.
0 75
.4
65.7
9
Beef
0.
3 9.
33
1.3
5.3
2.33
0.
2 1.
2 2.
20
M
utto
n 0.
9 10
.63
4.8
5.4
9.35
0.
8 4.
5 8.
82
Po
ultry
0.
6 9.
06
3.6
6.0
5.53
0.
6 3.
4 5.
21
M
eat p
rodu
cts
0.2
6.69
1.
0 5.
8 1.
14
0.2
0.9
1.07
8.
Egg
s 1.
6 4.
99
6.0
3.8
7.88
1.
5 5.
6 7.
44
9. M
ilk
0.8
4.94
5.
7 7.
5 3.
75
0.7
5.4
3.54
10
. Fish
0.
6 5.
30
1.7
3.1
2.92
0.
5 1.
6 2.
75
11. S
ugar
/Can
dy
1.1
4.30
12
.0 10
.8 4.
77
1.1
11.3
4.
50
12. D
rinks
/Bev
erag
es
7.8
4.61
64
.3 8.
2 36
.05
7.4
60.6
34
.00
13. C
akes
0.
9 4.
33
7.5
8.8
3.68
0.
8 7.
0 3.
47
14. F
ruit
5.8
1.55
9.
6 1.
7 8.
99
5.5
9.1
8.48
15
. Nut
s 0.
1 3.
85
1.0
16.8
0.23
0.
1 1.
0 0.
22
TO
TA
L
22
26.7
50
6.43
2100
.0
477.
62
0.94
3105
Sc
ale
fact
or
C
alcu
latio
n of
th
e po
verty
line
:
Use
surv
ey d
ata
to e
stim
ate
the
aver
age
expe
nditu
re sh
are
of fo
od
0.
83
0.
33
Use
the
form
ula
ZL=
ZF+
NF
whe
re N
F=(1
-0.8
32)*
ZF
557.
86
yu
an/y
ear
796.
03
Eng
el C
oeff
icie
nt
0.86
0.
60
Inf
latin
g lin
es to
200
0 In
flatio
n fa
ctor
1
1.07
74
601.
04
yu
an/y
ear
857.
64
1 b
ased
on
rura
l con
sum
er p
rice
inde
x --
PRC
M, 2
001
Sour
ce: T
ang
Ping
, She
ng L
aiyu
n, a
nd W
ang
Ping
ping
. 200
1. P
overt
y Mon
itorin
g in
Rura
l Chi
na. B
eijin
g. P
rices
for s
urve
yed
food
bun
dle
wer
e in
199
5
18 Poverty Profile of the People’s Republic of China
Tab
le 1
: Foo
d B
undl
es o
f Hou
seho
lds
at D
iffe
rent
Lev
els
of In
com
e (H
ouse
hold
inco
me
less
than
800
CN
Y p
er y
ear)

Understanding Rural Poverty 19
prices). How to refer to this diagnostic line was, however,a sensitive matter.
As in the policy environment of any country,Government takes special care of the choice of words ituses to describe its issues, programs and objectives. Since2002, official statements on rural poverty have made adistinction between the absolute poor (those below 629yuan net income per annum in 2002 prices) and lowincome people (those below 869 yuan net income in 2002prices). The term “low income” does not carry the samestigma as absolute poverty. Statistics on the low incomespectrum will not contradict all previous policy andprogress statements on rural poverty reduction. Thelanguage has provided a mechanism for both sets offigures to be released to the public domain. Governmentleaders now talk not only of eradicating absolute ruralpoverty by 2010, but also generating markedimprovements in the livelihood of low income people.
There is an accidental convergence between the WorldBank’s calibration of $1 a day (879 yuan in 2002 prices)taken as an income measure and the PRC’s official cut-offpoint between, on the one hand, the absolute poor andlow income rural population and, on the other hand, therest of the rural community (869 yuan net income in 2002prices). This allows scope for a shared understandingbetween the Government and donors on appropriatebeneficiaries for targeted poverty reduction programs andpro-poor macro-economic growth.
Definition of Rural Poverty by Provincial andLocal GovernmentsThe national government’s budgetary resources forsupporting poverty reduction were inadequate to cover allcounties eligible for poverty county status under either the1986 or the 1994 classifications and some form ofrationing was inevitable. As a result, only a proportion ofeligible candidates were officially classed as nationalpoverty counties. The balance of eligible counties had todo without direct support under the national povertyreduction programs.Fortunately for the rural poor in those overlookedcounties, the task of poverty reduction is seen in the PRCas a responsibility of all levels of government and all unitswithin society. Provincial, prefecture, county, andtownship governments have complemented nationalgovernment efforts by developing and funding separatepoverty reduction programs. They have developed theirown criteria to establish poverty status for counties,townships, villages, and individuals living in counties
Box 2: Rural Poverty Definitions Applied by LocalGovernments in Shaanxi Province in 1998
A township may be considered poor if over 90% of thepopulation has inadequate access to clothing and food.Inadequate is defined as annual net income in 1990 pricesof a family being under 300 yuan per person or regularannual grain supply per person being less than 350 kg. Wherefamilies receive both income and grain (normally graingrown on their own plots is for self-consumption), acalculation is made based on net income and the grain’svalue at market prices.
A county (or equivalent district) may be considered poorif its average annual per capita income is below 700 yuanper person or annual grain production is below 700 kg perperson.
A county (or equivalent district), township, or villagemay be considered poor if, after calculating the followingcriteria, it receives a total score less than 85 out 100:
(i) 2.5 mu of farmland for each poor farmer (maximumscore is 15);
(ii) adequate water for people and livestock (maximumscore is 15);
(iii) 90% of population have access to convenienttransportation (maximum score is 15);
(iv) 90% of population have access to electricity(maximum score is 15);
(v) more than 30% of poor families have at least onesource of stable income that will provide them withat least 70% of their food and clothing requirementsin the two succeeding years (maximum score is 10);
(vi) 80% poor families have one laborer who hasmastered at least one practical skill (maximum scoreis 8);
(vii) 85% of the families practice birth control (maximumscore is 8) or less than 2% exceed the allowed numberof children (maximum score is 7); and
(viii) village leadership of groups responsible for the pooris deemed qualified after on-the-spot inspections(maximum score is 10).
other than those designated as national poverty counties.7
Between 1986 and 1988 the provinces designated a total
7 Many local criteria reflect fiscal reality at the local level and are morerelaxed than national criteria to enable more people to receive benefitsfrom poverty classification. For example in 1996, Yunnan set a standardof 300 yuan compared to the national 530 yuan poverty line. Richerprovinces may set local poverty lines above the national level (Zhu,Ling. 1998).

20 Poverty Profile of the People’s Republic of China
of 372 provincial poverty counties and the eligibilitymeasures they used varied between average annual netincomes per capita of 200 and 500 yuan. NorthernShaanxi Province provides an example of the range oflevels and criteria applied within a province in 1998 fortargeting their own poverty reduction programs - see Box2.
The Government’s 21st Century Definition ofRural PovertyIn May 2001, the Government adopted its new ten-yearpoverty strategy (2001-2010). The pockets of ruralpoverty that remained at the end of 2000, as defined bythe on-going national poverty line adjusted for inflation(625 yuan per capita net rural income in 2000 prices)amounted to 32.1 million people. Under the new strategy,the Government has designated key counties for nationalpoverty reduction development work. As at the end of2002, 592 key counties had been selected, most of themwere national poverty counties under the previous systembut a number were new. These key counties and poorvillages in non-key counties are eligible for nationalpoverty funding. Selection of these key counties wasbased not just on income, but also on social conditions,geography, and other physical conditions. Priority wasgiven to remote and mountainous areas, minority areas,and severe poverty areas.
Unlike the use made by Government of the previousnational poverty county designations, the selection of keycounties was only the first step in determining whereGovernment assistance should flow. Because the nationalgovernment is adamant about improving the targeting ofits poverty reduction efforts, the second step is to focuson poverty villages and households within the keycounties. Thus the definition of poverty villages andpoverty households has become especially important.
As a result of an advisory technical assistance financed in2001 by the ADB8, several steps were proposed andaccepted by the Government as a framework foridentifying and classifying poor villages and households tobetter target rural poverty reduction assistance. Thosesteps are:
Step 1: Developing Indicators of Poverty .Indicators should be developed through aparticipatory process that engages differentstakeholders. The most important issue is to let thosewho are the poor define what constitutes being poor.
8 ADB. 2002. Methodology for Development Planning in Poverty Blocksunder the new poverty strategy in PRC. Manila.
This methodology suggests eight indicators acrossthree broad categories (See Step 2).
• Step 2: Weighting Different Indicators.Different indicators have different weights whenmeasuring the degree of the poverty. Thismethodology introduces participatory weightingmethods that allow the poor, particularly women, toshare in the process. The weighting is to be done firstin respect of each indicator and then in respect ofeach category. Field trials using participatoryprocesses have provided the example shown in Table3.
• Step 3: Defining the Range of Each Criterion ofVillage Poverty at the County Level. The degree ofvillage poverty is scaled from 1 to 5. What constituteseach of the values from 1 to 5 for each of theindicators is to be determined through a participatoryprocess at the county level. The cash incomeindicator, for instance, may range from 200 yuan percapita annually (which would be regarded as a scale of“1”) to 1000 yuan per capita (which would beregarded as a scale of “5”). The county will then havea standardized enumeration system for calibrating thedata supplied by participatory processes at villagelevel. Table 4 shows a sample framework withinwhich values can be assigned across the scaled rangeof each indicator.
• Step 4: Collecting Village Poverty Data. Datacovering all the criteria are collected through aparticipatory process at the village level.
• Step 5: Calculating the Integrated VillagePoverty Index (IVPI). Expressed in its mostsimple form, IVPI = W x B where:
W = the weight of the indicators, and
B = the score of the indicators using a range of 1 to 5
In practice the calculation involves several steps asweighting is first applied to each indicator within itscategory (living situation, or life and productionconditions, or health and education) and then appliedto each of the three categories.
• Step 6: Developing a Village typology. Villages aredivided into five groups according to the level ofwealth defined by their respective IVPI scores.Villages in the county can then be mapped accordingto their respective groupings.

Understanding Rural Poverty 21
Category of indicators Indicators
Living situation Possession of grain crops /year/person
Net cash income/year/person
Quality of housing
Life and production conditions Drinking water supply
Electricity supply
Transportation
Health and education Women’s health
School drop out rate of girls
Indicator Category Weight Indicators Weight
Living situation 35% Possession of grain crops
/year/person
37%
Net cash income/year/person 39%
Quality of housing 24%
Life and production
conditions
33% Drinking water supply 41%
Electricity supply 24%
Transportation 35%
Health and education 32% Women’s health 50%
School drop out rate of girls 50%
Indicators Unit Values across a range of 1 to 5
1 2 3 4 5
Grain
possession
Kg
Cash income Yuan
Housing %
Drinking water %
Electricity %
Transportation %
Women’ health %
School drop out
rate of girls
%
Table 2: Suggested Criteria of Poverty Assessment for Village Targeting
Table 3: Example of Weighting the Criteria by Participatory Processes
Table 4: Assigning Values across the Range for Each Criterion

22 Poverty Profile of the People’s Republic of China
• Step 7: Selecting Villages. Based on the typologyand the resources available for poverty reductionfrom all levels of government, a selection can bemade of the villages to be supported by povertyreduction activities. This methodology is designed toensure that the villages covered by governmentassistance programs represent the poorest villages inthe county.
• Step 8: Identifying and Classifying PovertyHouseholds. Village committees in the selectedpoorest villages are to arrange a highly participatoryprocess through which the village residents prepare amatrix profiling poverty in their village. Thosesuffering from poverty should be divided into fourgroups (relief receivers, poorest, normal poor and therelatively poor). Each category could be profiled interms of per capita income, grain or foodconsumption, the number of able working agepersons in the household, and their potential forfurther development. The residents may then preparea complete name list of households that fit undereach category. This name list, having beentransparently determined, facilitates accurate targetingof poverty reduction programs at poor households.
REDUCTION IN THE INCIDENCE OF RURALPOVERTY
Rural Poverty Reduction in the Three StagesDefined in the Government’s White Paper of2001The end of the century on 31 December 2000 marked theculmination of twenty three years of deliberate and highlyfocused effort by the central and local governments torelieve rural poverty. In October, 2001 the Governmentissued a white paper reviewing the content andachievements of its past rural poverty reduction programsand outlining a broad framework for removing theremaining remnants of rural poverty in the early years ofthe 21st Century.
The Government categorized recent rural povertyreduction into three stages: (i) 1978-1985; (ii) 1986-1993;and (iii) 1994–2000 - see Figure 1.
The first stage (1978-1985), during which 125 millionpoor rural people were lifted out of poverty, was largelydriven by structural reform of rural industry and changesin agricultural pricing policies that provided better termsof trade for farmers. This provided new marketopportunities for the poor. To understand the immensity
of these reform measures, it helps to reflect on the systemthat was in place before the reforms.
Since 1958, agriculture had been operating under thecommune system. The rural domain of today’s “township”(xiang) was the area covered by a commune. The communecomprised production brigades that are now transformedinto “administrative villages”. Natural villages wereorganized into production teams. The communes wereexpected to achieve a high level of self-sufficiency. Eachcommune established a range of agro-industrial plants tosupport its own agricultural production. Under commandplanning, many industrial factories were decentralized tothe countryside. Except for private plots usually confinedto a small area around each farmer’s house, privateownership of agricultural land had been replaced bycollective ownership. Land-owning collectives equated to aproduction team (natural village) or a subgroup thereof.Except for the private plots, all agricultural work was donecommunally. Commune members were guaranteed anequitable share of the commune’s grain production. Netrevenue from sales both to meet the Government’s quotaand of surplus produce were divided among communemembers on the basis of labor points which measured eachhousehold’s labor input to the commune each year.The commune system had both advantages anddisadvantages. The primary disadvantage was the lack ofmarket-based incentives to use communal land andresources diligently so as to maximize production. Severalamong the Government’s leadership noted that farmersdevoted much of their energy to their very small privateplots. Experiments were authorized in Sichuan in 1976to allow up to 15% of commune land to be farmed privatelyand the produce from them to be sold in privatemarkets at non-controlled prices. As a result, grain
Figure 1: Three Stages of Poverty Reduction
0
50
100
150
200
250
1978
1980*
1982* 19
84198
6198
8199
019
9219
94199
6* 1998
2000
* Because of gaps in the official data, some years in this time series have beenmodeled. These years are asterisked
Rur
al P
oor
(mill
ions
)
3rd Stage2nd Stage1st Stage

Understanding Rural Poverty 23
production in Sichuan jumped by 24% between 1976 and1979. 9 The process of diluting and eventually dismantlingthe commune system was officially begun in December1978 at the Third Plenum of the 11th Central Committeeof the CCP, but change was gradual, taking until 1983 tocomplete it in broad terms.
The same Third Plenum made a milestone decision onagricultural prices that had a massive positive impact onreducing the level of rural poverty. The Plenum decidedthat the state prices for: (i) quota grain produced in the1979 harvest would be raised by 20%; and (ii) the price ofgrain produced in excess of the quota would increase by50%. Furthermore, it decided that the prices of majorfarm inputs produced by State Owned Enterprises wereto be cut by 15%. The application of this pricing policyoccurred against a background of expanding village fairsand free markets that provided farmers with alternativesto selling their produce at the State controlled prices.Following on the Sichuan experience and the outcomes ofthe Third Plenum, the period 1978 to 1983 sawexperimentation with a new agricultural productionresponsibility system that challenged the communestructure. Variations of the new system included:
(i) labor contracts between the land-owning collectives(Party A) and small groups of families, individualhouseholds and even individuals (Party B) to carryout itemized farm work towards fixed targets interms of quantity, quality and cost. Achievementand over-achievement were rewarded by higherwork points which meant more cash and food;
(ii) output contracts under which households agreed toproduce a given amount of crop on a specifiedarea. Households were allowed to keep and profitfrom the surplus but were liable to make up deficitsif they did not meet the target; and
(iii) net-output delivery contracts where individualhouseholds committed to meeting state quotas andproviding a pre-defined additional quantity ofoutput to the collective in return for return forcontrol over collectively owned farm equipmentand animals.
By 1984 the rural household responsibility contractsystem had effectively replaced the communes. Buildingon the experiments, households contracted with theirland-owning collective (of which they were members) tomeet minimum production targets in return for a 15 year
9 Spence, Jonathon D. 1991. The Search for Modern China. New York.W.W. Norton and Company.
use right over an equitable share of the collective’s arableland. Generally, land-owning collectives held some oftheir arable land in reserve for future contingencies andallocated the balance to their members on an equitablebasis considering land area, quality and type (paddy versusdry land). The 15 year contracts gave security tohouseholds to make longer-term investments in farmingtheir land. Under the reformed policy, land-owningcollectives were expected to conduct interim reallocationsof land during the 15 year contract period wheneverchanges in the village population (births, marriages,inwards and outwards migration and deaths) seriouslyundermined the principle of equitable distribution.
Prior to the 1978-1985 stage, more than half of the ruralpopulation was considered to be living in severe poverty.In 1977, according to Ministry of Agriculture (MOA)data, the rural net income per capita in 22.5% of thePRC’s counties was below 50 yuan. In one third of thesecounties it was below 40 yuan. The MOA regarded 40 to50 yuan average per capita of collectively distributed in-come under the commune system as a benchmark forpoverty because 40 yuan was equivalent to 150 kg ofwheat or 200 kg of rice in late 1970s prices. From 1978onwards, the combination of higher prices for agriculturalproducts, lower prices for agricultural inputs, contractproduction arrangements which gave householdseffective, while limited, proprietorship over land, and theprofusion of free markets provided the dynamics fora massive reduction in rural poverty. As a result of thesefactors, agricultural output grew at an extraordinary paceof an annual average of 8.8% between 1978 and1984. Per capita incomes of rural residents increased132% over the period. The increased agricultural output
02468
1012141618
Rur
al P
oor
(Mill
ions
)
1978-85 1986-93 1994-2000
Stages
Figure 2: Reduction per annum per Stage

24 Poverty Profile of the People’s Republic of China
accounted for 15.5% of total increased incomegenerated.10
During this first stage (1978-1985), the number of ruralpoor, as measured by the official poverty line, droppedfrom 250 million in 1978 to 125 million in 1985, or by17.86 million on average annually. As Figure 2 shows, thisaverage annual reduction was the highest of the threestages - and was almost three times greater than each ofthe other stages. During the same period the average percapita calorie intake improved from 2,300 per day to2,454. 11
The second stage, 1986-1993, commenced with theshock of an increase in the number of rural poor by 6million according to the Government’s official count (seeFigure 3). This heralded a plateauing of the immediatepro-poor benefits of the agricultural production reformsand the new market opportunities that superceded thecommune. This was also a time of unusual macro-economic dynamics. Driven in large part by theGovernment’s sectoral policies, rapid economic growthwas occurring in the coastal provinces while investment inagriculture was declining. The result was an accelerationof the disparities between the eastern coastal areas andthe central and western regions. Such rapid growth underconditions of a dual pricing system heightened demandfor that scarce portion of construction goods availablefor sale on the free market. Marked expansion of moneysupply fanned inflationary pressures with one outcomebeing an increase in farm input prices. Agriculturalprocessing and other ancillary enterprises, formerlyembedded within the commune structure, were nowfledgling town and village enterprises (TVEs) seeking tobecome efficient and profitable - many in search of newcapital and improved technology. The townshipgovernments that replaced commune administrationswere keen, for reasons of modernity and the prospect ofincreased tax revenues, to facilitate the growth of theirTVEs.
Against the backdrop of growing disparities, theGovernment recognized that specific povertyinterventions were necessary to reinforce the impact onpro-poor economic growth on poverty reduction. Toaccomplish this, the Government embarked on a boldpoverty reduction strategy to focus national povertyreduction funding and investment on 331 speciallydesignated “national poverty counties” with the intent ofaccelerating overall regional development in these areas.
With the launch of this initiative in 1986, three primarymodalities for driving poverty reduction in the keycounties were regularly financed by the CentralGovernment: (i) subsidized credit; (ii) food for work; and(iii) development funds. They are described later in thetext.
This program needed institutional over-sight so in 1986the Government established a Leading Group of theState Council for the Economic Development of Poverty-stricken Areas. (In 1993, it was renamed as the StateCouncil Leading Group for Poverty Alleviation andDevelopment, referred to by the acronym LGOP). TheLGOP is chaired by a Vice-Premier and comprises vice-ministers from relevant ministries, presidents fromrelevant national government bureaus and commissions,and directors of relevant agencies and Government-organized Non-government Organizations (GONGOs).
As reflected in the statistics on year-on-year changes inthe rural poor head count (see Figure 3), the second stagehad mixed results. For two years (1986 and 1989), thenumber of people living in poverty increased by sixmillion. This represented a year-on-year reversal ofpoverty reduction by 4.8 and 6.3% respectively. Also, thepace of poverty reduction slowed in 1991 and 1992,achieving only 2.9 and 3.0% improvement year-on-year.There are several reasons for the years with low or nega-tive progress. In 1988, LGOP adjusted itsprogram priorities from households to local economicentities because it assumed that assistance to the latterwould expand employment for the rural poor andincrease local demand for their produce. In practice,however, this change of policy diverted poverty reductionresources and consequential new opportunities away from
Figure 3: Second Stage Annual Reduction in Rural Poverty
(10.0)
(5.0)
0.0
5.0
10.0
15.0
20.0
25.0
30.0
1986 1987 1988 1989 1990 1991* 1992 1993*
Years
Rur
al P
oor
(mill
ions
)
10 Xie, G. 1988. Comments on Price Change of Agricultural Products.Rural Economy Sketch No 1.
11 NBS Rural Socio-economic Investigation Team. 2000. China’s RuralPoverty Monitoring and Evaluation Report. Beijing: China StatisticsPress.

Understanding Rural Poverty 25
poor households to enterprises and relatively rich farmers.The direct effects of the programs on reducing poorhouseholds were diluted rather than strengthened. Alsocontributing to the slow down was the fall in real terms ofthe amount of poverty funding between 1988 and 1991.
Between 1988 and 1991 in particular, macroeconomicfactors were at work which made poverty reduction moredifficult. Inflation was running at the highest levels eversince the formation of the PRC. Monetary policy wassubject to an unresolved tension between servingcontradictory objectives of full employment and pricestability. Fiscal policy was confronted with a growingbudget deficit that Government was trying to prune bytightening up on expenditure. The rural consumer priceindex was rising faster than the prices paid for agriculturalproducts. Rural net income per capita fell between 1988and 1989. There was only marginal year-on-year growthin rural net income per capita in 1990 and 1991. Overallduring these four years, the macroeconomic environmentwas more unsettled and less conducive to rural povertyreduction.
Despite the year-on-year swings, however, significantprogress was made over the eight years during the secondphase with the number of rural poor dropping from 125million to 75 million12 , representing an average annualdecrease of 6.25 million persons. Compared to theprevious period, the average annual pace of povertyreduction slowed from 9.4%to 6.2% as now more difficultpoverty conditions were being addressed.
In the third stage, 1994-2000, the geographic focus ofthe poverty relief program was tightened by using a morerigorous definition of the poverty line and using it toidentify eligible counties for “national poverty county”status. Poverty reduction modalities were refined anddiversified to tackle even more difficult typologies ofpoverty. Aware of the dilution of the poverty reductioneffort through the flow of funds to TVEs and better offfarmers, the Government, after 1996, shifted its programtarget from poor regions to poor villages and households.This stage was called the “8-7” program because itsobjective was to alleviate poverty from the remainingapproximately 80 million rural poor over a 7 year period -that is by the end of 2000. Considerably more resourceswere deployed by the Government compared to thesecond stage. Between 1994 and 2000, the CentralGovernment’s poverty reduction inputs doubled in realterms -see: Table 5.
Over the same period, international donors, and NGOs -both international and domestic - had added annuallybetween 26 and 56% over and above the national andprovincial governments’ inputs. At the macro-policy level,the Government gave more priority to the developmentof the central and western regions where the rural poorare concentrated.
As shown in Figure 4, the increased effort and sharpenedpolicies in Stage 3 resulted in a more regular andimpressive annual reduction in the number of rural poor,when compared top Stage 2. In several of the Stage 3years, annual reductions were around 8 million. Theannual reduction is the final year was disappointing,however. Unlike the previous stage, there was no year-on-year absolute increase in the number of rural poverty. Bythe end of 2000 the number of rural poor had dropped to32.1 million. This represents an average annual decline inrural poverty of 6.1 million and a marked increase in thepace of poverty reduction to an average lessening of11.4% per annum compound.
12 The White Paper quotes 80 million as the rural poverty headcountin 1993. NBS figures show poverty down to 80 million by 1992.Most recent figures quoted by the Executive Director of the ChinaFoundation for Poverty Alleviation show the 1993 figure as 75million, and this figure is used here.
Figure 4: 3rd Stage Annual Reduction in RuralPoverty
0.0
1.0
2.0
3.0
4.0
5.0
6.0
7.0
8.0
9.0
1994 1995 1996* 1997 1998 1999 2000
Years
Rur
al P
oor
(mill
ions
)
Table 5: Increase in Government Expenditure onPoverty Reduction between 1994 and 2000
* Government expenditure is taken from the NBS China Statistical Year Book
Year Yuan -million
(current)
Yuan -million
(constant1997
prices)
USDMillion
(curren-t)
Percent
ofG D P
Per cent ofGovernme-
ntExpenditur-
e
19942000
9,79026,500
12,72227,180
1,1803,193
0.21-%
0.30-%
1.69%1.67%

26 Poverty Profile of the People’s Republic of China
Throughout this third stage, the Government’s specialpoverty programs and preferential policies have, in themain, been targeted at designated “national povertycounties” and the rural poor living therein. The figuresreported in the Government’s White Paper and in thissection cover the reduction of poverty in national povertycounties and all other counties. Figure 5 shows officialrural poverty numbers by county type from 1997 throughto 2000 – earlier figures were not readily available. Justunder half of the rural poor live in counties that have notbeen classified as national poverty counties. The numbersgiven for poverty reduction in these two categories ofcounties raise an important analytical question. For 1997to 2000, progress with poverty reduction was about thesame in rate and absolute number in both categories (seeFigure 5 and Figure 6). Yet it was “national povertycounties” that received the bulk of the support providedunder the Government’s poverty program. Why waspoverty reduction equally successful in the non-nationalpoverty counties when they were not specifically targetedby this program? The volume of resources deployed byprovinces and lower levels of local government to othercounties that they classified as poor does not sufficientlyanswer this question.Several factors would have brought this about. Robusteconomic growth had a major impact on povertyreduction generally, notwithstanding targeting. Probablythe targeted effort was subject to evaporation away fromthe poor in national poverty counties. The povertyafflicting these groups may be more inextricable that thatconfronted by the poor in non-poverty counties.Furthermore the targeted effort may not have givensufficient emphasis to integrating the poor into existingand new growing markets through improved roadnetworks linking to their villages.
Irrespective of how the official statistics are interpreted,the PRC’s overall achievements in reducing poverty havebeen sustained and dramatic. On the basis of theGovernment’s poverty line, from 1978 to the year 2000,the incidence of poverty amongst the rural populationdropped from 30.7% to around 3.4%. This is anexceptionally good performance. During this periodmacroeconomic performance was also exceptional withthe economy growing at 9% per year. The combination ofsustained, rapid economic growth, political leadership thatgave priority to poverty reduction and targeted povertyreduction programs all contributed to this goodperformance.
Progress Toward the Millennium DevelopmentGoal on Poverty
At the Millennium Summit in September 2000, theworld’s leaders set eight Millennium Development Goals(MDGs). These eight MDGs represent a specific missionagreed between developed and developing countries tocreate, in the words of the Millennium Declaration, “anenvironment at the national and global levels alike whichis conducive to development and the elimination ofpoverty”. Together, the MDGs represent a wholesaleattack on poverty, its causes and manifestations.
The first MDG is to eradicate extreme poverty andhunger. This generalized statement is reformulated astwo specific targets. These are to:
(i) halve, between 1990 and 2015, the proportion ofpeople whose income is less than $1 a day; and
(ii) halve, between 1990 and 2015, the proportion ofpeople who suffer from hunger.
26
24
22
20
18
16
17
15
0
10
20
30
40
50
Mill
ion
per
son
s
1997 1998 1999 2000
Figure 5: Distribution of Rural Poor by County Typeper Official Poverty Line
National Poverty Counties All Other CountiesSource: NBS. 2001. Poverty Monitoring Report of Rural China. Beijing: ChinaStatistics Press.
Source: NBS. 2001. Poverty Monitoring Report of Rural China. Beijing: ChinaStatistics Press.
Figure 6: Pace of Rural Poverty Reduction byCounty Type
15.4%
5.6%
16.7%
20.0%
6.3%
18.2%
0.0%
5.0%
10.0%
15.0%
20.0%
25.0%
97->98 98->99 99->2000
Pac
e o
f R
edu
ctio
nNational Poverty Counties All Other Counties

Understanding Rural Poverty 27
There are two indicators that enable an assessment of thePRC’s progress to the first MDG, target 1. The first is toextract a headcount over time of the number of ruralresidents with per capita incomes below US dollar per day,in PPP values. The resulting headcount provides ameasure of the PRC’s rural poverty compared to that ofother nations. As mentioned earlier, the measure is not asubstitute for a country’s own benchmark for domesticpoverty based on actual domestic conditions. It has,however, become an internationally accepted operationalmeasure of poverty. The second indicator is theGovernment’s official poverty line which comprises ofthe income (cash and kind) necessary to overcome hunger- referred to as the “food poverty line” and an allowancefor non-food essential for daily living. This line is abouttwo thirds of the US dollar per day internationalcomparison line.Table 6 sets out both these indicators for the PRC for theperiod 1990 to 2000. It is clear that by 1996, theproportion of rural people with incomes less than $1 aday in 1990 had been halved.
By 1998, the proportion of people suffering from hunger,as measured by the Government’s official poverty linewhich encompasses the cost of a minimum food basket,had dropped to half or less of that observed in 1990.Supporting this reading, the prevalence of underweightchildren under 5 years of age had, by 1998, been halvedfrom its 1990 level of 21%. However another measure –that of the rural population unable to consume theminimum dietary energy needs - suggests that by 2000 the1990 incidence of hunger had been cut by one third.While the PRC can rightly claim very early achievement ofthe first MDG, what is cause for continued effort on theGovernment’s part is the stalling, after 1997, in thereduction of the proportion of rural people with incomesless than $1 a day. The same stalling is not evident withprogress measured by the domestic poverty line. Thereason for this may be that the PRC’s success in reducingpoverty has helped large numbers of people cross thedomestic poverty line which has not flowed through tolifting a similar number of people across the higherinternational comparison line of $1 a day.
Table 6: Progress toward Millennium Development Goal 1 Target 1
Looking at the other MDGs (see Table 7), compared to1990 the PRC is at least half way to removing its genderdisparity in primary education. By 2001, the PRC wasmoving steadily towards two health-related goals - theunder-five mortality rate had been reduced by one quarterand the maternal mortality rate by over a half.
Nonetheless there are some goals and targets whereprogress has been slow. This has been the case in
combating HIV/AIDS, eliminating gender disparity insecondary education, improving the proportion of thepopulation with access to safe drinking water andreversing environmental degradation.
The commendable progress towards achieving the MDGshas in no way reduced the PRC’s resolve to eradicatepoverty. The PRC’s new leadership under President HuJintao and Premier Wen Jiabao has reaffirmed the
Source: ADB staff compilation from PRC and World Bank statistics.
Year Ruralpopulation
(million)
International Measure of Poverty($ a day in PPP per capita net rural
income)
Domestic Measure of Absolute Poverty(400 CNY in 1993 prices per capita net rural income)
Number of ruralpoor (million)
Incidence ofpoverty (percent
of rural population)
Poverty Line(CNY)
Number of ruralpoor (million)
Incidence ofpoverty (percent
of ruralpopulation)
1990 896 280 31.3 300 89 9.9
1991 905 250 27.6 304 94 10.4
1995 917 188 20.5 530 65 7.1
1996 919 128 13.9 580 58 6.3
1997 915 120 13.1 640 50 5.5
1998 920 110 12.0 635 42 4.6
1999 922 100 10.8 635 34 3.7
2000 928 105 11.3 625 32 3.4

28 Poverty Profile of the People’s Republic of China
Goals and Targets Status in the PRCGoal 1: Eradicate Extreme Poverty and HungerTarget 1: Halve, between 1990 and 2015, the proportion of peoplewhose income is less than one dollar a day.
• Rural population below $1 per day: 31.3% in 1990; xxx11.5% in 2000a
Target 2: Halve, between 1990 and 2015, the proportion of people whosuffer from hunger.
• Undernourished people: 16.0% in 1990; 9.0% in 2000
Goal 2: Achieve Universal Primary EducationTarget 3: by 2015, children everywhere, boys and girls alike, will be ableto complete a full course of primary schooling.
• Net primary enrolment ratio: 97.0% in 1990; 93.0% inxxx2001b• Youth literacy rate: 95.3% in 1990; 97.9% in 2001
Goal 3: Promote Gender Equality and Empower WomenTarget 4: Eliminate gender disparity in primary and secondary educationpreferably by 2005 and to all levels of education no later than 2015.
• Ratio of girls to boys in primary education: 86% inxxx1990; 92% in 2001• Ratio of girls to boys in secondary education: 83% inxxx2001
Goal 4: Reduce Child MortalityTarget 5: Reduce by two-thirds, between 1990 and 2015, the under-fivemortality rate.
• Under-5 mortality rate (per 1,000 live births): 49 inxxx1990; 39 in 2001• Infant mortality rate (per 1,000 live births): 38 in 1990;xxx31 in 2001
Goal 5: Improve Maternal HealthTarget 6: Reduce the maternal mortality ratio by three-quarters between1990 and 2015.
• Maternal mortality (per 100,000 live births): 88.9 inxxx1990; 39 in 2001.• Proportion of births attended by skilled health workersxxxin hospital births: 50.6% in 1990; 89.0% in 2001
Goal 6: Combat HIV/AIDS, Malaria, and Other DiseasesTarget 7: Have halted by 2015, and begun to reverse, the spread ofHIV/AIDS.Target 8: Have halted by 2015, and begun to reverse, the incidence ofmalaria and other major diseases.
• HIV/AIDS incidence rate (age 15-49) as of 2001 isxxx0.11%, around 790,000 cases• Malaria (per 100,000 people): 1 in 2000• Tuberculosis (per 100,000 people): 107 in 2001
Goal 7: Ensure Environmental SustainabilityTarget 9: Integrate the principles of sustainable development intocountry policies and programs and reverse the loss of environmentalresources.
• Land covered by forest: 15.6% in 1990; 17.5% in 2001• Carbon dioxide emissions (per capita): 2.1 tons inxxx1990; 2.3 tons in 1999
Target 10: Halve, by 2015, the proportion of people without sustainableaccess to safe drinking water.
• Rural population with clean water source: 60% inxxx1990; 66% in 2000• Urban population with clean water source: 99% inxxx1990; 94% in 2000
Target 11: Have achieved, by 2020, a significant improvement in thelives of at least 100 million slum dwellers
• Urban population with access to improved sanitation:xxx56% in 1990; 69% in 2000
Goal 8: Develop a global partnership for developmentTarget 12: Deal comprehensively with the debt problems of developingcountries through national and international measures
• Total debt service (as % of exports of goods andxxxservices):10.6% in 1990; 4.2% in 2001
Target 13: Provide access to affordable essential drugs in developingcountries
• Population with sustainable access to affordablexxxessential drugs: 80-94% in 1999
Target 14: Make available the benefits of new technologies, especiallyinformation and communications
• Telephone mainlines and cellular subscribers (per 100xxxpeople): 0.6 in 1990; 24.8 in 2001
a Based on World Bank. 2003. China Country Assistance Strategy 2003-2005. Washington, DC.b According to the UNDP. 2003. Human Development Report 2003. New York, data are preliminary and subject to revision.Source: UNDP. 2003. Human Development Report 2003. New York
Table 7: Progress Toward the Millennium Development Goals

Understanding Rural Poverty 29
Government’s priority concern with reducing poverty andreiterated that 2010 is the deadline for eradicating extremerural poverty. A silent revolution is occurring in the waypoverty is being tackled. Top down planning of povertyprograms are being replaced by highly participatoryprocesses involving the poor themselves and those thatservice the poor at local levels. It is now accepted that thepoor are best placed to define poverty and their needs toredress poverty. The principle of listening to the voices ofthe poor has become policy.
Issue of Consistency of Official Data on RuralPovertyThe official figures quoted in the section above on theextent and pace of rural poverty reduction are drawnfrom two main sources: (i) the Information Office of theState Council of the PRC’s White Paper on TheDevelopment-Oriented Poverty Reduction Program for RuralChina, 2001; and (ii) recent annual editions of NBS’sPoverty Monitoring Report of Rural China. For the yearsbefore 1994, these figures differ from the figures fromanother official source quoted in a major research reportprepared under the auspices of IFPRI by Fan Shenggen,Zhang Linxiu and Zhang Xiaobo on Growth, Inequality andPoverty in Rural China: The Role of Public Investment, 2002.These researchers took their data from various annualreports of the China Agricultural Development Report. Theydeveloped a sophisticated model for quantifying the effectof different development inputs on poverty reduction andother key indicators of progress. They built the povertyreduction part of their model on data disaggregated toprovincial level for the seven years 1985-1989, 1991 and1996. The official figures they quote for total ruralpoverty numbers in each of those seven years arecompared in Table 8 with the White Paper and NBS data.
In three of the seven years shown in Table 8 there isapproximately a 15% difference in the rate of year-on-year poverty reduction between the two sets of figures.Fan, Zhang and Zhang were acutely aware of the problemof variations in data and so they cross-checked theirconclusions using yet another set of alternate povertyfigures derived by A. R. Khan. Their conclusions weresustained, but they note that the trends in Khan’s figuresreflected those of the figures they were using. The samemay not be true of the two sets of figures in Table 8. Suchdata differences raise a reliability risk when derivingeconometric models to analyze poverty reductionsensitivities.
Alternative Views on the Extent of Rural PovertyReductionSeveral donors and researchers consider the officialfigures understate poverty because the national povertyline is too severe. For instance, Khan and Riskin takeissue with the NBS over the appropriate components ofnet income of rural households.13 They also argue that theCPI used by NBS to adjust the real value of the povertyline over time tends to overestimate poverty reduction. Incalculating their poverty line, Khan and Riskin closelymirrored the NBS methodology with two refinements.The value of the minimum food package was calculatedusing the estimated actual cost of food energy consumedby the observed rural income group closest to the povertythreshold. This allowed for consumer preference. Theproportion allowed for non-food expenditure was alsobased on the consumption pattern of the observed ruralincome group closest to the poverty threshold, although
13 Khan, R. Azizur, and Carl Riskin. 2001. Inequality and Poverty in Chinain the Age of Globalization. New York. Oxford University Press. Partof this research was funded by the ADB.
Table 8: Variation in Official Data on Poverty Reduction
Year Number below Official Rural Poverty Line
China AgricultureDevelopment Reports
White Paper and NBSChina Rural Poverty
Monitoring andEvaluation Reports
MillionRural
Persons
%Decrease
overPreviousYear orPreviousEntry in
Table
MillionRural
Persons
%Decrease
overPreviousYear orPreviousEntry in
Table
19851986198719881989q
1991q
1996
1985 to1996
96979186103q95q58
-12.9-1.06.25.5
-19.8
7.8
38.9
39.6
12513112296
102q83q58
2.3-4.86.9
21.3-6.3
18.6
30.1
53.6

30 Poverty Profile of the People’s Republic of China
judgments had to be made about which assumptions toapply. One set of assumptions produced a figure that theyregard as the threshold for extreme poverty. Anotherproduced a higher figure that, for them, set the thresholdfor broad poverty. They also set an intermediate thresholdmarking what they called deep poverty.
Type of Poverty Line
(all income-based)
1988
RMB
1995
RMB
2000
RMB
Official Poverty Line 250 530 625
Extreme Unadjusted 368 810 955
Deep Unadjusted 412 926 1,092
Broad Unadjusted 526 1,157 1,364
Table 9: Khan and Riskin Poverty Lines (RMB)
Note the 1988 figure for the monetary value of the Official Poverty Line hasbeen read approximately from a NBS graph.
Table 9 sets out the Khan and Riskin calculations for 1988and 1995. Unadjusted means that they have used the sameCPI deflator as NBS. To add a contemporary perspectivetop the Table, the calculations have been extrapolatedforward to 2000 values by using the same CPI deflator asNBS.
The application of their poverty lines both unadjusted andadjusted by what Khan and Riskin conclude to be a moreappropriate CPI deflator for the years 1988 and 1995produces the figures shown in Table 10.
Even taking Khan and Riskin’s lowest poverty threshold- that is for what they term as extreme poverty - theirestimate of poverty numbers in 1995 is 70% higher thanthe official figure. More challenging than this is theirestimates of progress in rural poverty reduction between1988 and 1995. The official statistics show a reductionof 32% over this period. However Khan and Riskin,after adjusting for their alternative CPI deflator, find thatthe rural poverty reduction between 1988 and 1995 wasonly 17% - a little more than half of the official NBSfigure.
As mentioned earlier, NBS has recently derived a secondrural poverty line that it uses solely for diagnosticpurpose. The official description of this line is that itencompasses both the rural absolute poor and the lowincome people. NBS did this as an exercise totallyseparate from its responsibility of updating the originalpoverty line each year so as to maintain its real value incurrent prices. The NBS calculation of a separatediagnostic rural “poverty and low income” line took asimilar approach to Khan and Riskin by allowing for morecurrent consumer preferences in the composition of theminimum food basket, on the basis of consumptionpatterns of the bottom 25% (by income) of ruralhouseholds. This diagnostic line equals 865 yuan percapita net income in year 2000 prices (869 yuan in year2002 prices). The results of applying this diagnostic linefor 1998, 1999 and 2000 are set out in Table 11.
Item Official Khan and Riskin Estimates and Extrapolations therefrom*
Figures Extreme
unadjusted
Extreme
adjusted
for CPI
Deep
unadjusted
Deep
adjusted
for CPI
Broad
unadjusted
Broad
adjusted
for CPI
1. Rural Poverty Incidence %
1988 11.1 16.9 15.5 22.6 20.9 35.1 32.7
1995 7.1 12.1 12.1 17.4 17.4 28.6 28.6
2. Numbers in Poverty
(million)
1988 96.0 146.2 134.1 195.5 180.8 303.6 282.8
1995 65.4 111.5 111.5 160.3 160.3 263.4 263.4
3. Percent Poverty Reduction
Between 1988 and 1995 31.9% 23.7% 16.9% 18.0% 11.3% 13.2% 6.8%
Table 10: Official Figures compared to Khan and Riskin Estimates
Source: Khan, R. Azizur, and Carl Riskin. 2001. Inequality and Poverty in China in the Age of Globalization. New York. Oxford University Press.Note *: The conversion to numbers in poverty has been extrapolated from Khan and Riskin’s estimates of incidence (which they term as the “headcount index”).

Understanding Rural Poverty 31
Item 1998 1999 2000
Official 635 635 625 Poverty Line (RMB)
Diagnostic (% of Official line)* 880
(138%)
865
(136%)
865
(136%)
Official 42.1 34.0 32.1 Poor Headcount (millions)
Diagnostic (% Official count)* 86.6
(201%)
90.0
(265%)
93.2
(311%)
Official 4.6 3.7 3.4 Rural Poverty Incidence
Diagnostic (% Official rate)* 9.5
(207%)
9.8
(265%)
10.1
(289%)
Table 11: Rural Poverty Numbers under Official and NBS Diagnostic Lines Compared
Source: Hussain, Athar. 2001. Poverty Profile and Social Security in China. Draft Report. London. Asia Research Center, London School of EconomicsNote: * The official description of this line is that those rural people below it are either absolutely poor or suffer low incomes.
Table 11 not only adds weight to the view that the officialhead count of rural poverty may be understated, butshows clearly that a small upward change in the povertyline results in massive increases in the poverty headcountand the incidence of poverty. For instance, the diagnosticline for the period 1998-2000 results in poverty incidencesbetween double and triple that reported under the officialpoverty line. This fact results from the pattern of incomedistribution among the not so rich, the low income poorand the absolute poor in rural PRC. Figure 7, taken fromthe NBS monitoring report on rural poverty, depicts thepattern of net income distribution among the ruralpopulation in national poverty counties in 1999 - seeFootnote 12. As can be seen in Figure 7, immediatelyabove the official poverty line of 625 yuan, the numbers inthe next three income brackets (625-800, 800-1000, and1000-1500 yuan per capita) rise at an accelerating rate,before dropping off in the 1500-2000 yuan bracket.While there is considerable debate about where to set anabsolute poverty line for the PRC, a separate debate isoccurring between officials, practitioners and academicson counting the number of persons who fall below setpoverty lines. Martin Ravallion of the World Bank, whospecializes in poverty counts, has noted that the measureof per capita welfare using national accounts isconsiderably higher than that using household incomesurveys whereas both figures should be broadly equal.14He has also noted that the growth rate over time in percapita private consumption derived from nationalaccounts is higher than that reflected in householdsurveys, therefore widening the gap between the two. Asthe definition of poverty is based on access to a survivalconsumption package, the question arises whether
household surveys understate consumption, andthereforepossibly overstate the numbers in poverty subjectto income distribution patterns, or whether nationalaccounts overstate consumption. Reality may be a mix ofboth.
Figure 7: 1999 National Poverty Counties - Rural Net IncomeDistribution
0
10
20
30
40
50
60
70
0-100 100-300
300-500
500-625
625-800
800-1000
1000-1500
1500-2000
2000-2500
2500-3000
3000+
Income Brackets - Yuan
Pop
ulat
ion
(Mill
ion)
Source: NBS. 2000. Poverty Monitoring Report of Rural China. Beijing: ChinaStatistics Press.
Angus Deaton of Princeton University, another regularcontributor to the poverty count debate, is also concernedthat the divergence between private consumption measuredin national accounts and household surveys raises doubtsabout statistics on poverty. His own research, and that ofothers, gives cause for caution in deriving poverty countsfrom household surveys.15
14 Ravallion, Martin. 2001. Measuring Aggregate Welfare in DevelopingCountries. How Well Do National Accounts and Surveys Agree?Washington, DC.: World Bank.
15 Deaton, Angus. 2000. Counting the world’s poor: problems andpossible solutions. Paper of the Research Program in DevelopmentStudies, Princeton University, New Jersey.

32 Poverty Profile of the People’s Republic of China
Coverage, reporting periods, and the relative variability ofconsumption versus income data all impact the analysis ofpoverty. For instance, there is considerable evidence thatrespondents recall higher levels of personal expenditure ifasked to report on the last seven days, as compared toreporting on the last month, or the whole year. Thus ifhousehold surveys were to reduce the reporting period,the numbers of households below the set poverty linewould most likely drop simply because of a change insurvey methodology.
LOCATION OF THE RURAL POOR
Over the period under review, rural poverty has becomemore concentrated in the remote, minority, and borderareas especially in the central and western regions. Manyof these areas suffer from difficult environmentalconditions, either through high altitude, poor soils (as inKarst country), degraded grasslands, desertification andterrain given to landslides and large-scale erosion. In 1999,the incidence of poverty (official definition) among therural population was 7.3% in the western region (16million people), 3.9% in the central region (13 millionpeople), and only 1.3% in the eastern coastal region (5million people). The areas most affected by environmentaldegradation and consequential rural poverty are the northwestern and south western provinces, followed by thecentral mountainous regions. As well as environmentaldisadvantages, these remaining poverty areas suffer frominfrastructure deficiencies, particularly a shortage of roadsand water storage facilities, poor health and educationservices, low agricultural productivity, rudimentaryagricultural markets, and under-developed non-agricultural industries. The fact that many of theremaining poor live in border areas suggests thatenhanced regional co-operation with neighboringcountries would be an effective weapon in the PRC’songoing war against poverty. The poor living in theborder areas should be able to capitalize on some of theeconomic opportunities created by increased cross bordertrade and economic cooperation.
Concentration of Rural Poverty in Western PRC
Growing Disparities in Regional Living Standards:Within the PRC, not all regions have benefited equallyfrom the exceptionally rapid economic growth of the lasttwo decades - see Figure 8. The coastal region grew fasterthan the rest of the country. Also, the central parts of thecountry grew more rapidly than the western regions. As aresult, there have been growing disparities in regionalliving standards. Per capita GDP in western PRC is abouttwo-thirds of the national average and only one-third ofthat in the coastal region. In a particularly striking
contrast, the average per capita income in Guizhou provincein 1999 was only 8% of that of Shanghai.
The regional disparities are also reflected in other socio-economic indicators. There is a wide gap in thedevelopment of physical infrastructure - roads; rail;power; telecommunications and water supply - betweenthe western regions and the rest of the country. Primaryschool enrollment is close to 100% in coastal and centralPRC, but is only 95% in the western provinces. Thenumber of medical personnel per capita is lower in thewestern PRC than in the rest of the country. There aremajor ecological problems in the interior provinces suchas desertification, erosion and a chronic lack of water insome areas. Several of these disparities and more arecaptured in Figure 8.
Rural Poverty is Concentrated in Western PRC:Although rural poverty has declined in all provinces,the reduction of the poor has been uneven acrossregions (see Figure 9). The number of rural poor forthe country as a whole decreased by an averageannual compound rate of 9.3% from 1992 to 1997 andby 13.5% per annum compound from 1997 to 2000.On a regional basis, the fastest rate of decline occurredin the east - 16.9% per annum compound between1992 and 1999. The slowest rate of decline for the sameperiod was found in the central provinces - 8.9% perannum. The number of rural poor in the western regiondeclined at an intermediate rate of 11.3% per annumfor 1992-1999 (see Figure 9). As the result of thedifferential rates of change, the regional distribution ofthe poor rural population also changed. The proportionof poor people living in the eastern region decreased from23.2% to 15% from 1992 to 1999 while the proportion ofcentral and western regions increased from 31.1%
Figure 8: Indicators of Regional Disparity(Eastern Region Equals 100)
020406080
100GDP Per Capita
Per Capita ElectricityConsumption
% of Urban Population
Roads (km/100km2) % of Good Roads
% of Workforce with morethan 12 years of education
Hospital Beds per 10,000Population
Eastern Central Western
Source: ADB. 2003. Country Strategy and Program (2004-2006). The People’sRepublic of China. Manila.

Understanding Rural Poverty 33
Tab
le 12
: Reg
iona
l Con
cent
ratio
n of
Rur
al P
over
ty
a D
eriv
ed fr
om th
e PR
C’s
Nat
iona
l Acc
ount
s rep
orte
d in
the C
hina
Sta
tistic
al Y
earb
ooks
.b D
eriv
ed fr
om R
ural
Hou
seho
ld S
urve
ys.
c In 1
997,
Cho
ngqi
ng w
as se
para
ted
from
Sic
huan
. Ten
nat
iona
l and
8 m
unic
ipal
pov
erty
coun
ties a
re cu
rren
tly lo
cate
d in
Cho
ngqi
ng M
unic
ipal
ity.
Sour
ces:
AD
B st
aff c
ompi
latio
n, U
ND
P. 1
997.
Chi
na H
uman
Dev
elopm
ent R
epor
t. N
ew Y
ork,
and
NBS
.
Prov
ince
Coun
ties
and
Pre-
fectu
res
Pove
rty C
ount
ies
Nati
onal
% to
Tot
al
Oth
ers
1995
HD
IRa
nk
1999
GDP
Per
Capit
a
Yuan
1999
Rur
alH
/hold
Cons
ump-
tion
per
capi
taa
Yuan
1999
Rur
alH
ouse
hold
per c
apita
net in
com
eb
Yuan
1996
Rura
lPo
pulat
-ion M
illion
1996
Rura
lPo
or
Milli
on
1999
Rural
Popu
lat-
ion Milli
on
1999
Rural
Poor
Milli
on
1989
Rur
alPo
verty
Incid
ence
1993
Rur
alPo
verty
Incid
ence
1996
Rur
alPo
verty
Incid
ence
1999
Rur
alPo
verty
Incid
ence
Nati
onal
Easte
rn P
RCBe
ijing
Fujia
nG
uang
dong
Gua
ngxi
Hain
anH
ebei
Jiang
suLia
oning
Shan
dong
Shan
ghai
Tian
jinZh
ejiang
Cent
ral P
RCAn
hui
Heil
ongji
ang
Hen
anH
ubei
Hun
anJia
ngxi
Jilin
Shan
xiW
ester
n PR
CG
ansu
Guiz
hou
Inne
r Mon
golia
Ning
xiaQ
ingha
iSh
aanxi
Sichu
an (o
ld)c
Tibe
tXi
njian
gYu
nnan
2.477 775 8 70 100 96 19 149 77 58 112 6 5 75 834 83 80 133 80 104 95 50 112
868 90 89 97 23 47 100
195 84 100
140
592
105 0 8 3 28 5 39 0 9 10 0 0 3
180 17 11 28 25 10 18 5 35 307 41 48 31 8 14 50 43 5 25 73
100 18 0 1 1 5 1 7 0 2 2 0 0 1 30 3 2 5 4 2 3 1 6 52 7 8 5 1 2 8 7 1 4 12
251 95 0 4 25 21 5 7 13 7 8 0 0 5 87 5 3 6 14 20 0 5 15 69 12 0 19 0 0 0 35 0 5 17
2 8 4 18 11 12 6 7 9 1 3 5 19 10 16 17 20 23 13 14 27 29 22 24 28 25 21 30 15 26
6,534
19,84
610
,797
11,72
84,1
486,3
836,9
326,3
4110
,086
8,673
30,80
515
,976
12,03
7
4,707
7,660
4,894
6,514
5,105
4,661
6,341
4,727
3,668
2,475
5,350
4,473
4,662
4,101
4,466
4,262
6,470
4,452
1,864
2,290
3,092
3,425
2,443
1,422
2,302
1,697
2,557
2,125
2,033
5,486
3,044
2,779
1,65
51,9
261,7
611,3
531,8
361,9
081,6
731,5
641,1
121,4
52 969
1,118
1,686
1,314
1,304
1,225
1,527 997
1,879
1,961
2,210
2,994
4,2
273,0
913,6
292,0
482,0
872,4
423,4
952,5
012,5
505,4
093,4
113,9
482,0
38
1,900
2,166
1,948
2,217
2,127
2,129
2,261
1,773
1,586
1,357
1,363
2,003
1,754
1,467
1,456
1,816
1,309
1,473
1,438
919.4
374.5 3.7 26.4
57.5
39.0 4.8 53.2
53.1
22.2
71.0 3.8 3.9 35.9
322.6
49
.818
.477
.540
.353
.232
.014
.422
.822
2.3
19.7
29.8
14.2 3.7 3.3 27.5
93.9 2.1 8.8 33.5
58.0 7.3 - 0.1 0.1 2.5 0.4 2.1 0.1 0.6 1.4 - - -
11.7 1.4 1.2 3.3 1.1 0.8 0.2 0.7 1.7 31.2 4.5 3.8 1.3 0.7 0.6 4.8 6.5 0.2 2.4 7.7
922
375 4 27 58 40 5 53 52 23 70 4 4 36 323 50 19 77 40 54 32 14 23 225 20 31 14 4 3 28 94 2 9 34
34 5 13 16
11.6 0.2 1.8 0.9 15.4 3.3 13.0 3.4 8.0 6.8 0.0 0.4 2.0 7.7 18.3
16.5 6.0 6.2 5.0 12.2
17.4
34.2
17.8
23.5
18.9
23.7
20.3
11.2 -
18.7
19.0
8.2
0.6 1.1 0.5 7.8 4.7 13.8 2.4 3.9 5.8 0.2 0.1 3.5 8.6 5.2 12.6 6.2 3.1 3.2 6.2 11.9
26.2
21.9
10.8
29.5
16.8
19.2
10.1 6.0 14.1
23.8
6.3 -
0.4 0.2 6.4 8.3 3.9 0.2 2.7 2.0 - - - 2.8 6.5 4.3 2.7 1.5 0.6 4.9 7.5 22.8
12.8 9.2 18.9
18.4
17.4 6.9 9.6 27.4
23.0
3.7 1.3 3.9 7.3

34 Poverty Profile of the People’s Republic of China
to 38.3% and from 45.7 to 46.6% respectively. As of 1999just under half of the PRC’s absolute poor lived in thewestern region. Recent information suggests that this maynow be over half due to the devastating effect of droughtin those provinces during 2000. Overall, the incidence ofrural poverty remains highest in the western provinces,followed by central provinces and is the lowest in theeastern provinces.
The Rural Poor in the Mountains: While there is aclear regional pattern in the distribution of rural poverty,within the regions, about 51% of the poor live inmountainous areas. Specific mention should be made of:the Luliang Mountains of the drought-stricken LoessPlateau of Shanxi; the Taihang Mountains of Hebei andShanxi; the Qinling Daba Mountains of Shaanxi, Hubei,Sichuan, and Guizhou; the Wuling Mountains of Hunan,Hubei, Sichuan, and Guizhou; the Yimeng Mountains ofShandong; the Dabie Mountains of Anhui, Hubei, andHenan; the southwest Karst areas of the JinggangMountains of Jiangxi, the Wumen Mountains of Yunnan,Guizhou, and Sichuan, the Hengduan Mountains ofYunnan, and the Jiuwan Mountains of Guizhou andGuangxi; and the mountains of Tibet. The elements oflivelihood are particularly severe in these high lands.
TYPES OF RURAL POOR
A Classification of Types Based on the Causesof Rural PovertyAt a broad conceptual level and at the risk of over-simplification, people are poor because the quantity and
mix of their livelihood assets are so inadequate that it isvery difficult for them to use the structures and processesavailable in the wider society to improve their lot.Livelihood assets comprise five types of capital: financial,natural, human, physical and social. “Financial” coversincome, savings and credit, “natural” covers the naturalenvironment, “human” relates to skill levels and masteryover information, “physical” covers infrastructure, and“social” refers to the networks of people with influence,creative ideas and social resources that can be called onto help the poor. The various patterns of livelihood assetinadequacy in the PRC determine different types of ruralpoverty. Little systematic work has been done to identifya full range of types or categories of rural poverty in thePRC. However, a number of types are fairly obvious.
A major category of rural poverty in the PRC is wherenatural capital is inadequate. This occurs when theenvironment severely limits the human livelihood optionsof the rural population. This can take several forms. Oneform is where the resource base available to a communityis particularly limited. This could be because of highaltitude, steeply sloping land, erosion, desertification,high population pressure on arable land and lack of waterfor humans, crops and animals. A related type wouldinvolve poor quality of available resources. Aspects ofthis typology include poor quality water, low soil fertilityand unfavorable microclimates.
Another category related to environment is where humanhabitation and natural conditions have launched a viciouscycle of environmental degradation. Common forms ofthis are removal of forests leading to high soil erosionand poor water retention, desertification, falling of watertables and decline in ground water resources, overgrazing, and a progressive increase in the frequency ofnatural disasters. A separate typology is where access toresources is difficult. This may result from the physicaldistance between housing and water supplies and alsofrom sustainable supplies of fuel. It may also result froma land tenure system that increases resource inequitiesbetween households. Where access to resources dependson traveling considerable distances and carrying heavyloads and conducting heavy agricultural labor, thedependency ratios within households will impact on thedistribution of poverty.
The types of poverty listed above primarily relate tonatural capital, specifically the environment. The reasonfor the multitude of such typologies is because the PRCis confronting a major environmental crisis. Much ofPRC’s arable land is affected by ecological disasters andsoil degradation. Droughts affect about 20 million
Sources: NBS. 1998. Marked Achievement Made in Poverty Reduction in RuralChina. Market and Demographic Analysis. Vol.4, No.6; and Wang Pinpin. 1999.Can China Escape Poverty by the End of the Century? Beijing. Also NBS. 2000. op.cit.
Figure 9: Poverty Reduction Rates by Region
0%
5%
10%
15%
20%
25%
1992-97 1997-99 1992-99
Ave
rag
e an
nu
al r
edu
ctio
n (c
om
po
un
d)
Eastern provinces Central provinces Western provinces

Understanding Rural Poverty 35
hectares annually (1.51% of arable land), and cause aboutone-half of all economic losses attributed to climate. Theimpacts of climate-induced drought are exacerbated bypoor agricultural practices such as excessive grazing.Major floods affect about 6.7 million hectares of farm-land each year and periodically cause catastrophic lossesof human life and property.
* In this Table the rural poor are defined as those with net income per capitaless than $1.25 PPP/day, and the urban poor are based on calculations made inthe ADB’s report on Urban Poverty in PRC.Source: Van der Tak C.M. 2002. Study on Poverty and Environment in China. Reportfor the Royal Netherlands Embassy in Beijing.
A Study on Poverty and Environment in China completed by Dr.Casper Van der Tak in February 2002 for the RoyalNetherlands Embassy in Beijing has contributed to theunderstanding of these types of poverty by estimating theextent of impact on the poor – both rural and urban -from a variety of natural capital deficiencies. His estimatesare set out in Table 13.In Table 13 Van der Tak uses $1.25 PPP per day percapita net income as the definition of rural poverty,
which is less severe than the PRC’s official poverty line.He examines three dimensions to compare eachenvironmental factor’s impact on the poor: (i) severity ofimpact measured by the per cent of the affected poor’sincome repressed or lost; the number of poor affected;and the extent to which the impact is concentrated on thepoor as opposed to being diluted through other strata ofsociety within the affected geographic area. He concludesthat that desertification and water scarcity, where theyoccur in the PRC, have the most damaging effect on thepoor while being highly concentrated on the poorcompared to other groups. He ranks erosion, forestdegradation, wetlands and water pollution as the nextmost anti-poor environmental factors. Grassland fragilityand soil salinization are ranked next. Biodiversity is rankedlow on the anti-poor scale.
Moving back to the general discussion of rural povertytypes, another type is that which has resulted from, or isexacerbated by, a change in government policy or by poorgovernance. The PRC is such a large country that certainmacro decisions need to be made to enhance or protectthe welfare of the majority of the people. Some of thesemacro policies may, however, have unintendedimpoverishing effects on marginal rural communities. Themost obvious of these were the ban on logging in theYangtze headwaters and the conversion of slopingagricultural land back to forests. These policies wereadopted in the wake of the disastrous 1998 floods.Various communities at higher altitudes, which weregenerating above poverty line incomes before thesepolicies were introduced, have experienced a significantdrop in income without obvious sustainable incomegenerating substitutes.
Types of rural poverty related to deficiencies in naturalcapital and also physical capital (lack of physicalinfrastructure particularly roads) tend to impact wholecommunities. Other types of rural poverty relate tofamily-level factors which fall into two broad categories:structural and catastrophic. A common example offamily-level structural poverty is that caused by thecomposition of the household. Here, family size,number of children for whom school fees have to bepaid, number of women who have married into thefamily as opposed to marrying out of the family, and thedependency ratio, are important. By way of explanation,a woman from another village marrying into the familybecomes an extra person needing support from thefamily’s right to farm the often small fixed area of landallocated to it by the community. This increase inpressure at the family level is only ameliorated if andwhen the community decides to redistribute land use
Table 13: Environment and Poverty Summary TableType ofEnvironmental Issue
Number ofPRC's poor* affected
Impact onthe poor as
share oftotal impact
Severity ofthe impacton affected
poorMillions % % of
affectedpoor's
incomeLand Degradation(i) Aggregated(ii) Disaggregated Desertification Forests Erosion Grasslands Salinization Agrochemicals
260
1560
1501528
240
39.2
22.656.341.255.655.625
24.5
42.42421
15.815
2.21Water resources(i) Aggregated(ii) Disaggregated Water scarcity Water pollution
260
85210
3032.8
5518
Air Pollution(i) Aggregated 248 25.8 44Biodiversity(i) Aggregated(ii) Disaggregated Wetlands Agro-biodiversity Others
270
30117270
8.0
1625.42.7
5.5
204.711.3
Waste management(i) Aggregated 162 25.6 10Total 270 25 107

36 Poverty Profile of the People’s Republic of China
rights to re-establish equitable holdings as betweenhouseholds. Under the new Land Contract Law that cameinto force in early 2003, however, periodic redistributionswill no longer be an option.
Family-level catastrophic poverty is caused by an event thatsuddenly and sharply drops the cash and non-cash incomeearning capability of the family. Severe illness, accidentfollowed by permanent disability, death, loss of off-farmemployment, and natural disaster can each send and keep afamily in poverty.
A further type of rural poverty is that directly related tothe disabled. Disability at or post birth is a randomphenomenon with no causal connection to the
environment in which the household lives. If the householdwith a disabled member was not well-off beforeexperiencing disablement, then that household may wellhave plunged into poverty.
A Classification of Types Based on the RelativeDepth of Rural Poverty
The classification discussion so far has focused on thecauses of poverty. An alternative approach is to makeclassifications according to the depth of poverty and lowincome status. A hypothetical model of what might resultfrom this approach to classifying rural poverty issummarized in Table 14.
Table 14: Hypothetical Model for basing Rural Poverty Categories on Depth of Poverty
Source: ADB staff and staff consultant drawing on World Bank estimates of $1 a day.
Category Estimatedshare of theruralpopulation(%)
Estimatednumber ofrural personsin category in2000 (million)
Appropriate assistance program
Absolute poor (cut-off pointOfficial poverty line)
3% 32 Welfare programs for those who cannot help themselvesdue to disability, age, or remote location; voluntaryresettlement programs.
Relative Poor(cut-offpoint $1 aday incomebased
a) VulnerablePoor
5% 45 Preventative health programs, income generating activities,emergency assistance as required from welfare agencies.
b)Disadvantagedpoor
3% 29 Self-help programs especially in the areas of education,health, and housing, and microfinance; rural infrastructure;agro-industry and agricultural programs to stimulate localeconomies and viable employment; catastrophic healthinsurance.
$1 a dayconsumptionbased
c) Relative Lowincomehouseholds
11% 100 Similar programs to disadvantaged poor plus small businessdevelopment, entrepreneurial schemes, increased access toalternative forms of credit including commercial credit;pro-poor growth policies.
Non-Poor 78% 722 Regular equitable development programs of the nationaland local governments; stable macro-economicenvironment.
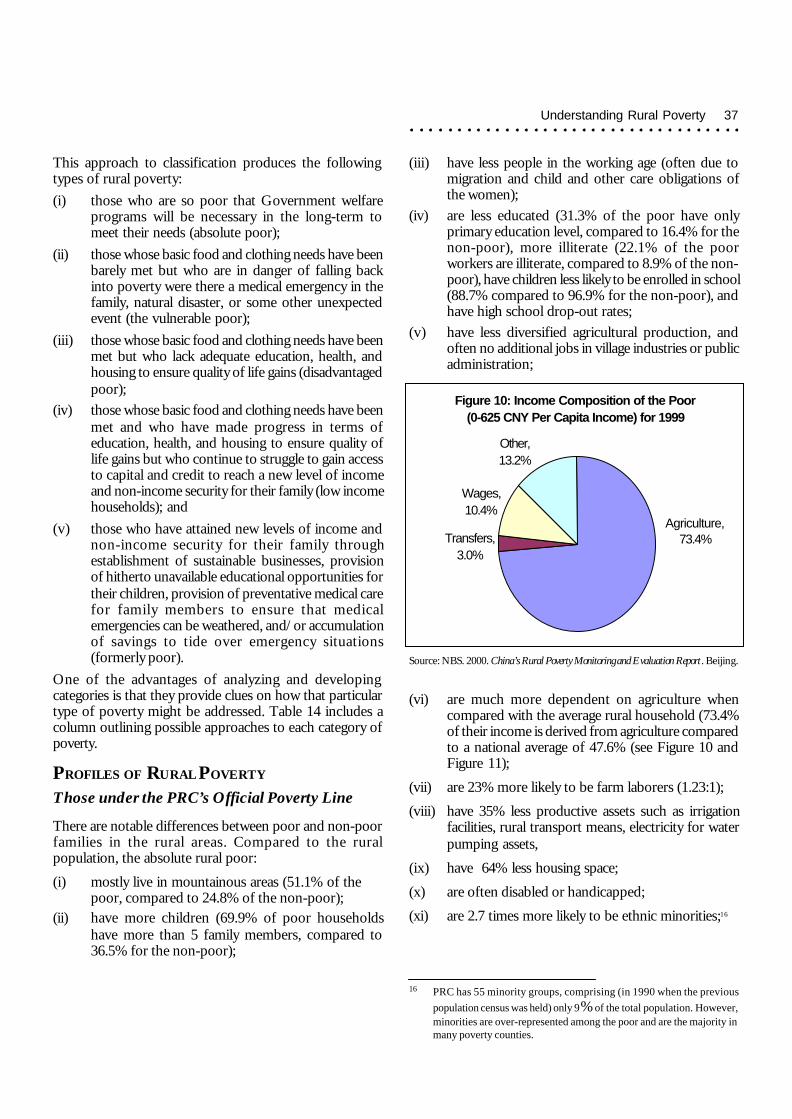
Understanding Rural Poverty 37
This approach to classification produces the followingtypes of rural poverty:(i) those who are so poor that Government welfare
programs will be necessary in the long-term tomeet their needs (absolute poor);
(ii) those whose basic food and clothing needs have beenbarely met but who are in danger of falling backinto poverty were there a medical emergency in thefamily, natural disaster, or some other unexpectedevent (the vulnerable poor);
(iii) those whose basic food and clothing needs have beenmet but who lack adequate education, health, andhousing to ensure quality of life gains (disadvantagedpoor);
(iv) those whose basic food and clothing needs have beenmet and who have made progress in terms ofeducation, health, and housing to ensure quality oflife gains but who continue to struggle to gain accessto capital and credit to reach a new level of incomeand non-income security for their family (low incomehouseholds); and
(v) those who have attained new levels of income andnon-income security for their family throughestablishment of sustainable businesses, provisionof hitherto unavailable educational opportunities fortheir children, provision of preventative medical carefor family members to ensure that medicalemergencies can be weathered, and/or accumulationof savings to tide over emergency situations(formerly poor).
One of the advantages of analyzing and developingcategories is that they provide clues on how that particulartype of poverty might be addressed. Table 14 includes acolumn outlining possible approaches to each category ofpoverty.
PROFILES OF RURAL POVERTY
Those under the PRC’s Official Poverty Line
There are notable differences between poor and non-poorfamilies in the rural areas. Compared to the ruralpopulation, the absolute rural poor:
(i) mostly live in mountainous areas (51.1% of thepoor, compared to 24.8% of the non-poor);
(ii) have more children (69.9% of poor householdshave more than 5 family members, compared to36.5% for the non-poor);
(iii) have less people in the working age (often due tomigration and child and other care obligations ofthe women);
(iv) are less educated (31.3% of the poor have onlyprimary education level, compared to 16.4% for thenon-poor), more illiterate (22.1% of the poorworkers are illiterate, compared to 8.9% of the non-poor), have children less likely to be enrolled in school(88.7% compared to 96.9% for the non-poor), andhave high school drop-out rates;
(v) have less diversified agricultural production, andoften no additional jobs in village industries or publicadministration;
(vi) are much more dependent on agriculture whencompared with the average rural household (73.4%of their income is derived from agriculture comparedto a national average of 47.6% (see Figure 10 andFigure 11);
(vii) are 23% more likely to be farm laborers (1.23:1);
(viii) have 35% less productive assets such as irrigationfacilities, rural transport means, electricity for waterpumping assets,
(ix) have 64% less housing space;
(x) are often disabled or handicapped;
(xi) are 2.7 times more likely to be ethnic minorities;16
16 PRC has 55 minority groups, comprising (in 1990 when the previouspopulation census was held) only 9% of the total population. However,minorities are over-represented among the poor and are the majority inmany poverty counties.
Source: NBS. 2000. China’s Rural Poverty Monitoring and Evaluation Report . Beijing.
Figure 10: Income Composition of the Poor(0-625 CNY Per Capita Income) for 1999
Transfers,3.0%
Wages,10.4%
Other,13.2%
Agriculture,73.4%

38 Poverty Profile of the People’s Republic of China
Table 15: Characteristics of Rural Poor and Non-Poor by Region (Rural Household Survey 1998)
*Region 1: Beijing, Tianjin, Shanghai, Zhejiang, Jiangsu, Guangdong, Fujian; Region 2: Hebei, Shanxi, Liaoning, Anhui, Jiangxi, Shandong, Henan, Hubei, Hunan,Guangxi, Hainan, Chongqing, Sichuan; Region 3: Guizhou, Yunnan, Shaanxi, Gansu, Qinghai, Ningxia, Xinjiang; Region 4 : Inner Mongolia, Jilin, and Heilongjiang.Tibet is excluded.
**Households with insufficient human resources refer to those that have one or more than one of following characteristics: households that have labor-agedmembers but the members are disabled-bodied; no labor force; female-headed households with no other able-bodied labor; and/or a labor-dependency ratioexceeding 4.
***Households with insufficient natural resources refer to those having following characteristic: per capita sown area less than 1 mu in mountainous areas, or less than0.5 mu in plains, or production per mu less than 100 Kg.Source: Wang et al (January 2000).
CharacteristicNon-poor(nationalaverage)
Poor* People in:
Region 1 Region 2 Region 3 Region 4Economic Conditions of Rural Households Per capita productive fixed asset value (Yuan) Per capita grain production (Kg) Housing (Sq. meters) Color TV sets (no./100 households) Per capita household productive expenditure (Yuan) Share of income from family business (%) Of which: share of income from primary industry (%) Of which: share of income from crop farming (%) Share of labor involved in non-family business (%)Infrastructure Villages with access to roads (%) Villages with school (%) Villages with telephones (%) Villages with health clinics (%) Villages covered by TV broadcasting (%) Households accessing to electricity (%) Households accessing to safe drinking water (%)Demographic structure and quality Share of families with over 5 members (%) Share of labor with education level < primary school (%) Labor dependency ratio Share of illiterate labor force (%) Share of in-school children aged 6-11 (%) Share of in-school children aged 12-14 (%) Share of in-school children aged 15-17 (%) Share of households with insufficient human resources (%)**Natural conditions and natural resources % of households living in mountainous areas Per capita land availability (Mu) Grain output per Mu (Kg/Mu) % of households with insufficient natural resources(%)***
940xxx714xxx
24.2xxx33.3xxx668xxx
76.3xxx65.0xxx45.0xxx14.9xxx
95.6xxx91xxx
79.4xxx85.6xxx97.4xxx98.4xxx73.6xxx
36.5xxx16.4xxx1.5xxx8.9xxx
88.5xxx96.9xxx92.1xxx2.5xxx
24.8xxx2.1xxx347xxx7.3xxx
412xxx266xxx
20.4xxx39.2xxx
259.4xxx73.5xxx67.3xxx47.0xxx15.9xxx
90.4xxx72.6xxx90.2xxx82.4xxx100xxx100xxx
80.2xxx
54.9xxx5.9xxx
1.42xxx13.1xxx83.3xxx90.4xxx85.2xxx31.4xxx
29.9xxx0.66xxx400xxx
66.7xxx
601xxx353xxx16.6xxx16.5xxx316xxx86.3xxx81.2xxx57.5xxx8.8xxx
94.2xxx93.2xxx
65xxx79.8xxx94.8xxx95.8xxx60.9xxx
64.1xxx23.1xxx1.63xxx13.4xxx84.1xxx90.9xxx82.9xxx14.2xxx
37.7xxx1.32xxx268xxx38.5xxx
446xxx295xxx12.3xxx6.9xxx274xxx87.5xxx79.8xxx60.0xxx5.1xxx
92.6xxx95.2xxx52.4xxx65.9xxx91.4xxx91.2xxx40.7xxx
70.7xxx41.9xxx1.74xxx29.5xxx80.1xxx87.4xxx
80xxx14.7xxx
69.9xxx1.62xxx181xxx33.6xxx
1426xxx865.2xxx14.2xxx25.7xxx572xxx
93.2xxx91xxx
78.3xxx3.1xxx
88.8xxx90.5xxx74.3xxx74.3xxx96.7xxx97.2xxx82.7xxx
50.8xxx11.7xxx1.52xxx5.2xxx
75.4xxx92.1xxx86.1xxx8.9xxx
7.5xxx5.89xxx147xxx3.9xxx

Understanding Rural Poverty 39
(xii) have no remittances from migrant family workers;(xiii) carry more debt; and(xiv) have less land (1.8 mu compared to 2.1 for the non-
poor families) and less good land. As a result, thepoor produce less grain (406 kg per capita per year)than the non-poor (714 kg).17
17 Wang, Pinpin. 1999. Can China Escape Poverty by the End of theCentury? From UNDP. 1998. op. cit. citing Khan. 1997. Based on1995 data.
In contrast, the rural non-poor are 5.1 times more likely toreceive wage and pension income, carry more debt, andwork more off-farm.
Characteristics of the Rural Poor by RegionTable 15 provides a comparison of the characteristics ofthe rural poor, as per the official poverty line, with therural non-poor based on the 1998 NBS survey of 68,300rural households. In this Table the provinces are groupedinto four, rather than three, regions which are coastal,central, west, and northern. The analysis confirms bysharp distinction with the non-poor, that poverty is oftenrelated to environmentally affected areas with lack ofinfrastructure, to low health and education standards, andto insufficient human resources within the household.The data also cast light on residual poverty. By 1998,progress with poverty reduction in the coastal region waswell in advance of the other regions. The profile of theremaining poor in the coastal region with respect toproductive expenditure, land availability, sufficiency ofhuman and natural resources, and access to a school in thesame village, suggests that Government efforts there areconfronting more inextricable poverty than in the otherregions.
Because of major infrastructure investments all over thecountry, poor villages in the same province do not differmuch from richer ones in their access to Government-funded infrastructure. Primary education is nearlyuniversal, demonstrating, in part, the success of educationprograms targeted towards poor areas. About 92.3% ofthe poor and 95.6% of the non-poor live in villages withroad connections. Between 1986 and 1998, the proportionof villages with access to rural roads and rural electricityincreased from 83.9% to 97.6% and from 77.8% to 97%respectively.
The progressively more equitable access to infrastructurehas not meant that poor rural people make as much useof it as richer households. There are clearly reasons forthis difference in behavioral response to availableinfrastructure. One important reason is variability in thequality of the infrastructure and the services supportingit. Where rural road networks are upgraded and all-weather roads link poor administrative villages totownships, considerable benefits flow to the poor throughincreased agricultural productivity and off-farmemployment generated by the expansion in non-agricultural productivity. Another reason for differentresponses may relate to policies and practices in imposingfees for the use of this infrastructure – particularly socialinfrastructure (health and education).
Proxy Profile of Rural Persons withConsumption less than $1 per day
The World Bank has estimated $1 a day in PPP values tobe equivalent to 879 yuan net income per capita perannum in year 2002 prices. This measure can be applied toa person’s income or expenditure. Many developmentassistance practitioners and academics agree thatconsumption is the better of the two. What is the profileof those rural persons in the PRC who cannot achieve $1a day consumption?
No such profile has been derived from hard data.Fortunately, a proxy exists. The NSB, operating within theofficial framework of the “poor and the low income”rural people, re-analyzed their year 2000 rural householdsurvey data to establish a profile of all those unable toconsume 860 yuan per annum. Eight hundred and sixtyyuan in year 2000 prices is close to the World Bank’s 879yuan in 2002 prices – close enough for the NBS profileresults to reflect the condition of those who meet the“less than $1 a day consumption” definition of poverty.
Source: NBS. 2002. op. cit.
Figure 11: National Average Rural IncomeComposition for 2001
Agriculture47.6%
Wages32.6%
Transfers5.7%
Other14.1%

40 Poverty Profile of the People’s Republic of China
Items
People with Per Capita Living
Consumption Expenditure Less
than 860 yuan in Year 2000
(1)
All Sampled
Households
In Year 2000
(2)
(3)=(1)/(2)
1. Net Income (Yuan) 1327 2253 0.59
(1) Wage Income 329 702 0.47
From Local Enterprise 67 209 0.32
From Working Outside 136 240 0.56
Others 127 113 1.12
(2) Net Income from Household Business 951 1427 0.67
Planting 596 784 0.76
Animal Husbandry 130 207 0.63
Fishery 7 27 0.28
Others 218 409 0.53
(3) Transfer Income 30 79 0.39
Gifts from Non-Permanent Residents 18 40 0.45
Income from Relief Fund or Subsidies 0.5 0.9 0.55
Others 12 38 0.32
(4) Property Income 17 45 0.38
2. Net Cash Income (Yuan) 814 1649 0.49
3. Grain Yield (Kg) 575 683 0.84
4. Assets (Yuan)
(1) Per Capita Area of Cultivated Land (Mu) 1.97 1.98 0.99
(2) Per Capita Original Value of Productive Fixed
Assets at Year-end (Yuan) 802 1113 0.72
5. Housing Quality
Per Capita Floor Space of Houses (Sq.m) 17.9 24.8 0.72
Reinforced Concrete Structure 2.2 6.2 0.36
Brick and Wood Structure 9.8 13.6 0.72
Others 5.9 5.0 1.18
6. Engel Coefficient (%) 0.66 0.49
In relating the NBS profile, for reasons of brevity thoserural persons unable to consume 860 yuan per annum in2000 will be called the poor, and those with higherconsumption will be called the non-poor. This in no wayimplies that the NBS agrees to classify them as poor.
Table 16 compares a number of livelihood aspects of thiswider group of rural poor with the average of all ruralhouseholds surveyed. The Table shows that the poorerpeople derived on average half of the net cash income ofall sampled households. This was largely due to a muchlower level of participation by the poorer group in off-farm wage labor. Also contributing to this difference wasthe lower returns to agriculture off almost the same size
average holdings of arable land. Poorer quality landand remoteness are probable factors. The data demonstratethat the poorer group commanded only 72% of theproductive fixed assets held on average by all households.This can be linked to other data for the poorer group:lower grain yields; 37% less net income derivedfrom animal husbandry; and 72% less incomederived from aquaculture, the latter two requiringinvestment in stock and fixtures. Housing standardsare one of the easiest to observe indicators of householdwelfare. The poorer group was occupying only 36% of thehigher quality housing space as the average for all sampledhouseholds. Another indicator of the extentof basic survival is the percentage of living expenditure a
Table 16: Income and Livelihood Levels per Year 2000 Rural Household Survey

Understanding Rural Poverty 41
household devotes to acquiring food. This indicator is calledthe Engel coefficient and for the poorer group was 66%,17 percentage points higher than that of the whole sample.
Table 17 provides data indicating that topography andethnicity are linked to poverty. Over one third (36%) ofthe poorer group live in mountainous areas whereas onlyone quarter (26%) of the total sample do so. Similarly onequarter (25%) of the poorer group belong to minorityvillages whereas for the whole sample only one seventh(15%) do so. Another measure of this ethnicity bias is thatthe proportion of the poorer group coming from minorityvillages is double that for the remainder of the respondentsin the sample - that is the better-off respondents.
Table 17 also profiles the poorer group with less than 860yuan per capita consumption expenditure compared withthe total sample with respect to access to infrastructure.Policies over the last two five-year plan periods aimed atenlarging domestic demand, and the “8-7” povertyreduction program, have almost removed any distinctionbetween the poorer group and total sample in respect ofroad connections and electricity supply to their villages.Supply of these two types of infrastructure is approachingtotal coverage. While there is also very little differencebetween the two groups in respect of proximity to primaryschools, 13 to 14% of the sampled rural population remainmore than 2 kms from the nearest such school.The profiles of the poorer group and the total sample differ
significantly in terms of access to other forms ofinfrastructure. The proportions of poorer households: (i)able to drink safe water, (ii) located within 2 kms of thenearest health clinic; and (iii) with access to a telephone inthe same village are 7, 8 and 10 percentage points lowerrespectively than those for the whole sample. While theproportion of the poorer group with access to safe drinkingwater and nearby clinics is relatively low, it is also absolutelylow - being only 58 and 57% respectively.
Table 18 profiles social and employment dimensions ofthe poorer group compared with the whole sample. Theproportion of females in the poorer group is marginallyhigher (0.7 percentage points) than evident in the totalsample suggesting a gender bias in the impact of poverty.A more prominent difference is the level of educationattained by respondents. Figure 12 highlights this differenceby comparing the poorer group with the rest of the sample- the better-off rural people. In Figure 12, the distributioncurve of educational achievement for the better-off groupis consistently higher than that for the poorer group.Compared to the better-off majority, the poorer groupsuffers from almost double the incidence of illiteracy orsemi-literacy, has little more than half the proportion ofpeople who have completed senior high school and onlyone third the proportion of those who have completedspecial secondary schools and/or above. Furthermore, 9%of the children of the poorer group aged between 7 and 15are not enrolled at schools.
Table 17: Topography and Access to Infrastructure Based on Year 2000 NBS Rural Household Survey
Items
People with PerCapita LivingConsumptionExpenditure
Less than 860yuan
(1)
All SampledHouseholds
(2)
Ratio of Itemfor Category
(1)Householdsto Category
(2)Households
(1)/(2)
1. Geographic Characteristicsxxxx(1) Proportion in Villages in Mountainous Area (%)xxxx(2) Proportion in Villages in Hilly area (%)xxxx(3) Proportion in Villages in Plain area (%)
2. Proportion in Minority Villages (%)
3. Infrastructurexxxx(1) Proportion of Villages Connecting to Highwayxxxx(2) Proportion of villages with Phonexxxx(3) Proportion of villages less than 2 Kms Away from the Nearestxxxx xx Primary Schoolxxxx(4) Proportion of villages less than 2 Kms Away from the NearestxxxxxxxClinicxxxx(5) Proportion of Households Able to Drink Safe Waterxxxx(6) Proportion of Villages using electricity
362143
25
9377
87
575897
263045
15
9587
86
656598
1.410.700.97
1.70
0.980.89
1.00
0.880.900.99

42 Poverty Profile of the People’s Republic of China
the whole sample. Consistent with data on sources ofincome, the predominance of agricultural employmentamong the poorer group is almost 10% higher than for thewhole sample. The whole sample, compared to the poorergroup, has double the proportion of persons engaged inindustry and 64% more proportionately engaged in services.From the Year 2000 rural household survey, it is clear thatgreater access to off-farm employment is associated withreduced incidence of poverty.
The additional interrogation of the Year 2000 ruralhousehold survey sponsored by the ADB has also resultedin detailed data for each province on the income, access toinfrastructure and social development characteristics of thepoorer group compared to the total sample. These are setout in Appendix 1 at the end of this book. In general, thesedata show that differences between the poorer group andthe whole sample are more marked in the western region.
This is almost double the same age non-enrollees fromthe better-off group. Table 18 also profiles theemployment patterns of the poorer group compared to
Items
People with Per
Capita Living
Consumption
Expenditure Less
than 860 yuan
(1)
All Sampled
Households
(2)
(3)=(1)/(2)
1. Gender
(1) Male 51 52 0.99
(2) Female 49 48 1.01
2. Education Attainment
(1) Special Secondary School & Above 1 2 0.46
(2) Senior Middle School 6 9 0.67
(3) Junior Middle School 44 48 0.92
(4) Primary School 35 32 1.09
(5) Illiterate or Semi-illiterate 13 8 1.61
Enrollment rate of Children Aged 7-15 91 94 0.96
3. Employment
(1) Agriculture 85 76 1.12
(2) Industry 4 8 0.52
(3) Construction 3 3 0.85
(4) Tertiary Industry 8 13 0.64
Table 18: Composition of Gender, Education Attainment, and Employment (%) per Year 2000 Rural Household Survey
Figure 12: Education Attainment
0
10
20
30
40
50
60
70
80
90
100
Illiterate plusEducated
At leastPrimarySchool
At least JuniorSecondary
At least SeniorSecondary
At leastSpecial
Secondary
% S
amp
le
Poorer Group Rest of Sample
Source: Derived from Year 2000 Rural Household Survey
The Fight Against Rural Poverty 43
THE FIGHT AGAINST RURAL POVERTY
MACROECONOMIC IMPACTS
OVERVIEWThe pace and pattern of macro economic growth determine: (i) how much of that growth is passed on to households as increasedpersonal income, and (ii) how the increase in personal income is distributed. It is changes in the level of personal income and itsdistribution that impact the incidence of poverty. High rates of economic growth do not automatically guarantee high rates of povertyreduction. There are complex chains of relationships and variables that translate economic growth into personal income increase andits distribution. What economic growth does do is provide the fundamental resource or opportunity for a country to reduce its poverty.
Given the PRC’s recent growth rates and its pattern ofintricate linkages between sectors/subsectors of theeconomy and the spatial pattern of development in eachsector, the World Bank has calculated that for every 1%growth in gross domestic product (GDP) rural povertydeclines by around 0.8%. The question that Khan and Riskinraise is how much greater could this decline be if there is achange in the share of economic growth going to personalincomes as opposed to capital accumulation.18 Both theWorld Bank and Khan and Riskin agree that the mechanismslinking poverty reduction and growth require deeperanalysis. Areas for such analysis include: (i) the regionaldimensions of growth; (ii) the sectoral composition ofgrowth; (iii) the sources of growth and the type ofhousehold beneficiaries; and (iv) the implications of growthfor income distribution.
What is particularly positive in the PRC is the commitmentof the Government up to the very highest level to reducepoverty. This commitment translates into the disciplinedeffort and policy analysis that has gone into assessing thenature of poverty and the dynamics of its reduction. Ittranslates also into the extent of Government resourcesallocated to fighting poverty. This Governmental drive hasbeen supported by a culture of self-help in society at large.The rural poor have responded actively and creatively tonew market opportunities. Gone are the days of travelpermits. Gradually increasing labor mobility has providedmany rural poor households with the chance to accesshigher levels of income through migrant labor. Informalsocial safety nets based on the family and village committeeprovide some protection against the risks associated withpoverty.
In the last two decades the PRC was the fastest growingeconomy in the world. The average annual growth rate ofGDP between 1995 and 2000 was 8.6%. In 2001
real GDP increased by 7.3% over the previous year and2002 has posted an increase of 8%. The outlook for themedium term (2003-2005) is similarly positive with expectedrobust economic growth of around 7% per annum. Thisrapid economic growth has been skewed towards the easternand coastal regions. The high pace of growth between 1978and 2000 in the eastern provinces was accompanied by a31.1% reduction in poverty therein, whereas relatively highgrowth rates of 10.8 and 8.7% in the PRC’s northwesternand southwestern provinces were complemented by povertyreductions of only 4.5 and 1.2% respectively.Rural-urban income disparity has increased over time. Theratio of rural per capita annual income to urban per capitadisposable income was 53.8% in 1985, dropping to 37.8%in 1999. The rural-urban disparity has been a major sourceof regional income inequality since 1978 and hascontributed more than half of the momentum to regionalincome inequality. Income distribution within rural areas ismore unequal than within urban areas. The income offarmers is mainly decided by their own productionsupplemented by off-farm income whereas urban residentshave incomes distributed according to a set hierarchy ofsalaries in industry. Recent growth in the urban private sectoris modulating this set salary hierarchy, however.
While farmers’ incomes depend largely on their ownproduction, the real price of agricultural products is amajor factor affecting the ease with which lower incomerural families can escape poverty. Real farm prices beganfalling in 1993 and in the period 1996 to 2000 agriculturalproduct prices fell by more than 25%. As the bulkof rural income for poor farmers derives from agriculturalactivity (73.4% in 1999), a decline in relativeagricultural prices has had a negative impact on povertyreduction. This general point has been confirmed byspecific case study research. Downward pressure oncommodity prices will continue with the PRC’s accession
18 Khan, A.R., and C. Riskin. 2001. op. cit.

44 Poverty Profile of the People’s Republic of China
to the World Trade Organization. The prices of somecommodities in the PRC exceed the corresponding priceon the world market. Increased imports and the dismantlingof trade barriers will tend to reduce these prices, and thusalso reduce farm incomes.
Official data on unemployment published by the NBS donot cover rural areas, which account for 70% of the laborforce. However, there is substantial underemployment inrural areas. Unofficial sources estimate that about 100million, about a quarter of the rural labor force, areunderemployed. With the deepening of market-orientedreforms, income growth in rural areas will increasinglydepend on an increase of employment in non-agriculturalsectors. Non-farm employment incomes accounted forabout a quarter of all farmers’ income in poor areas.Changes in employment patterns, especially in the availabilityof nonagricultural jobs to farmers, significantly influencedthe rate of poverty reduction.
PRO-POOR ECONOMIC GROWTHSUSTAINABLE AND RAPID GROWTHINCREASED PER CAPITA INCOME
Economic growth in the PRC has been broad based amongall sectors, with the industrial sector, both in the cities andin the rural areas, taking the lead. Between 1995 and 2000,the growth of industrial output averaged 10.5% per annum.Growth in the services sector averaged 8.2%. Theagriculture sector, in which more than half the workforceare employed, grew at a lower rate - at an average of 3.7%annually - see Figure 13.
Taking a longer view, GDP growth averaged 8.3% between1978 and 2000. Real GDP per capita in constant 2000 valuesincreased from 1,267 yuan in 1978 to 7,078 yuan
in 2000. That means that, in real terms, GDP per capitaincreased between five and six times over this 22 year period.This enormous growth generated additional nationalincome to be apportioned to various segments of society.Government, entities with corporate identity, ruralcommunities and urban populations are the main claimantson national income.
Figure 14 draws on NBS data to compare the year-on-yearrate of growth of rural per capita income and urban percapita income and relate that to GDP growth over the same22 year period plus 2001. It is realistic to divide thecomparison of rural and urban income growth into twotime slices. The first is from 1975 to 1985 which marks thetime when the communes were progressively dismantled.Here the trend line for rural per capita income growth staysconsistently above that of urban per capita income growth.From 1986 to 2001 with brief exceptions, the rural trendline is generally several percentage points below its urbancounterpart.
Source: NBS 2002 data and China Development Report 1998.
Source: ADB. 2000. Country Economic Review. Manila and NBS data for 2002
Figure 13: Annual GDP Growth by Sector (1995-2002)
0.02.0
4.06.0
8.010.0
12.014.016.0
1995 1996 1997 1998 1999 2000 2001 2002
%
average GDP growth agriculture industry services
Figure 14: Rural and Urban per Capita Income Growth
-5
0
5
10
15
20
25
1978
1979
1980
1981
1982
1983
1984
1985
1986
1987
1988
1989
1990
1991
1992
1993
1994
1995
1996
1997
1998
1999
2000
2001
%
GDP per Capita Rural Income per capita Urban income per capita
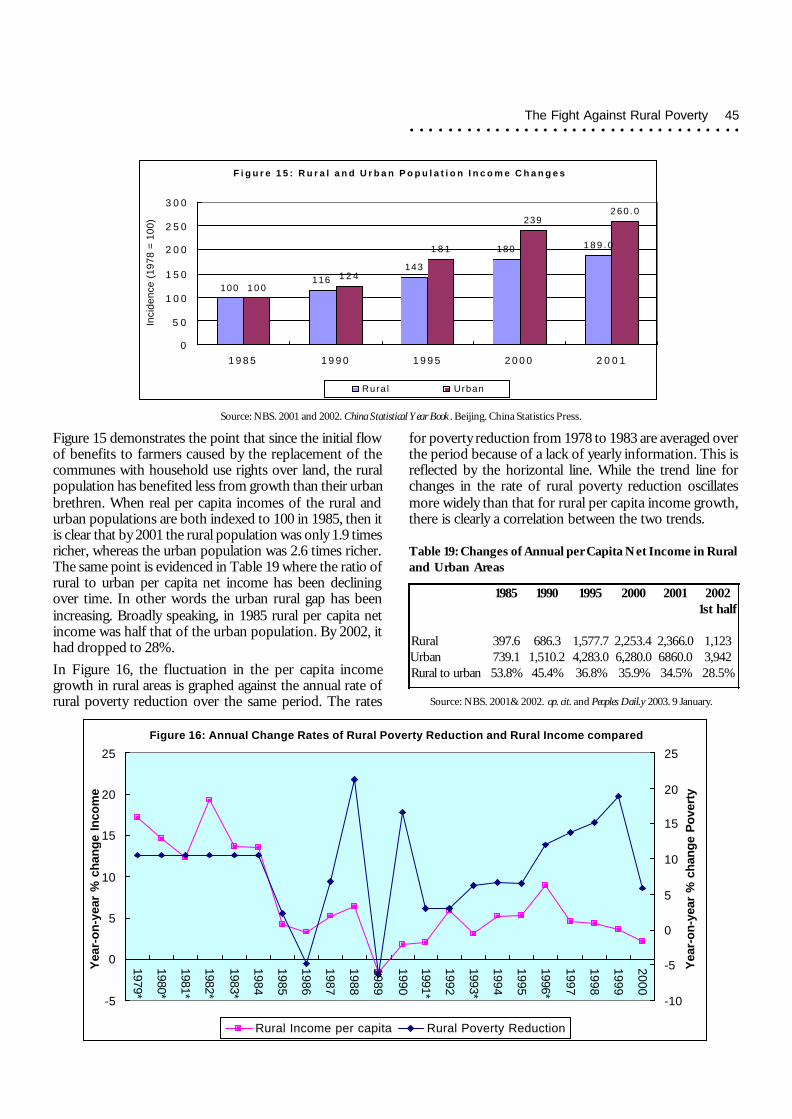
The Fight Against Rural Poverty 45
Source: NBS. 2001 and 2002. China Statistical Year Book. Beijing. China Statistics Press.
Figure 15 demonstrates the point that since the initial flowof benefits to farmers caused by the replacement of thecommunes with household use rights over land, the ruralpopulation has benefited less from growth than their urbanbrethren. When real per capita incomes of the rural andurban populations are both indexed to 100 in 1985, then itis clear that by 2001 the rural population was only 1.9 timesricher, whereas the urban population was 2.6 times richer.The same point is evidenced in Table 19 where the ratio ofrural to urban per capita net income has been decliningover time. In other words the urban rural gap has beenincreasing. Broadly speaking, in 1985 rural per capita netincome was half that of the urban population. By 2002, ithad dropped to 28%.In Figure 16, the fluctuation in the per capita incomegrowth in rural areas is graphed against the annual rate ofrural poverty reduction over the same period. The rates
for poverty reduction from 1978 to 1983 are averaged overthe period because of a lack of yearly information. This isreflected by the horizontal line. While the trend line forchanges in the rate of rural poverty reduction oscillatesmore widely than that for rural per capita income growth,there is clearly a correlation between the two trends.
Source: NBS. 2001& 2002. op. cit. and Peoples Dail.y 2003. 9 January.
Table 19: Changes of Annual per Capita Net Income in Ruraland Urban Areas
Figure 16: Annual Change Rates of Rural Poverty Reduction and Rural Income compared
-5
0
5
10
15
20
25
1979*
1980*
1981*
1982*
1983*
1984
1985
1986
1987
1988
1989
1990
1991*
1992
1993*
1994
1995
1996*
1997
1998
1999
2000
Yea
r-on
-yea
r %
cha
nge
Inco
me
-10
-5
0
5
10
15
20
25
Yea
r-on
-yea
r %
cha
nge
Pov
erty
Rural Income per capita Rural Poverty Reduction
F i g u r e 1 5 : R u r a l a n d U r b a n P o p u l a t i o n I n c o m e C h a n g e s
100116
143
180 1 8 9 . 0
1 0 01 2 4
1 8 1
2392 6 0 . 0
0
5 0
1 0 0
1 5 0
2 0 0
2 5 0
3 0 0
1 9 8 5 1 9 9 0 1 9 9 5 2 0 0 0 2 0 0 1
Inci
denc
e (1
978
= 10
0)
Rura l Urban
RuralUrbanRural to urban
1985
397.6739.153.8%
1990
686.31,510.245.4%
1995
1,577.74,283.036.8%
2000
2,253.46,280.035.9%
2001
2,366.06860.034.5%
20021st half
1,1233,94228.5%
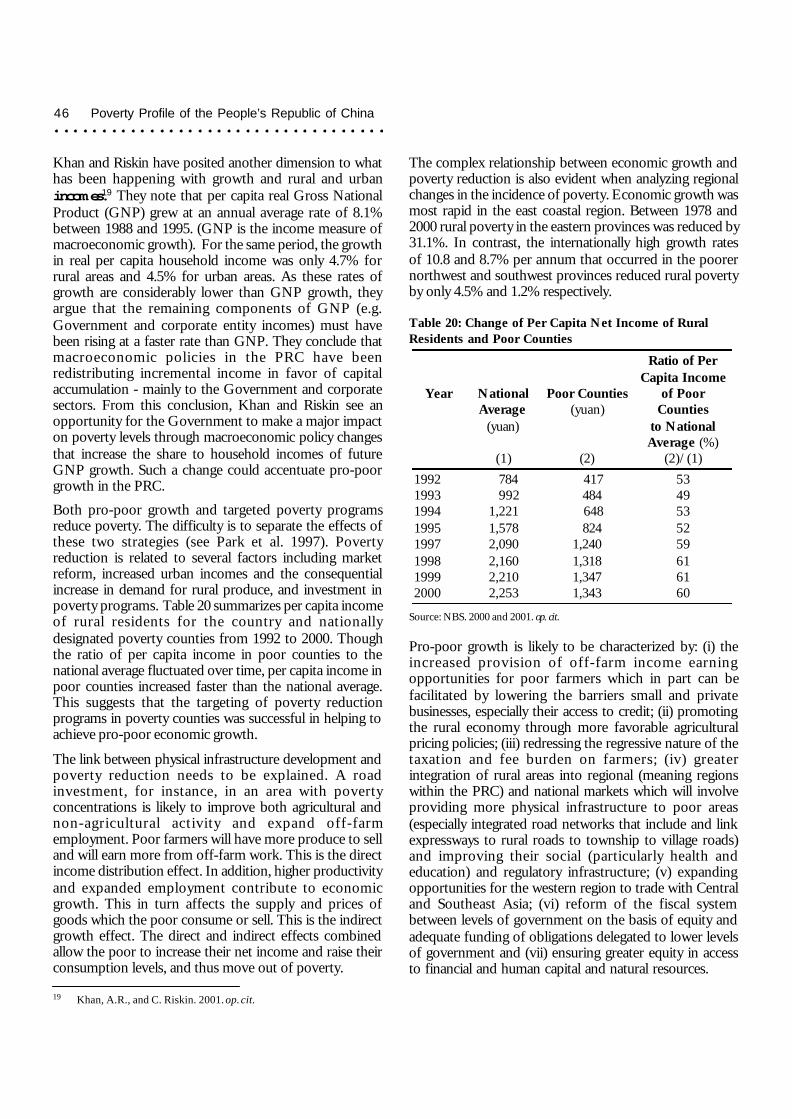
46 Poverty Profile of the People’s Republic of China
Khan and Riskin have posited another dimension to whathas been happening with growth and rural and urbanincomes.19 They note that per capita real Gross NationalProduct (GNP) grew at an annual average rate of 8.1%between 1988 and 1995. (GNP is the income measure ofmacroeconomic growth). For the same period, the growthin real per capita household income was only 4.7% forrural areas and 4.5% for urban areas. As these rates ofgrowth are considerably lower than GNP growth, theyargue that the remaining components of GNP (e.g.Government and corporate entity incomes) must havebeen rising at a faster rate than GNP. They conclude thatmacroeconomic policies in the PRC have beenredistributing incremental income in favor of capitalaccumulation - mainly to the Government and corporatesectors. From this conclusion, Khan and Riskin see anopportunity for the Government to make a major impacton poverty levels through macroeconomic policy changesthat increase the share to household incomes of futureGNP growth. Such a change could accentuate pro-poorgrowth in the PRC.
Both pro-poor growth and targeted poverty programsreduce poverty. The difficulty is to separate the effects ofthese two strategies (see Park et al. 1997). Povertyreduction is related to several factors including marketreform, increased urban incomes and the consequentialincrease in demand for rural produce, and investment inpoverty programs. Table 20 summarizes per capita incomeof rural residents for the country and nationallydesignated poverty counties from 1992 to 2000. Thoughthe ratio of per capita income in poor counties to thenational average fluctuated over time, per capita income inpoor counties increased faster than the national average.This suggests that the targeting of poverty reductionprograms in poverty counties was successful in helping toachieve pro-poor economic growth.
The link between physical infrastructure development andpoverty reduction needs to be explained. A roadinvestment, for instance, in an area with povertyconcentrations is likely to improve both agricultural andnon-agricultural activity and expand off-farmemployment. Poor farmers will have more produce to selland will earn more from off-farm work. This is the directincome distribution effect. In addition, higher productivityand expanded employment contribute to economicgrowth. This in turn affects the supply and prices ofgoods which the poor consume or sell. This is the indirectgrowth effect. The direct and indirect effects combinedallow the poor to increase their net income and raise theirconsumption levels, and thus move out of poverty.
The complex relationship between economic growth andpoverty reduction is also evident when analyzing regionalchanges in the incidence of poverty. Economic growth wasmost rapid in the east coastal region. Between 1978 and2000 rural poverty in the eastern provinces was reduced by31.1%. In contrast, the internationally high growth ratesof 10.8 and 8.7% per annum that occurred in the poorernorthwest and southwest provinces reduced rural povertyby only 4.5% and 1.2% respectively.
Pro-poor growth is likely to be characterized by: (i) theincreased provision of off-farm income earningopportunities for poor farmers which in part can befacilitated by lowering the barriers small and privatebusinesses, especially their access to credit; (ii) promotingthe rural economy through more favorable agriculturalpricing policies; (iii) redressing the regressive nature of thetaxation and fee burden on farmers; (iv) greaterintegration of rural areas into regional (meaning regionswithin the PRC) and national markets which will involveproviding more physical infrastructure to poor areas(especially integrated road networks that include and linkexpressways to rural roads to township to village roads)and improving their social (particularly health andeducation) and regulatory infrastructure; (v) expandingopportunities for the western region to trade with Centraland Southeast Asia; (vi) reform of the fiscal systembetween levels of government on the basis of equity andadequate funding of obligations delegated to lower levelsof government and (vii) ensuring greater equity in accessto financial and human capital and natural resources.
19 Khan, A.R., and C. Riskin. 2001. op. cit.
Table 20: Change of Per Capita Net Income of RuralResidents and Poor Counties
Source: NBS. 2000 and 2001. op. cit.
Year NationalAverage
(yuan)
(1)
Poor Counties(yuan)
(2)
Ratio of PerCapita Income
of PoorCounties
to NationalAverage (%)
(2)/(1)19921993199419951997199819992000
784 9921,2211,5782,0902,1602,2102,253
417 484 648 8241,2401,3181,3471,343
5349535259616160
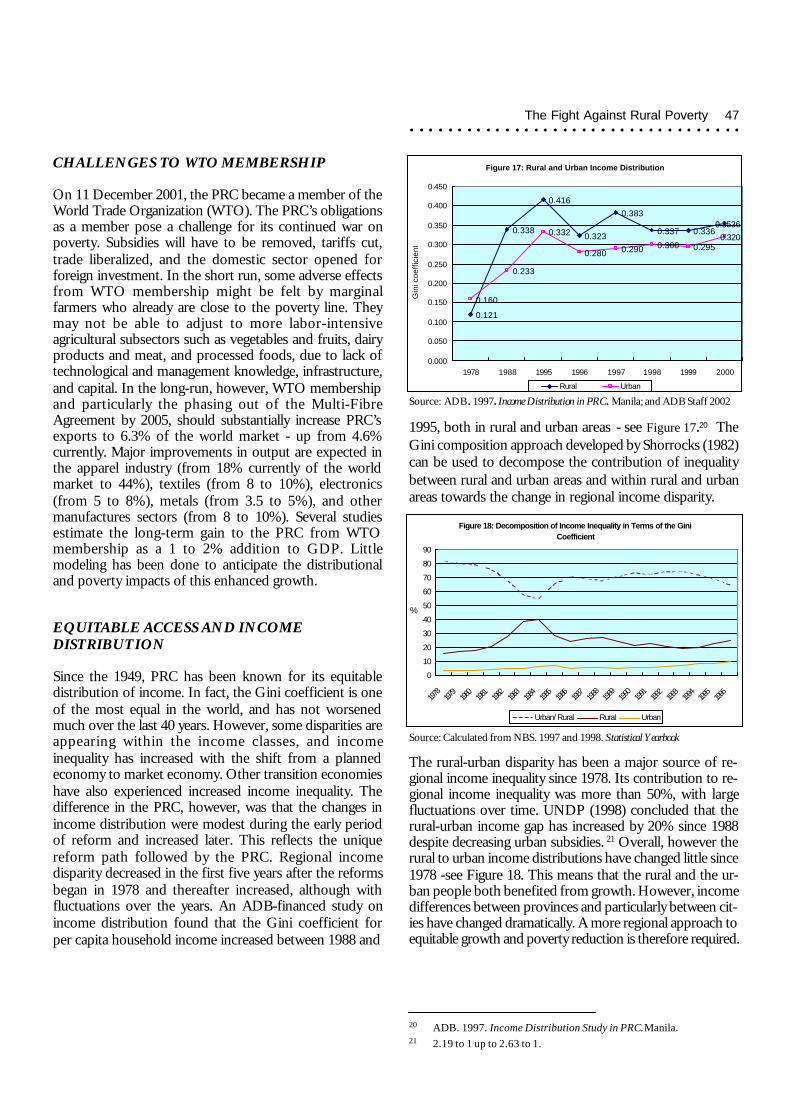
The Fight Against Rural Poverty 47
CHALLENGES TO WTO MEMBERSHIP
On 11 December 2001, the PRC became a member of theWorld Trade Organization (WTO). The PRC’s obligationsas a member pose a challenge for its continued war onpoverty. Subsidies will have to be removed, tariffs cut,trade liberalized, and the domestic sector opened forforeign investment. In the short run, some adverse effectsfrom WTO membership might be felt by marginalfarmers who already are close to the poverty line. Theymay not be able to adjust to more labor-intensiveagricultural subsectors such as vegetables and fruits, dairyproducts and meat, and processed foods, due to lack oftechnological and management knowledge, infrastructure,and capital. In the long-run, however, WTO membershipand particularly the phasing out of the Multi-FibreAgreement by 2005, should substantially increase PRC’sexports to 6.3% of the world market - up from 4.6%currently. Major improvements in output are expected inthe apparel industry (from 18% currently of the worldmarket to 44%), textiles (from 8 to 10%), electronics(from 5 to 8%), metals (from 3.5 to 5%), and othermanufactures sectors (from 8 to 10%). Several studiesestimate the long-term gain to the PRC from WTOmembership as a 1 to 2% addition to GDP. Littlemodeling has been done to anticipate the distributionaland poverty impacts of this enhanced growth.
1995, both in rural and urban areas - see Figure 17.20 TheGini composition approach developed by Shorrocks (1982)can be used to decompose the contribution of inequalitybetween rural and urban areas and within rural and urbanareas towards the change in regional income disparity.
The rural-urban disparity has been a major source of re-gional income inequality since 1978. Its contribution to re-gional income inequality was more than 50%, with largefluctuations over time. UNDP (1998) concluded that therural-urban income gap has increased by 20% since 1988despite decreasing urban subsidies. 21 Overall, however therural to urban income distributions have changed little since1978 -see Figure 18. This means that the rural and the ur-ban people both benefited from growth. However, incomedifferences between provinces and particularly between cit-ies have changed dramatically. A more regional approach toequitable growth and poverty reduction is therefore required.
EQUITABLE ACCESS AND INCOMEDISTRIBUTION
Since the 1949, PRC has been known for its equitabledistribution of income. In fact, the Gini coefficient is oneof the most equal in the world, and has not worsenedmuch over the last 40 years. However, some disparities areappearing within the income classes, and incomeinequality has increased with the shift from a plannedeconomy to market economy. Other transition economieshave also experienced increased income inequality. Thedifference in the PRC, however, was that the changes inincome distribution were modest during the early periodof reform and increased later. This reflects the uniquereform path followed by the PRC. Regional incomedisparity decreased in the first five years after the reformsbegan in 1978 and thereafter increased, although withfluctuations over the years. An ADB-financed study onincome distribution found that the Gini coefficient forper capita household income increased between 1988 and
20 ADB. 1997. Income Distribution Study in PRC. Manila.21 2.19 to 1 up to 2.63 to 1.
Figure 17: Rural and Urban Income Distribution
0.121
0.338
0.416
0.323
0.383
0.337 0.3360.3536
0.160
0.233
0.332
0.280 0.290 0.300 0.2950.320
0.000
0.050
0.100
0.150
0.200
0.250
0.300
0.350
0.400
0.450
1978 1988 1995 1996 1997 1998 1999 2000
Gin
i coe
ffici
ent
Rural Urban
Source: ADB . 1997. Income Distribution in PRC. Manila; and ADB Staff 2002
Figure 18: Decomposition of Income Inequality in Terms of the GiniCoefficient
0
10
20
30
40
50
60
70
80
90
1978
1979
1980
1981
1982
1983
1984
1985
1986
1987
1988
1989
1990
1991
1992
1993
1994
1995
1996
%
Urban/ Rural Rural Urban
Source: Calculated from NBS. 1997 and 1998. Statistical Yearbook

48 Poverty Profile of the People’s Republic of China
IMPACT OF AGRICULTURAL AND RURALINDUSTRIAL GROWTH
Agricultural and rural industrial growth reduced poverty inthe 1990s and early 2000s. During the major rural reformsin 1978 to 1985, aggregate growth was mainly driven byincreased agricultural output and improved product prices.Increased agricultural output accounted for 15.5% of thetotal increased income generated in this period. After 1985,agricultural became a less important factor in economicgrowth than the industrial and technology sectors.Nationally the agricultural share in GDP fell from 24.5%in 1991 to 15.2% in 2001, whereas the industrial shareincreased from 43% in 1985 to 51.1% in 2001.
Provinces making good progress in rural poverty reductiontended to have relatively high agricultural growth rates.Nonetheless, rural poverty declined during a period whenthe relative role of agriculture also declined. Rural povertycontinued to decline during the second half of the 1990s,when farm prices declined and agricultural input pricesincreased after liberalization. During this period, it was thegrowing role of the rural industrial sector and theGovernment’s targeted poverty programs that helped reducethe number of rural poor. This trend can be observed inall regions of PRC, even in the poorest parts.
As evidence of this trend, the proportion of net incomeof rural households derived from agriculture fell from61.8% in 1985 to 47.6% in 2001. During the same periodthe proportion of labor income increased from 18.0 to32.6%. The rapid expansion of TVEs had a substantialimpact on rural income growth and on poverty reduction.Income from secondary and tertiary industry increasedsubstantially between 1985 and 2001 from 18.9 to 47.8%of rural households’ total productive income. Creation ofoff farm employment opportunities, primarily in the privatesector, has been a powerful weapon in the fight againstpoverty.
These statistics reflect national averages and notnecessarily the situation of the rural poor. For example, inGuizhou province, which is one of the poorest provinces,agriculture as a share of rural income in 1998 was 64.9%(more than 15 percentage points higher than the nationalaverage). Data from sample research amongthose with net per capita incomes less than 790 yuan perannum indicate that the importance of agricultural activityincreases to as much as 75.8% of total householdincome.22 While the average share of income due to
agriculture in key counties for national poverty reductionis less than these sample based figures, it neverthelessindicates the importance of agriculture to the level ofincome accessed by rural poor.23 This implies that ruralpoverty reduction projects which can effectively target thislinkage can have a particularly strong impact in reducingpoverty.
INFLATION AND PRICES
An important question in assessing macroeconomic impactsis to consider the relationship between inflation and ruralpoverty. After steep increases between 1987 and 1989 and1991 and 1994, inflation has stabilized. Although deflationand falling prices were major policy concerns in 1999 and2000, prices have now leveled out and only moderate pricemovements have occurred during 2001 and 2002.
As the rural poor generally have low savings and since mostof their income is from their own farm production andoff-farm wages, inflation did not have a negative impact ontheir real income. However, the fall in farm prices since1993 worsened the terms of trade for agriculture. Since1996 agricultural product prices have fallen by more than25%. As a major source of rural income still comes fromagriculture, many farmers – particularly with incomesaround the poverty line – are affected by agricultural pricechanges. A case study for 500 sample households in sixpoor counties found the change of relative prices over 1985-1992 negatively impacted poverty reduction (Wu, 1997).Using current prices, the incidence of poverty in these sixcounties was 24.4% in 1992. After adjusting for pricechanges, the poverty incidence rose to 26%. However,agricultural price changes would not so adversely affect therural poor if they are able to derive an increasing portionof their income through wage employment.
FISCAL CHALLENGES
Among other positive things, economic growth generatesState revenue, some of which can be used to fundGovernment poverty programs. Sustained economic growthalso enhances the Government’s financial capacity toaddress environment, infrastructure, and socialdevelopment problems in a proactive way. Shortcomingsin these areas contribute to the continuance of poverty.
22 The bottom 13 th percentile.
23 Agriculture as a source of income in nationally designated povertycounties decreased during 1997-99: 1997: 68.6%; 1998: 65.4%; 1999:59.6%. However, statistics derived among the poor in poor counties(per capita income RMB 0-625) confirms these sampled Guizhou figureswith agriculture’s share of income being 73.4%. Because ofdistributional reasons both national and county statistics do notaccurately reflect the realities of the poor themselves. The poor, onaverage, represent only 13% of the population of national povertycounties.

The Fight Against Rural Poverty 49
From 1998 to 2001, in the aftermath of the Asian financialcrisis, the Government followed an expansionary fiscalpolicy and stimulated large investments in infrastructure.Nevertheless, the Government’s expenditure share of GDP,although it increased from 13.2% in 1995 to 19.7% in 2001,remains relatively low compared to other developingcountries.
The central and many provincial governments have showna strong commitment to fund poverty reduction. Since 1996,the annual allocations to poverty programs in the nationalbudget have been rising in real terms. In the year 2000,poverty reduction programs reached 1.3% of publicexpenditures - more than the Government spends forhealth. Furthermore, the new poverty reduction program(2001-2010) foresees a net increase in poverty reductionfunding of 5-10% per year.
Although overall there is strong fiscal commitment forpoverty reduction, the weak revenue bases of poor countiesprovide at least seven major challenges for effective andefficient poverty reduction:
(i) Poorer provinces and counties cannot mobilizesufficient counterpart funds, thus limiting their abilityto finance infrastructure projects and encouragingthese levels of government to ask the poor to providefree labor. This substantially reduces the expectedincome generating effects of Food for Workprograms.
(ii) County governments in poor areas often havestructural budget deficits. In some poor countiespoverty funds account for 20-35% of all fiscaltransfers and 15 to 30% of budgetary revenues.Given this dependency, these local governments areunder pressure to divert poverty funds to unavoidableexpenditures, like staff salaries, or to unfundedpriority projects.
(iii) Resource-constrained local governments have astrong interest to use the poverty reductionsubsidized credit schemes for projects that quicklygenerate taxable income. In this context, localgovernments and the Agriculture Bank of China(ABC) share a common interest. The non-policybanks, being now required to operate on commercialcredit risk management principles, are focused onrecovering and re-lending their loans as soon aspossible, and reducing administration costsby lending larger amounts to fewer clients. Thusthere has been a skewing of poverty loans to TVEsand the new, larger entrepreneurs. There is no
guarantee that such lending will have the desiredeffect on poor households.
(iv) The poverty funds are targeted on infrastructureand income related programs only. Participatorystudies show, however, that investments in humandevelopment are also very important to povertyreduction. A healthy and well-educated person ismore likely to be able to find pathways out ofpoverty. An unhealthy poor person will not have themoney to pay for catastrophic health care. Indeed,borrowing to meet that cost may prolong thathousehold’s period in poverty by many years. Abetter education is the surest way for today’schildren to break out of poverty in the nextgeneration. The effectiveness of education as ameans of poverty reduction has been demonstratedin several studies of the PRC including a recentIFPRI study which concludes that education is themost pro-poor public investment.24
(v) The weak budgetary situation of localgovernments, combined with national policy oncost-recovery, has meant that fees for access toeducation and health services are applieduniversally to all school children and clinic andhospital patients, irrespective of their capacity topay. Even though the primary school or the healthclinic may be built within two kilometers of poorhouseholds, the fees constrain the poor from usingof these services. For instance, maternal and childhealth of the poor is put at high risk as mothersstave off going to the clinic or local hospital toconserve scarce household income. The necessityfor local government to impose these fees is anti-poor in its impact on the community.
(vi) Even with the diversion of poverty funds to propup local government budgets, this grass roots levelof government remains strapped for cash. In orderto meet budget deficits, local governments havecreatively devised fees to impose on the public.Many of these fees are not strictly legal. These feesare anti-poor as concessional rates for those onvery low incomes are not generally allowed. Thefees act as a regressive tax. Recognizing thisproblem, the national government commenced anexperiment in Anhui Province in 2000 to substitutea transparent and regular tax system on farmers forthe multitude of fees. The new leadership of the
24 Fan, S., Linxiu Zhang and Xiaobo Zhang. 2002. Growth, Inequality,and Poverty in Rural China: The Role of Public Investments. ResearchReport 125. Washington, DC.: International Food Policy ResearchInstitute.

50 Poverty Profile of the People’s Republic of China
PRC announced in January 2003 that they wouldspread the “fees-to-tax” reform more widelythrough rural areas and complement this withincreased investment in education, health andculture for the rural population.25
(vii) As seen from the above challenges, the weakfinancial situation of the poor counties generates arange of distortions often contrary to povertyreduction, as they seize each opportunity to capturefinancial resources. In order to mitigate thesedistortions, a fiscal transfer system needs to bedevised that adequately underpins social equity.
A CONTRARY VIEW
In their book, Inequality and Poverty in China in the Age ofGlobalization, Azizur Rahman Khan and Carl Riskin havederived from their research a different set of conclusionsabout macroeconomic policies and poverty reduction inPRC. They view the major shortcoming as being asegregation of the poverty reduction policies from therest of the economic policies. These scholars note that asa result of this segregation, many of the Government’stargeted actions for poverty reduction were muted by theadverse distributional effects of overall economic policies.Consequently they recommend a comprehensive packageof developmental policies, covering for instance regionalbalance in growth, the relative emphasis on capitalaccumulation as opposed to income distribution andefficient use of resources, the sectoral terms of trade, andpublic finance. They argue that comprehensiveadjustments in these policies can improve poor householdwelfare far more than the targeted county and below levelinterventions financed under the 8-7 program.
Recommendations on each element of a comprehensiveset of pro-poor economic policies are made in their book.Not all of these make comfortable reading for thosededicated people who have worked so hard on designingand implementing the targeted programs. For instancethey point that if the funds made available for povertyreduction in 1995 by the national and local governmentsand by NGOs and international donors had beenperfectly targeted as an income transfer program to therural poor, then rural poverty, as officially defined, wouldhave been eliminated. This comment should encourage areview of the PRC’s rejection of the relief approach as atool in poverty reduction.
INSTITUTIONAL RESPONSIBILITYFOR RURAL POVERTY REDUCTION
COORDINATING POVERTY REDUCTIONWORK
The organization of poverty reduction reflects thestructure of the Government and includes thoseministries and agencies that primarily undertake the taskof poverty reduction and rural development. Together, atiered hierarchy of leading groups, governmentdepartments and various financial institutions throughoutthe country form three distinct but interrelatedorganizational cones. NGOs (domestic and international)and private enterprise are generally considered assupplementary actors in the war against poverty. Thisstructure is illustrated in Figure 19.
At the apex of this structure is the State Council LeadingGroup for Poverty Alleviation and Development (LGP).This was established in 1986 directly under the StateCouncil to organize, research, draft policies and programs,coordinate and monitor efforts to solve the major issuesin development-oriented poverty reduction efforts amongvarious relevant government ministries. The LGOPreports to a Vice Premier as chairperson. There are sixassociated or deputy chairpersons. These are a DeputySecretary-General of the State Council, Vice Ministers forthe National Development and Reform Commission(NDRC), Finance, and Agriculture, a Vice Governor ofthe People’s Bank of China (PBOC) and the Director-General of the State Council Leading Group Office ofPoverty Alleviation and Development (LGOP). Inaddition, there are 23 other members comprising viceministers from a range of ministries, presidents ofnational government bureaus and commissions, anddirectors of agencies and GONGOs. The LGP usuallymeets three to four times a year. The membershipstructure of the LGP as of 2002 is shown in Figure 20.
The LGP has the LGOP as its permanent administrativesupport agency. LGOP is charged with: day-to-dayworkload; policy research on development-orientedpoverty alleviation; planning and organizingimplementation; coordinating poverty reduction effortsfrom all segments of society including help from easterndeveloped areas to support poverty reduction in thewestern region; coordinating and organizing governmentand Party Central Committee departments to reducepoverty in designated areas; determining the supportcriteria for the rural poor and State-targeted counties;
25 China Daily. 2003. Nation to narrow gap between city and countryside.9 January.

The Fight Against Rural Poverty 51
Figure 19: Institutional Framework for Poverty Reduction Policy Making and Program Implementation
Liaison among agencies and informal relationships Direct authority relationship
a: For microfinance schemes only.b: Particularly MOFCOM, NFB, MWR, MST, MOE, MOPH, MOC, MOR, MII, MLSS, MCA, and SFPC.c: Such as ACWF, ACCYL, CFPA, and YSDF.d: Such as the Glorious Scheme.
State Council
Leading Group on Poverty Alleviation and
Development
Other Ministries and Agencies (b) (Other Non-Loan
Funds)
Provincial ABCs
Agriculture Bank of China
(Poverty Loans)
Ministry of Finance
(Development Funds)
National Development And Reform
Commission (Food- for-Work Funds)
Prefecture ABCs
County ABCs
Township ABC
Operations Offices
Many accounts handled by ABC
on behalf of RCC
Funding the Poor
Cooperatives
Provincial Government
Leadership and Poverty Offices
Prefecture Government
Leadership and Poverty Offices
County Government
Leadership and Poverty Offices
Provincial Finance Bureau
Provincial Planning Commissions
Provincial Bureaus NGOs ( c )
Prefecture Finance Departments
Prefecture Planning
Departments
Prefecture Departments
County Finance Departments
County Departments
County Planning Departments
Planning &
Finance Department
Policy &
Regulation Department
External Coordination Department
General Affairs
Department
Chinese Service Center of Poverty
Alleviation & Development
(Rural Industry)
National Training
Centers for Cadres and
Officials in Poor Areas
Foreign Capital
Project Management
Center
For example China
Foundation for Poverty
Alleviation
Township Leadership
Village Committees
Poor Households
People’s Bank of China (Rural Credit)
County RCC
Branches
Township RCC
Branches
Private Sector
(d)
Leading Group Office of Poverty Alleviation and Development

52 Poverty Profile of the People’s Republic of China
Figure 20: Composition of the LGP
deliberating on categorization and graduation of targetedcounties; organizing and guiding statistical monitoring ofpoverty reduction; coordinating planning efforts toallocate central government poverty reduction funds;checking and supervising the application of these funds;guiding priorities for anti-poverty projects that cut acrossprovinces; promoting public awareness of povertyreduction; interaction and cooperation with internationaldonors assisting with poverty reduction; hosting thetraining of cadres from the PRC’s poor areas in theimplementation of development-oriented povertyreduction; and handling and other matters referred to it bythe LGP.
LGOP is headed by a Director General who directlyreports to the LGP chairperson, and thus the StateCouncil, on programming and strategy issues. In 2001,staffing at the national level was around 120 personnel.
The national LGP and LGOP structure is replicated at thelocal government level, particularly in the provinces andpoverty counties (see Figure 19). At the township level,usually one or two staff are designated to be responsiblefor activities relating to poverty reduction.Guizhou province can be taken as an example of staffresources. In that province in 2001, there were 29 full timePADO staff at the provincial level, 106 at the prefecturelevel, 420 at the county level (key counties for nationalpoverty reduction and development), and 810 at thetownship level. Guizhou’s PADO resources weresupplemented by 1,124 part time workers.
The county PADOs are responsible for preparing andapproving projects that apply to use central governmentpoverty reduction funds. The provincial PADOs workclosely with the Provincial Planning Commissions and theBureaus of Finance.
Deputy Secretary-General of theState Council
Vice Minister of the National Developmentand Reform Commission
Vice Minister of Finance
Vice Governor of the People’sBank of China
Vice Minister of Agriculture
Director General of LGOP
Associated Chairs:
STATE COUNCIL
Chairperson
Leading Group for PovertyAlleviation and Development
State CouncilLeading Group
Office of PovertyAlleviation andDevelopment
(LGOP)Director General
ProvincialStructure
(Prefecture)
County Structure(in povertycounties)
Members:
ViceMinisters ofMinistries
ViceMinisters,
VicePresidents,
and ViceDirectors of
Commissionsand Bureaus
Education
Science and Technology
Ass/Director State Committee on National Matters
Civil Affairs
Labor and Social Security
Vice Minister of Land and Resources
Transportation
Water Resources
Public Health
State Family Planning Commission
State Environmental Protection Administration
National Statistics Bureau
State Forestry Bureau
Agriculture Bank of China
All-China Labor Union
Communist Youth Central Committee
All-China Women’s Federation
All-China Supply and Marketing Cooperative
China Disabled Person’s Federation
Secretariesand Vice
Directors ofGONGOs
Commerce

The Fight Against Rural Poverty 53
IMPLEMENTING RURAL RELIEFPROGRAMS (THE FIVE GUARANTEESPROGRAM)The PRC’s rural relief program is implemented by theMinistry of Civil Affairs (MCA), and is independent fromthe Government’s poverty reduction program. Under theprogram, food, clothing, housing, medical care, burialassistance, and education for the orphans are provided tothe destitute and to victims of natural disasters such asfloods, droughts, and earthquakes. Due to risingfrequency of natural disasters in the 1990s, rural relieffunding substantially increased. In Yunnan, for example,provincial funding increased from 46 million yuan in 1990to 132 million yuan in 1998. However, the increasedprovision of funds is not sufficient to cope with the risingcosts of providing a minimum safety net for the pooraffected by natural disasters.
IMPLEMENTING OTHER RURAL SOCIALSECURITY SCHEMES
Other forms of social security in rural PRC are either fewin number or have low coverage. Mostly they aremanaged by the provincial and lower levels of MCA,often in conjunction with village committees. These socialsecurity schemes are either non-contributory safety netsor provide pre-determined support to contributors. Thefive guarantees program has the widest coverage of thenon-contributory safety nets. Some rural areas haveinstituted a safety net which parallels the Minimum LivingStandards Scheme (MLSS) now found in all PRC cities.Under MLSS, benefits are means tested, filling the gapbetween a poor household’s per capita net income and aminimum standard set locally. There are also a number oflocal rural support schemes for poor households whichare financed by villages and townships and by donations.Geographical coverage is limited and the nature of theschemes varies widely between localities. There aregenerally means tested. County Civil Affairs Bureaus andVillage Committees administer these highly localizedschemes.
There are two types of contributory social securityschemes that can be found in a number of rural areas.Little is known about the extent to which these schemeshave prevented households falling into poverty, or assistedthem to rise above poverty. One is the rural pensionschemes which were instituted in 1991 and now subject to
a major redesign with a new system expected to beannounced in 2003. While Government recommendsthese schemes to rural residents, they are not mandatory.These schemes cover 60 million rural people (6.4% of thetotal).26 The level of pension paid relates to contributionsmade and are set to cover only a proportion of basicsubsistence needs. These schemes are administered by theCounty Civil Affairs Bureaus and the Village Committeesunder the supervision of the Provincial Civil AffairsBureaus and MCA. The second scheme is ruralcooperative medical insurance which dates back to the1970s but has also been promoted by Government inrecent years. Like rural pension schemes, this insurance isnot mandatory. Around 20% of the rural populationcontribute to this scheme and generally it covers them forbasic medical treatment only. Institutional responsibilityfor this scheme is shared between the County Civil Affairsand Public Health Bureaus and the Village Committees.The Provincial Civil Affairs Bureaus and MCA havesupervisory roles.
ROLE OF THE MINISTRY OF FINANCEAND THE NATIONAL DEVELOPMENTAND REFORM COMMISSION AND OTHERMINISTRIES/AGENCIES
NDRC, MOF, ABC and LGOP prepare initialdistribution plans for the FFW programs and the interestsubsidies for credit funds. After assessment, LGOPsubmits the distribution plans to the LGP for approval.This procedure is mirrored at provincial and countygovernment levels.As poverty reduction is seen as a responsibility of allelements and levels of government, there is a wide rangeof involvement by ministries, agencies and associatedGONGOs in poverty reduction activities. Theirinvolvement is summarized in Box 3.
RURAL FINANCIAL INSTITUTIONSThe main rural financial institutions providing loans torural households are the Agricultural Bank of China(ABC, or Nongye Yinhang), the PBOC-supervised RuralCredit Cooperatives (RCCs, or Nongcun Xinyong She)and networks of informal lending. The ABC and theRCCs, under PBOC supervision, distribute and supervisethe largest single poverty reduction resource - thesubsidized credit.
26 China Daily. 2002. Farmers’ pension in pipeline. 15 October.

54 Poverty Profile of the People’s Republic of China
The Ministry of Finance (MOF) makes regulations regarding the management and use of development funds, plans theallocation of the funds and, after LGP approval, supervises its use.
The National Development and Reform Commission (NDRC) is responsible for macroeconomic and development policiesfor poor areas and assessing and planning the allocation of support for the Food-for-Work (FFW) Program, subject to LGPapproval.
Ministry of Commerce (MOFCOM) helps poor areas determine commodity production bases, build commercial facilities, andpromote cross-border trade.
Ministry of Agriculture (MOA) promotes agriculture production in poor areas and technological improvements and overseesrural power enhancements.
The National Forestry Bureau (NFB) helps poor areas achieve sustainable economic forestry production with attention toecological protection.
The Ministry of Water Resources (MWR) oversees programs for potable water for people and livestock in poor areas, small-scale hydropower in mountainous areas, small river basin development, and water conservancy.
The Ministry of Science and Technology (MST) has adopted special policies to enhance the application of new technologies inpoor areas.
The Ministry of Education (MOE) ensures that science curricula are implemented in poor areas as well as ensuring primary,vocational, and literacy education.
The Ministry of Communications (MOC) constructs roads to poor counties and townships.
The Ministry of Railways (MOR) provides freight transportation for the commodities and goods for poor areas.
China Power requires power companies to bring power to all poor counties to help develop industrial and agricultural production.
The Ministry of Information Industry (MII) is expanding telephone and mail service to poor townships and villages. The Statebureaus responsible for mining, coal, and chemicals help poor areas develop resources in a sustainable manner and expand thesupply of chemical fertilizer.
The Ministry of Labor and Social Security (MOLSS) helps people in poor areas find employment elsewhere.
The Ministry of Civil Affairs (MCA) is responsible for helping the poor who are disabled, victims of disaster, and familymembers of military servicemen and revolutionary heroes.
The Ministry of Culture and broadcast agencies bring film, radio, and television facilities to poor areas.
The Ministry of Public Health (MOPH) develops treatment, prevention, and health care facilities and programs in poor areas.Medical universities are required to enroll students from poor areas.
The State Family Planning Commission (SFPC) brings information campaigns and contraceptive devices to the poor.
The Ministry of Personnel has programs for low-income civil servants.
Nation Bureau of Statistics (NBS) is responsible for conducting household surveys to assess the poverty situation and provides aconfidential, internal annual analysis of poverty reduction progress in terms of funding input, infrastructure and agriculturedevelopment, agricultural and industrial production, farmer income, and county finance.
The National Audit Office is responsible for assessing each year if poverty reduction funds were allocated on time and in fullsolely to poor households and villages and for identifying any corruption.
Note: Government bureaus and departments at the provincial and county levels play similar roles as their national counterpartgovernment departments. Provincial PADOs, Development and Reform Commissions, Commerce Bureaus, Science andTechnology Bureaus, Finance Bureaus, and banks determine their aspects of the poverty reduction plans. Trade Unions, the All-China Communist Youth League (ACCYL), All-China Women’s Federation (ACWF), and the Chinese Association for the Disabledcarry out their own functions in close collaboration with government agencies. LGOP’s Training Center for Cadres and Officials inPoor Areas helps to ensure that local poverty reduction officials are aware of the latest policies and methodologies to carry out theirjobs.
Box 3: The Roles of Ministries and Government Agencies in Poverty Reduction

The Fight Against Rural Poverty 55
Agriculture Bank of China (ABC): The ABC is a largeState-owned bank with branches in all counties and mosttownships nation-wide. ABC’s clients are mainly TVEs,other collective enterprises and SOEs. It also servesindividual farmers and private enterprises. In the bankingreforms of the mid 1990s, ABC was clearly tasked toperform as a commercial, and not a policy bank. In 1996,the ABC accounted for 14% of lending in the PRC. Interms of volume, most of its credit resources wereextended as working capital loans to State commercialenterprises, 14% went to TVEs and 16% to agriculture(including some households).27
The ABC has been associated with poverty lendingthrough its earlier involvement in managing directedcredit of various types. Since 1998, the ABC has beenprimarily responsible for funds dispersal under thegovernment’s subsidized lending program for povertyreduction. Initially officials from local PADOs continuedto control the lending, but in 1999 control was passed toABC. The persistence of historically poor credit disciplinein the program has led to problems for ABC managementand staff because of the ABC’s commercial orientationand strong internal accountability for lendingperformance. As a result, the general trend within ABC isa disinclination to lend to the rural poor.
Agriculture Development Bank of China (ADBC):With branches at the county level, the ADBC wasestablished in 1994 as a policy bank primarily to deliverthe Government’s subsidized poverty lending program aswell as other subsidized credit schemes and financingSOEs for the purchase and storage of grain, cotton, andedible oil. In 1996, the ADBC accounted for 10% ofnational lending. Ninety percent of ADBC’s loans werefor agricultural procurement, mainly grain. A recentinvestigation found 40% of outstanding lending to beunrecoverable.28 Due to this poor loan performance,subsidized credit operations were transferred back to theABC in 1998. ADBC’s operations are now primarilyconfined to acting as a conduit for Government lendingto agriculturally related SOEs. It does not take depositsfrom the public and lends in accordance with State policy.
RCCs: In the 1950s when RCCs were initially formed,they were structured as cooperatives, owned and run bythe members to provide credit to the membership. Theybecame cooperatives in name and were essentially smallscale rural credit institutions subordinated to supervisionfirst by PBOC, and later the ABC until 1996, and then
again by PBOC when the RCCs were separated from theABC.
RCCs cover most townships and are the only financialinstitutions with branch outlets extending to most villages(usually the village accountant or village head act as theagents for RCC lending and are employed on a part timebasis to deliver financial services at the grass roots). RCCclients are generally farmers, TVEs or rural privateenterprises. The RCC mandate from the State Council isto achieve an allocation of more than 50% of credit toindividual households. In practice, this has provendifficult to achieve. Due to high transaction costs insupplying credit to farmers, RCCs prefer to extend loansof larger scale to wealthier farmers or enterprises that areconsidered less of a credit risk. By the end of 1998, thebalance of RCC lending to farmers was 184 billion yuan,representing 25% of the total RCC loan portfolio. About80% of farmers have deposits in RCCs and nearly halfhave been granted loans from the RCCs in the past.RCCs are now exploring new ways to deliver service tofarmers both through experimental linkages withmicrofinance projects and new lending mechanisms suchas the use of joint liability groups. Like all formal creditadministered in the PRC, RCC interest rates are Statecontrolled. RCC management is weak, and the use of jointliability groups among relatively better-off farmers,though agriculture-related, will not bring them closer tothe poor.
“Hui”s: “Hui”s (Rotational Savings and CreditAssociations or ROSCAs) exist as informal financialinstitutions for farmers’ mutual lending. They are closer tothe relative and absolute poor than the banks and theRCCs. The “Hui” have a long history among PRC coastalareas. Following the establishment of the new republic in1949, “Hui”s remained in operation and survived bygoing underground. Following reform and opening up inthe late 1970s, “Hui”s expanded as an important part ofthe rural credit system.
In essence, “Hui”s comprise a small number of people(often having some family ties with one another) whoform a group that meets at regular intervals, pooling asum of money for one member at each meeting. Theinterest rate on loans is usually about 20% per annum.The number of “Hui” members vary (though some Huihave fixed members) and the interval between meetings isusually flexible.
There are three main “Hui” models depending on howmembers pool funds and administer loans:
27 Park, A., and Q. Chang. 2001. Microfinance with ChineseCharacteristics. World Development Vol 29 (1): 39-62.
28 Chinabrief. 1999. Vol 2 #2. May. Beijing.

56 Poverty Profile of the People’s Republic of China
• “Lun Hui” (“Lun” means credit allocation byscheduled order);
• “Biao Hui” (“Biao” means credit allocation bybidding); and
• “Yao Hui” (“Yao” means credit allocation bythrowing dice).
These Hui provide some evidence of what makes a viablesmall scale lending organization. These positive featuresare:
• variety in form, duration, members, amount of fundsand ways in which the order of extending loans isdetermined to meet various financial demands;
• members within the same “Hui” are usually familiarwith each other, and the overall number of membersis small;
• “Hui”s with a modest volume of pooled funds lentout at modest interest rates tend to operate withstability and sustainability.
PBOC has put in place regulations to curb informal ruralfinance activities, including those of the “Hui”s. Despitethis, “Hui’s” have continued to flourish.29
GOVERNMENT RURAL POVERTYALLEVIATION STRATEGIESThe PRC has employed various mechanisms and linkagesforcefully and sustainably to reduce poverty. These haveincluded combinations of policy reform, direct investmentand regulation to establish mechanisms for facilitatingbroad-based economic growth. There has also been strongand sustained political commitment to the distribution ofincome, investment into human resources andencouragement of labor intensive growth.
Beginning in 1986, the PRC has generally pursued an areadevelopment poverty reduction strategy. The limited successof attempts prior to 1978 to reduce poverty via targetingthe poor with direct financial assistance partially explainsthe adoption of this strategy. The earlier direct assistancehad fostered unhealthy dependence on Governmenthandouts.
The area development poverty reduction strategy embodiedfive primary characteristics:
i) poverty targeting was determined according toregional and administrative boundaries (the 331
designated national poverty counties); 30
ii) a policy focus on activities that promote regionaleconomic development to achieve poverty reduction;
iii) emphasis on exploiting natural resources within thesepoor regions as the means to developing the county’seconomy;
iv) improving the well-being of the poor throughcapacity building, infrastructure development andtechnical training; and
v) encouraging resettlement and off-farm labormigration for the rural poor suffering severeconstraints to basic subsistence.
The PRC has primarily pursued a two-pronged approachto reducing the absolute number of the poor, namely“Government Poverty Alleviation” (Zhengfu Fupin) and“Society-based Poverty Alleviation” (Shehui Fupin. Table21 sets the scene for the discussion on these two approaches.This table itemizes, in current values, all poverty reductioninputs from 1994 through to 2000. This data shows therelative size of the Zhengfu Fupin and Shehui Fupincomponents as well as the international donor-financedcomponent.
GOVERNMENT POVERTY ALLEVIATION
The Government poverty alleviation strategy has comprisedthree main elements: (i) Subsidized Loans, (ii) Food ForWork (FFW), and (iii) Development Funds.
SUBSIDIZED LOANS
Before 1984, poverty loans from MOF supportedproduction activities (especially TVEs) in poor rural areas.After 1984, however, credit institutions delivered povertyloans with an increasing focus on poor households. By 1986,subsidized credit had been introduced by the nationalgovernment using the ABC for loan allocation andmanagement. Under this facility, the Government financedboth a line of credit and the difference between the standardand subsidized rate of interest. Underlying this facility wasthe hypothesis that a major barrier preventing the poor fromhelping themselves was a lack of capital. The poor wereunable to access formal credit through the banking systemeither because they lacked necessary assets as collateral, orwere excluded because they could not be expected to paystandard interest rates on loan finance.
29 Liu, J. 1994. Informal Finance in Rural China. In Reform and Developmentof Rural Finance in China: 1978-1990. Edited by Deng, Yingtao, et. al.,Hong Kong. Oxford University Press: 109-132.
30 An additional 358 Poor Counties were designated at the provincial level.

The Fight Against Rural Poverty 57
From 1986 to 1989 priority was given to extendingsubsidized loans to rural households in the then nationalpoverty counties for agricultural crops, livestock, andagricultural processing. Interest rates were set at 2.88%and the repayment period was 3-5 years. Of the threeelements of the Government poverty alleviation program,subsidized loans consistently received most of the funds.On average between 1986 and 2000, subsidized loans wereallocated 58% of the annual provision for the program
(see Table 21 for current values and Figure 21 for con-stant values).
Official reports at the end of 1987 indicated that the tar-geting of subsidized loans was on track. During the firstyear of implementation, 92% of such loans were distrib-uted directly or indirectly to farm households, rather thanto county, township, or village enterprises. Despite this fo-cus, the pace of poverty reduction during the period 1986to 1989 slowed. According to official statistics, betweenthe end of 1985 and the end of 1989, the number of ruralpoor declined by 23 million or 5.75 million per year. Thiswas approximately only one third of the average annualreduction between 1978 and 1985.
This paradox between a policy of lending directly to thepoor and poor results in poverty reduction reflects thefollowing factors. Firstly, there was mistargeting becausepoor counties’ regional economic development prioritiesdid not cover the majority of poor areas or poorhouseholds.31 Secondly, it is probable that by about 1988subsidized loans intended for poor rural households werebeing diverted to enterprises, a trend that was notadequately reported. Table 22 shows that for Huangpingcounty in Guizhou Province direct credit targeting of
31 Riskin, C. 1994. Chinese Rural Poverty: Marginalized or Dispersed?American Economic Review, Papers and Proceedings 84(2): 281-284.Jalan and Ravallion comment that statistics from four southern provinces(Guangdong, Guangxi, Yunnan and Guizhou) reflect that even by thelate 1980’s, as little as half of the poor of the region are accounted foramong nationally designated poverty counties.
1994 1995 1996 1997 1998 1999 2000
1 National government inputs 9.79 9.85 10.80 15.30 18.30 25.80 26.50
a. Subsidized loans 4.55 4.55 5.59 8.50 10.00 15.00 15.00
b. Food for work 4.00 4.00 4.00 4.00 5.00 6.50 6.90
c. Development funds 1.24 1.30 1.30 2.82 3.30 4.30 4.70
2 Provincial and local counterpart funds 1.11 1.70 0.74 4.46 4.02 3.75 4.49
3 Foreign loan funds 1.28 1.73 2.27 1.26 1.26 1.36 1.44
4 Foreign funds (multilateral, bilateral, NGOs) 1.04 1.41 1.86 1.03 1.03 1.12 1.17
5 Donations (NGOs) 0.25 0.30 0.35 3.34 5.40 3.35 3.69
6 Funds from other sources 0.30 2.22 2.00 3.49 2.70 3.54 2.41
a. Central ministries and enterprises 0.30 0.95 0.92 0.56 0.59 1.15 1.00
b. Provincial and local governments and enterprises 1.27 1.08 2.23 1.77 1.80 1.80
c. East-west cooperation 0.70 0.34 0.59 0.61
Total 13.74 17.20 18.00 28.87 32.70 38.90 39.70
Table 21: Total Poverty Reduction Inputs over the “8-7” Program Period(Value unit: billion yuan in current prices)
Source: China Foundation for Poverty Alleviation. 2001. Paper presented at the Conference on NGOs., Beijing, November.
Figure 21: Government Poverty Alleviation Fundingin constant 1997 prices
0
5,000
10,000
15,000
20,000
25,000
30,000
1986 1987 1988 1989 1990 1991 1992 1993 1994 1995 1996 1997 1998 1999
mill
ion
Yua
n
Subsidized loan program Food and cash for work program Budgetary funds for poor areas
Source: Information presented by Executive Director of the China Foundationfor Poverty Alleviation to the International NGO Conference held in Beijing inlate October 2001. Values have been converted to 1997 constant prices.

58 Poverty Profile of the People’s Republic of China
poor households accounted for only 1.5% of the totalsubsidized credit made available in the 1987 to 1991period. The other 98.5% was lent to TVEs and other ruralenterprises. Thirdly, the macroeconomic policiessupported faster economic growth in coastal regions butprovided no special mechanisms to help poor regions andpoor farmers to participate in the benefits of economicgrowth. These policies worsened the terms of trade forpoor regions. They now had to compete with the loweragricultural procurement prices that resulted frompreferential development policies instituted amongwealthier and more fertile agricultural regions. Thisfurther separated poor rural residents from the nationaleconomic growth process.32
Box 4: Institutional Issues of Trickle Down and RegionalDevelopment
According to a sociological analysis on the delivery system,institutional weakness has been one of the major factorsdetracting from effective targeting.33 Local governments areempowered by the LGOP to be responsible for distributing andsupervising poverty reduction program funding at the locallevel. Competing with this, however, is that almost all localgovernments in poor areas are faced with multiple agendasoften including: poverty reduction, economic growth andbudgetary solvency. 34 Budgetary solvency issues, together withregional economic development priorities, have often workedagainst a poverty reduction agenda as local governments havemore incentive to use poverty reduction funds for industrialenterprises to generate higher tax revenue instead of for thoseenterprises which contribute to poverty reduction but pay lowertax rates. Given the responsibility for utilization of povertyreduction funds, some local governments replaced the targetgroup of the poor with the non-poor.
Changing loan targets: Households to IndustrialEnterprises. At the close of the 1980s, the LGOPshifted subsidized credit priorities from lending to poorhouseholds to developing rural enterprises engaged inproduction or service activities that might indirectly assistpoor households escape poverty.35 This policy shift was inpart driven by low repayment rates on the loans that wereintended for poor rural households (see Table 23 for therepayment rate between 1986 and 1991). Policy makers atthe time could not foresee that their policy shift wouldresult in further deterioration of the repayment rate asdemonstrated in Table 23 for the period 1991 to 1997.The high proportion of loan defaults meant that policymakers increasingly considered rural poor households tobe lacking in technical and managerial skills and wereconsequently inefficient in achieving their own povertyreduction.
It was felt a better use of subsidized loans was to supportprogressive economic entities and skilled technicalpersonnel in poor counties that represented economies ofscale. They could more extensively enhance overallregional development and were presumed to be able tomake more productive use of loans and achieve higherrepayment rates. To qualify for subsidized loans, ruralenterprises had to ensure that at least half of theiremployees came from poor households.
However, this shift in policy of lending to economicentities did not directly benefit rural poor households.Part of the reason was that, notwithstanding the LGOP’sstipulation, TVEs and county-based enterprises tendednot to hire staff from among the absolute poor for
32 Jalan, J. and M. Ravallion. 1998. Are There Dynamic Gains from aPoor-Area Development Programme? Journal of Public Economics 67:65-85.
33 Shen, H. 1997. The Delivery System of Poverty Alleviation and Self-organisation. Sociological Research, No 5.
34 Wu, G. 1994. Goal Conflicts in Poor Areas: Growth, Budget Solvency,and Poverty Alleviation. Paper presented at the Discussion Forum onChina’s Poverty Policies, Beijing, 26 October.
35 “ jingji shiti”
Farmers Farmer Co-operatives
RuralEnterprises
County andTownship
Enterprises
Total
% ofProjects 3.7% 4.9% 16.0% 75.4% 100%
% ofLoanFunds
0.8% 0.7% 7.4% 91.1% 100%
Table 22: Extent of Subsidized Loans Channeled toFarmers - Huangping County, Guizhou 1987-1991
Source: 2001. Omnibus of Best Poverty Papers. Beijing. China Economics PublishingHouse: 323
Table 23: Poverty Alleviation Subsidized Credit LoanRepayment Rates.
Source: NBS 2000a
Year RepaymentRate (%)
Reference
1986-19911991
199219931996
1997
6553
554844
62
Zhou B., 1992State Science and Technology
Commission (STC), 1995STC, 1995STC, 1995
Agricultural DevelopmentBank of China (ADBC), 1998
ADBC, 1998

The Fight Against Rural Poverty 59
practical reasons related to pre-existing employmentpatterns and the rural poor’s lack of skills, education andwider-world understanding of factory environments, andtheir comparative physical weakness. Another part of thereason was that many of the TVEs and other ruralenterprises that benefited from the subsidized credit didnot become profitable and could not expand on asustainable basis. This is evidenced by worsening of loanrepayment rates after the policy shift to enterprise lending(see Table 23). In some areas as many as 60% of povertyreduction loans to rural enterprises were not repaid ontime. For the three years 1991 to 1993, the averagerepayment rate was only 52%. Non-performing loanscontinued to grow as a share of total lending.
Because of this disappointing experience, the 1996National Poverty Reduction Conference concluded thatthe policy should change again. It determined that 70% ofsubsidized loans should reach poor households.Furthermore, 70% of the loans to poor households wereto be earmarked for direct investment in agriculture. AsFigure 22 demonstrates, the policy of increased lending toagriculture was applied with rigor. Between 1994 and1999, support for agricultural investment increased from30.5% of total Government poverty reduction funding to46.3%. The share flowing to rural industrial enterprisesdropped from 35% to 17.2%. In terms of financialvolume, the swing to emphasizing investment inagriculture was even more pronounced because totalpoverty reduction funding was growing rapidly - seeFigure 22. Between 1997 and 1999 total funding increasedby 43% in real terms.
The other element of the 1996 policy shift - re-emphasizing direct lending to poor households - provedmore difficult to implement. According to estimates at theprovincial level, loans to poor households comprised lessthan 30% of agricultural lending, while most of theremaining 70% flowed to large-scale agriculturalproduction bases. 36 Micro-studies suggest that theestimate of 30% to poor households may be toooptimistic. Field investigations in Anhui province of 1998lending practices in two poor counties found that thepercentage of poverty loans actually reaching householdswas only 19% and 14% respectively (Yang, 1998).37
The difficulty in implementing a policy of focusinglending on poor households results from several factors.From the point of view of local governments, they haveto pursue multiple objectives that are not easily reconciled.
They seek to reach the poor directly, promote regionaleconomic development, and strengthen their ownfinancial solvency. In the trade off between objectives,local governments tend to select projects for povertyloans that are perceived as bringing overall higher financialbenefits regardless of whether such projects directlyreduce poverty in the short term.
Another factor stems from the context in which ABCofficials operate. ABC executives have been underincreasing pressure to improve the quality of their loanportfolios, and therefore have scrutinized morethoroughly the risk of default in loan applicationproposals. Because ABC officials have become primarilyresponsible for the dispersion of subsidized credit, theycan refuse poverty reduction loan applications submittedor endorsed by local PADO offices whenever they judgethe default risk as being too high. There is the potentialfor contradictory interests between PADO offices strivingfor rapid rural poverty reduction and the ABC applyingsound credit risk management principles. Even when theABC has approved a PADO-supported loan application,the ABC may stipulate conditions that significantly changethe nature of the poverty reduction project. For instance,the ABC may insist on a shorter loan duration, a change inscheduling in loan disbursement, or an alteration to thedesign of project elements.
36 Some researchers feel that 30% is optimistic and, instead, the realsituation of poverty loans to rural households may be less than that- see: Kang, 1998.
37 See also: Kang, X. 1998. The Commentary on China’s PovertyAlleviation. Paper presented for the UNDP Research Center forEco-Environmental Sciences, Chinese Academy of Sciences, Beijing.
Figure 22: Government Poverty Funding Composition
0
5
10
15
20
25
30
35
40
45
50
1994 1997 1998 1999P
rop
ort
ion
of
To
tal %
Agriculture Industry Transportation Health & Education
Source: Wu, Guobao. 2001. The Ten-Five Poverty Reduction Development StrategyStudy of Rural China. Beijing

60 Poverty Profile of the People’s Republic of China
Program Target Interest Subsidy
(Subsidy Source)
Channeling
Mechanism
Loans for rehabilitation of the disabled poor Poor disabled people Yes (MOF) ABC
Subsidized poverty loans (subsidized credit) Poor households Yes (MOF and
provinces) ABC
Regular poverty reduction loans
Poverty county,
minority, and border
areas
None ABC
Special loans for pastoral areas Poor area Yes (MOF) ABC
Loans for old revolutionary, minority, and border
areas Poor area Yes (PBOC) PBOC
Special loans for county enterprises Enterprises in poverty
counties
Yes (ICBC, CBC)
CBC-PBOC
Construction Bank
ICBC
CBC
PBOC
Loans for economic development of less
developed areas Poor area None ABC
Special loans for state-owned farms in border
areas Poor area Yes (MOF) ABC
General credits to poor areas Poor area Yes (ABC) ABC
Farmland construction loans Poor area Yes (MOF) and
provinces ABC
Loans for renovation of works destroyed by
floods
Poor areas following
natural disasters
Yes (MOF) and
provinces) ABC
Table 24: Main Poverty Reduction Loan Programs
Source: Zhu, Ling. Poverty Alleviation in the Transition of Rural China.
The ABC’s administration of poverty reduction lending wascomplicated by the number of loan facilities that had beencreated, each with their specific purpose and varying interestrates. These are summarized in Table 24.
GRADUAL ACCEPTANCE OF MICROCREDITINTO THE GOVERNMENT’S PROGRAM
PRC first began experimenting with microfinance in themid-1990s with pilot projects spearheaded by NGOs usingversions of the Grameen Bank (GB) model.3 8
Implementation was initially without policy or financialinvolvement from government. Examples of this earlyphase include the “Funding of Poor Cooperatives” (FPC)pilot projects implemented by the Chinese Academy ofSocial Sciences (CASS) which developed four GB replicationprojects in three provinces - for more detail see Box 5.39
By the end of 1996, total capital investment in microfinanceprojects in the PRC had reached almost 90 million yuan.
Individual loans under NGO-sponsored microfinance
projects were generally in the range of 400 to 1,000 yuanand were extended for periods from 3 to 12 months.Repayment could be either in lump sum on maturity or byinstallments every one to four weeks. Interest charges rangedfrom 12 to 20% per annum. Most projects used the liabilitygroup guarantee system, while some provided individualloans. Repayment rates proved to be high, generally above90%. If borrowers showed that they could honor the termsof the loan, they were often eligible for a subsequent andlarger loan. The retention rate of microfinance projectclients was high.The Government ceiling on interest rates meant that projectswere faced with the problem of recouping sufficient chargesfrom borrowers to cover the high cost of deliveringmicrofinance. Despite interest rate restrictions, and afterfive or so years of operation, some microfinance pilot projectshave become operationally self-sustainable.40 By the end of
40 Operational self-sustainability is defined by the Consultative Group toAssist the Poorest (CGAP) as having cash receipts from financial-serviceclients at least sufficient to cover the non-financial (that is, excludingcost of funds) cash costs of providing those services. A program is definedby CGAP as reaching full financial self-sustainability when it is profitableafter adjusting its financial statements for the following non-cash items:(i) loan loss provisions; (ii) depreciation; and (iii) adjustments forinflation and subsidies, treating all of its funding as if it had a commercialcost.
38 Small-sized liability groups that emphasize peer cooperation andsupervision with centre meetings, group-based lending, one-year loanperiods, weekly repayment, group fees and savings requirements,complementary training activities.
39 CASS was given technical and funding assistance by the Grameen Trustof Bangladesh, the Ford Foundation and private donors.

The Fight Against Rural Poverty 61
1997, the CASS FCP pilot projects in three counties wereexamples of financial sustainability.
In addition to interest rate constraints, microfinanceprojects implemented outside of formal financialinstitutions existed side by side with other informalfinancial organizations, all of which were illegal but weretolerated because of their positive contribution topoverty reduction.
Unlike the pilots implemented by NGOs, the formalfinancial system (ABC and PBOC supervised RCCs) wascharacterized by its legality, its vast outreach throughoutthe PRC, and its ability to offer a range of services to itsclients including accepting deposits legally. The adoptionof microcredit by these institutions as a means ofreducing poverty commenced in the wake of the StateCouncil’s decision of 1996 to refocus lending on poorhouseholds.41 Since then microfinance had gained steadypolicy support and provincial PADOs had governmentsanction to implement pilot projects through localbureaus using subsidized loan funding channeled throughthe ABC (ADBC prior to 1998). By the second half of1998, Government subsidized microfinance projects hadexpanded rapidly with loans being extended at interestrates of 2.88 to 7.2% (though as of September 1999 allpoverty reduction subsidized loans bore a standardizedrate of 3.0%). According to LGOP statistics42, by August1998, microfinance projects had issued 600 million yuanin loans in 605 counties and 22 provinces.4 3
By the end of 1998 PBOC and ABC cast doubt on thelegal basis by which PADOs managed poverty reductionsubsidized loans when they were not authorized creditintermediaries. Consequently, since 1999, povertyreduction subsidized loans have been directly issued torural families by the ABC. The ABC controlled credit
Box 5: Explanation of the “Funding of Poor Cooperatives”Projects
The microfinance projects of the Funding the PoorCooperatives (FPC) was an “action-research plan” of theRural Development Institute of CASS conceptualized in1993 and formally launched in May 1994. FPC introducedmicrofinance into the PRC using the internationally-recognized Grameen Bank (GB) model to test its utility ingovernment-funded poverty reduction programs. Threeproblem areas were researched: (i) difficulties that poorfamilies have in obtaining loans; (ii) difficulties theyexperience in loan repayment; and (iii) difficulties relatedto the sustainability of microfinance organizations.
From the beginning of 1994 to November 1995 (from thefirst loan issued in Yixian County by the first FPC to thestart-up in Nanzhao), the central task of the FPC projectswas to achieve effective and efficient operations given afixed funding supply and standard technology. At this stage,the focus was on how to make loans effectively to poorrural families and assure high loan repayment rate.
From the end of 1995 to 1996, FPC projects began toaddress organizational problems. Importance was placedon organizational development, formulation of regulationsand development of efficient management practices.Financial independence and sustainability were alsoemphasized.
Since 1997, FPC projects entered a third phase that involvedachieving sustainability, exploring approaches for theextension of projects and strengthening organizationalcapacity and effective management. By June 1999, FPCshad nearly 10,000 loan members. The total loan portfoliowas by then seven million yuan and the loan repaymentrate exceeded 95%. A uniform interest rate policy wasadopted with the nominal interest rate set at 8 to 10% (flatrate) per annum. Compulsory deposit and liability groupguarantee systems were used.
Microfinance projects of FPC were mainly operated by civilorganizations. An FPC takes an independent corporate formregistered with the Civil Affairs Office of the projectcounties. Leaders of the project counties serve as FPCBoard directors. An FPC employs special officials asmanagers and recruits full-time staff. An FPC has a two-level hierarchy, covering a county and participatingtownships within the county. The FPC sub-branches attownship level are responsible for: (i) establishing membergroups and centers and participating in the weekly meetingsof these centers; and (ii) supervising implementation,repayment and collection of loans and imposition penalties.FPCs collectively have a Beijing Head Office for generaldirection and supervision. County governments providesupport to individual FPCs, but do not intervene in theirinternal affairs.
41 CCPCC and State Council Decision of 23 October 1996. Reported inState Statistical Bureau.1997. Chinese Agricultural Yearbook. Beijing.China Statistics Publishing House. And later: People’s Daily. 1998. 28May.
42 Wang, S. 1999. Microfinance Sector in China. Beijing: Institute ofAgriculture Economy, Chinese Academy of Agriculture Science.
43 Provinces and autonomous regions with large-scale governmentalprojects included Fujian, Guangxi, Hebei, Henan, Liaoning, Sichuan,Shanxi, Shaanxi, and Yunnan. Most programs used funds previouslyallocated to the subsidized loan program. The largest programs were insouthern Shaanxi Province, which in its first year (1996) already reachedover 50,000 households.

62 Poverty Profile of the People’s Republic of China
disbursements and the PADOs simply introduced potentialborrowers to the ABC.
Despite the Government’s adoption of microcredittechniques (see Box 6), it again proved difficult to providesubsidized loans directly to poor rural, households on asustainable basis. Poor repayment rates (around 60% orless) and poor credit discipline contributed to making theprogram non-sustainable. Subsidized interest rates of 3%(compared to official interest rates of 8-10%) made theselines of credit attractive to wealthier households, enterprisesand local leaders eager to support revenue-generatingindustrial projects. Furthermore, the loans are consideredto have a welfare dimension that encourages delinquency.44
A small survey of one of the model program sites insouthern Shaanxi found that loans were going to the rich,small savings groups were non-existent, lending centerleaders were chosen by local government rather thanmembers, and timely weekly repayment rates were only 70%- compared to over 95% at the CASS sites.45
Another variation of officially approved and supportedmicrocredit schemes is where a microcredit facility is onecomponent of a project agreed to by government. Thesemicrocredit projects are often, though not always, fundedin part or whole by donors who simultaneously providetechnical and advisory assistance. Examples of suchmicrocredit projects include the AusAID-financed QinghaiHaidong project with funding of 12 million yuan (nowoperated by the ABC), and the RCC project of LuanpingCounty, Hebei Province.
For microcredit, financial organizations (the ABC andRCCs) have an advantage over the PADOs and NGOsbecause their established accounting and financialmanagement systems are designed specifically for lendingoperations. Also, ABC and the RCCs have the legal statusnecessary to undertake microfinance activities and, to acceptdeposits. Commentators generally agree that if thesefinancial institutions could charge interest rates sufficientto cover costs, they may well be able to provide microcreditto the poor on a long-term financial self-sustaining basis.
PHYSICAL INFRASTRUCTUREDEVELOPMENT AND RURAL POVERTYREDUCTION
The Government attaches high priority to the provisionof economic infrastructure. Consequently, substantialinvestment has been made in irrigation and drainageworks, roads, and more recently, small-scale hydropowerfacilities, potable water supplies for people and animals,
electricity and telecommunications. Improvements in ruralinfrastructure have impacted positively upon povertyreduction. Table 25 summarizes some of the identifiedimpacts of different types of infrastructure.Box 6: Poverty Alleviation Office MicrocreditExperiments
The Foreign Capital Project Management Office under the StateCouncil’s National Poverty Alleviation and Development Officehas been experimenting with various World Bank fundedmicrocredit schemes for poverty reduction.
The primary objective of these experiments was to establish alocalized model and regulatory framework suitable under PRCconditions for taking credit benefits directly to the pooresthouseholds. There are several characteristics being tested as partof developing a localized model:
(i) the models provide rural credit and emphasize technicaland management training services;
(ii) microcredit programs are professionally managed using acontractual-responsibility management approach andhiring staff by open application;
(iii) technical assistance to borrowers by way of a speciallydesigned training component and information in print orvideo format so as to improve farmers’ micro-managementcapacity over the income generating activities beingfinanced;
(iv) computerized information management networks are putin place to provide timely alerts as to potential lendingrisks or crises; and
(v) microcredit operations are to be subject to independentauditing..
There are two pilot project counties whose models have scaled-up to be the largest in the PRC. These models have been adoptedby the World Bank for duplication within Guizhou, Guangxi, andSichuan as an integral part of the Southwest Poverty ReductionProject.
Source: NBS. 2000a.
Poverty reduction and quality of life gains are especiallyimportant aspects of rural infrastructure provision. Laborintensive construction of infrastructure projects has anadded poverty reduction impact, provided the poorare paid for their labor.46 Rural roads allow farmers betteraccess to agricultural inputs like fertilizer and reduce costsassociated with bringing goods to market.47 Rural roadsalso improve access to education and healthopportunities. Health benefits in terms of reduced
44 Park, A., and Q. Chang. 2001. ibid.45 Park, A., and Q. Chang. 2001. ibid.
46 Pouliquen, L.Y. 1999. Rural Infrastructure from a World BankPerspective: A Knowledge Management Framework.. Washington, DC.:World Bank.
47 Wanmali, S., and Y. Islam. 1997. Rural Infrastructure and AgriculturalDevelopment in Southern Africa: a Center-Periphery Perspective. TheGeographical Journal 163: 259-269.

The Fight Against Rural Poverty 63
Table 25: Impact of Rural Infrastructure on Poverty
mortality and morbidity are outcomes associated with theprovision of safe drinking water and sanitation.48 This isan example of a social multiplier, because better health isnot simply a good in and of itself, but is also linked tohigher incomes. As many authors have shown, healthierindividuals have higher productivity and are more likely tobe in the labor force.49 Similarly, if infrastructureinvestments allow children better access to schooling,improve their attendance or allow them to study longer,this may lead to indirect, long-run benefits in terms of
higher productivity or income. Irrigation allows farmersto cultivate their land more intensively and sometimesincrease the number of planting seasons annually, whichmay allow them to move from subsistence to cash cropproduction.
A recent IFPRI research report has attempted to quantifythe rural poverty reduction impacts in the PRC ofdifferent types of public investments by building andapplying a socio-economic model based on a suitably-lagged time series of interrelated variables.50 It may bethat the quantitative relationships within their model stillneed further validation given the softness of povertyreduction statistics and the variability in poverty reductionimpact as programs confront more inextricable forms ofpoverty. Of the public investments they tracked andrelated to poverty reduction in 1997, they found educationto have the highest poverty reduction impact, followed byagricultural research and development, followed by roads.These impacts were most pronounced in the Westernregion - see Table 26.
Often the impact of infrastructure provision can best beseen by labor time savings and labor reallocation amongmen, women and children within a village. Roads,convenient access to safe drinking water and the provisionof electricity are often credited with major labor savingsthat are reinvested into other economic activities or allowfor quality of life gains.
There is unquestionably considerable variation in therelationship between specific rural infrastructuredevelopment programs and poverty reduction. TheGovernment has many broad development strategies topursue. It is not necessarily the dominant developmentneeds of the poor that determine rural infrastructurecreation priorities. Some infrastructure programs may
48 World Bank. 1994. World Development Report: Infrastructure forDevelopment. Washington, DC.
49 Bloom, D. E., and P. N. Malaney. 1998. Macroeconomic Consequencesof the Russian Mortality Crisis. World Development 26; Grossman,M., and L. Benham. 1980. Health Hours and Wages. In Jacobs, P. TheEconomics of Health and Medical Care: An Introduction. Baltimore.University Park Press. 50 Fan, S., Linxiu Zhang, and Xiaobo Zhang. 2002. Op.cit: IFPRI.
Table 26: Returns of Public Investment to PovertyReduction, 1997
Infrastructure Benefits and EffectsIrrigation Increases drought-resistance and crop
yieldsIncreases multiple cropping potentialSupports development of high yieldingcash cropsImproves farm income and food supplyImproves soil and water conservation
Small ruralhydropower
Uses renewable resourcesProvides energy for agro-processing andother industries allowing more ruralvalue addedReduces incineration of straw and fuelwood contributing to reduction inpollution and forest conservationCreates new income opportunitiesHas significant other quality of lifeimpacts
Clean water supply Reduces disease and morbidityReduces medical expenditureReduces the time spent getting waterwhich is a task performed mainly bywomen and childrenReduces disputes over water supplies,raising social stabilityImproves social and living environment
Rural roads Facilitates access to inputs and marketsfor agricultural produceReduces transportation costsFacilitates labor migrationOpens opportunities for new businessesand greater rural value added
Coastal Central Western Averageno. of poor reduced per 10,000 yuan
expenditureEducationAgric R&DRoadsElectricityTelephoneIrrigationPoverty loans
2.731.990.830.760.600.550.88
5.384.403.611.651.900.770.75
28.6633.1210.736.178.514.061.49
8.806.793.222.272.211.331.13
Source: Fan, S., Linxiu Zhang, and Xiaobo Zhang. 2002. Op.cit: IFPRI
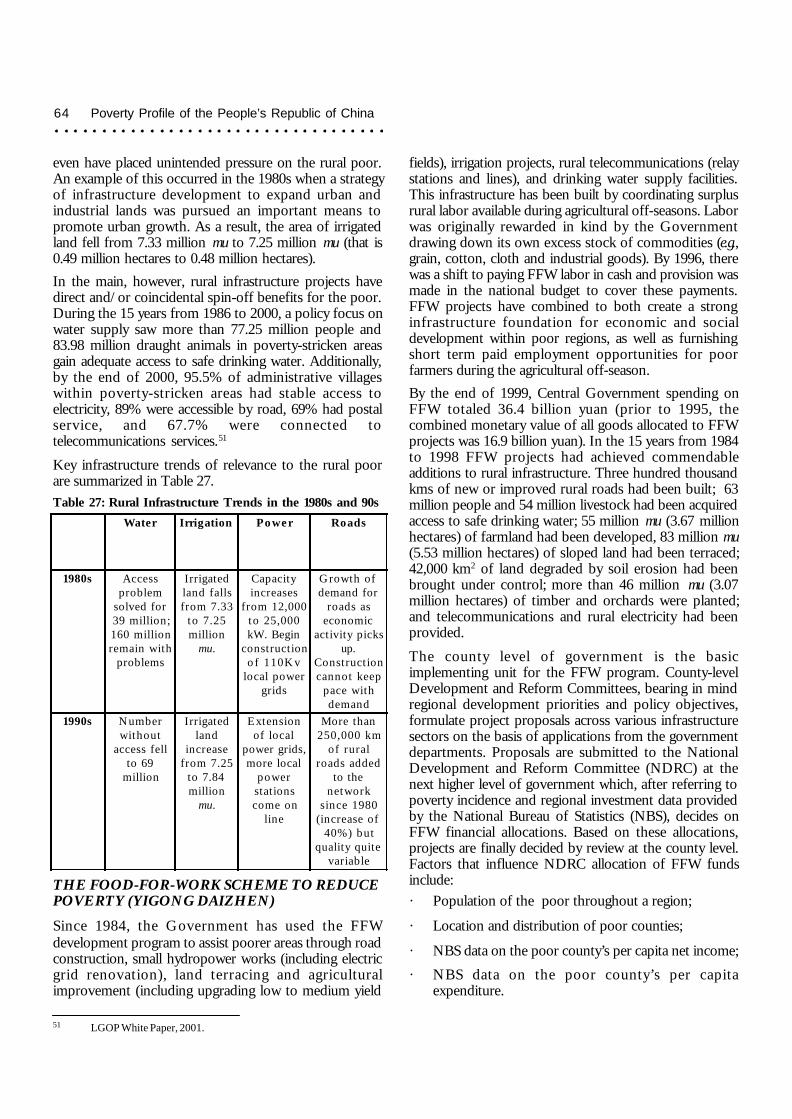
64 Poverty Profile of the People’s Republic of China
even have placed unintended pressure on the rural poor.An example of this occurred in the 1980s when a strategyof infrastructure development to expand urban andindustrial lands was pursued an important means topromote urban growth. As a result, the area of irrigatedland fell from 7.33 million mu to 7.25 million mu (that is0.49 million hectares to 0.48 million hectares).In the main, however, rural infrastructure projects havedirect and/or coincidental spin-off benefits for the poor.During the 15 years from 1986 to 2000, a policy focus onwater supply saw more than 77.25 million people and83.98 million draught animals in poverty-stricken areasgain adequate access to safe drinking water. Additionally,by the end of 2000, 95.5% of administrative villageswithin poverty-stricken areas had stable access toelectricity, 89% were accessible by road, 69% had postalservice, and 67.7% were connected totelecommunications services.51
Key infrastructure trends of relevance to the rural poorare summarized in Table 27.Table 27: Rural Infrastructure Trends in the 1980s and 90s
THE FOOD-FOR-WORK SCHEME TO REDUCEPOVERTY (YIGONG DAIZHEN)
Since 1984, the Government has used the FFWdevelopment program to assist poorer areas through roadconstruction, small hydropower works (including electricgrid renovation), land terracing and agriculturalimprovement (including upgrading low to medium yield
fields), irrigation projects, rural telecommunications (relaystations and lines), and drinking water supply facilities.This infrastructure has been built by coordinating surplusrural labor available during agricultural off-seasons. Laborwas originally rewarded in kind by the Governmentdrawing down its own excess stock of commodities (e.g.,grain, cotton, cloth and industrial goods). By 1996, therewas a shift to paying FFW labor in cash and provision wasmade in the national budget to cover these payments.FFW projects have combined to both create a stronginfrastructure foundation for economic and socialdevelopment within poor regions, as well as furnishingshort term paid employment opportunities for poorfarmers during the agricultural off-season.By the end of 1999, Central Government spending onFFW totaled 36.4 billion yuan (prior to 1995, thecombined monetary value of all goods allocated to FFWprojects was 16.9 billion yuan). In the 15 years from 1984to 1998 FFW projects had achieved commendableadditions to rural infrastructure. Three hundred thousandkms of new or improved rural roads had been built; 63million people and 54 million livestock had been acquiredaccess to safe drinking water; 55 million mu (3.67 millionhectares) of farmland had been developed, 83 million mu(5.53 million hectares) of sloped land had been terraced;42,000 km2 of land degraded by soil erosion had beenbrought under control; more than 46 million mu (3.07million hectares) of timber and orchards were planted;and telecommunications and rural electricity had beenprovided.
The county level of government is the basicimplementing unit for the FFW program. County-levelDevelopment and Reform Committees, bearing in mindregional development priorities and policy objectives,formulate project proposals across various infrastructuresectors on the basis of applications from the governmentdepartments. Proposals are submitted to the NationalDevelopment and Reform Committee (NDRC) at thenext higher level of government which, after referring topoverty incidence and regional investment data providedby the National Bureau of Statistics (NBS), decides onFFW financial allocations. Based on these allocations,projects are finally decided by review at the county level.Factors that influence NDRC allocation of FFW fundsinclude:· Population of the poor throughout a region;
· Location and distribution of poor counties;
· NBS data on the poor county’s per capita net income;
· NBS data on the poor county’s per capitaexpenditure.
51 LGOP White Paper, 2001.
Water Irrigation Power Roads
1980s Accessproblem
solved for39 mill ion;160 mill ionremain with
problems
Irrigatedland fal lsfrom 7.33
to 7 .25million
mu .
Capacityincreases
from 12,000to 25,000kW. Begin
constructionof 110Kv
local powergrids
Growth ofdemand for
roads aseconomic
activity picksup.
Constructioncannot keep
pace withdemand
1990s Numberwithout
access fellto 69
million
Irrigatedland
increasefrom 7.25
to 7.84million
mu .
Extensionof local
power grids,more local
powerstationscome on
line
More than250 ,000 km
of ruralroads added
to thenetwork
since 1980(increase of
40%) butquality quite
variable
The Fight Against Rural Poverty 65
Often the engineering and implementation of FFWprojects is subcontracted to line agencies or institutes. Inlarger projects, specialized bureaus from the provinciallevel will take responsibility from project implementation,while other departments may supervise constructionquality. The relevant local department takes responsibilityfor maintenance upon project completion. GenerallyFFW project funds cease upon the completion ofconstruction and no further funding is available formanagement and maintenance costs. The recruitment ofmanual labor and management of the specific FFW fundsare undertaken by local governments (county, townshipand administrative village).
The SDPC carries out work inspections each year on theFFW projects throughout their respective regions. Suchinspections include financial accountability, auditing,monitoring and evaluation of project completion. Onoccasion, such inspections are carried out cross-provincially to ensure their reliability.
According to FFW policy, FFW finance provided by thenational government should be matched by counterpartfunding from both provincial and county levels.Experience demonstrates, however, that due to the alreadyimpoverished nature of local financial budgets, localgovernment counterpart funding is rarely provided.Instead what commonly happens is that central fundscover the capital equipment and materials costs ofconstruction, while voluntary labor contributions byvillagers are called on to offset the shortage in counterpartfunding. This was possible because at least until the endof the 8-7 program, villages in most rural regionsoperated on a ‘work day contribution system,’ wherebyeach able-bodied adult villager was obliged to provide acertain amount of manual labor days annually to VillageCommittee determined projects.52 Zhu and Jiang (1996)have estimated that as much as 40% of labor used withinFFW infrastructure construction projects has beenuncompensated.
This free labor contribution has been criticized by someobservers as an inequitable ‘labor tax’ under which thepoor disproportionately contribute manual labor to FFWprojects when compared to households with higher cashearnings. The latter can choose not to participate andinstead contribute a set sum of money in lieu of theirwork day obligation. Admittedly, this tax may not be highsince FFW projects are generally implemented in the off-season when there is limited agricultural work to be done.It is possible, however, that the program would bringhigher benefits to the poor if all work was paid, even if
this reduced the total amount of infrastructure built.53
Targeting issues: Because FFW projects like those fundedunder subsidized loans are investment oriented, local leadersinvariably balance poverty reduction impact against theeconomic return of projects. The return to building a roadto a very remote village, for example, will be low given thesparse populations served and the high cost of constructingroads in mountainous terrain. Instead, less remote villageswith greater populations, and having more favorable naturalconditions and surplus labor, are more likely to be selectedfor FFW infrastructure projects.54 Due to a widespread lackof beneficiary participation, apart from manual laborcontributions, the top-down manner of project selectionand administration means that projects are often adoptedon the basis of political and economic developmentjudgments rather than villagers expressed needs.55
Expansion of FFW project portfolios in the last decadehas also led to claims that their poverty reduction impact isbeing increasingly undermined by fund diversion toinvestments with no direct relation to poverty.56 Anothertargeting issue related to funds diversion is the possibilitythat local governments have substituted FFW funding ofprojects that were otherwise marked for financing in thetheir capital construction plans. Where this has happened,FFW funds merely displace other funds and do not greatlyincrease the amount of infrastructure provided.57
Fund diversion has been officially noted and criticized bythe National Investigation Commission (Guojia Shenjiwei).When conducting an investigation in one part of thecountry, it found that 32% of designated FFW fundinghad been siphoned away from key counties marked fornational poverty reduction and development intosponsoring various activities in 5 provincial poverty countiesand 29 non-poor counties (Zhu and Jiang, 1995).
DEVELOPMENT FUNDS (FAZHAN ZIJIN):
Compared with the subsidized loan and FFW programs,the PRC has a much longer history of providing53 Zhu, L., and Z. Jiang. 1995. Yigong-Daizhen. In China: A New
Experience with Labour-Intensive Public Works in Poor Areas. InJoachim von Braun, ed., Employment for Poverty Reduction and FoodSecurity. Washington, DC.: International Food Policy Research Institute:75-107; also mentioned in Park, A. 1999. ibid .
54 Zhu, L., and Z. Jiang. 1995. ibid.55 Southern Weekender. Zhu and Jiang also document a case where villagers
voiced a clear preference for needing more roads, but were instead toldto build terraces by county officials.
56 Zhu and Jiang in their research mention investments in rural post officesand some afforestation projects.
57 Kang, X. 1998. The Commentary on China’s Poverty Alleviation. Paperprepared for the UNDP Research Center for Eco- EnvironmentalSciences, Chinese Academy of Sciences.
52 World Bank. 2000. Overcoming Rural Poverty in China. Washington,DC.
66 Poverty Profile of the People’s Republic of China
budgetary subsidies to poor regions. From 1949 theGovernment adopted a centralized financial managementsystem in which all local revenues of provinces andcounties were turned over to the Central Government andall expenditures required by regions were appropriated bythe Central Government. In this system, those regionswhose expenditures were more than their revenuesautomatically received budgetary subsidies.
Even with the fiscal decentralization reforms in the early1980s, the central Government, through the Ministry ofFinance (MOF), continued to provide budgetary subsidiesand grant funding for investments in poor regions andcounties. These “development funds” comprise fourcategories, only two of which are included in the povertyinvestments listed by the national PADO. They are:
(i) Funds to cover half of the operations of localgovernments in poor counties;
(ii) Targeted funds, such as (a) the Development Fundfor Assisting Undeveloped Areas (also called PoorArea Development Fund), begun in 1980, whichallocates 800 million yuan each year to poor areas,including old revolutionary base areas andautonomous counties of minority nationalities; and(b) the sanxi (the “three wests”; three xi) programbegun in 1983, which allocates 200 million yuaneach year to 47 counties in three north-westprefectures.58 The amount of funding for thesepurposes did not increase appreciably through thelate 1980s and early 1990s, shrinking in real terms.In more recent years, the amount of developmentfunding has doubled.
(iii) A budgetary subsidy in border areas to be investedin building industry and road improvement,communications, and education.
(iv) A revolving fund to support enterprises in lessdeveloped areas.59 This fund includes the followingparts: a budgetary fund for assisting the poor(begun in 1988); a fund for meeting the basic needsof residents of minority nationalities regions(begun in 1990); and an additional fund forassisting the poor, (established in 1992). Therevolving funds are lent to enterprises and othereconomic entities, which are required to repay theprincipal as well as a 2 to 4% managementfee after one to three years. These funds in manyways resemble subsidized loans, but are
administered through the fiscal rather than thefinancial system. In total, there have been morethan 200 million yuan in revolving funds each yearsince 1992. Some provinces have also contributedfinancing to these revolving funds.
Of the three main Government poverty reductionprograms, less is known about the distribution and use ofbudgetary development funds. This is because of theclassified nature of budgetary data. Nonetheless, anumber of targeting concerns warrant mention. First,because the development fund program began before thedesignation of national poverty counties in 1986, portionof these funds continued to be given to counties notofficially designated as poor. While this increasedcoverage if also increased leakage.
Second, just as for FFW funds, it has been possible forpoor counties to substitute development funds for otherbudgetary resources that would have been allocated forsimilar purposes, reducing the impact of such funds onrealized investment. Assuming perfect fungibility,development funds, at worst, act as a pure budget subsidythus helping local governments in poor counties meettheir own fiscal agendas, even if these lack thedevelopment focus that national leaders preferred.However, if the level of development fund financing alsoaffected the subsistence transfers negotiated betweenlevels of government, the crowding out problem could bemore severe. In poor areas where budgetary crises haveforced governments to delay or suspend wage payments,there is also the danger that funds would be diverted tonon-productive uses.
Regulations stipulating that development funds must beused to benefit poor households by developing projectsprobably prevent full crowding out. However, localgovernments have a stronger influence on the use ofthese funds than on subsidized loans or FFW funds. Thusthe danger of biases toward revenue-producing enterpriseinvestments may be greater, although some projects dobenefit to poor.
The Government is concerned about these targetingproblems. According to a review by the NationalInvestigation Commission (Guojia Shenjiwei) in one part ofthe PRC, approximately 14% of the Development Fundassistance was used in non-poor counties and anadditional 14% was unaccounted for with the suspicionof improper or corrupt practices (Zhu and Jiang, 1995).
58 Dingxi and Hexi in Gansu, Xihaigu in Ningxia. Each place has “ xi” or“west” in its name, hence the “three wests” program. About 1 billionyuan in targeted funds are provided annually.
59 About 200 million yuan per year.

The Fight Against Rural Poverty 67
RISING COST OF GOVERNMENT PROGRAMPER UNIT OF POVERTY REDUCTION
As the PRC progressively reduced its poverty levels from1978 onwards, it moved from being able to help a largenumber of poor impoverished because of a limited rangeof straight-forward factors to trying to assist a remnantbody of rural poor whose condition of poverty is causedby a complex and only marginally responsive set offactors. The law of diminishing returns proves to be truefor poverty reduction when viewed in the medium to longterm. Figure 23 aligns the long term trend in rural povertyreduction against the expenditure, in constant prices, onthe official government poverty reduction programs(zhengfu fupin) from 1986 to 2000. Since 1996, there hasbeen a steep increase in real spending on the officialprograms. However poverty reduction continued on itsgentle decline. This suggests a sharply rising unit cost inpoverty reduction.
Figure 24 shows the trend of the unit cost in constant1997 dollars to the official Government poverty reductionprogram of assisting rural poor escape poverty. To reduceyear-on-year variations to medium term trends, Figure 24sets out unit cost of poverty reduction on a rolling threeyear basis from the period 1986-88 to 1998-2000. Since1988, the cost to the PRC Government of releasing onerural person from poverty has been rising. Afterfluctuating around 1,500 yuan per person (in 1997constant prices) between 1986 and 1992, there was asignificant rise in unit costs before the commencement onthe 8-7 program. During the 8-7 period (1994-2000), therewas a parabolic trend line rising sharply towards the endof the program. Over the last three year (1998-2000)period, the official poverty reduction programs werespending 4,086 yuan (in 1997 constant prices) per rural
person freed from poverty, more than double the level ofeffort at the beginning of the decade.
The national poverty line in 1997 constant prices was 640yuan per capita per annum. Thus unit cost to theGovernment of freeing one rural person from povertyrepresented 6.4 years income at the poverty line level. Sucha high figure not only underlines the diminishing returnsto poverty reduction programs, but raises the question ofimproving the efficiency with which poverty reduction fundsare used.
THE GOVERNMENT’S 2001-2005TARGETS AND STRATEGIES FORPOVERTY REDUCTIONThe new strategies and targets adopted to reduce anderadicate what remains of hard core rural poverty are setout in several key documents and policy announcements.One key document is the Outline for Poverty Alleviation andDevelopment of China’s Rural Areas (2001-2010) releasedshortly after a high-level Government meeting on povertyheld in May 2001. The basic approaches are also spelt outin the final chapter of the Government’s Poverty WhitePaper (The Development-oriented Poverty Reduction Program forRural China. October 2001). There are also severalcomponents of the Tenth Five Year Plan (2001-2005) thatare directly relevant to poverty reduction.
These strategies and targets have been given additionalimpetuous by the adoption of the concept of xiaokang atthe 16th Party Congress in November 2002 as the overallmission of the PRC’s new leadership. Xiaokang is a home-grown concept rooted in China’s ancient past, and refersto building a society in which all have a moderately
Figure 23: Trends in Government Poverty Funding and Poverty Reduction
0
50
100
150
200
250
300
1978
1980*
1982* 198
4198
6198
8199
0199
2199
4199
6* 1998
2000
Po
or
(mill
ion
)
0
5,000
10,000
15,000
20,000
25,000
30,000
Mill
Yua
n (1
997
cons
tant
pri
ces)
No. of Poor (mill) Funding Government Programs
Figure 24: Government Cost per Rural Person Freed from Poverty(rolling three year average)
0
500
1,000
1,500
2,000
2,500
3,000
3,500
4,000
1986-88
1987-89
1988-90
1989-91*
1990-92
1991-93*
1992-94
1993-95
1994-96*
1995-97
1996-98
1997-99
1998-2000
Yu
an (1
997
con
stan
t pri
ces)
Sources for Figures 23 and 24: Derived from figures presented by the Executive Director of the China Foundation for Poverty Alleviation to an InternationalConference on NGO’s held in Beijing in October 2001

68 Poverty Profile of the People’s Republic of China
affluent life, both materially and socially. As the currenttop priority theme, it heightens the resolve ofGovernment to narrow the growing gap between city andcountryside and achieve greater equality of livelihoodsbetween the richer Eastern region and the poorer Centraland Western regions.
The Government’s poverty reduction strategy from 2001to 2010 has several strands. The small number of needypeople without enough to eat or wear are to helped toattain an acceptable minimum standard of living as soonas possible. Basic production and living conditions of thepoor areas are to be further improved, and theconstruction of infrastructure therein will be accelerated.Focusing specifically on poverty-stricken people, theireco-environment will be improved, and their social,economic and cultural deprivation will be changed toprovide them with a comfortable life.
These new strategies will emphasize listening to what
poor people themselves have to say about their problemsand plans for development. Township and countygovernments will make a major adjustment in thetraditional public administration planning process. Theywill be expected to integrate their planning with the newgrass-roots poor village development planning, ratherthan determining the local development plans fromabove. The national government will designate keycounties for national poverty reduction developmentwork. These key counties and poor villages in non-keycounties will be eligible for national poverty funding.Priority will be given to remote and mountainous areas,minority areas, old revolutionary base areas and severepoverty areas.
Table 28 and Table 29 focus on the mid-term period,2001-2005, and summarize targets related to povertyreduction and the strategies to be adopted to achievethese targets.
Table 28: Government Poverty-Related Targets in Tenth Five Year Plan (2001-2005)
Description Target 2000 2005
Number of poor assisted with priority to minority areas
in inland provinces, and border areas (millions of poor)
30 million poor assisted 30 million 0
Rural per capita income 5% increase per year 2,253 yuan 2,880 yuan
Urban per capita income 5% increase per year 6,280 yuan 8,020 yuan
New jobs for workers from the agricultural sector increase to 40 million 35 million 40 million
New jobs for urban workers increase to 40 million 35.6 million 40 million
Urban unemployment reduce to 5% 3.1% 5%
Gross junior high school enrollment increase to 90% 85% Greater than 90%
Gross high school enrollment increase to 60% 44% 60%
Urban per capita housing to 22 square meters up from
20 square meters in 2000
increase by 10% 20 m2 22 m2
Discharge of total pollutants reduce to 10 % below 2000
levels
20.4 billion tons Reduce to 10%
below 2000 levels
Land treated for soil erosion 25 million ha treated NA 25 million ha
treated
Grasslands treated to prevent desertification 16.5 million ha treated NA 16.5 million ha
treated

The Fight Against Rural Poverty 69
Table 29: Government Strategies to Achieve Poverty-Related Targets (2001-2005)
Strategy Focus Strategy
Rural • Develop industries for processing, storing, and transporting agricultural products
• Foster development-oriented poverty reduction, especially in the western, remote, and minority areas.
• Increase Government grants and credits for poverty reduction.
Urban • Develop small towns and cities to increase off-farm income opportunities for the rural poor.
• Strengthen urban infrastructure and reduce urban pollution.
Rural and Urban • Deepen relations between wealthier and poorer areas under East-West cooperation.
• Increase microcredit programs for the poor.
Infrastructure • Construct infrastructure, particularly in the poor western region.
Social Development • Increase standards of living for the urban and rural poor in terms of housing, education, health,
environment, and land degradation.
• Establish a sound social security system (including support to those with medical, unemployment,
pension, old-age, and disability needs) to combat urban poverty.
Employment and
Training
• Develop labor-intensive industries, especially in the service sector, to create job opportunities.
• Offer incentives for people to start their own businesses.
• Expand job training and skills retraining to help people adapt better to a market-oriented employment
system.
Non-Government
Role
• Expand the role of NGOs in delivering programs and services to the poor.
• Enhance cooperation with international organizations for poverty reduction planning and program
implementation.
CIVIL SOCIETY-BASED POVERTYREDUCTIONDuring the 8-7 Poverty Reduction Program period, theGovernment’s mainstream programs accounted for 61.7%of the total resources directed at reducing poverty withinthe PRC. Table 30 sets out the volume in constant pricesand share of other contributors to the poverty reductioneffort. Figure 25 presents the same information in graphicalformat. Provincial and counterpart funding supplied 10.6%of total poverty reduction resources. Foreign grant and loanfunds from multilateral, bilateral and international non-government organizations (INGOs) provided 10.4% of thetotal. Donations through domestic NGO’s accounted for8.6% of the total. The remaining 8.7% came from othersources.The category in Table 30 labeled “funds from othersources” encompasses responses to the Government’s callfor government units at all levels, and their personnel, and
enterprises to act in a socially responsible manner by help-ing in the poverty reduction effort. This category is notdisaggregated between government units and staff on theone hand, and enterprises on the other.
Figure 25: Composi t ion of Rural Poverty Reduct ion Expendi ture
0
5,000
10,000
15,000
20,000
25,000
30,000
35,000
40,000
45,000
1 9 9 4 1 9 9 5 1996 1997 1998 1 9 9 9 2 0 0 0
Mill
Yu
an (1
997
con
stan
t pri
ces)
Domes t i c Soc ia l Sources Fore ign Of f ic ia l and NGO donors
D o m e s t i c N G O s Prov inc ia l and loca l counterpar t funds
Nat iona l government inputs
Source: See Figures 23 and 24, p. 67.

70 Poverty Profile of the People’s Republic of China
Table 30: Total Poverty Inputs 8-7 Program - Constant 1997 Prices. (Unit billion yuan)
Source: See Figure 21, p. 57.
INFORMAL NETWORKSInformal networks are part of society’s own copingstrategies in a situation where safety nets provided by thestate are insufficient. The importance of these networkshas continued to be strong in the PRC. As Feuchtwang(1995) argues “poverty is often temporary for a householdwith a good network so long as the whole region is notdestitute”. In many cases direct borrowing from thesenetworks is the main source of support in a case of non-expected livelihoods shocks. Keeping these networksvibrant is a form of self-insurance. Informal networks aremost useful in less developed areas where options are few,but they also add to the vulnerabilities by failing when thewhole network is simultaneously affected by external shocks(for example flood, epidemic and economic shocks).
Some level of organization has been evident in the areabetween informal networks and the non-functioning stateprovided support. Informal organizations have been setup for saving and lending and have helped reduce theimpact of external shocks that affect the more informalforms of social support. Cook (2003) suggests that“informal safety nets, coping strategies or insurance
mechanisms cannot be viewed in isolation from the broaderinstitutional and public policy environment”. Cook givesexamples including the impact of the one child policy onthe capacity of families to care for elderly family membersor the marketization of health services. However effectiveinformal safety nets may be within PRC community culture,they can fail when most needed and in many cases do notinclude the most poor and vulnerable who lack access tothe networks.
PRIVATE SECTOR SUPPORT FORPOVERTY REDUCTIONThe most important contribution of the private sector inthe war on poverty comes through job creation. Over theperiod 1995-2000, 59.5% of the jobs created in PRC’seconomy have been created by the non-State sector.Markets need to be made to work for the poor. To do sorequires improving overall governance to create atransparent, predictable system that enables the privatesector to flourish. In addition to its role as the engine forjob creation, the non-State sector also contributesdirectly to poverty relief efforts.Enterprise support for poverty reduction has come from
Type of Support 1994 1995 1996 1997 1998 1999 2000 Total%
share
1 National government inputs 12.72 10.89 11.07 15.30 18.48 26.46 27.18 122.11 61.7
xxa. xxSubsidized loans 5.91 5.03 5.73 8.50 10.10 15.38 15.38
xxb. xxDevelopment funds 1.61 1.44 1.33 2.82 3.33 4.41 4.82
xxc. xxFood for work 5.20 4.42 4.10 4.00 5.05 6.67 7.08
2 Provincial and local counterpartfunds
1.44 1.88 0.76 4.46 4.06 3.85 4.61 21.06 10.6
3 Foreign loan funds 1.66 1.91 2.33 1.26 1.27 1.39 1.48 11.30 5.7
4 Foreign funds (multilateral,bilateral, INGOs)
1.36 1.56 1.91 1.03 1.04 1.15 1.20 9.24 4.7
5 Donations (NGOs) 0.32 0.33 0.36 3.34 5.45 3.44 3.78 17.03 8.6
6 Funds from other sources 0.38 2.46 2.05 3.49 2.73 3.63 2.47 17.21 8.7
xxa. xxCentral ministries and enterprises 0.38 1.05 0.94 0.56 0.60 1.18 1.03
xxb. xxProvincial and local governmentsxxand enterprises
1.40 1.11 2.23 1.79 1.85 1.85
xxc. xxEast-west cooperation 0.70 0.34 0.61 0.63
Annual Total 17.86 19.02 18.45 28.87 33.03 39.89 40.72 197.84 100

The Fight Against Rural Poverty 71
SOEs and the non-state sector that encompassesdomestic private firms (siying qiye), small individualbusinesses (getihu), collectives, domestic share-holdingventures and foreign-invested ventures. The domesticprivate sector is an expanding segment of the non-statesector. It can be defined as domestic private firms, smallindividual businesses and those collectives that are ownedprivately but are registered as collectives for legallegitimacy reasons. This domestic private sector hasdemonstrated dynamic growth and an IFC study hasestimated that by 1998, it accounted for 33% of GDPcompared to the state sector’s 37%.60 The private sectorhas become an increasingly important force in the PRC’spoverty reduction effort. From a broader economicperspective, it contributes in other ways as well as creatingsustainable employment opportunities for the poor. Anexpanding private sector makes use of local resources inpoor areas and expands local markets, thereby creatingdemand for the local products of poor farmers. “Fiscalspace” can be created when the private sector is allowed todevelop infrastructure. This makes room in theGovernment’s budget to allocate more to socialexpenditure. The private sector with its focus on customernumbers and customer service is able to design creativeconcessional and non-concessional pricing packages toensure wide access to basic services. The privatization ofpublic utilities and their effective regulation byGovernment can lead to pro-poor outcomes. The poorare likely to have better access to these utilities at lowerprices. Furthermore, as the private sector grows, so doesthe reservoir of responsible corporate citizens who see itas appropriate and ethical to play philanthropic as well ascommercial roles.
There are many practical examples of the private sectorproviding direct philanthropic assistance to the poor. TheGlorious Scheme or Brilliant Cause (guangcai shiye) is oneof these. This organization was founded in 1994 byprivate entrepreneurs and dedicated to helping poorfarmers escape poverty. Participating entrepreneurs treatthe provision of assistance to the poor as a virtuous causein line with traditional Chinese ethics that can be summedup in the maxim, “After one gets rich one should assist thepoor”. The Glorious Scheme combines making profitswith aiding the poor. Private entrepreneurs invest forprofit in poor areas and create employment anddevelopment opportunities for the poor. The concurrentprofit motive has meant that the scheme’s involvement inpoverty reduction has been selective.
By 1998 there were 2,669 private entrepreneurs
participating in the Glorious Scheme with totalinvestments of 7,535 million yuan in 3,598 povertyreduction-related projects. These investments provided380,000 jobs in poor areas and helped 1.53 million poorpeople escape poverty. The Glorious Scheme alsoprovided training for 329,700 farmers.
In the wider context of establishing a legal system thatreinforces a market economy, the ADB provided technicalassistance to help the PRC draft a law enabling trusts tobe created. This assistance has borne fruit and the newTrust Law took effect on 1 June 2001. Trusts emergedfrom the requirements of commerce and propertymanagement in common law countries. A trust providesan arrangement by which a person (individual or legal) canlet another person manage her/his/its property for thebenefit of designated persons. As well as meeting a rangeof common needs in commerce, trusts provide a legalbasis for entrepreneurs and others to set up charitablefoundations. Indeed Chapter V of the PRC’s new TrustLaw defines the purpose of trusts for charity and publicinterests as including poverty relief, emergency relief,assistance to the disabled, development of education,science and technology, culture and sports, developmentof medical and health welfare, and protection of theenvironment. As in common law market economies, it canbe expected that the Trust Law will provide the privatesector with a vehicle for mobilizing resources anddirecting them at social development, including povertyreduction.
NGO-SUPPORTED ACTIVITIES
Domestic NGOs operating in the PRC derive theirlegality through registration with the Ministry of CivilAffairs (MCA). Qinghua University estimates that around126,000 NGOs are active in poverty reduction. Added tothis there are around 120 major international NGOs(INGOs) in the PRC also promoting social development.International NGOs currently operate in a legal vacuumas there is no procedure for registering them. Appropriateregulations are being developed, however.
Most domestic NGOs have some degree of linkage withthe Government. Notwithstanding this linkage, theyoperate in a distinct structural environment and in theirpoverty reduction work have certain advantages, and alsodisadvantages, when compared to the Government. Anindicative set of these advantages and disadvantages isshown in Table 31. Key advantages are the greateraccuracy NGOs have in targeting their assistance to thepoor, and their greater freedom to respond in diverse andinnovative ways to fast-changing needs.
60 International Finance Corporation. 2000. China’s Emerging PrivateEnterprises. Washington, DC.

72 Poverty Profile of the People’s Republic of China
Table 31: Comparative Advantages and Disadvantages of NGOs and the Government in Poverty Reduction Indicators Government NGO
Means of (i) Resource mobilization and (ii) Supervision
(i) Compulsory taxation (ii) Self-regulation
(i) Voluntary donations (ii) Market competition
Comparative advantages Scale Large-scale mobilization of resources through compulsory taxation
Mobilize resources that the government does not access
Efficiency High targeting accuracy.
When supervising use of government resources, facilitates an upgrade in efficiency through competition.
Sensitivity Responsive to diversified and fast-changing needs.
Innovative capacity Large-scale influence. Strong drive for innovation.
Comparative disadvantages
Scale Low transfer rate to poverty reduction effort
Insufficient resources.
Efficiency Low targeting accuracy Narrow focus. Top-down direction (GONGOs). Amateur institutions in early stages of professional development.
Sensitivity Neglects needs of small groups. Unresponsive to new needs.
Innovative capacity Inadequate drive for innovation. Limited capacity for replication
Source: Kang, Xiaoguang. 2001. Research on Chinese NGO Poverty Reduction Behavior.
The Government’s policy environment towards NGOs, thesocial environment in which NGOs operate, theircorporate governance structures, and their behavior inapproaching poverty reduction, have all impacted howNGOs working on poverty reduction have evolved in thePRC. The result is not a homogeneous type of NGO.Recent multi-variable analysis conducted by Kang Xiaogangsuggests that PRC NGOs fall into three types (see ). Whilenot stated explicitly in , there is an implied evolutionaryprogression from Type 1 through to Type 3, which currentlyis largely the preserve of international NGOs.
The All-China Women’s Federation (ACWF) is anexample of a Type 1 NGO and might be more aptlydescribed as a Government Organized Non-Government Organization (GONGO). Of all NGOsengaged in poverty reduction, the ACWF is the largest.The ACWF works with government departments at alllevels to assist poor women. Its own organizationalstructure reaches from the national level down tovillages throughout the country. Poverty reductionactivities of ACWF have two distinct features:promoting income generation and social services
provision. These are often conceptually combined inprograms. Delivering family planning and female literacytraining is an example of this. Family planning educationcombined with microcredit is another example. The majorACWF activities directly targeted at poor women include:
(i) training poor women to master new appliedagricultural technologies and reproductivetechniques. More than five million poor women in23 poverty stricken provinces and autonomousregions received training through the ACWF in1998;61
(ii) using the Women’s Poverty Alleviation ActionProgram (jinguo fupin xingdong) to fight poverty. TheACWF achieved its target of reducing by numberof poor rural women by one million poor duringthe five year period 1996 to 2000 inclusive;
(iii) promoting mutual assistance of women amongregions and within regions by means of two mainstrategies. The first is by helping poor women toincrease incomes and reduce poverty through
61 ACWF. 1999. Basic Situation of Poverty Alleviation Activitieswith ACWF’s Involvement. Beijing.

The Fight Against Rural Poverty 73
Table 32: Correlation between Environmental, Structural and Behavioral Variables of 20 NGOs
Government dimension
Social dimension
NGO dimension
NGO behavior in poverty reduction
Samples
Type
1 Restricted
association; limited preferential treatment in taxation; status and operations effectively within current legal framework.
Large gap between the supply of and demand for NGO services; limited resources and operational scope.
Lack of independence; ambiguous visions.
Responsive to Government calls.
Resources primarily come from Government.
Combination of administrative control and mobilization.
Top-down intervention to improve human welfare.
Pursuing broad, unchanging objectives.
Cooperation with Government authorities.
Amity Foundation Guangcai Cause Association Linju Poverty Reduction and
Economic Development Association of Shandong Province
Mizhi Science and Technology Association of Shaanxi Province
China Association for NGO Cooperation
China Youth Volunteers’ Association
China Occupational Education Association
China Youth Development Foundation
China Foundation for Poverty Alleviation
Type
2 Restricted
association; limited preferential treatment in taxation; status and operations not adequately provided for in current legal framework..
Large gap between the supply of and demand for NGO services; limited resources and operational scope.
Top down direction. Poor management. Organizational vision being shaped.
Attain self-development Resources primarily come
from overseas. Mobilization. Top-down intervention to
improve human welfare. Comprehensive objectives. Cooperation with local
governments and international NGOs.
Yixian County Poverty Reduction and Economic Cooperative of Hebei Province
Rural Women Knowing All Magazine
Beijing Xingxingyu Education Institute for Children and Autism
Yilong Rural Development Association of Sichuan Province
Yunnan Healthy Birthing Association
Type
3 Freedom of
association; preferential treatment in taxation; legal options to cover status and operations.
Balanced supply and demand. Adequate resources. Considerable operational freedom.
Effective board. Good management.. Mature visions.
Poverty reduction and inclusive approach.
Resources mainly from overseas.
Mobilization. Participatory. Integrated objectives. Cooperation with
government and local NGOs.
Ford Foundation Heifer International Development Organization of
Rural Sichuan Oxfam Hong Kong, Yunnan
Office Save the Children Plan International
Source: Kang, Xiaoguang. 2001. Research on Chinese NGO Poverty Reduction Behavior.

74 Poverty Profile of the People’s Republic of China
“Hand in Hand Action” (shou la shou). ACWFmobilizes richer and/or better-educated women tohelp poor women by providing technical andfinancial support. About 660,000 poor womenreceived this type of assistance in 1996.62 Thesecond strategy is to encourage and organizewomen in the east to assist poor women in thewest;
(iv) organizing poor women in small groups to launchmicrofinance-based income generation activities. In1989, the ACWF in Luliang prefecture, Shanxi,started to use rotational lending as a way to helppoor women out of poverty. By 1996 whenmicrocredit was accepted by the Government as amajor means on achieving poverty reduction, thiskind of activity had assisted 240,000 rural womento escape from poverty in many provinces andregions; and
(v) implementing the “Spring Bud Plan” (chunlei jihua)which helps girl drop-outs return to school. Thisplan is managed by the Children’s Fund of ACWF.The ACWF raises donations for this Fund fromoverseas and domestic sources. The Spring BudPlan has collected over 200 million yuan which hashelped 900,000 girls return to school.
The ACWF has made a commendable contribution torural poverty reduction. In its poverty reduction work ithas learnt much about the wide variety of rural povertypatterns and of rural community responses to povertyreduction interventions. This wealth of experience andtheir sensitivity to the constituency they represent(women throughout the PRC) gives ACWF insights intohow poverty reduction policies and their implementationcan be improved. There is a case for suggesting that theACWF should extend its role to include policy advocacyand policy dialogue with the mainstream povertyreduction agencies (national and local levels of PADO,NDRC, MOF and ABC).
The Youth and Juvenile Development Foundation(YJDF), and the All-China Communist YouthLeague (ACCYL) are also examples of Type 1 NGOs.These two NGOs launched Project Hope in 1989 andhave managed its implementation. The project focuses onimproving education conditions and helping school-ageddrop-outs return to school. YJDF mobilizes donationsfrom both urban and rural residents or helps donors makedirect contacts with recipients. The funds are used to
construct “Hope” primary school buildings. Each schoolis usually named after the principal donor. Project Hopealso pays the tuition for poor students.
By the end of 1998, Project Hope had raised 1.6 billionyuan and built over 7,100 Hope primary schools. ProjectHope has played a significant role in developing educationin poor areas. Its coverage has extended to 96.3% of alltownships and 63.3% of village schools located innational poverty counties.
The China Family Planning Association (CFamPA),China Population Welfare Foundation (CPWF), andChina Population Daily (CPD) jointly operate ProjectHappiness. This project commenced in 1995 with amission to raise funds to help poor mothers escapepoverty by improving their access to resources,eliminating their illiteracy and improving their health. Theproject raises donations from domestic and internationalsources. It uses a revolving fund technique to assist poormothers start income-generation activities, combined witha requirement for strict family planning. Each poormother is provided with a loan of Y2,000 to Y3,000 witha term of one or two years and an interest rate of 3-5%depending on local conditions and the capability of theborrowers. By the end of 1998, Project Happiness hadraised 60 million yuan and helped over 40,000 poormothers in twenty-four provinces and autonomousregions.
The China Foundation for Poverty Alleviation(CFPA) can also be categorized as a Type 1 NGO.63 Whileassociated with NLGOP, CFPA is considered a non-profitinstitution with the goal of promoting economic, cultural,educational, and public health projects for the poor. Itreceives donations and contributions from individuals,enterprises, and organizations both within PRC andabroad. Since 1989, the foundation has provided 500million yuan to support more than 200 projects that havehelped an average of 60,000 people per annum escapefrom poverty.
Between 1997 and 1999, over 10,000 poor people weretrained in raising pigs and sheep and planting mushrooms.During the same period, 40,545 poor people in the karstareas of southwest PRC benefited from CFPA assistancein transforming mountainous areas into 31,700 mu (2,115ha) of arable land at the cost of 800 yuan per mu.The CFPA has also helped poor families in drought-stricken areas of northwestern PRC through theconstruction of small scale water storage facilities of 40
62 Chen, Muhua. 1997. Speech in National Conference on Womenand Poverty Alleviation Action and Double Learning andDouble Competition. Beijing.
63 Formerly known as the Foundation for Underdeveloped Regions inChina (FURC).

The Fight Against Rural Poverty 75
cubic meters capacity at an average of 1,500 yuan. In1997, 3,207 storage tanks and 18 pump stations wereconstructed for a cost of 4.7 million yuan. Beneficiariesnumbered 7,700 people. In Sichuan from 1997 to 1999,600 new timber and brick homes with a floor area ofaround 65 square meters were constructed and 3,990existing homes were renovated for poor peasanthouseholds. Each family received 12,000 yuan forconstruction of a new house or renovation of an existinghouse. In addition, each family received 1,500 yuan forconstruction of a separate livestock pen, a toilet, anenvironment-friendly kitchen (with a window), and pipeddrinking water. About 25,500 poor people benefited fromthis project.
The information released by CFPA on its achievementsreflects a general tendency in the reports issued bydomestic NGOs. That tendency is to focus oninfrastructure built or the cost of inputs and to imply thatall poor people who have access to that infrastructure orcash will be lifted out of poverty. Domestic NGOsrecognize the difference between an output (e.g., schoolsbuilt) and an outcome (e.g., rural people lifted out ofpoverty on a sustainable basis), but are still in the processof placing more emphasis on evaluating impact.
China National Charities (CNC) is an NGO thatarranges funding for the Candlelight Project. This projecthelps poor rural schoolteachers by providing them withspecial subsidies and extra training. The project alsoselects underdeveloped areas in which to launch pilotprojects that explore ways of improving living conditionsand job skills of teachers, and of developing a supportnetwork to help rural schools and their teachers. Theorganization also sponsors corrective surgery for orphansand funds disaster relief and social welfare programs forolder people.
The China Association for NGO Cooperation(CANGO), a Type 1 NGO, was formerly the NGODivision of the China International Center for Economicand Technical Exchange, which is part of MOFCOM.CANGO is a network of domestic NGOs set up toaddress poverty reduction, environmental protection andsocial development in poor, remote, and minority areas. Itfocuses its efforts on integrated community development,primary education for mountain children, training for therural poor women to improve literacy and working skills,microfinance for poor farmers, and sustainableagricultural development for projects in poor areas relatedto handcrafts, forestry, stock breeding, fruit development,and agroprocessing.The Song Qingling Foundation carries the name of amaverick woman in modern PRC history. Song Qingling,
having received a quality education in Shanghai and theUnited States, was driven throughout her adult life by amission to help educate poor girls and women. Thefoundation named in her honor is part of her legacy and itsupports education for poor female children. Its activitiesinclude school construction, stipends, mobile libraries andteacher training. From 1992 to 1998, over 5 million yuanwas provided to Ningxia and Hebei provinces under itsAid the Poor and Support Education Project.
This is an abbreviated coverage of NGOs active inpoverty reduction. The fact is that the number ofdomestic NGOs is growing. Their focus is mostly onpoverty, rural development, women’s issues, health,education, and the environment. The Government’srecent White Paper on “The Development-OrientedPoverty Reduction Program for Rural China” (2001) hasrecognized NGOs as one of the important means ofreducing poverty in the future. The White Paper goesfurther by acknowledging the need to create conditionsfor NGOs to take part in, or implement, Governmentdevelopment projects in poor areas.
RESEARCH INSTITUTES
A number of research institutes have played key roles inanalyzing rural poverty - its root causes, basic conditionsof the poor, the behavior of various types of poorcommunities when interacting with Government andNGO-sponsored activities to reduce poverty and theeffectiveness of poverty reduction programs, Theresearch institutes also draw conclusions on improvedapproaches to poverty reduction. Some of these instituteshave had access to the resources necessary to run pilotpoverty reduction projects and have been able to usepositive field results to influence government policy.These research institutes still receive a significant part oftheir funding from Government, but are now allowed tobe entrepreneurial. They are officially regarded as “social”organizations (shehui danwei) and so it is appropriate toinclude them as NGOs working to reduce poverty.
The following research institutes are the leaders inundertaking poverty-related studies and/or fieldexperimentation:
(i) The publisher of the Poverty and Developmentnewsletter, the China Poverty ResearchAssociation, focuses on rural poverty policystudies, microcredit, child nutrition, and trainingfor poverty research methodologies.
(ii) The Center for Integrated AgriculturalDevelopment at the China Agricultural Universityis a leader on participatory rural appraisal.

76 Poverty Profile of the People’s Republic of China
(iii) The Poverty Research Center of the Institute ofAgricultural Economics at the Chinese Academyof Agricultural Science undertakes research onpoverty standards, policy formulation, rural credit,and agricultural techniques for poor farmers.
(iv) A leading research institute for micro-credit is theCenter for the Study of Poverty of the ChineseAcademy of Social Sciences. This center receivesGrameen Bank funding for practicalexperimentation in micro-credit schemes in areasof high rural poverty. The center is also interestedin poverty fund flows and program effectiveness.
(v) A good example of a leading provincial researchcenter is the Yunnan Province Academy of SocialSciences whose Institute of AgriculturalEconomics has been a progressive force in thestudy of sustainable forestry management andmicro-credit for the poor.
(vi) Another example of a provincial research group isthe Center for Biodiversity and IndigenousKnowledge based in Kunming which includes in itsmandate the ongoing enhancement of sustainablelivelihoods of poor national minorities
INTERNATIONAL NGOS
There are around 120 major international NGOsoperating in the PRC. The official and legal arrangementsthrough which they operate vary because as of 2002, thePRC does not have a standard means of registeringinternational NGOs. Regulations are, however, beingdeveloped. Formal status is important as it confers theability to operate bank accounts, rent office space, providelong-term foreign staff with residence permits and hirelocal national staff. Fortunately, the legal vacuum has notdeterred the inflow of international NGO assistance. Anumber of international NGOs have chosen to remainoffshore and work through domestic legal units (danwei).Others have gained legal status onshore through specialsponsorship arrangements with State organizations likethe Chinese Academy of Social Sciences and the StateForeign Experts Bureau. Still others have registered as“enterprises” with the State Administration of Industryand Commerce. Some have been given county-specificlegality by friendly local administrations. All internationalNGOs will welcome the day when regulations coveringtheir legality and operations are in place.
International NGOs fit into Type 3 of Figure 32. Thecoverage of these international NGOs in this text is
selective and exemplary. As with domestic NGOs, lack ofinclusion of individual international NGOs in this sectionin no way implies that their valuable and efficientcontributions to poverty reduction in the PRC should notbe applauded.
The Ford Foundation was one of the first internationalNGOs to be given legal status in the PRC. It providesresearch grants for examining rural poverty, capacitybuilding using participatory methods, sustainable resourcemanagement, and upland development. The FordFoundation’s poverty-related activities are participatory andcommunity based with particular focus on women,minorities, and natural resource management. Its researchinterests include micro-credit, reproductive health, andmigrant population. The Ford Foundation’s Rural Povertyand Resources Program explores ways in which poor anddisadvantaged farmers can make their voices heard,articulating their preferences, concerns and priorities fortheir own future.
There are several other international NGOs that concentrateon education, environment, and economic developmentissues with linkage to poverty reduction. The AsiaFoundation supports the development of leaders,institutions and policies needed for: (i) effective governanceand legal systems; (ii) actively engaged and responsible civilsociety; and (iii) successful economic reform and sustainabledevelopment. The Worldwide Fund for Nature hasprograms for environmental education in poor areas. Itfocuses on formal education, community education, anddeveloping educational resources. WWF has been active inthe PRC pursuing its global environmental conservationpriorities of targeting forests, fresh water, threatenedspecies, climate change, toxic chemicals, and oceans andcoast. While well known for its efforts to safeguard thepanda and the Tibetan antelope, its PRC programs covermany other areas.
The Phelex Foundation promotes basic education for thefinancially, socially and physically disadvantaged, especiallyin poverty stricken areas. The Sustainable Tuition AidProgram focuses on establishing self-sustainable fundingsources through school operated work-study programs,educational partnerships, communal participation, andvolunteerism. The Zigen Fund promotes educational,social and economic development in the impoverished areas.It provides financial assistance to teachers and girls inprimary and secondary schools, reconstruction andmaintenance of school facilities, and stocking of libraries.Other international NGOs interested in different aspectsof poverty reduction include Action Aid, Care International,

The Fight Against Rural Poverty 77
Caring for Children Foundation, DevelopmentInternational Desjardins, Kadoorie CharitableFoundation, Medicin Sans Frontiers, Mercy CorpsInternational, Oxfam/Hong Kong, Plan International,Red Cross, Save the Children, Voluntary Service Overseas,Voluntary Service Overseas, Winrock Foundation, andWorld Vision.
ASSISTANCE FROMINTERNATIONAL DONORSInternational donor support to PRC is significant.OECD/DAC data show that in 1999 total OfficialDevelopment Assistance (ODA) flows on a disbursementbasis totaled $2,324 million and for 2000 totaled $1,735(see Table 33). These amounts are roughly equivalent to2% of the PRC Government’s expenditure in the sameyears on economic construction and social, education,and cultural development. Also in 1999, Other OfficialFlows (OOF), mainly provided by the OCR window ofthe ADB and the IBRD window of the World Bank,reached $2,950 million on a commitment basis. For 2000,long-term loans in the OOF category totaled $2,976million on a commitment basis. Of this amount, themultilaterals (primarily the ADB and the World Bank)accounted for $2,425 million. Projects financed by ODAand/or OOF are leveraged by agreed counterpart fundingand staffing.
International donors have progressively elevatedassistance to poverty reduction to be a key objective. Thedonors endeavor to demonstrate sustainable andreplicable models for poverty reduction and to influenceGovernment policy and practice in this area. Approachesadopted by international donors can be categorized as: (i)working with the poor to increase income and services; (ii)poverty reduction as an integral part of overalldevelopment; (iii) extension of sustainable social servicesto poor counties and communities; (iv) improvinginfrastructure and addressing environmental problems inareas where the poor are concentrated; (v) small-scalegrants to the poor; and (v) support for research andexperimentation.
There is no formally established donor coordinationgroup for the PRC. Donor coordination in the case of thePRC is also complicated by institutional arrangementsthat have different groupings of donors processing theirassistance through different PRC coordinating agencies,with MOF (for the World Bank, ADB and bilaterallending agencies) and MOFCOM (for grant agencies)being the major players. On the positive side, initial stepswere taken in 2001 and further steps are underway toestablish a donor coordination forum involving alldonors, MOF, MOFCOM and NDRC. AusAID hasrecently financed a capacity building activity to strengthenMOFCOM’s ability to foster rational donor coordination.This included a donor coordination workshop in 2002 onhow best to rationalize donor assistance in the HIV/AIDS area to best meet the PRC’s needs. There are alsoregular monthly donor co-ordination meetings in Beijingheld on a relatively informal basis. Furthermore, theBeijing Office of UNDP publishes a periodicDevelopment Cooperation Report and has compiled aPoverty Compendium for the PRC.
Poverty reduction is an area that has drawn a number ofinternational donors together in cooperative action. InMay 2000, ADB, World Bank, UNDP and LGOP co-sponsored an international poverty reduction conference.The main objective of the conference was to makerecommendations to LGOP on its future poverty strategycovering the 2000 to 2020 period. Detailed discussionswere held on defining and monitoring poverty, socialdevelopment, macro-economic policies, remote areadevelopment, information technology, financing andbanking system for the poor, social security, civil societyorganizations and participation, and the westerndevelopment strategy for poor areas. This conference ledto the ADB supplying policy development support toLGOP in 2001 and the UNDP packaging acomplementary capacity building support program.
The following coverage of international donor activity inthe PRC to reduce rural poverty is highly selective. Its aimis to give the flavor of what these donors are doing. Theomission of any official donors or the sparing referencesto projects financed by specific donors is in no way areflection on the valuable contribution their assistance hasmade, and is continuing to make, to the PRC’s efforts toreduce poverty. As this is an ADB publication, the ADB isone of the donors selected for coverage. The moredetailed coverage given to the ADB is to demonstrate howan International Finance Institution that lends to the PRCfor mainly physical infrastructure projects can attune thatlending so that it has a major pro-poor impact.
Table 33: ODA Flows to PRC (Disbursement Basis)
Sources: OECD-DAC, World Bank.
Net Receipts 1997 1998 1999 2000
Total ODA ($ million) 2,013 2,359 2,324 1,735
Multilateral share 38% 27% 21% 27%
Bilateral share 62% 73% 79% 73%

78 Poverty Profile of the People’s Republic of China
ASIAN DEVELOPMENT BANKWith the adoption of its new Poverty Reduction Strategyin November 1999, ADB refocused its work to the single,overarching goal of eliminating poverty from the region.All ADB projects address the three pillars of the povertyreduction strategy: pro-poor economic growth, socialdevelopment, and sound development management forpoverty reduction. Three cross-cutting themes add to thefocus and effectiveness of these three pillars. They are: (i)the promotion of the private sector; (ii) the pursuit ofenvironmental sustainability; and (iii) regional cooperationand integration for development.
The ADB’s comparative advantage in assisting the PRCreduce poverty is to support the pro-poor sustainableeconomic growth through infrastructure and incomegeneration projects and strengthen sound developmentmanagement of income and non-income (social andenvironmental) poverty reduction. As part of theenhancement of poverty reduction impacts of itsinfrastructure interventions, the ADB will ensure thataround 70% of such projects will be located in thewestern and central areas. In addition, the ADB will striveto increase the participation of the private sector inpoverty reduction activities, and help match privatebusinesses and villages for cooperation in sustainable pilotpoverty reduction programs, technical transfer, andhuman resource development.
The PRC is not among the very low-income developingcountries and as such does not qualify for the ADB’sconcessional Asian Development Fund loans. The ADB’sloan assistance to the PRC is thus provided oncommercial or near-commercial rates. The PRC has astrategy of using “hard” donor money for revenuegenerating projects, and “soft” donor money for non-revenue generating projects. Thus ADB lending has beendrawn to projects in areas such as toll roads, energy, watersupply, financial sector, industrial enterprises and agro-processing rather than in direct poverty reduction andbasic improvements in rural health and education.
Notwithstanding this, as a matter of ADB policy andpractice, through social assessment and, more recently,poverty impact analysis, project design has beendeliberately adjusted to have significant poverty reductioneffects. In the case of rural poverty, this has beenparticularly so with physical infrastructure projects andagriculture projects. Furthermore, as many of theseprojects need land currently occupied by poor farmers,ADB policy and practice has been to ensure that thewelfare of such affected persons is re-established on asustainable basis to at least the same level as prevailedbefore land acquisitions.
The ADB has also selected and designed its advisorytechnical assistance (ADTA) grants to promote improvedknowledge, policy and practice about poverty reduction.The following points summarize the ADB’s strategy toreduce rural poverty in the PRC through its loan andADTA facilities.
(i) Using Physical Infrastructure to ReducePoverty : The focus of ADB’s physicalinfrastructure projects has shifted to southwest andcentral PRC where the majority of the remainingrural poor live. Providing transport links andelectricity bring significant benefits to people,especially minorities living in these poor regions.Intra-regional and inter-regional markets for ruralproduce and products expand, employmentopportunities increase and the industrial andservices sectors in the project areas grow. Since themid-1990s, the infrastructure projects funded byADB have been strategically located in the poorinterior provinces and have been designed tosimultaneously lead to improvements in theprovision of social services. Improved transportlinks facilitate access to education facilities andhealth services. However, the linkages betweeninfrastructure investment and poverty reductioncan be intricate and the ADB is constantly alert tofinding ways of strengthening these linkages. Aspart of this investigative effort, the ADB in 1999financed an infrastructure pilot project.64 Threepoor villages are being observed periodically andchange in behavior analyzed. One village has, underthe project, been supplied with a simple accessroad, electricity, irrigation and drinking waterfacilities. A second village has only been suppliedwith electricity, and the third is a control villagewhere no such infrastructure has been built.
A review of this pilot project in early 2002 foundthat the inhabitants in the village receiving a simplepackage of small-scale infrastructure had benefitedthrough improved income and quality of life,particularly where there was significantparticipation by villagers in planning, building andoperating the new facilities. Important also inrealizing the gains was help from ruraldevelopment experts and NGOs in showingfarmers how to make best use of the newinfrastructure. Local road improvement haslowered the cost of key items such as coal, fertilizerand house construction materials. Improved access
64 ADB. 1999. A Study on Ways to Support Rural Poverty ReductionProjects. Manila.

The Fight Against Rural Poverty 79
to water has enabled farmers to increase theirlivestock holdings and significantly reduced thetime devoted by women to water collection.Electricity has meant more productive use of thenight by adults and children. The provision ofinfrastructure also increased the number of daysworked in a year by able-bodied villagers. It alsoenabled a higher level of off-farm employmentcompared to other two villages.
(ii) Using Agriculture and Rural Finance toReduce Poverty: The ADB has supportedagriculture projects that create sustainable, income-generating opportunities. To improve thecommercial orientation of the agriculture sector,some ADB financing has been channeled throughfinancial intermediaries for agroprocessingcomponents that have had a significant impact onemployment generation and value-added economicactivities in rural areas. Emphasis has been placedon improving the policy and regulatory frameworkfor extending credit and improving riskmanagement at ABC. Past ADB credit lines toABC have emphasized both the importance ofinvesting in poor areas and allowing ABC toexercise independence in determining feasibleprojects.
(iii) Using the Private Sector to Address Poverty:The Private Sector Group of ADB established theLiberty New World Fund in 2000 with an equityinvestment of $25 million. The projects that theFund will consider include those that have directand indirect effect on poverty reduction. Since theFund is invested largely by investors seekingsatisfactory returns and the ADB is a minorshareholder and the Fund’s primary objective iscommercial viability. The Fund will therefore seekopportunities for project investments that will helpcombat poverty without compromising financialreturns.
(iv) Protecting Families and Vulnerable GroupsWhile Reducing Poverty: Whenever an ADBproject results in involuntary resettlement, theADB ensures that those resettled will at least beable to maintain the same living standard as wasthe case before the resettlement. According tosample surveys of families to be resettled underADB-financed projects, most households welcomethe opportunity and view resettlement as a meansto improve the family’s standard of living,especially in terms of better housing and access towater and electricity. ADB also analyzes the likely
effects of project activities on women andminorities. Projects with serious adverse impactswere not to be supported unless they wereredesigned to mitigate the negative impacts.
(v) Supplying Strategic Policy Advice on PovertyReduction to Key Government Agencies: TheADB has been active through its ADTAs inassisting the PRC develop policies and strategiesfor effective poverty reduction from 2001 onwards.A prime example of this was the ADTA to preparea methodology for development planning inpoverty blocks under the new poverty strategy.This was a joint study of the LGOP and the ADB,with results being presented directly to the LGOP.The outcome of this Study was the acceptance bythe Government in 2001 of a highly participatoryapproach to village development planning and theclassification of poverty households feedingresponsively into county-level poverty reductionplans.
Many of the ADB’s past projects and TAs in the PRChave had direct and indirect impacts on poverty reduction.Without belittling those impacts, it is fair to say that thepipeline for future ADB activities in the PRC reflects theBank’s policy change in 1999 to elevate poverty reductionto be its single overarching goal.
Appendix 3 describes in more detail ADB activities inpoverty reduction in the PRC.
WORLD BANK
The World Bank has rigorously focused on reducingpoverty through its assistance to the PRC. Until 1st July1999, the World Bank provided finance to the PRCthrough both its soft (IDA) and hard (IBRD) loanwindows. The World Bank’s direct poverty reduction,health and education assistance was generally financed byIDA loans. On the basis of a reassessment of the level ofeconomic and social development achieved, the PRCgraduated from access to IDA in 1999. This means that,like the ADB, the World Bank’s poverty reduction effortssince that graduation have been and will continue to befinanced on the near commercial IBRD terms.
One of the three key areas of the PRC’s developmentagenda which the World Bank seeks to assist through itscountry strategy is to:
• address the remaining pockets of extreme povertyand reduce widening inequalities between the coastalareas and lagging interior, thereby helping to maintainsocial cohesion and ameliorate pressures to migrate.

80 Poverty Profile of the People’s Republic of China
In the lagging regions, the World Bank willemphasize the quality as well as the quantity ofgrowth by, for example, promoting expanded andeffective investment in human development, socialprotection and the environment, funding transportinfrastructure to close geographical distancesbetween lagging areas and leading regions andmarkets, and providing analysis and advice, whenrequested, to bring the lessons of internationalexperience to the PRC.65
The World Bank’s has modulated its assistance programto be more focused on the poorer and institutionallyweaker inner and western provinces. Given that the WorldBank is constrained to lending to the PRC only throughits IBRD window, an exploratory exercise is underwaywith the Government and bilateral partners to identify asuitable approach for continued financial assistance forsocial and direct poverty alleviation programs.
A large number of the World Bank’s projects in the PRChave had either direct or indirect pro-poor impacts. Fromthe past and on-going country program three majorprojects with direct poverty reduction objectives havebeen selected for mention here. These are: (i) theSouthwest Poverty Reduction Project; (ii) the QinbaMountains Poverty Reduction Project; and (iii) theWestern Poverty Reduction Project. The SouthwestPoverty Reduction Project, begun in 1995 and nowcompleted, was targeted at 35 counties in Yunnan,Guizhou, and Guangxi. It included land development,rural infrastructure, TVE development, labor mobility,education, health, institution building, and povertymonitoring. The total investment is 4.23 billion yuan(including $247.5 million from the World Bank) and theproject was aimed at helping about 2.8 million poorpeople.
The Qinba Mountains Poverty Reduction Project,commenced in 1997 and now drawing to a close, willassist about 2.3 million poor people living in 26 povertycounties in Sichuan, Shaanxi, and Ningxia. The projectactivities have been similar to the Southwest Project withthe addition of a microfinance component. The totalinvestment of this project is 3 billion yuan including and a$180 million World Bank loan.
The Western Poverty Reduction Project, approved in July1999 and currently ongoing, will assist 2 million ruralpoor living in 20 poverty counties in Inner Mongolia,Gansu, and Qinghai through the same activities as theother two projects. The total investment is 2.7 billion
yuan, including a $160 million World Bank loan.There are several projects in the World Bank’s pipelinethat are directly targeted at poverty reduction. One ofthese is the proposed Poor Rural Communities ReductionProject which may be approved in 2003. The objective isto improve livelihoods security and achieve sustainedparticipation of the poorest rural people in selectedcounties of four less developed provinces. Participatoryapproaches are to be central to all stages of the projectcycle. Its components include sustainable mountainagriculture development, basic rural infrastructure, basiceducation and health. The indicative loan amount is $150million. Another is the Basic Education in Western Areasproject, which also may be approved in 2003. This projectaims to support the universal completion of nine years ofquality compulsory education for children in Sichuan,Gansu and Yunnan Provinces and in Ningxia Hui andGuangxi Autonomous regions. As mentioned earlier,several PRC studies have concluded that improvededucation is one of the most effective ways to reducepoverty. Tentative World Bank financing is $100 blendedwith a prospective grant from the UK Department forInternational Development (DFID). The proposedGansu and Xinjiang Pastoral Development project is yetanother. The targeted beneficiaries are ethnic minoritysemi-nomadic herders whose livelihoods are to beimproved through enhancement of the livestock andmarketing production systems. This project may also beapproved in 2003 with an indicative loan amount of $66million with additional funds from the GlobalEnvironment Facility.
UNITED NATIONS DEVELOPMENTPROGRAMME (UNDP)UNDP has established an Advisory Board for Donor-Supported Poverty Alleviation Programs in the PRC. Themain functions of the board are to: (i) provide advice andproposals on poverty reduction policies and strategies tosenior Government officials; (ii) promote donorcoordination of poverty-related activities; and (iii)promote information exchange among key stakeholders.The advisory board comprises LGOP, the ChinaInternational Center for Economic and TechnicalExchanges (CICETE) of the Ministry of Commerce(MOFCOM), and UNDP as co-sponsors and coremembers and MOFCOM, MOF, PBOC, ABC, AusAID,Canadian International Development Agency (CIDA),World Bank, World Food Program (WFP), InternationalFund for Agricultural Development (IFAD), UnitedNation’s Children’s Fund (UNICEF), the Ford
65 World Bank. http://www.worldbank.org

The Fight Against Rural Poverty 81
Foundation, the RDI of CASS and ADB as othermembers. UNDP is pursuing microfinance as a majoragenda item with the board.
UNDP works with the CICETE to supportdemonstration projects for the poor at the grassrootslevel. An example is a four-year $2 million project forPoverty Alleviation and Sustainable Development inGanzi and Aba Prefectures of northwest SichuanProvince. The project focuses on providing microcredit,mainly to women from poor households, for both on-farm and off-farm activities with attention toparticipatory mutual help group formation, improvedtechnologies for sustainable agriculture, skills training, andnatural resource management.
OTHER UN AND REGIONAL AGENCIES
A range of other UN agencies are active in China. Theseinclude UNICEF, the World Food Program, IFAD, FAO,UNFPA, ILO and UNESCO. Also increasingly active isthe European Union. Details of their past and pipelineprojects in the PRC are generally available on theirrespective websites.
BILATERAL DONOR ASSISTANCE
Bilateral donors have generally made assistance forpoverty reduction their top, or one of their top themes intheir assistance to the PRC. Table 34 sets out net ODAflows to the PRC during 1998-99 and 2000 from majorbilateral donors. Because ODA represents grant and softmoney, the Government agencies coordinating donorassistance are positively disposed to directing much of thefunds into direct poverty reduction activities. Thefollowing paragraphs give a brief flavor of some of thepoverty-related projects supported by a random selectionof bilateral donors to the PRC. Those donors notincluded in this text are making their own valuablecontribution to the PRC’s fight against poverty andpublishing research papers, project assessments andevaluations that assist other donors better design theirprojects to be effective under PRC field conditions.Japan: Japan’s provides its assistance to the PRC throughtwo implementing agencies: the Japan InternationalCooperation Agency (JICA) for technical assistance; andJapan Bank for International Cooperation (JBIC) forfinancial assistance. Japan provides about $20 million ingrants per year to assist the poor, mainly in the educationand health sectors. A unique feature of its program is the$100,000 community grants for rural areas. The keycriteria for such projects are participation of the poor,sustainability and effective monitoring. Microfinance
programs for the urban poor are currently underconsideration and a pilot is being tested outside ofBeijing.
JICA’s poverty reduction program focuses on urban andrural health, middle and primary schools in poor counties,rural production including soil and water supplytechnologies, social security reform, and women anddevelopment. JICA grant aid activities include support forhealth, education, research, agriculture, environment,communications, transportation, fisheries, and grainproduction.
In December 1999 JBIC formulated a Medium-term Strategyfor ODA operations in the PRC. One focus area is foodsecurity and poverty reduction. Other foci, such as inlanddevelopment; and social and economic infrastructuredevelopment are also closely interrelated with povertyreduction. JBIC has been considering how to make itsassistance more explicitly pro-poor and, wishing to do soin an informed way, is compiling a PRC poverty profilereport.
Germany: German assistance for poverty reduction ischanneled through GTZ, KfW, and governmental grantfunds. GTZ focuses on five main areas: vocationaltraining and education; economic and structural reform;poverty reduction and food security; transport; andenvironment and resources protection. One of GTZ’sexemplary pro-poor activities in the PRC has been theSino-German Poverty Alleviation Program in Henan andYunnan Provinces. GTZ has provided a DM 2.4 million
Major Bilateral Donors of netODA
1998-99average
2000
$Million
$Million
xxJapan 1,192xx 769xxxxGermany 313xx 213xxxxUnited Kingdom 57xx 83xxxxFrance 38xx 46xxxxSpain 27xx 32xxxxAustralia 26xx 29xxxxCanada 42xx 29xxxxNetherlands 24xx 25xx
Table 34: Net ODA to PRC from Major Bilateral Donors
Source: DAC of the OECD.

82 Poverty Profile of the People’s Republic of China
grant to support this program. Its main components arewater supply, soil conservation, afforestation, terracing,and technical training. In this and other projects, GTZstresses the participatory approach method and makesregular use of United Nations Volunteers (UNVs).Overall, GTZ provides about $3.3 million per year fordirect rural poverty reduction projects. GTZ is currentlyconsidering how to support urban poverty.KfW focuses on environmentally sound infrastructureconstruction, environmental protection, and economicreform. Its activities in supporting renewable energy andenvironmental protection in the PRC in areas such asafforestation, forestry management, and natureconservation, improve the livelihood options of the ruralpoor as well as the non-poor.
United Kingdom: The Department for InternationalDevelopment (DFID) has established poverty reductionas a central goal of its strategy in the PRC. It focuses onenvironmental improvement, primary education, health,and social services reform. An example of this focus isthe Yunnan Environmental Development Programme(YEDP) which seeks to identify and demonstratestrategies and approaches for redressing environmentally-related rural poverty. It is a process program withactivities being defined and scheduled progressively incollaboration with Yunnan’s PADO, DevelopmentPlanning Committee and Environmental ProtectionBureau. A “Preliminary Integrated Strategy” for reducingthis category of rural poverty has been completed andgrass roots pilot projects are being designed so that theirfield results can be used to refine the strategy. DFID isproviding $9.6 million as a grant in support of thisprogram. This is a four year program which commencedin 2001.
Australia: The objective of the Australian aid program tothe PRC is to alleviate poverty and support sustainabledevelopment. The program’s direct poverty reductionprojects are in the health, education and ruraldevelopment sectors, and include microcredit and incomegeneration activities. The program is focusedgeographically in the western and central regions. Of noteis the Qinghai Community Development project with itsMicrofinance Consolidation follow-on (A$5.4m).Launched in 1994 with a one year inception phase todevelop an optimum pro-poor design, the follow-onmicrocredit component will be completed by mid 2003. Itfocused largely on establishing income generatingactivities for poor households, training to improvedelivery to the poor of agricultural extension, health andeducation services, and the provision of credit. Its maingoal is to improve the living standards of poor
households in 112 villages and 28 townships. The NingxiaChild and Maternal Health project (A$5.7m), and thePrimary Health Care and Water Supply Project in Tibet(A$3.4m) are other examples of rural poverty reductionprojects with the added feature of being particularlydirected towards women.
Canada : The poverty orientation of the CanadianInternational Development Agency (CIDA) is on incomegeneration, social services, food security, participatoryapproaches, and gender issues especially in western PRC.Canada provides about $25 million in grants per year fordevelopment activities of which 25 to 33% is used forincome generation for the poor in rural areas. Priorityprojects are in the areas of agriculture, health, education,irrigation, fertilizer, and terracing. CIDA stresses theimportance of sustainable income-generatingopportunities in all of its poverty reduction activities.Recent projects specifically targeted at rural povertyreduction include, but are not limited to, the following:
i) Xinjiang Women’s Income Generating Project(C$5m with a duration of 1996 to 2002) whichimproved women’s access to and control overincome through functional literacy, businessmanagement and skills training as well access tocredit. It has targeted women in villages withprimarily minority populations. Project activitiesincluded training, the identification andstrengthening of existing and the establishment ofnew local micro-credit/savings and loanorganizations and the development of viable,profitable individual and group-owned enterprises;
ii) Integrated Rural Development Poverty ReductionProject (C$6.2m with a duration of 1996 to 2003).The goal of the project is to increase householdlivelihood security in terms of food, income levels,basic health and nutrition, and social well-being oftargeted poor populations in selected “povertycounties” of Ningxia, Gansu, Shanxi and Guizhou,and develop an increased PRC capacity to addresspoverty alleviation. Emphasis has been placed onthe “soft” training and technical assistance activitiesrather than on physical infrastructure andequipment; and
iii) Canada Fund for Local Initiatives Project (C$0.8mwith a duration of 2002/2003 renewable annually).This is an innovative pro-poor approach toprovide a responsive small-project fundadministered from the Canadian Embassy inBeijing. It is designed to finance local initiativesproviding technical, economic or socialdevelopment assistance to local populations, with

The Fight Against Rural Poverty 83
particular emphasis on seven of the PRC’s poorestprovinces and autonomous regions. While initiallyit is working through existing governmentalorganizations at the provincial level and below, itwill seek to cooperate with PRC NGOs, as andwhen opportunities arise.
RISING TOTAL COST PER UNIT OFRURAL POVERTY REDUCTION
Now that all strands of the rural poverty reduction effortin the PRC have been covered in this text - that isGovernment, society-based and international donorassistance - it is possible to take a global overview of theunit cost of freeing people from absolute poverty asdefined by the PRC’s official poverty line. Figure 26 andFigure 27 not only incorporate Government expenditurespecifically on rural poverty reduction (as shown earlier inFigures 23 and 24) but expand expenditure and unit coststo cover all specific funding of rural poverty reductionfrom all sources.
Figure 26 compares for the 8-7 Program period the trendin the numbers of rural people released from poverty withthe total expenditures from all sources directed at povertyreduction, expressed in 1997 constant prices. While therehas been a fairly regular trend line for achievements inpoverty reduction numbers, the expenditure changesfrom a horizontal trend between 1994 and 1996 to asteeply rising trend thereafter reaching 40,718 million
yuan in 2000 (in constant 1997 prices). This reflects theincrease in the unit cost of freeing the rural poor frompoverty.
Figure 27 processes this information by one further stepto present both the total cost from all sources and themainstream Government program cost per rural personfreed from poverty expressed in 1997 constant prices. Thefunding amounts are compounded into three year rollingaverages to smooth out the effect of single year swings inexpenditure and/or poverty reduction achievements. Thisapproach is more likely to give an accurate picture of theunderlying reality. Between the three year rolling periodsof 1994-96 and 1998-2000 the total unit cost of ruralpoverty reduction has always been on the rise with a trendto a sharp rise evident in the last three period 1998 to2000.
In the final three year period covered in Figure 26 (1998-2000) the total cost per rural person freed from povertyhad risen to 6,486 yuan in 1997 constant prices. This isequivalent to 10 years per capita income set at the nationalpoverty line. This large multiple between the nationalpoverty line and the unit cost of poverty reduction raisesvery serious questions of targeting and the distributionalaspects of income generated through the past povertyreduction programs. This concern stands notwithstandingthe fact that as the fight against rural poverty reaches thelast vestiges of more complex impoverishment, unit costswill rise.
Source for both Figures: Derived from NBS Official data and information provided by Executive Director of the China Foundation for Poverty Alleviation to anInternational Conference on NGOs held in Beijing in October 2001.
Figure 26: Trends in Total Poverty Funding and Poverty Reduction
0.0
10.0
20.0
30.0
40.0
50.0
60.0
70.0
80.0
1994 1995 1996* 1997 1998 1999 2000
No.
of
Poo
r (m
ill)
0
5,000
10,000
15,000
20,000
25,000
30,000
35,000
40,000
45,000
Mill
Yua
n (1
997
cons
tant
pri
ces)
No. of Poor (mill) Funding All Programs
Figure 27: Cost per Rural Person freed from Poverty (rollingthree year average)
0
1,000
2,000
3,000
4,000
5,000
6,000
7,000
1994-96* 1995-97 1996-98 1997-99 1998-2000
Yu
an (1
997
con
stan
t pri
ces)
Government cost per person freed Total cost per person freed


Understanding Urban Poverty 85
UNDERSTANDING URBAN POVERTY
URBAN POVERTY AS A RECENTLY PERCEIVED PROBLEMKhan and Riskin estimate that in 1988 the deep poverty incidence among PRC urban dwellers was only 1.3%, compared to thirteen times thatlevel for the rural population.66 The World Bank also found urban poverty rates to be similarly low during the 1980s compared to rural povertyrates The World Bank also found urban poverty rates to be similarly low during the 1980s compared to rural poverty rates.67 The reasons forthis stark difference stem from an institutionalized dualism between urban and rural populations. From the mid-1950s, personal identity hasbeen tied to communes and thereafter to administrative villages and townships for the rural community or to government, social or enterprise unitsfor the urban community. Everyone has either registered urban or rural status. Each city issues its own residence permits to its citizens. Theseresidence permits are a prerequisite for gaining access to facilities and privileges such as public schools, urban subsidies and in earlier years urbanration tickets for purchase of rationed items at State-set prices. A quaint and very observable welfare practice in the PRC’s northern cities duringwinter until the early 1990s was for city governments to buy enormous quantities of cabbages from farmers, place these cabbages on city corners,and sell them at highly subsidized prices to registered city residents.
Institutional arrangements sustained the welfare of urbandwellers who comprised around only 23% of thepopulation in the 1980s. The units to which nearly allurban adults belonged paid wages according to a uniformremuneration framework, and directly or indirectlyprovided welfare services to their members and theirchildren. Furthermore, where circumstances arose thatmade a family within the unit vulnerable to poverty, thenthe unit took responsibility for giving extra support tothat family. An example of such circumstances would bewhere one the breadwinners in a family passed awayleaving the remaining breadwinner with onerous careresponsibilities over elderly parents and children (as in the1970s it was still permissible to have more than one child).
It can also be argued that the PRC’s developmentstrategies and the investment and re-investment of Statecapital had favored urban over rural communities. Withsuch a wide range of advantages, city life must havelooked very attractive to country folk. Yet change ofstatus from rural to urban was extremely difficult. Evenchange of residence from one city to another wasdifficult. Travel permit checks at urban railway stationsand airports constricted social and labor mobility. So itwas not until the late 1980s when these restrictions wereeased that the cities started to experience large floatingpopulations drifting in from and back out to the countryside.
Two fundamental changes were underway in the late1980s and early 1990s which were to jolt bothGovernment and donors into realizing that poverty wasno longer confined to the less fortunate segment of therural population. First, hard decisions to down-sizebloated SOEs were being implemented, thus generating
millions of laid-off workers who could not quickly be re-employed. Second, a relaxation of travel restrictions,combined with the needs for unskilled labor generated bya massive boom in urban construction, has meant themovement into cities of large and growing floatingpopulations. Ineligible for urban welfare entitlements,confined to cramped living conditions with few amenitiesand often subject to spasmodic employment, thesepopulations display visible examples of urban poverty.
DEFINING THE URBAN POORIn defining urban poverty, it is essential first to understandwho is “urban”. At the end of 2000, approximately 36%of the PRC’s population was classified as urban, of which239 million lived in the Eastern region, 147 million in theCentral region and 79 million in the Western region. Theemphasis is on the phrase “classified as urban”. It isdifficult to establish the size of the population physicallyliving in urban environments. This is because peopleclassified as “non-agricultural” under the nation-widepersonal registration system do not all live in urban areas.Of the 458 million individuals registered as non-agricultural (thus officially urban) in 2000, 34% (156million) were resident in rural localities. Around 21% oflong term residents of urban districts (96 million) carry an“agricultural” classification. Nearly all recently arrivedmigrants to the cities from rural areas do not have urbanstatus, and thus their numbers are additional to the 96million above. Determining a more accurate figure for theurban population therefore involves making adjustmentsto the official statistics.Unlike its approach to rural poverty, the PRC has notadopted an “official” urban poverty line for the wholecountry. Given the wide variation in the cost of food and
661 Khan, A.R., and C. Riskin, 2001. op.cit.672 World Bank. 1992. China: Strategies for Reducing Poverty in the 1990s.
Washington, DC.

86 Poverty Profile of the People’s Republic of China
essential non-food items among the 663 cities, it isunderstandable that national policy has not done this. Themanner in which the PRC conceptualizes urban povertywas analyzed in a recent ADB Study. The analysis ofurban poverty in this Poverty Profile draws on that work.Broadly, various government agencies apply either adiagnostic or a benefit-entitlement poverty line. Adiagnostic poverty line is purely for the purpose ofidentifying the urban poor. The setting of such a line isnot constrained by any implication that those identified aspoor will be the beneficiaries of Government povertyreduction programs. In contrast, a benefit line identifiespotential recipients of poverty relief assistance anddetermines the magnitude of such assistance.Considerations of funding constraints and maintaining anincentive for the poor to keep seeking employment, factorheavily in determining such a line.
These benefit lines are set by city governments as it isprimarily local governments that are responsible for thewelfare of the urban poor and financing welfare relief. Inprinciple, cities set their benefit line by costing 20 items ofgoods and services for basic subsistence (the “basicneeds” approach). Methods of determining the line varyamong cities. Some have designated a special group ofofficials to compile a detailed list of the local examples ofthe basic goods and services and to survey their prices.Other cities make an educated guess in setting theirpoverty (benefit) line. These benefit lines for major PRCcities are shown in Table 35. The average of all benefitslines in the Table equates to 2,365 yuan per capita perannum.
The rising number of urban unemployed in the early1990s that prompted various national agencies tocalculate diagnostic poverty lines as a basis forascertaining trends and providing data to feed intonational policy making. These diagnostic lines haveaggregated data to arrive at either a national line or oneline for inland cities and one for coastal cities. In 1997,researchers at the Development Research Center of theState Council estimated that the urban poverty thresholdshould be set at 1,700 yuan, being 33% of the per capitaaverage urban annual income (5,160 yuan). Pendingcompletion of more research, the May 2000 PovertyConference agreed that in general urban poverty linesshould be two times those of the rural poverty lines forinland cities, and three times in the coastal region. TheMinistry of Civil Affairs put the urban poverty line atabout 1,800 yuan per capita annual income for the wholecountry. The NBS has compiled a time series since 1991that shows a diagnostic urban poverty line rising to 1,875yuan in 2000. Each agency’s diagnostic urban poverty line
is set out in Table 36.
Also shown in Table 36 is the lowest of the urban povertylines calculated by Khan and Riskin for 1995.68 They drewon NBS data covering the poorest decile of the urbanpopulation. This data show consumption levels andoutlays by the poorest decile on 25 items of food. Fromtheir food expenditure pattern, Khan and Riskinestimated that the cost of supplying a kilocalorie per dayfor a year was 0.60 yuan. Taking the 2,100 kcalories as theminimum per capita food requirement then the FPL cameout as 1,260 yuan. NBS data showed that for the poorestdecile, food accounted for 59.5% of expenditure. BecauseKhan and Riskin had a different definition of urbanincome than the NBS, they adjusted the basic foodcomponent down to 55% of total consumption. Thisgave a broad urban poverty line of 2,291 yuan per capita.Khan and Riskin also developed two harsher measures ofurban poverty, one at 80% of broad poverty (which theycalled “deep” poverty), and one at 70% of broad poverty(referred to as “extreme” poverty). Their “deep” and“extreme” urban poverty lines for 1995 were 1,833 yuanand 1,604 yuan respectively.Just as for the rural poverty line, it makes a significantdifference whether the urban poverty line is applied as ameasure of per capita income or consumption. The urban
68 Khan, A.R., and C. Riskin. 2000. Inequality and Poverty in China inthe Age of Globalization. New York: Oxford University Press.
Table 35: Benefit Lines as a proxy for Poverty Lines in 35Key Cities (yuan per month/person, 1998 data)
City BenefitLine City Benefit
LineShenzhenUrumqiChengduXianKunmingNanjingNanningQingdaoHangzhouChongqingHuhotShijiazhuangZhengzhouJinanGuangzhouHefeiNingboDalian
319156156156182180183200220169143182169208300165215221
LhasaShanghaiGuiyangWuhanChangshaNanchangXiamen**TaiyuanChangchunTianjinHaikouBeijingShenyangFuzhouXiningHarbinLanzhou
170280156195200143
265-315156169241221280195200155182156

Understanding Urban Poverty 87
Table 36: Diagnostic Urban Poverty Lines (per capita per annum, yuan in current prices)
May 2000 Poverty
Conference
National Bureau of Statistics Khan and
Riskin
Year
Urban Poverty
Line for
inland cities
(twice the
rural poverty
line)
Urban
Poverty Line
for coastal
cities (triple
the rural
poverty line)
Line 1* Line 2* Development
Research Center
of the State
Council
Ministry of
Civil Affairs
Low urban
poverty
threshold
Income
basis****
1990 600 900
1991 608 912 752
1992 837
1993 993
1994 1,300
1995 1,060 1,590 1,547 1,604
1996 1,160 1,740 1,671 1,850
1997 1,280 1,920 1,890 1,700
1998 1,270 1,905 1,880
1999 1,300 1,950 1,860 1,800**
2000 1,300 1,950 1,875
Notes: * The difference in the two lines is the prices NBS used to cost basic necessities** It is assumed that the announced MCA figure applied to 1999*** This figure was derived by follow-on analysis conducted by the Urban Survey Organization of NBS for the ADB**** Khan and Riskin’s figures were taken from their book: Inequality and Poverty in China
poor need to scrape some savings together for catastrophiccosts and social obligations, and they may need extra cashto pay back informal loans that have helped them surviveduring past bad income years. As a general rule, the levelof total income needed to support basic needsconsumption expenditure will be higher than the sum ofthe food poverty line (FPL) and the value of basic non-food expenditure. Largely because of the type of statisticaldata collected annually, the PRC has tended to count peopleas poor if their income was below the standard povertylines. The question arises of how to count those who areunable to achieve consumption levels in excess of theaverage of benefit lines set by city governments (that is2,365 yuan per capita per annum).The Urban Survey Organization of NBS has conductedanalysis to establish the normative level of household percapita income for households exhibiting per capitaconsumption of 2,310 yuan per annum. This figure is soclose to the average of city benefit lines that it can serve asa proxy for that average. Three analytical methods wereapplied to achieve this aim. These were: (i) the point
estimation method where the median per capita incomewas calculated for those households among the total 1998sample of 17,000 who exhibited exactly 2,310 yuan perannum in consumption expenditure; (ii) the intervalestimation method where average per capita income iscalculated for those households in the sample whose percapita expenditure fell within expanding bands 1 to 3%greater and less than 2,310 yuan; and (iii) log-linear regressionanalysis testing consumption and income relationships forthe whole sample of 17,000 households. The third methodfound a strong functional relationship between levels ofconsumption and income at those consumption levels. Usingthe log-linear regression model, a best fit equation relatingincome to consumption levels was derived. According tothat equation, the income level corresponding to aconsumption level of 2,310 yuan per capita per annum is3,310 yuan. The first two methods confirmed the resultsregression analysis returning income equivalents between3,246 and 3,379 yuan. Given the strength of the functionalrelationship between income and consumption levels, theresult derived by regression analysis is preferred.

88 Poverty Profile of the People’s Republic of China
According to this analysis, an urban person needing tocommand the consumption package equivalent of thebenefits line would, in 1998, have needed to earn 43%more than the cash value of the benefits line. While thisfigure seems high, it is in line with the national saving rateof 37%. Analysis of the survey data provided by poorhouseholds shows that about half of the savings is usedto pay debts and the other half is for family members tomeet the costs of medical treatment, education fees,wedding arrangements, etc. This income-based povertyline was 61% of the national average urban income of5,458 yuan per capita per annum in the same year (1998).
Extrapolating from the NBS urban survey sample, theanalysis concluded that total urban poor not being able toachieve annual consumption expenditure of 2,310 yuan in1998 was 37 million.
TRENDS IN THE INCIDENCE OFURBAN POVERTYPrior to the 1990s urban poverty was confined to a smallproportion of urban residents who were suffering fromone of more of the three “nos”: no ability to work; nosavings or other income source; and no relatives todepend on. Since the early 1990s, and particularly sincethe mid-1990s, urban poverty has been driven by lay-offsfrom SOEs combined with the dismantling of the welfaresystems formerly provided by SOEs. The influx offloating populations from rural areas who not only liveunder sub-standard conditions, but also displace olderunskilled permanent urban residents from jobopportunities, also impacted the incidence of urbanpoverty.
Irrespective of whatever urban poverty line is applied,there are many difficulties in determining the number ofurban residents living under that line. The problem ofseparating urban residency from the practice ofclassifying all citizens as either urban or rural has alreadybeen mentioned. Ascertaining incomes in the largelyunreported gray, cash-only economy of the cities isvirtually impossible. Allowing for the “floating” migrantsrequires assumptions and guestimates. Because of thesefactors there are differences in professional analysis andopinion as to whether in the 1990s urban poverty hadeither been declining, stable or increasing.
Source: Khan, A.R., and C. Riskin. 2001. op cit.
Khan and Riskin compare their three measures of urbanpoverty (broad, deep and extreme) in the year of 1995with that of 1988. They work off NBS data but theyadjust such data to account for what in their view is amore realistic measure of the change in the consumerprice index. The results of their comparisons are shownin Figure 28. They found an increase between the twoobservation years of 19.4% for broad poverty, 86.4% fordeep poverty and 145.5% for deep poverty. Khan andRiskin believe their figures understate the real increase inurban poverty because their survey samples ignored thefloating population. What is particularly disturbing abouttheir results is that the more austere the definition ofurban poverty, the greater the increase in poverty.
Contrary to the findings of Khan and Riskin, estimates ofurban poverty based on official data between the late1980s and the mid-1990s generally show a significantreduction. However, this is not always the case. Two PRCresearchers, Ren Caifang and Chen Xiaojie, conducted astudy of urban poverty over the years 1991 to 1995. Theyconcluded that there was no clear trend of increase ordecrease in urban poverty.69
NBS has developed a time series for the incidence ofurban poverty and the urban poor headcount for eachyear from 1991 to 2000 (see Table 39). The figuresentered for 1991 through to 1995 are those derived byRen Caifang and Chen Xiaojie. In the longer time context,
69 Ren, Caifang, and Xiaojie Chen. 1966. Size, Situation and Trend ofPoverty in Urban China. Research Reference, No.65. Beijing.
Figure 28: 1988 and 1995 Urban Poverty Rates
0
1
2
3
4
5
6
7
8
9
Broad Poverty Deep Poverty Extreme Poverty
Hea
dco
un
t in
dex
(%)
1988 based on adjusted CPI 1995

Understanding Urban Poverty 89
Table 37: Urban Poverty Trend as Compiled by NBS
The difference between the two poverty lines consists in prices used to cost basic necessities.
Source: As recorded in Hussain, A. 2001. Poverty Profile and Social Security inChina. Draft Report. London: London School of Economics, and updated byNBS in 2002.
NBS figures for 1991 to 1994 are directionless. There isthen a drop to a slightly lower plateau where povertyincidence levels remain stable for four years until 1999when there is another drop to a slightly lower plateau.However, 2000 over 1999 does represent a modestincrease in urban poverty levels measured by the NBSdiagnostic line.
Athar Hussain has compared changes in the incidence ofurban poverty between 1995 and 1998. His estimates,when treating the consumption-based provincial generalpoverty lines as measures of per capita income rather thanexpenditure, are shown in Table 38. Contrary to the NBStime series, he found that between 1995 and 1998 therehas been a considerable reduction in the incidence inurban poverty when viewed as a national aggregate.Professor Hussain estimated that the incidence of urbanpoverty fell from 6.25 to 4.73 %.
Table 38 ranks the provinces from the highest reductionsin the incidence of urban poverty between 1995 and 1998to the lowest. Of the 30 provinces or province-levelmunicipalities listed in the Table (Tibet is not included),15 witnessed urban poverty reductions, 2 saw no changeand 13 experienced increases. The aggregate trend masksa sharp divergence in the direction of urban povertyincidence changes among the provinces.
When the figures in Table 38 are separated into the PRC’sthree major regions, as shown in Figure 29, it is clear thatbetween 1995 and 1998 there have been declines in theurban poverty incidence in both the eastern and centralregions. In the western region, however, the elapse offour years has seen a marginal increase in urban povertyincidence. Figure 29 also demonstrates that over 1995-1998 the ranking of regions in terms of urban poverty
incidence changed. In 1995, urban poverty was mostintense in the central region, followed by the western andeastern regions. By 1998, the western region had narrowlyovertaken the central region as having the highest urbanpoverty incidence. Focusing on absolute values between1995 and 1998, however, the poverty incidence remained
Table 38: Urban Poverty Rates
Source: Hussain A. op cit.
Year Poverty Line PovertyRate %
Urban PoorHeadcount
(Million)Line 1 Line 2
1991 752 5 .8 14.21992 837 4 .5 11.31993 993 5 .1 13.31994 1 ,300 5 .7 15.31995 1 ,547 4.4 12.41996 1 ,671 1 ,850 4 .2 11.81997 1 ,890 4 .1 11.71998 1 ,880 4 .1 11.91999 1 ,860 3 .1 10.02000 1 ,875 3.4 10.5
Location 1995 PovertyRate, %
(1)
1998 PovertyRate, %
(2)
1998Rate/1995
Rate(2/1)
Beijing 5.2 0.7 0.1
Guangdong 3.3 0.7 0.2Jiangsu 3.8 1.2 0.3
Jilin 18.3 7.5 0.4Heilongjiang 17.9 6.9 0.4
Jiangxi 8.5 3.4 0.4
Hebei 10.0 5.2 0.5Guizhou 10.2 5. 0.5
Shanxi 12.0 7.2 0.6Hainan 12.3 7.9 0.6
Shandong 7.3 5.1 0.7
Sichuan 5.6 4.7 0.8Tianjin 7.9 6.8 0.9
Henan 9.4 8.4 0.9
Yunnan 4.0 3.7 0.9Liaoning 6.4 6.1 1.0
Hunan 3.6 3.6 1.0Guangxi 2.8 3.0 1.1
Gansu 6.0 6.4 1.1
Xinjiang 5.8 6.2 1.1Anhui 2.1 2.9 1.4
Shaanxi 8.4 12.0 1.4Shanghai 2.1 3.2 1.5
Zhejiang 1.0 1.6 1.7
Fujian 1.3 2.2 1.7Hubei 3.3 5.7 1.7
Chongqing 2.2 4.1 1.9Ningxia 7.2 13.5 1.9
Inner Mongolia 1.7 6.4 3.8
Qinghai 0.7 5.6 8.5All PRC 6.56 4.73 0.7

90 Poverty Profile of the People’s Republic of China
significantly higher in both the western and central regionsthan for the eastern region.
Source: Khan, A.R., and C. Riskin. 2001. op cit.
Whichever of the many trend estimates best matches thetruth, all such estimates confirm that there has beengreater progress in addressing rural poverty than inaddressing urban poverty. The NBS time seriesdemonstrates this. In Figure 30, both the rural and urbanpoverty numbers have been determined by applying theofficial and diagnostic consumption-based lines as if theywere measures of per capita income rather thanexpenditure.
Source: NBS data.
NUMBERS AND LOCATION OF THEURBAN POOR
The different approaches to interpreting a diagnosticurban poverty line result in different estimations of thenumber of those suffering urban poverty in any particularyear. In recent official statements, the government isabbreviating its references to those receiving MLSS as theurban poor. Given that 21 million urban residentsreceived MLSS assistance in the first half of 2003 andgiven that not all those entitled to assistance have yet beencovered by the Scheme, it is probable that one of theofficial measures of urban poverty puts the number ofurban poor in excess of 21 million. This number, like theMLSS itself, would exclude migrant workers and theirdependents living in urban areas.
Table 39 also provides an indicative measure of thedistribution of urban poverty among regions and amongprovinces. The provinces are grouped into the eastern,central and western regions. Within each region, theprovinces are ranked according to their estimatedincidence of urban poverty on the basis of theexpenditure approach. What is clear is that the regionalpatterns of urban and rural poverty are distinctlydifferent. Figure 31 illustrates this by comparing the 1998urban poverty distribution with the 1999 rural povertydistribution, in this case by measuring the poverty linesagainst per capita income rather than consumption. TheWestern region has nearly half of the rural poor, andhence reducing poverty is one of the main rationalesbehind the Western Development Strategy. The relativeshares of urban and rural poor to be found in the centralregion are not significantly different - 45%, compared to38% respectively. In the eastern region, however, the shareof total urban poor is double that for the rural poor. Thisis the result of the high concentration of the urbanpopulation in the eastern provinces (51% of the total) andthe high levels of economic development therein thathave provided market opportunities through which ruralpoverty has been reduced. This difference in regionaldistribution means that the sharper geographic focus onthe West that will be applied to rural poverty reductionwork between 2001 and 2005 should not also become acenter-piece strategy for attacking urban poverty.
Figure 29: Regional Variation in Urban PovertyReduction
0
1
2
3
4
5
6
7
8
9
10
Eastern Central Western
% P
ove
rty
Inci
den
ce
1995 Poverty Rate 1998 Poverty Rate
Figure 30: Urban and Rural Poverty ReductionTrends
0.0
10.0
20.0
30.0
40.0
50.0
60.0
70.0
80.0
90.0
1991
*199
2199
3*199
419
9519
96*
1997
1998
1999
2000
Mill
ion
Per
sons
No. of Rural Poor (mill) No. of Urban Poor (mill)

Understanding Urban Poverty 91
H e a d c o u n t o f t h e P o o r % R a t i o ( 2 ) / ( 1 ) P o v e r t y R a t eI n c o m e - b a s e d
i n t e r p r e t a t i o n o fP o v e r t y l i n e
( 1 )
E x p e n d i t u r e - b a s e di n t e r p r e t a t i o n o f
P o v e r t y l i n e( 2 )
I n c o m e - b a s e di n t e r p r e t a t i o n o f
P o v e r t y l i n e
E x p e n d i t u r e - b a s e di n t e r p r e t a t i o n o f
P o v e r t y l i n e
E a s t e r n R e g i o n 4 , 5 4 7 , 0 0 0 xx 1 3 , 7 9 9 , 0 0 0 xx 3 0 3
G u a n g d o n g 1 5 4 , 0 0 0 xx 2 4 4 , 0 0 0 xx 1 5 7 0 . 6 8 xx 1 . 0 7 x x
F u j i a n 1 4 5 , 0 0 0 xx 3 1 9 , 0 0 0 xx 2 1 9 2 . 1 8 xx 4 . 7 8 x x
Z h e j i a n g 1 5 3 , 0 0 0 xx 4 6 3 , 0 0 0 xx 3 0 2 1 . 6 2 xx 4 . 8 9 x x
B e i j i n g 5 4 , 0 0 0 xx 4 2 2 , 0 0 0 xx 7 7 3 0 . 7 3 xx 5 . 6 4 x x
S h a n g h a i 3 1 4 , 0 0 0 xx 5 8 4 , 0 0 0 xx 1 8 6 3 . 2 4 xx 6 . 0 2 x x
J i a n g s u 2 4 4 , 0 0 0 xx 1 , 2 9 8 , 0 0 0 xx 5 3 3 1 . 2 0 xx 6 . 4 0 x x
L i a o n i n g 1 , 1 5 0 , 0 0 0 xx 2 , 3 8 3 , 0 0 0 xx 2 0 7 6 . 1 3 xx 1 2 . 7 0 x x
H e b e i 6 5 1 , 0 0 0 xx 2 , 0 1 0 , 0 0 0 xx 3 0 8 5 . 2 0 xx 1 6 . 0 4 x x
T i a n j i n 3 6 0 , 0 0 0 xx 9 6 9 , 0 0 0 xx 2 6 9 6 . 7 7 xx 1 8 . 2 3 x x
S h a n d o n g 1 , 1 7 2 , 0 0 0 xx 4 , 6 8 9 , 0 0 0 xx 4 0 0 5 . 0 5 xx 2 0 . 1 9 x x
H a i n a n 1 5 0 , 0 0 0 xx 4 1 8 , 0 0 0 xx 2 7 8 7 . 9 4 xx 2 2 . 0 9 x x
C e n t r a l R e g i o n 6 , 5 7 7 , 0 0 0 xx 1 5 , 9 6 1 , 0 0 0 xx 2 4 3
A n h u i 3 4 8 , 0 0 0 xx 1 , 0 6 0 , 0 0 0 xx 3 0 4 2 . 8 9 xx 8 . 8 0 x x
H u n a n 4 6 2 , 0 0 0 xx 1 , 3 3 6 , 0 0 0 xx 2 8 9 3 . 6 1 xx 1 0 . 4 4 x x
H u b e i 9 3 4 , 0 0 0 xx 1 , 7 6 3 , 0 0 0 xx 1 8 9 5 . 6 7 xx 1 0 . 7 1 x x
J i l in 8 5 3 , 0 0 0 xx 1 , 2 9 5 , 0 0 0 xx 1 5 2 7 . 5 4 xx 1 1 . 4 4 x x
J i a n g x i 3 1 0 , 0 0 0 xx 1 , 2 6 1 , 0 0 0 xx 4 0 7 3 . 4 2 xx 1 3 . 9 2 x x
H e i l o n g j i a n g 1 , 1 5 4 , 0 0 0 xx 2 , 7 4 3 , 0 0 0 xx 2 3 8 6 . 9 2 xx 1 6 . 4 6 x x
H e n a n 1 , 4 1 0 , 0 0 0 xx 3 , 0 8 8 , 0 0 0 xx 2 1 9 8 . 3 9 xx 1 8 . 3 8 x x
S h a n x i 5 9 6 , 0 0 0 xx 1 , 6 3 7 , 0 0 0 xx 2 7 5 7 . 1 7 xx 1 9 . 6 9 x x
W e s t e r n R e g i o n 3 , 6 4 6 , 0 0 0 xx 7 , 3 1 2 , 0 0 0 xx 1 3 7
S i c h u a n 7 1 1 , 0 0 0 xx 1 , 1 0 2 , 0 0 0 xx 1 5 5 4 . 7 2 xx 7 . 3 1 x x
C h o n g q i n g 2 6 0 , 0 0 0 xx 5 4 8 , 0 0 0 xx 2 1 1 4 . 0 9 xx 8 . 6 2 x x
Y u n n a n 2 2 5 , 0 0 0 xx 5 9 5 , 0 0 0 xx 2 6 4 3 . 6 9 xx 9 . 7 3 x x
Q i n g h a i 7 6 , 0 0 0 xx 1 3 1 , 0 0 0 xx 1 7 3 5 . 6 3 xx 9 . 7 6 x x
I n n e r M o n g o l i a 5 1 0 , 0 0 0 xx 1 , 7 7 8 , 0 0 0 xx 3 4 8 6 . 4 0 xx 2 2 . 3 0 x x
X i n j i a n g 3 8 3 , 0 0 0 xx 6 2 5 , 0 0 0 xx 1 6 3 6 . 1 6 xx 1 0 . 0 6 x x
G u i z h o u 2 6 0 , 0 0 0 xx 8 6 4 , 0 0 0 xx 3 3 3 5 . 0 0 xx 1 6 . 6 5 x x
G a n s u 3 0 4 , 0 0 0 xx 7 9 2 , 0 0 0 xx 2 6 0 6 . 4 4 xx 1 6 . 7 7 x x
T i b e t 3 9 , 0 0 0 xx 6 5 , 0 0 0 xx 1 6 8 1 1 . 3 1 xx 1 9 . 0 5 x x
S h a a n x i 9 3 2 , 0 0 0 xx 1 , 5 6 7 , 0 0 0 xx 1 6 8 1 1 . 9 5 xx 2 0 . 0 8 x x
N i n g x i a 2 1 0 , 0 0 0 xx 4 0 3 , 0 0 0 xx 1 9 2 1 3 . 5 1 xx 2 5 . 9 1 x x
G u a n g x i 2 4 6 , 0 0 0 xx 6 2 0 , 0 0 0 xx 2 5 2 3 . 0 1 xx 7 . 5 9 x x
W h o l e P R C 1 4 , 7 7 0 , 0 0 0 xx 3 7 , 0 7 2 , 0 0 0 xx 2 5 1 4 . 7 3 xx 1 1 . 8 7 x x
Table 39: Urban Poverty Patterns, 1998, as per analysis of Professor A. Hussain and Others
Source: ADB. 2001. Urban Poverty in PRC. Manila. In the original, Guangxi is considered an Eastern Province.Note: Here the Western Region refers to the Western 12 provinces. The Government’s Western Development Strategy, however, covers 10 provinces in the West plusthree autonomous prefectures.

92 Poverty Profile of the People’s Republic of China
Aggregation into regions tends to hide the variations in theincidence of poverty within regions. Table 39 providesseveral distributional observations. Each region has fouror five provinces that have high incidences of urban poverty(over 15% applying the GPL as a measure of consumption).However, the Eastern region has a high proportion ofprovinces with low urban poverty incidences.
A small upward shift in the measure of urban poverty makesan enormous difference to the number of people coveredby the definition. This is a function of the pattern ofincome distribution. To demonstrate this high sensitivityof poverty numbers to slight increases in the poverty line,six incremental levels are modeled in Table 40 which is takenfrom the ADB urban poverty study. A 50% increase in theurban poverty line (expenditure-based) resulted in a 424%increase in the number of urban poor. The samephenomenon was observed earlier for rural poverty.
THE FLOATING MIGRANT POPULATIONAND POVERTY
The data that agencies, donors and researchers have usedto estimate the extent of urban poverty have notincluded poor urban migrants. Migrants aredisadvantaged in urban labor markets. They are restrictedto jobs that permanent residents do not want and mayreceive lower pay for the same job. New employmentopportunities tend to flow to permanent residents,particularly those laid off and seeking re-employment,over the floating population. Migrants do not receivecertain urban welfare services because they do not hold acity residence permit. Despite these many restrictions,many migrants find adequate remuneration in the citiesand repatriate sums to their rural households which mayoften provide the bridge out of poverty for their farm-based family. The challenge is to establish empiricallyhow well or poorly the urban migrants are doing. This isparticularly so as people with permanent residency statusin cities may tend to stereotype migrants as the bed-rollcarrying peasant with coarse hands and a sun-burnt redface who has floated into the city to undertake dustyconstruction work.
Data collected in 1999 by NBS in a one-off surveyprovided a basis for analyzing urban migrant poverty.The data set had a number of problems in theconsistency with which data were gathered and the typesof questions asked. The data set covers 140,600households living in urban areas in all 31 provinces. Fiveper cent of this sample was migrant households who hadbeen resident in their new urban environment for at least6 months. The ADB Study of Urban Poverty was able toprocess this data to establish an indication of relativepoverty rates between permanent and floating residentsof specific urban centers. The word “indication” is usedbecause of problems with the data. The indicative resultis presented in Table 41.
The cities listed in Table 41 are ranked according to theratio of their migrant poverty rate to their local residentpoverty rate in descending order. Table 41 indicates thatthe floating population suffers from higher incidences ofpoverty than locals in twice as many cities as where thereverse is the case (19 versus 10 cities). The ratio in onethird of the cities is extremely harsh for migrants, withpoverty rates double to quadruple that of the respectivelocal residents. On average in 1999, the poverty rateamong urban migrants was 50% higher than amongpermanent urban residents.
Figure 31: Regional Distribution of Urban and Rural Poor
0%
5%
10%
15%
20%
25%
30%
35%
40%
45%
50%
Eastern provinces Central provinces Western provinces
% o
f U
rban
or
Ru
ral P
oo
r
Urban 1998 Rural 1999
Source: Khan, A.R., and C. Riskin. 2001. op cit.
Poverty Line as Multiple of theGeneral Poverty Line (GPL)
Poverty Rate -Whole PRC
0.75 * GPL 1.890.85 * GPL 3.39
GPL 4.731.15 * GPL 8.171.25 * GPL 11.071.35 * GPL 14.401.50 * GPL 20.08
Table 40: Sensitivity of the Urban Poverty Rate
Note: Poverty rates are measured by applying an income-based interpretation of the GPLSource: ADB. 2001. Urban Poverty in PRC. Manila.

Understanding Urban Poverty 93
According to MCA, the total number of urban migrantsin 1999 was 40.4 million. This includes all types of
migrants: rural-rural, urban-urban and rural-urban. Partof the urban-urban migration and virtually all of therural-urban migration generates temporary settlers inurban areas without the requisite residence permits. Ifthese migrants account for half of the 40.4 million, thenon the basis of Table 41, three million floating migrantswould have to be added to the year’s total for the urbanpoor.
Looking to the future, the PRC leadership recognizes thatthe “hukou” or residence permit system creates a dualisticdivide of privilege between the permanent urbanites andthe rest of the population which is contrary to thecountry’s macroeconomic needs to (i) pursue urbanizationand (ii) improve the efficient deployment of labor in amore open and competitive world market – especiallysince the PRC’s accession to the WTO in December 2001.Reform of the “hukou” system is clearly on theGovernment’s agenda. In 2001, the State Council easedresidency requirements in more than 20,000 small andmedium-sized cities as part of a plan to absorb 40 millionsurplus rural laborers. The then Premier Zhu Rongji in anaddress to the National People’s Congress in February2002, said, “Urbanization should proceed in a positive andsound manner and the rural workforce should beencouraged to shift to non-agricultural industries”. InApril 2002, Beijing became the first large city to open itspublic schools to the children of migrants. From theacademic year that started in September 2002, Beijingpublic schools must accept these children, and at reducedschool fees. For secondary school they will be charged 500yuan compared to the standard for Beijing residentchildren of 1,000 yuan. Migrant children at primaryschools will pay 200 yuan instead of 500 yuan. To qualifyfor admission to Beijing schools, the migrant family has tohave lived in the city for at least six months and hold atemporary residence permit.
Shanghai has initiated its own reform of the “hukou”system from a totally different perspective. In order toattract more talent into the city Shanghai has begunissuing full-privilege residence cards with six month tofive year validity to skilled people whose normal residenceis elsewhere. Shanghai issued the first such residence cardsin June 2002. Although this reform was not aimed atlowering the institutional barriers that confront poormigrants in Shanghai, the principle being followed maylater accelerate reform that is pro-poor migrants. Thatprinciple is that access to city privileges need not be tiedto a person’s place of permanent residence.
Unquestionably, as the “hukou” system barriers arelowered, there will be a greater flow of rural people to thelarge cities. While many of these cities are economicpowerhouses generating a mass of new jobs annually,
Source: ADB. 2001. Urban Poverty in PRC. Manila.
Table 41: Comparative Urban Poverty Rates - Migrants andLocals 1999
City AssumedPoverty
Line
Poverty rates
Locals (2) Migrants(3)
(3/2)
Shenzhen 6,227 0xxxx 16.9xxxxUrumqi 3,026 14.2xxxx 54.0xxxx 3.8Jinan 3,017 11.0xxxx 39.3xxxx 3.6
Tianjin 2,912 3.5xxxx 11.9xxxx 3.4Shanghai 3,652 5.8xxxx 18.3xxxx 3.1Nanjing 2,972 9.5xxxx 29.0xxxx 3.1
Shijiazhuang 2,706 5.1xxxx 13.3xxxx 2.6Wuhan 2,428 6.3xxxx 15.1xxxx 2.4
Beijing 3,118 4.6xxxx 10.3xxxx 2.3Yinchuan 2,547 11.4xxxx 22.7xxxx 2.0Zhengzhou 2,504 11.2xxxx 20.5xxxx 1.8
Guangzhou 4,221 9.2xxxx 15.0xxxx 1.6Ningbo 2,940 3.7xxxx 5.7xxxx 1.5Nanchang 1,747 12.8xxxx 19.0xxxx 1.5
Lanzhou 1,676 8.6xxxx 12.5xxxx 1.5Taiyuan 1,894 14.9xxxx 17.4xxxx 1.2
Huhot 2,144 23.0xxxx 28.7xxxx 1.2Harbin 1,899 7.1xxxx 7.6xxxx 1.1Hangzhou 3,414 7.1xxxx 7.8xxxx 1.1
Dalian 2,901 14.1xxxx 14.3xxxx 1.0Changchun 2,048 8.3xxxx 8.1xxxx 1.0Hefei 2,283 12.2xxxx 10.9xxxx 0.9
Shenyang 2,118 22.9xxxx 15.0xxxx 0.7Fuzhou 2,161 3.8xxxx 2.7xxxx 0.7Qingdao 3,209 16.8xxxx 12.1xxxx 0.7
Xian 2,644 27.5xxxx 17.9xxxx 0.7Changsha 2,488 8.4xxxx 5.0xxxx 0.6
Chengdu 2,742 17.2xxxx 10.7xxxx 0.6Chongqing 2,612 16.9xxxx 9.4xxxx 0.6Xining 1,668 16.2xxxx 9.8xxxx 0.6
Xiamen 3,543 8.2xxxx 2.0xxxx 0.2All Cities 10.3xxxx 15.2xxxx 1.5

94 Poverty Profile of the People’s Republic of China
there is likely to be a period of painful transition whereurban poverty grows because of the accelerated inflow ofhitherto farming households before sufficient jobs aregenerated to gainfully employ the traditional incomeearners in those households.
TYPES OF URBAN POORThe most common category of urban poor is where asignificant share of the population of an urban center isdisplaced from their employment by closure ordownsizing of state owned enterprises (SOEs), andopportunities for alternative income earning activities arelimited. A severe version of the typology occurs in singlecompany (SOE) or industry towns where that company orindustry has collapsed. In downsizing, SOEs have tendedto make female employees redundant in the first instance.Female single-headed households whose female membersexperience redundancy make up another category of thepoor.
The childless elderly are another category of urban poor.Even though urban retirees with official urban residencystatus receive pensions, their continued adequatesubsistence is in part dependent on family support and inpart dependent on their former public sector or collectiveemployer being able to contribute its share of the pensionpayments. Where the pensioner has no children, andespecially if s/he cannot obtain her/his full pensionpayment, they can easily slip into poverty in their goldenyears.
A further category of the poor is to be found among thefloating population who do not have urban residencestatus. Where these migrants are subject to long periodsof unemployment or are paid very low wages, they maybecome poor under both expenditure-based and income-based definitions. Taking a broader multi-dimensionalview of poverty, which includes social and livingconditions, many of these migrants would be consideredpoor.
PROFILES OF URBAN POVERTYTianjin SurveySurvey work done in Tianjin provides an example of theurban poor and non-poor profiles. Compared to the non-poor, the urban poor: (i) are 65% less likely to be educatedbeyond primary school; (ii) own fewer productive,financial and housing assets; (iii) are twice as likely to beunskilled workers; (iv) are more likely to have cash wagesas the major part of their total income; and (v) are lesslikely to have access to credit.
Beijing SurveyA recent ADB-financed study analyzing urban poverty inBeijing found by means of participatory appraisal with smallgroups of people that the capital city’s poor permanentresidents were mostly one of the following: laid-off(xiagang); unemployed (shiye); jobless (wuye); members ofhouseholds in which the female spouse did not hold aBeijing residence permit; unhealthy; aged; disabled: orreleased prisoners.70 The main characteristics of these urbanpoor were that they were: poorly educated; unhealthy; aged;at a point where they had already devoted most of theirlives to work; bereft of social capital (important here wasthe lack of a network of relationships that could be drawnon to avoid or escape from poverty); and/or living in urbanlocalities that are poor and distant from the bustlingcommercial centers of the city.
The migrant group is a separate category, and, becausemigrants do not hold Beijing residence permits they arenot entitled to the city’s social safety nets for the poor.The male migrants covered in the study were in, orseeking, manual labor occupations such as retail coalhaulers and sellers, brick laborers, retail sand sellers,construction workers, garbage collectors, or cleaners.They were poorly educated, with no special skills and noaccumulated cash for small investments (meaning to startone’s own small business). When working, the migrantpoor received low incomes and had no security ofcontinued employment and therefore no security ofincome. They generally lived in slum conditions and often
70 Zhou, Xuejun. 2000. Voice of the Poor. Report on ParticipatoryUrban Poverty Analysis in Beijing. Beijing: ADB.
Source: Derived from Year 1998 Urban Household Survey
Figure 32: Education Levels of Poor and Non-Poor
0%
10%
20%
30%
40%
50%
60%
70%
80%
90%
100%
At leastOther
At leastPrimaryschool
At leastJunior high
school
At leastSenior high
school
At leastSpecial ortechnicalschool
At leastCollege
At leastUniversity
Non-Poor Poor

Understanding Urban Poverty 95
had to “live off” their migrant friends until they securedanother unskilled labor assignment. The female migrantswere similarly poorly educated, without special skills andlack money for even a small investment. Migrant womenwere also living in slum conditions and could only affordsimple food. Of those poor women surveyed, most wereworking as garbage collectors or were jobless.Proxy Profile of Urban Residents withConsumption below the Average MLSS LineWhile a profile of urban residents who could not achieve2,365 yuan consumption is not apparently available, onecapturing those who could not reach a consumption levelof 2,310 yuan (in 1998 prices) is. These cut off levels areso close that one can serve as a proxy for the other.The Urban Study Organization of NBS have analyzedtheir 1998 urban household survey data to compile adetailed profile of those registered urban residents belowand those above a benchmark of 2,310 yuan per-capitaexpenditure per annum.71 In the following description,those below the consumption line are referred to as theurban poor, and those above as the non-poor. Thecomparisons show that:
• numerically, most of the urban poor are in the easternregion (43.4%), but the central region has the highestincidence of urban poverty (14.3%);
• dependency ratios in urban poor households are 17%higher than for the non-poor
• proportionately more urban women suffer frompoverty compared to men (12.1% for females, 11.7%for males);
• the poverty incidence among urban children (0-14years old) is higher than for older age groups;
• the highest education levels attained by the urbanpoor are considerably below that of the urban non-poor (see Figure 32);
• in terms of industry backgrounds the greatestdifferences between the urban non-poor and poor arefound in service for the Government, the Party,official social organizations, and for health, cultural,educational and scientific agencies (the proportion ofnon-poor with these backgrounds is generally doubleor more that of the poor);
• the proportion of the urban poor waiting foremployment or disabled is around three times morethan for the non-poor;
• compared to the non-poor, proportionately more ofthe poor are engaged in peripheral and somewhattenuous occupations such as baby-sitting anddomestic service;
• regarding occupations, more of the urban poor workas general laborers and less as white collar staffmembers than the non-poor;
• the average disposable income of the urban non-pooris 2.3 times higher than the poor;
• the average living expenditures of the urban non-poor are 2.9 times higher than the poor;
• the propensity to consume of the non-poor is 0.82 ofdisposable income compared with 0.64 for the poor;and
• expenditure on food as a proportion of total livingexpenditures is much higher for the urban poor (at57%) than for the urban non-poor (at 44%).
The complete profile details of those below (the urbanpoor) and above (the urban non-poor) the 2,310 yuan percapita annual consumption expenditure, as captured bythe supplementary analysis of NBS’s 1998 urbanhousehold survey are reported in Appendix 2.
71 Wang, Youjun. 2002. Analysis of PRC’s Urban Policy. Backgroundpaper prepared for the ADB. Beijing.


The Fight Against Urban Poverty 97
THE FIGHT AGAINST URBAN POVERTY
MACROECONOMIC BACKGROUND
STRUCTURAL UNEMPLOYMENT AS A CAUSE OF URBAN POVERTYWith a 7 to 8% economic growth rate, PRC is generating about 10 million new jobs every year. However structural unemployment is emergingin the formal sector. Because of the mass layoffs associated with SOE reform, and the baby boom of the mid 1970s before the one-child policywas introduced, a record 30 million people were looking for work in 1999. About one third of them were new entrants in the job market. Manyothers were older, retrenched workers who may find it difficult to find new employment. There are an estimated 30-50 million more surplusworkers in urban areas.72
Registered unemployment in the urban areas is lowalthough it has been rising since 1985 from 1.8% to 3.6%(representing 6.81 million persons) at the end of 2001.73
The lack of reliable data on unemployment, coupled withthe State enterprise reforms of the late 1990s, makes itdifficult to assess the true extent of unemployment.Within urban areas, the official estimate covers only thepeople registered with the Ministry of Labor and SocialSecurity (MLSS). Laid-off workers who do not find jobsare excluded from the unemployed statistics.74 MLSS hasstated that it estimates the number of unemployed laid-off workers from SOEs to be 5.15 million at the end of2001. Government reform and downsizing also increasedurban unemployment. In 1998, about 40% of the nationalgovernment employees were retrenched. Thecontinuation of administrative reforms by downsizinglower levels of government from 1999 onwards hascontributed to increasing unemployment.
The further integration of the PRC into the globaleconomy has resulted in increased competition andpressures on SOEs to become commercial, efficientorganizations. Some traditional industrial sectors, such astextiles and traditional manufacturing, have had to reduceproduction and/or develop new products (see Box 7). AllSOEs need to reduce the number of redundant workersto face the test of the market and compete successfullyboth domestically and internationally.Clearly some cities are suffering much higher levelsof unemployment and lay-offs than others. A samplesurvey of unemployment in four cities, conducted jointlyby the Development Research Center of the State Counciland the UNDP in 1997, put the unemployment rate atabout 12% in these cities. Estimates of urbanunemployment by other sources are higher at 17 to 18%of the urban labor force. Cities with old industrial bases,such as those developed in the late 1960s with the
“Third Front Industrialization” program face severerestructuring problems. These cities are prevalent in thenortheastern part of the country. The number of laid offworkers in these cities can be very high. Because of thedomination of the State sector and the relatively underdeveloped non-state sector in such cities, there is littlescope for re-employment in the short term.Box 7: Globalization and Increasing Unemployment in theTextile Industry
Between January to October 1998 the textile industry destroyed 4.8million spindles and laid off 450,000 workers, cutting losses by 1.38billion yuan. The target for 1999 was to destroy another 5.2 millionspindles, lay off 750,000 workers, and cut losses in the textile industryby 4.62 billion yuan. Coal production was cut by 18% in 1998. Thetotal number workers laid off from SOEs was estimated at 7.14 millionpeople.
Major labor market trends covering all of theeconomically active population and movements in urbanunemployment levels are summarized in Table 42. Trendsin urban employment by ownership category of theemploying enterprise are shown in Table 43.
The obvious antidote to urban poverty caused byunemployment is to generate more employment. Table 42and Table 43 both have clear messages as to how to dothis. Table 42 shows that over the seven years 1995-2001employment in the services sector has grown relative toother sectors, while that in the agricultural sector hasdeclined proportionately. Meanwhile, the industrialsector’s share of total employment has remained relativelyconstant. Given continuing high levels of GDP growthand increased diversification of consumer needs, theservice sector is likely to offer greater opportunities foremployment growth than other sectors. Table 43 showsthat enterprises totally or partly privately owned aresignificantly increasing their share of urban employment,
72 The Economist. 1998. No. job, no house, no welfare. 30 May.73 China Daily. 2002. Creating new jobs remains a challenge. 7
February.74 The Government indicated that from early 2001 onwards it would
plan to reform the statistical classification of the unemployed.

98 Poverty Profile of the People’s Republic of China
1995 1996 1997 1998 1999 2000 2001Population (million)xxxxRural (million)xxxxUrban (million)
1,211.2859.5351.7
1,223.9864.4359.5
1,236.3866.4369.9
1,248.1868.7379.4
1,259.1870.2388.9
1,265.8807.4458.4
1,276.-3
795.6480.6
Economically active population (million)Total employed (million)xxxxby sector (percent)xxxxxxxxAgriculturexxxxxxxxIndustryxxxxxxxxServicesxxxxby area (percent)xxxxxxxxRural (percent)xxxxxxxxUrban (percent)xxxxxxxxUrban (million)
687.4679.5
52.223.024.8
71.928.1
190.9
696.7688.5
50.523.526.0
71.228.8
198.2
705.8696.0
49.923.726.4
71.029.0
202.1
714.1699.6
49.823.526.7
70.429.6
206.8
719.8705.9
50.123.026.9
70.229.8
210.1
N/A711.5
50.022.527.5
70.129.9
212.7
744.3730.3
50.022.327.7
72.327.7
202.3Urban unemployment (million)xxxxRegistered as unemployedxxxxxxxxUnemployment Rate (percent)xxxxLaid off (xiagang) workers (million)xxxxxxxxLaid off workers remaining unemployed (percent)xxxxxxxxLaid off workers remaining unemployed (million)xxxxxxxxLaid off workers as % of total urban employmentxxxxAdjusted unemployment rate (percent)
5.22.9
5.53.0
5.73.19.940
4.02.08.5
5.73.39.050
5.62.78.5
5.83.19.460
6.43.08.2
6.03.18.6
N/AN/AN/AN/A
6.813.67.1
N/AN/AN/AN/A
Rural underemployment (estimated, million) 100 N/A N/A
1994 1995 1996 1997 1998 1999 2000 2001Urban Employed Persons (million) 184.13x 190.93x 198.15x 202.07x 216.16x 224.12x 231.51x 239.4xIn the State Sector (million)% of Urban Employed Persons
112.14x60.9%x
112.61x59.0%x
112.44x56.7%x
110.44x54.7%x
90.58x41.9%x
85.72x38.2%x
81.02x35.0%x
76.4x31.9%x
In Collective Units (million)% of Urban Employed Persons
32.85x17.8%x
31.47x16.5%x
30.16x15.2%x
28.83x14.3%x
20.99x9.7%x
18.56x8.3%x
16.54x7.1%x
14.44x6.0%x
In Mixed Public/Private Enterprises (million)% of Urban Employed Persons
3.44x1.9%x
3.70x1.9%x
4.12x2.1%x
5.11x2.5%x
9.42x4.4%x
10.69x4.8%x
11.86x5.1%x
13.69x5.7%x
PRC Domestic Private Enterprises (million)% of Urban Employed Persons
3.32x1.8%x
4.85x2.5%x
6.20x3.1%x
7.50x3.7%x
9.73x4.5%x
10.53x4.7%x
12.68x5.5%x
15.27x6.4%x
Foreign/Compatriot Invested Enterprises (mill)% of Urban Employed Persons
4.06x2.2%x
5.13x2.7%x
5.40x2.7%x
5.81x2.9%x
5.87x2.7%x
6.12x2.7%x
6.42x2.8%x
6.71x2.8%x
Self-employed Nationals (million)% of Urban Employed Persons
12.25x6.7%x
15.60x8.2%x
17.09x8.6%x
19.19x9.5%x
22.59x10.5%x
24.14x10.8%x
21.36x9.2%x
21.31x8.9%x
Total Categorized Urban Employed (million)Total (as % of urban Employed Persons)
168.06x91.3%x
173.36x90.8%x
175.41x88.5%x
176.88x87.5%x
159.18x73.6%x
155.76x69.5%x
149.88x64.7%x
147.82x61.7%x
Unaccounted for urban employed personsUnaccounted (percent)
16.07x8.7%x
17.57x9.2%x
22.74x11.5%x
25.19x12.5%x
56.98x26.4%x
68.36x30.5%x
81.63x35.3%x
91.58x38.3%x
Table 42: Labor Market Trends 1995-2001
Sources: NBS 2000, 2001 and 2002, and ADB staff estimates
Table 43: Distribution of Urban Employment by Ownership 1994-2001
Sources: NBS 1999, 2000, 2001, 2002 and ADB. 2001. PRC-Country Economic Report . Manila.Note: The total for urban employed persons is finalized with reference to sample survey data on population changes, whereas the total categorized urban employedis based on employment data collected by the State Administration of Industry and Commerce which registers all commercial entities. The totals are thus different.

The Fight Against Urban Poverty 99
while the share absorbed by state- and collectively-ownedenterprises is decreasing. The obvious conclusion fromthese trends is that enterprises involving privateinvestment will provide the engine for job-creation.
Analysis of the official urban labor statistics recorded inTable 43 is complicated by the difference between thetotals for: (i) urban employed finalized with reference tosample survey data on population changes; and (ii)persons employed in each reported ownership-category isbased on employment data collected by the StateAdministration of Industry and Commerce (SAIC) whichregisters all commercial entities. Firstly, NBS has queriedits own figures for total urban employed persons and in itsChina Statistical Yearbook 2002 revised upwards by 9 to 19million its previous urban employment numbers for theyears 1998 to 2000. Secondly, the absolute numbersrecorded by SAIC reflect a trend that is implausible. Itcannot be that urban employment has progressivelydropped from 168 to 148 million over the 1994-2001period. It may be that socio-economic dynamics promoteunder-reporting of urban employment, such as themotivation to reduce employer and employee socialsecurity contributions and avoid individual income tax.This under-reporting could occur in several of theownership categories. It may also be that the greyeconomy is extensive. Non-reporting in this case wouldmean considerable under-reporting of employment forthe self-employed nationals category. Thus deriving trendsin employment between the public and private sectors issomewhat tentative.
The disaggregration of employment trends into publicand private sectors is made doubly difficult because anumber of the reported ownership categories involve avarying mix of public and private capital. TheInternational Finance Corporation’s study (IFC) ofemerging private enterprises in the PRC wrestled with thedefinitional problem of distinguishing between the“official” and “true” private sectors.75 Bold assumptionshave to be made. Figure 33 has been derived on theseassumptions: (i) 50% of collective unit employment is for“red hat” (that is private) units – the IFC Study made thesame assumption; (ii) 40% of employment in enterprisesinvolving a mix of public and domestic capital throughvarious shareholding arrangements can be credited toprivate investment; and 60% of employment in foreign-or compatriot-invested enterprises (these are often jointventures) is attributable to private investment.“Compatriot-invested enterprises” are those in part orwhole financed by citizens or corporations from HongKong, Macao and Taiwan. Figure 32 demonstrates astrong upward trend in the share of employmentgenerated by private investment, and a correspondingdecline in the share resulting from public sectorinvestment. If most of the under-reported employment isin the grey economy, then the share attributable to theprivate sector is considerably higher.
Both the PRC Government and donors have recognizedthe efficacy in terms of urban poverty reduction offacilitating expansion of the private sector. The PRCConstitution was amended in 1999 to give formalrecognition to the role of the private sector. A lawregulating sole proprietorships became operational in2000. In mid-2001, the rules of the Chinese CommunistParty (CCP) were relaxed to allow private entrepreneurs tobecome members. The ADB, as an example of donorfocus in the fight against poverty, has been helping theGovernment to build an enabling environment for theprivate sector in two major areas: (i) creating a supportivelegal, regulatory, policy and institutional framework that istransparent, predictable and accountable; and (ii)improving the policy framework for Small and MediumEnterprises (SMEs) and their access to financial resourcessuch as venture capital funds, private sector investmentfunds, and the domestic capital markets.
The recognition that the private sector will be the enginefor economic growth, and will create jobs and increaseincomes necessary for lifting people out of poverty, iswell founded. Recent studies have revealed strong
75 International Finance Corporation. 2000. China’s Emerging PrivateEnterprises – Prospects for the New Century. Washington, DC.Source: Compiled by ADB Staff from NBS China Statistical Yearbooks.
Figure 33: Estimated Distribution of Urban Employment bySector
0%
10%
20%
30%
40%
50%
60%
70%
80%
90%
1994 1995 1996 1997 1998 1999 2000 2001
Estimated % in Public Sector Estimated % in Private Sector

100 Poverty Profile of the People’s Republic of China
empirical evidence of the links between: (i) growth andprivate investment; and (ii) job creation in the privatesector and poverty reduction.76
The study on the relationships between private and publicinvestment, growth rates, and income levels in 50 selecteddeveloping countries from 1970 to 1998 indicates thathigher growth rates are, by a wide margin, stronglyassociated with a higher ratio of private investment toGDP when compared to that of public investment toGDP. Also, the other study referred to here on therelationship between job creation and poverty reductionin 80 countries from 1987-1998 has proven that privatefirms created four to eighty times as many jobs as publicsector firms, depending on the country. Moreover, onesurvey tracking specific poor individuals over time showsthat finding a job or a family member finding a job is amajor path out of poverty.77 Most poverty escapeesfound jobs in private firms, not the public sector.Admittedly, the PRC’s experience is more complex due tothe size of the country and the intricate institutionalfabric governing all enterprise. However, the abovehypothesis is applicable to PRC. Private sectordevelopment has had a significant impact on povertyreduction. A recent unpublished ADB study shows thatprovinces and cities that have a high share of privatesector activity usually have much lower poverty.78 Therelationship between per capita GDP and the share ofprivate sector employment in total employment in 30provinces clearly indicates the contribution of privatesector employment to the level of income. On averageamong provinces, for every 1% increase in the share ofprivate employment, there is a corresponding increase of164 yuan in per capita GDP.
Good governance is also essential for private sectordevelopment and its flow on to poverty reduction. Itensures the transparent use of public funds to whichprivate firms contribute through taxes, and promotes theeffective delivery of public services such as health andeducation. The poor are most vulnerable to public sectorinefficiencies, corruption and waste.
GENERAL OVERVIEWThe understanding of poverty among Governmentofficials focuses on income poverty. Consequently,
poverty reduction programs are designed to provide forincome generation (such as the subsidized creditprograms) or employment. However, both in rural and inurban areas, poverty is often caused by a lack of bothincome and of opportunities for human development.The costs of health and education are highlighted by thepoor as a major problem. In urban areas, another majorproblem is housing and the provision of urban facilities inthe areas where the new poor live. These are mostly theoutskirts of the cities where the floating populationmigrate, and in company towns where the laid offworkers reside. They also confront weaknesses in thesocial protection system (including health insurance,insurance against natural disasters, social assistanceallowances for the urban poor, and pensions for a rapidlyaging society).
SOEs continue to face increasing competition from TVEsand the private sector. Competition from imports willintensify with WTO accession. While SOE reforms areurgent, the reforms are difficult and must be implementedin a way that keeps the related social costs within tolerablelimits. Two of the most difficult SOE reform issues withsocial implications are: (i) separating social obligationsfrom SOEs and developing alternative methods ofproviding the social security services; and (ii) developing astrategy to redeploy the redundant workers. In addition totheir core products or services, the SOEs have beenproviding an extensive range of social services, such ashousing, education, health facilities, and pensions. Formany enterprises the cost of providing these servicesamounts to about half of the wage bill. If alternativearrangements for providing these social security servicesare not developed, the pace of SOE reform will likelyslow. The Government is currently drafting a new socialsecurity law and engaging in pension reforms.
Khan and Riskin have pointed out two pertinent aspectsof urban income distribution and employment. In theiranalysis of the sources of income for urban populationsin 1995, they found that income earned from privatelyand individually owned enterprises was stronglyequalizing. Table 44 shows that the deciles that sharedmost of this income were the bottom three deciles (withthe bottom decile drawing the largest share) and the toptwo deciles. What this suggests is that there is a strong
76 International Finance Corporation. 2000. Paths Out of Poverty.Washington, DC.: 1-6. The report introduces several surveysincluding: Dollar, Davit, and Aart Kraay. Growth Is Good for thePoor.
77 Guy Pfeffermann. 2001. The Role of Private Enterprise in ReducingPoverty. The Asia and Pacific Forum on Poverty. ADB.
78 ADB. 2001. Asian Development Outlook (ADO). ADB.

The Fight Against Urban Poverty 101
Source: Khan, A.R., and C. Riskin. 2001. ‘op cit’.
rudimentary informal sector generating low incomes formany poor households. At the same time there are veryprofitable ventures providing a small number of peoplewith high incomes. The statistics used to compile Table 44are likely to understate the volume of income generatedby small scale informal sector activity in the cities. Becauseof a range of barriers to micro- and small business inurban areas - licensing, compulsory proof of a lease overpremises, taxation, employee registration, multiple agencyreporting requirements, minimum capital thresholds forregistering businesses - much commercial activity at thislevel takes place in the gray economy and is not recorded.
Table 45: Output Elasticity of Employment in UrbanIndustries, 1988-1995
Source: Khan, A.R., and C. Riskin. 2001. ‘op cit’.
At the macro level, the process of transition to a marketeconomy involves restructuring towards goods andservices that make efficient use of the various factors ofproduction given the resource endowments of the PRC.Given the abundance of labor, it was reasonable for theGovernment to assume that restructuring would, after aperiod of labor dislocation while SOEs downsized, leadto a profusion of labor-intensive industries, whichthrough expanding employment would prevent a rise in
urban poverty. However transition and freer trade so farhave not heightened the employment intensity of thePRC’s growth. The output elasticity of employment forurban industries over the period reviewed by Khan andRiskin was low - see Table 45.
It was only in industries under private and new forms ofownership that output growth simultaneously generatednoticeably positive employment growth. Herein lies onedynamic dimension for significant macroeconomicimpacts on urban poverty. In the eight years 1994-2001there was a dramatic rise in urban employment in non-state and non-collectively owned enterprises - see Table43. This employment-friendly category comprising severalforms of alternative ownership will, in all probability,continue to expand. Up until 2001, the growth of thiscategory has just been enough to sustain the overall levelof urban employment with minimal growth. The recentrevision in 2002 by NBS for total urban employmentnumbers between 1998 and 2001 make it confusing toknow for certain what has been the year-on-year trend.Table 46 first sets out NBS’s annual growth rates in totalurban employment with revised figures applying from1998 onwards. Clearly NBS has changed the basis forcalculating this figure, as it is implausible that employmentwould have grown by 7% between 1997 and 1998. Forreliability, comment on the revised figures has to belimited to changes between 1998 and 2001. The period istoo short to be confident of a trend, but a tentativeconclusion would be that the rate of urban employmentgrowth is either stable or marginally declining. Growthover the 1998-2001 as per these revised figures hasaveraged 3.5% per annum compounded.
Table 46 then sets out NBS’s unrevised figures as per its2001 Yearbook. Different conclusions flow from thesefigures. Over the 1994-2000 period overall urbanemployment grew at an average rate of 2.4% per annumcompounded, but the general trend was a slowing of theannual rate of increase.
Table 46: Year-on-Year Change in Urban Employment(%)
Source: Revised in 2002 figures for 1998-2001 from NBS China Statistical YearBook 2002; and the unrevised figures from China Statistical Year Book 2001.
Table 44: Urban Income Distribution Pattern 1995
xAll industries 0.037
xState enterprises 0.032
xCollective enterprises -0.176
xPrivate & other enterprises 0.874
1995 1996 1997 1998 1999 2000 2001
Revisedin 2002
3.7% 3.8% 2.0% 7.0% 3.7% 3.3% 3.4%
Un-revised
3.7% 3.8% 2.0% 2.3% 1.6% 1.2% N/A
DecilePoorest = 1
All IncomeDecile Distribution
Income fromPrivate Enterprise
Distribution
1 3.4%xxxxx 16.2%xxxxx
2 4.9%xxxxx 9.3%xxxxx
3 5.8%xxxxx 12.1%xxxxx
4 6.7%xxxxx 3.4%xxxxx
5 7.6%xxxxx 5.0%xxxxx
6 8.6%xxxxx 6.1%xxxxx
7 9.8%xxxxx 6.8%xxxxx
8 11.5%xxxxx 8.1%xxxxx
9 14.4%xxxxx 16.9%xxxxx
10 27.4%xxxxx 16.2%xxxxx
Total 100%xxxxx 100%xxxxx

102 Poverty Profile of the People’s Republic of China
INSTITUTIONAL RESPONSIBILITYFOR URBAN POVERTY
While Government at both the national and local levels isincreasing the priority given to urban poverty reduction,there is no over-arching inter-agency group, like theLGOP, coordinating urban poverty strategies andprograms. At a national policy level, the NDRC, theMinistry of Commerce (MOFCOM), MCA and theMinistry of Labor and Social Services (MOLSS) play keyroles in urban poverty alleviation. At the provincial andcity levels, corresponding MCA and MOLSS hierarchieshave primary responsibility for programs that directlyaddress the urban poor.
An under-resourced administrative structure is in place tocarry out the Minimum Living Standard Scheme (MLSS),which assists registered urban residents whose income islower than the local poverty line. The day-to-dayoperations of MLSS depend on a handful of officials atthe levels of municipality, urban districts and streets. Thisrudimentary structure assessed and made payments to19.9 million beneficiaries in 2002. The nationalgovernment outlaid 46 billion yuan in 2002 towardsassisting city governments make these payments. City andlocal governments contributed a further 59 billion yuan.Despite these volumes, the administrative structure hasgrown little since the days when urban poverty relief wasrestricted to persons suffering from the “three nos”.
THE RESPONSIBILITIES OF THE CITIES
Principle responsibilities : The Government, bothlocal and central, is according increasing priority toaddressing urban poverty. Formal social securityexpenditures for pensions, unemployment and healthhave long been provided for workers employed in Stateowned enterprises and government agencies. Starting in1993 in Shanghai, city governments have adoptedminimum living standards in the range of 150 yuan to400 yuan per capita per month to provide socialassistance payments for those households with incomesbelow their city’s poverty line. City responsibilities interms of numbers covered under these minimum livingstandard support schemes and the accompanyingfinancial outlays expanded rapidly, especially from thelate 1990’s onwards. For example, in 1999 Liaoningprovince was providing MLSS to 700,000 urban poor.By June 2002 its MLSS coverage had expanded to 1.3million. In December 2000, the Government adopted apolicy to make such minimum living standards
compulsory for every city and provide just under half ofthe expenditures through the national budget.Labor administration: The employment centers of thecity Labor Bureaus are important for the urban lowincome people, laid off workers and the unemployed.These centers find creative means to promote the re-employment of laid off people.Housing administration and social services: In somecities, the housing administration provides rentalexemptions for the absolute poor. Other programs are inplace to help laid-off workers who can demonstrate theirdifficult financial status. These include hospital feereductions, tuition waivers for schools, industrial andcommercial tax exemptions and deductions, andexemptions and subsidies for water supply and electricity,specifically targeted to the urban poor.Other City Administration Departments: As of March2002, 30 cities have run training programs on starting abusiness. This training has been directed at those laid-offworkers and unemployed who want to launch their ownprivate business. This training has been followed-up withassistance in: (ii) obtaining the necessary businessregistrations from relevant city authorities; and (ii)applying for small loans to underpin their business start-up. Some cities have established business incubatorswhere fledgling new small businesses can locate withinstant access to necessary physical infrastructure andsome support services.
MINISTRY OF CIVIL AFFAIRS
Low social assistance funding for the urban poor:The Ministry of Civil Affairs is responsible for providingsocial assistance for the urban poor who cannot meetbasic living expenditures whether due to unemployment,disability, or other reasons. The programs are fundedfrom local government budgets through a special urbanpoverty fund. These payments are designed to meet thegap between the minimum per capita income standardsand the employment benefits from re-employmentcenters so that people can have basic necessities.However, only a few provincial urban poverty programshave been established and social assistance payments arerelatively low. By the end of 1999, 1.7 million urban laid-off and low-income people in 1,801 towns of 22provinces had received special civil affairs benefits tocover monthly basic living expenses ranging from 70 yuanto 260 yuan per family.
Community based selection criteria: A typical localurban poverty program consists of (i) a minimum

The Fight Against Urban Poverty 103
monthly payment for the absolute urban poor for basicliving expenses following the loss of a job; and (ii) a basicmonthly living subsidy per person to the absolute poorwhether employed or unemployed. To receive the subsidy,a household applies for assistance through a residentcommittee, which confirms the financial situation of thefamily, ensures that the family’s per capita income doesnot exceed the minimum monthly standard, and forwardsthe application to the district Civil Affairs office. Uponapproval, the Civil Affairs office provides the subsidy tothe resident committee, which forwards the funds to thehousehold.
MINISTRY OF LABOR AND SOCIALSECURITY
Basic guarantee programs for the urban unemployedpoor: The Provincial Labor Bureaus and the local labordepartments provide assistance to the poor in urban areas.Many cities have programs for the urban unemployed andpoor designed to provide a certain percentage of theformer salary. The most common program for the urbanunemployed is called the basic guarantee. This provides anamount per person per month for laid-off (xiagang)workers who still hold employment contracts with theSOEs with such funds coming from the governmentbudget, the SOE concerned and other sources (mainlyunemployment insurance funds). When someone is laid-off, he or she receives a special identification card toconfirm their unemployed status. Thereafter, registration(including personal and financial information) in a re-employment center is required to receive the monthlybenefits. All unemployment-related benefit funds arechanneled through such centers, which provide monthlypayments. These centers also ensure that each registeredworker laid off from an SOE is provided once withoccupational guidance, three times with employmentinformation and once with free job training, with thesesupport inputs all being delivered in the first six monthsafter registration with a center. The free skills training isprovided by re-employment centers, enterprises,universities, and other professional and socialorganizations. In some places, unions also play a role inurban poverty with programs similar to the MOLSSprograms described above.
Using MOLSS as the main lead agency, theGovernment in 1998 launched what it called the “tenmillion in three years” re-employment training program.This aimed at training ten million laid off workerswithin three years. This program has been basicallysuccessful. From 1998 to 2000, more than 13 million
laid-off and unemployed persons received such trainingand the reemployment rate after training was around 60%.Re-employment training has continued intensively so thatbetween 1998 and June 2002, 17 million laid-off workershad found new jobs.
Retraining is not always successful: However, jobretraining has limited potential to help the older laid-offworkers. In Shanghai, for example, only 54.7% of the114,000 laid-off State enterprise workers retrained in 1997found a new job. The majority of those who could notfind work were 50 years or older, often too old to learnnew skills, and too inflexible to cope with therequirements of the new labor market and services sector.
URBAN POVERTY ALLEVIATIONMECHANISMS
There are three major safety nets designed to protecturban residents from falling into poverty. These are: (i)the living allowance for laid-off employees; (ii)unemployment insurance (UI); and (iii) MLSS. Amongthese three, MLSS is the safety net of last resort.Currently the laid-off employees assistance facility coversaround 8 million beneficiaries. In 2001, 3.1 million peopledrew down UI payments and in 2002 19.9 million receivedthe MLSS allowance.
Laid-off employees assistance: This assistance whichincludes help in finding new employment, is an extensionof the traditional social welfare role of SOEs. Until themid-1990s such assistance was provided indefinitely untilsuch persons were retrained and given a new job withinthe enterprise or its subsidiaries. With growing financialdifficulties facing many SOEs, the scheme was changed inthe mid-1990s to limit the responsibility of enterprises tothree years and to lower the level of payments to laid-offemployees from the basic wage to a living allowance setbelow the local minimum wage. From 1998 onwards theState Council mandated that every SOE and urbancollective enterprise with more than a benchmarkincidence of laid-off workers had to establish a re-employment center. Currently there are 120,000 centers,but the quality of their support varies widely. They, andthe laid-off assistance scheme itself, will be terminated bythe end of 2003. Thereafter new laid-off workers will betreated as unemployed and responsibility for their incomemaintenance will be taken over by the city level MOLSS.
The Unemployment Insurance Scheme (UI): Thiswas launched in 1986. It is funded by contributions from

104 Poverty Profile of the People’s Republic of China
both employee and employer based on a percentage ofemployee’s salary. Initially confined to SOEs, it wasextended to collectives and foreign invested enterprises.Since January 1999, participation in UI was madecompulsory for all urban employees, except ruralmigrants, by a regulation stipulating employercontributions as a 2% surcharge on staff salaries andemployees paying in 1% of their salaries. Despite theregulation, coverage remains limited to those formallyemployed in enterprises. By September 2002, 101 millionemployees were shielded under UI but this is only half theurban workforce. There are practical problems incollecting contributions from small enterprises with non-documented employment arrangements.
Should an employee who has contributed to UI for morethan one year become a “registered” unemployed person,s/he is entitled to a monthly living allowance of 60-80%of the local minimum wage. The benefit can be extendedfor three months for every 12 months of IUcontributions made up to a maximum of 24 monthssupport. Even with the pre-condition of “registration”,the scheme’s coverage is not yet comprehensive. In 2000for instance, only 55.6% of the registered unemployedreceived UI assistance.
The Minimum Living Standard Scheme (MLSS):This began as a local initiative in Shanghai in 1993. Afterpiloting in five cities, it was extended to most cities by1998. Unlike UI and other social insurance schemes,MLSS is non-contributory and technically applies to allregistered residents in the locality with an income belowthat particular city’s poverty line.
MLSS pay outs are calculated to make up the differencebetween the local city poverty line and the impoverishedhousehold’s per capita income. Actual MLSS benefit perrecipient has been low – an average of 62 yuan per monthper person in 2000. Because the scheme reduces ahousehold’s MLSS entitlement by every extra yuan it earnsindependently, there is a disincentive effect on recipientself-help. Furthermore MLSS does not protect the urbanpoor from two key vulnerabilities – the cost of healthcarein case of serious illness, and the rising financial sacrificeneeded to give their children a reasonable education.There is a tendency for the urban poor to avoid necessarymedical care. With education fees, poor parents eitherlower their living standards further, or restrict theeducation of their children.
MLSS’s coverage of the urban poor has been expandingrapidly in recent years. Between 1999 and 2002, the numbersof beneficiaries jumped from 2.8 million to 19.8 million.
Source: Ministry of Civil Affairs. 2002. China’s Urban Poverty and the MinimumLiving Standard Security Scheme. Beijing. December (in Chinese).
In the most recent year, 2002, beneficiaries increased by70% over the previous year (see Figure 34). Using broadnumbers, MLSS in 2002 probably covered 60% of the urbanpoor defined as those with urban residency status who couldnot achieve annual per capita consumption of 2,310 yuanin 1998 prices. If the poor segment of the floating migrantpopulation in cities is included, however, then the percentageof coverage is less. Currently, the urban migrant populationis not entitled to the MLSS safety net.
FUNDING FOR URBAN POVERTYREDUCTION
Decentralized funding system: There is no consolidatedurban poverty funding information available, as suchprograms are decentralized by nature, and are notcoordinated through a national urban poverty coordinatingbody (for example, something similar to LGOP for ruralpoverty). Also, national poverty fund data is notdesegregated for urban areas that lie within designated keycounties for national poverty reduction and development.UNDP (1998), however, estimated that 4.2 billion yuan wasrequired in 1997 to lift the 11.76 million urban poor abovethe 1,700 yuan per capita per annum level.
Detailed information has recently become available aboutthe funding of the MLSS as a result of a publication
Figure 34: Minimum Living Standard SchemeTrends
0
20
40
60
80
100
120
1998 1999 2000 2001 2002B
illio
n Y
uan
0
5
10
15
20
25
Mill
ion
Ben
efic
iari
es
Central Government contribution Total Cost (billion yuan)
No. of Beneficiaries (million)

The Fight Against Urban Poverty 105
prepared by the Ministry of Civil Affairs for the Urban-China Anti-Poverty Forum held in Beijing 12-13December, 2002.79 The total (national and localgovernments) and the national government’s outlays onMLSS from 1998 to 2002 are illustrated in Figure 33. Asharp rise in funding is evident from 2000 onwards. In2002, a total of 105 billion yuan was expended on MLSS,with 44% of this funded by the central government.Interestingly, this is more than double the funding from allsources devoted to the “8-7” rural poverty reductionprogram in 2000. In 2002, MLSS beneficiaries on averagereceived 529 yuan for the year or 44 yuan on a monthlybasis, assuming that the outlays quoted by MCA do notinclude administrative overheads. The average in this casemay be distorted by the proportion of beneficiaries whoonly claimed and received MLSS payments for part of theyear.
The MCA publication also has provincial breakdowns oftotal MLSS budgets.
CIVIL SOCIETY-BASED PROGRAMSFOR POVERTY ALLEVIATION
The fight against urban poverty is not limited toGovernment intervention alone. Individual provinceshave schemes to encourage private entrepreneurship. Anexample of an urban poverty private sector incentive planin Shanxi is described in Box 8.
Box 8: Public-Private Sector Initiatives to Combat UrbanPoverty: The Case of Shanxi
A program called Small Bank Loans for Helping Laid-Off Workers toFind New Jobs is operational in Shanxi Province. Under this program,commercial bank loans of 3,000 yuan are provided to laid-off workersto help them to set up a private business. The 2.5% interest rate is paidby the provincial government. Under this program, the laid-off workersmay receive the loan, civil affairs department payments, and labordepartment benefits and insurance for six months. If the businesssucceeds, then the other payments end. Other incentives include abusiness tax exemption and income tax exemption for the first threeyears followed by two years of tax reductions.
Information is not readily available on urban povertyalleviation strategies and programs supported by widersociety-based and NGO action. The quarterly magazineChina Development Brief is a comprehensive source onnew NGO profiles and activities.80 While most NGOsare focusing on poverty, social and environmental and
79 Ministry of Civil Affairs. 2002. China’s Urban Poverty and theMinimum Living Standard Security Scheme. Beijing. December(in Chinese).
80 China Development Brief. http://www.chinadevelopmentbrief. com
environmental issues in rural areas, a small but growingnumber are working with the urban poor. On anecdotalevidence, these urban activities are concentrated on thosewhose poverty is related to age, incapacity or the exclusionand unfair treatment of under-privileged women.
One key buffer to growing urban poverty has been thegrey economy which manages to stay beyond the reach oflocal government regulators of commerce and taxation.Hard data on this sector is virtually non-existent. Laid-offworkers who have taken the risk to be small-scaleentrepreneurs in no small part drive the sector’s growth.The sector tends to operate without business licenses,labor contracts, official receipts and business andindividual tax payments. While small in terms ofemployees per business, anecdotal evidence suggests thatpossibly half of all laid-off workers earn income from thegrey unreported economy.
The larger Government-organized non-governmentorganizations (GONGOS) such as the ACWF and theACCYL have a small part of their programs directed atthe urban underprivileged and poor. For instance, ACWFhas programs to assist laid-off female workers re-enterurban employment or become self-employed. TheGONGO (although since 2001 it may be more of aNGO) with possibly the most direct interest in urbanpoverty is the China Social Work Association. It wasestablished under the auspices of the Ministry of CivilAffairs (MCA) in 1991. It is currently working with MCA,in consultation with the Ministry of Personnel andMOLSS, to develop a system of certification of socialworkers in the Pudong District of Shanghai which maylater be applied nation-wide. In several of its programs itcooperates with international NGOs such as Focus andHalf the Sky, both from the US.
International NGOs recognize the presence of growingurban poverty as a major issue but have tended tomaintain their emphasis on addressing rural poverty.Health and HIV/Aids dimensions of urban poverty areareas where some local and international NGOs haveactive programs, for example the Red Cross. Care andadoption programs for urban orphans is another growingarea supported not only by international NGOs, but themore so by foreign commercial adoption agencies whoseclientele are mainly Western couples who have chosenadoption as the means for having or enlarging their family.

106 Poverty Profile of the People’s Republic of China
ASSISTANCE FROMINTERNATIONAL DONORS
The coverage of international donors in this section in noway attempts to be comprehensive. Inclusion of somedonors and only some of their pro-urban poor activitiesdoes not imply that the contributions being made underunmentioned projects funded by unmentioned donors arenot equally or more worthy.
Donors for some years now have been encouragingresearch and investigation into the nature of urbanpoverty as a means of providing evidence-basedarguments to influence and enhance policies andprograms towards the urban poor. The ADB, for instance,has in 2000 and 2001, funded two ADTAs focusedspecifically on urban poverty. It plans to finance a furtherurban poverty study in 2004.
The Use of Social Security Reform to Address UrbanPoverty: As reforms in the industrial sector continue andSOEs are restructured and rationalized, increasingnumbers of redundant workers face the prospects ofunemployment. This leads to increasing urban poverty ifthe unemployed are unable to secure new jobs and if asocial safety net and new skills training are not providedduring the transition period between jobs. Consequentlythe ADB is focusing some of its policy advice in the areaof social security reform and is financing an exemplarysocial security reform project in Liaoning. A sound socialsafety net and retraining and job creation, mostly in theprivate sector, are needed to mitigate the possibility ofincreased urban poverty resulting from enterprise reformand restructuring for increased economic efficiency. TheWorld Bank is similarly focused on social security reform.In 1999 it commenced a four year support program forpension reform directed at the Qingdao municipal and theHeilongjiang provincial pension systems and involvingMOLSS and local level labor bureaus. AusAID, throughits China Capacity Building Program, has enhanced policyplanning capacity regarding social security reform withinNDRC and MOLSS at the national level, and in mid 2002provided advice to the Shanghai Finance Bureau onstrategies for achieving sustainable management of socialsecurity funds.
The Promotion of Private Sector Development toReduce Urban Poverty: A number of the internationaldonors have concluded that strategies to support inaddressing urban poverty are the promotion of thegrowth of the private sector, and capacity building
urban policy, regulatory and service agencies to enhancesound development management of urban areas.
The ADB, for instance, is helping develop a legal/regulatory framework which facilitates development ofthe market economy. Under a TA grant, the ADB issupporting the drafting of several key economic laws suchas the Company Law, the Bankruptcy Law, the BankingLaw, the Social Security Law, the Registration ofCommercial and Industrial Organizations Law and theAdministrative Licensing Law. The ADB recentlylaunched a study of practical approaches to facilitatingdomestic private sector development. This follows anearlier study of private sector development conductedunder International Finance Corporations (IFC) auspices.
The results of the IFC study have led to an IFC-AusAIDexperimental private sector support project in Chengdu.AusAID is currently funding a UNDP project in Tianjinto generate sustainable income for laid-off womenworkers through the use of a business incubator andmicro-credit. AusAID is also supporting a technicaleducation upgrading project in Chongqing to assist newlabor market entrants obtain jobs.
The Canadian International Development Agency(CIDA) has a management education project which isbuilding capacity of enterprise managers and officials toaddress special issues related to economic reformincluding the displacement of urban workers, particularlywomen, and their rehabilitation as self-employedentrepreneurs. CIDA also has a governance projectunderway to promote integrated municipal developmentin 9 PRC cities. This project, among other things, may wellimprove the pro-poor opportunities and facilities withinthese municipalities.
The German Agency for Technical Co-operation (GTZ),has supported training and technical education projects toreintegrate redundant workers, especially women, backinto the workforce. The Japan International Co-operationAgency, (JICA) has been testing a pilot project to providemicrofinance to the urban poor, with a view to makingthis a much larger program.
Other International Donor Interventions whichassist the Urban Poor: While the private sector is seenas the main dynamic force in generating jobs for theurban poor and other urbanites, the State sector is not tobe overlooked. Improved efficiency, profitability andgrowth in SOE operations will generate new jobs. Anumber of donors have contributed to supporting therestructuring process in the State sector. The World

The Fight Against Urban Poverty 107
Bank, for instance, has an on-going Enterprise ReformProject which commenced in 1999. This project also hasa component for promoting employment in the non-Statesector.
Both the World Bank and the ADB have financed andcontinue to finance a range of urban environment,water and sewerage projects. Poorer urban watersupplies and sewage removal, and pollutionconcentrations tend to impact those in poverty morethan the non-poor who can gain access to higher qualityenvironmental conditions through buying or rentinghousing in cleaner better serviced sections of cities andequipping their residences with pollution reduction andwater purification devices. The recent Dutch study onthe Environment rates air pollution, particularly in thecities, as the second most severe factor impacting the
poor.81 Each of these city-based environment projectsthus has important pro-urban poor impacts.
The World Bank and DFID are blend financing atuberculosis (TB) control project which commenced in2002. While the project is concerned particularly tocontrol TB in populations that are hard to reach,controlling TB in urban areas is within the project’s ambit.The project covers 19 provinces. TB tends to be moreprevalent among the poor – in urban as well as rural areas- and is particularly debilitating to sufferers. Separately,DFID is supporting an urban health and povertyreduction project.
By and large, however, donor activities related to urbanpoverty alleviation have been modest compared to theirassistance to help combat rural poverty.
81 Van der Tak, Casper M. 2002. ‘op. cit’


Vulnerable Groups 109
VULNERABLE GROUPS IN RURAL AND URBAN AREASWOMEN AND GIRLSThe gender dimensions of poverty in the PRC are largely under-diagnosed in official statistics as many figures are collected on ahousehold basis and are not gender disaggregated. Little is officially recorded on intra-household income and welfare distribution. Ofthose studies that have been able to disaggregate the attributes of poverty on a gender basis, the common conclusion is that there is asubstantial differential in favor of males. The Department for International Development of the UK (DFID) surveys (2000) inGuangxi, Yunnan and Ningxia and an ADB social assessment (2001) in Sichuan have found clear gaps in education and healthoutcomes, as well as in access to agricultural extension services. An earlier UNICEF report also noted that in some poor areas almostall girls and half of the boys were not at school.As mentioned earlier in both the rural and urban sectionsof this profile, the paucity of education levels achievedwithin the household are closely correlated with poverty.Conversely, investment in education is a highly effectivemeans of reducing poverty. Currently the allocation ofeducation, viewed as human capital, is biased towardsmales particularly in rural areas. Figure 35 records one setof research results on education levels achieved amongworking-age farmers by gender in each of the PRC’s threeregions, based on sampling. These particular results showthat, with two exceptions, categorization of working agefarmers by highest level of education achieved is maleintensive for the three key education levels reviewed, andthis male intensity increases with higher levels ofeducation. According to this study, the two exceptionsbecause they reflect gender balance, are those farmers inthe eastern and central regions whose highestachievement was primary school. The no-formal-education category is strongly female intensive. Theparticularly high female intensity of this category in theeastern region may be a function of proportionately moreconservatism about educating girls in a proportionatelysmaller uneducated segment of local populationcompared to other regions.
Source: Agriculture Research Office. 2000. China Initial Agriculture ResearchResources Summary. China Statistical Press. March. Beijing (in Chinese).
Illiteracy is strongly intensive and it is likely that womenand girls at least comprise 70% of these illiterates.
Because of the complexity of the Chinese language, theMinistry of Education classifies anyone who recognizesless than 1,500 characters as illiterate. While there hasbeen praiseworthy progress in reducing illiteracy, 85million people were identified as still illiterate in 2001.Furthermore, the number of illiterate people was nowgrowing at 500,000 a year and most of these were schoolage children pulled out of school by migrant parents whocould not afford the extra school fees levied by cities onmigrant students.82 Girls would outnumber boys amongthese poor young urban migrants deprived of literacy.Fortunately there is a very recent move to lower barriersto schooling that confront the children of urban migrants.In mid-January 2003, the State Council issued a decree onimproving the management of, and provision of servicesfor, rural migrant workers. This decree encourages urbanGovernment schools to open their doors to the childrenof migrant farmers.83
Conservative social attitudes underpin the tendency ofthe poor to exclude their daughters from even finishing abasic education. A common conservative family view is tosee a daughter’s education as a wasted investment, sincegirls are viewed as members of their husband’s familyafter marriage. An even more conservative family view inthe countryside is that a highly educated daughter will beconsidered dangerous by potential husbands.
No State system is universally in place to exempt orsignificantly alleviate families below the official povertylines from paying school fees and charges at localstandards. For poor families, schooling costs are a largefinancial burden. In Sichuan in 2001, for instance, theaverage spent on education by rural households wasequivalent to one quarter of the total income of those
82 Statement to the Chinese People’s Political Consultative Conferenceby the Literacy Office of the Ministry Of Education. 4 March 2002.Beijing.
83 Zhao, H. 2003. Migrant workers get better protection. China Daily. 23January.
Figure 35: Gender Comparison of Highest EducationLevels Achieved by Working-Age Farmers
2.17
1.78 1.76
1.09 1.07
0.84
0.63 0.59 0.53
0.28 0.28 0.26
0.00
0.50
1.00
1.50
2.00
2.50
Eastern Region Middle Region Western Region
Rat
io o
f Wom
en to
Men
Uneducated Primary school Middle school College and above

110 Poverty Profile of the People’s Republic of China
households bordering on the official poverty line. Theburden for the poor is increasing as primary schools areconsolidated into fewer locations and thus out-of-host-village students have to board and pay associated fees.Under such highly constrained family budgets, moretraditional parents are likely to scrimp on otherexpenditures to educate a boy than a girl.
On the positive side, as mentioned in earlier chapters,there are a number of GONGO, NGO and officialdonor-financed programs to give girls in poor familiesgreater educational opportunities.
As well as education, studies have shown that obtainingoff-farm employment is closely related to escaping ruralpoverty, and prompt re-employment of laid-off workersis a sure antidote for urban poverty. The opportunities toescape rural poverty by working off-farm are flowingmainly to males. A recent survey by the Ministry ofAgriculture has concluded from the sample that 70.1% ofmigrant workers from rural areas in 2002 were male, andthis was a slight increase in male intensity over theprevious year.84 This is part driven by the educationaldifferential between men and women, also by the lack ofvocational training opportunities for poor women andlocal social attitudes. Those rural women who becomemigrant workers generally have lower formal educationallevels than their male counterparts which would suggestthey tend to obtain lower-paid jobs in labor-intensiveindustries involving low-skill repetitive tasks - see Table47. Results from the Ministry of Agriculture survey ofurban migrant labor in 2002 indicate that 35.4% of thefemales worked in manufacturing and a further 27.8% inthe food service industry.
Table 47: Distribution by Gender of Educational Levels ofMigrant Workers in the Pearl River Delta Triangle (%)
cent of the male workers had achieved high school orcollege level education, whereas for females, only 10% haddone so. At the other end of spectrum, 7% of the maleshad been educated up to primary school only, comparedto 20% of the females. Interestingly there were moreuneducated males than females and this presumablyreflects the needs of the construction industry in thetriangle for unskilled male workers. The country widesurvey of migrant workers in 2002 conducted by theMinistry of Agriculture found that construction work wasthe second largest category of employment for migrantmales, soaking up 20.5% of all migrant male workers.
The figures in Table 47 reflect the situation in the delta inthe early 1990s. Recent anecdotal evidence from project-related social assessments in the central and westernregions suggests that there has been a structural shift inthe delta and the industrial areas in Fujian towards high-technology production and that this has generated areverse flow of unskilled migrant labor, largely women,back to the villages.
Associate Professor Xu Min makes the interesting pointthat in urban areas with SOE reform, the majority of laid-off workers between 1990 and 1995 were females. It wasonly when a lot more males were laid-off after 1995 thatthe Government and the press elevated laid-off workersas a major issue.85 Associate Professor Xu in the samearticle analyses what happened at a large re-employmentfair solely for laid-off women held in 1997 in a major PRCcity. At the fair 1,272 jobs were offered and 831 of thelaid-off women who attended submitted 1,198applications for those positions. After interviews byemployers, only 225 were given jobs. Within a couple ofmonths a significant number of the re-employed womenhad quit these jobs of their own volition. AssociateProfessor Xu argues that if, as observed in the fair and itsaftermath, there is the high failure rate in structuredefforts to re-employ laid-off women, then the re-employment agencies need to understand the reasons forthis failure rate. Armed with this understanding, theagencies could modulate their re-employment support tobetter meet the needs of laid-off female workers.
An inadequate, declining or inhospitable resource baseis also closely related to much of the poverty thatremains in rural PRC. The DFID surveys referred to atthe beginning of this chapter and field-work associatedwith the DFID-financed Yunnan Environment
Source: Social Studies Institute of the China Academy of Social Science. 1996.Farmer Migration and Gender. Zhongyuan Farmers Press. Zhengzhou (in Chinese).
Table 47 records the results of a sample survey ofmigrant workers in the industrial complexes in the PearlRiver delta triangle, excluding Hong Kong. Thirty four per
College HighSchool
MiddleSchool
PrimarySchool
Un-educated
Men
Women
2.4
1.2
30.2
9.0
60.0
68.3
7.1
20.4
6.4
1.1
84 Agriculture Policy and Regulation Department. Ministry of Agriculture.2003. Migrant Labor Survey reported in People’s Daily 2003. 23January.
85 Xu, M. 2001. Inattentiveness to the Needs of those seeking Re-employment. Collection of Women’s Studies. No.1: 12-17. Beijing.

Vulnerable Groups 111
Development Programme have pointed out how povertyrelated to poor and/or degrading environments impactsmore harshly on women and girls. The fetching of waterand firewood, and the shepherding of grazing animalstend to be mainly female responsibilities Considerablymore time and effort is required to carry out theseessential activities as environmental conditions decline.With increased female exhaustion, declining quality ofwater and winter warmth, consequent ill-health includingreproductive health, and less cash income from animalhusbandry, the result is often a continuation or recurrenceof household poverty with women and girls sufferingmore physically and emotionally than the males.
Another key resource that makes women vulnerable topoverty is rural land and the land rights system thatdetermines its allocation. Apart from minority acreages ofState land, the rest of rural land in the PRC is owned bylocal collectives or land-owning groups. These collectiveshave allocated, on an equitable basis, 30 year usufructrights to individual households under the householdresponsibility system. As population in a communitychanges, the collective may preserve inter-householdequity by small relatively frequent adjustments, or largerinfrequent adjustments, or do nothing. Guizhou has beena forerunner in the do nothing response, referred to as the“two nos”. The new Land Contract Law whichcommenced in 2003 basically entrenches the “two nos”approach.
The gender dimension to inadequacies in readjusting theallocation of usufruct rights occurs in conjunction withthe traditional custom of a woman leaving her parent’shousehold on marriage to move into the household ofher husband. Many rural marriages involve womenmoving into the land area controlled by a differentcollective. In the absence of adjustment, the fixed area ofland farmed by the husband’s household has to supportanother mouth when the new bride arrives. Forhouseholds in poverty or struggling to stay above thepoverty line, this increased land pressure impoverishing.Furthermore, the household that the new bride leaves hasfewer people to support, but fewer hands to work it andmaybe a higher dependency ratio given aged parents orgrandparents. Both the PRC media and a recent ADB-financed Resettlement Plan for expressway developmentin south Sichuan have pointed out the tendency for femalefarmers to be deprived of equal usufruct rights to land.
It is not just environmental degradation with more timeand effort required for fetching water and fire-wood andshepherding animals that is placing more pressure on
rural women in poor and vulnerable households. Anumber of reports and studies have commented on thefeminization of agriculture and consequential increase inwomen’s work-loads in agricultural production given thenumber of able-bodied males who engage in migrantlabor.
Younger women in poor and vulnerable households caneasily become victims of organized and apparentlygrowing trafficking in females. Studies in poor borderareas of Yunnan have revealed the trafficking in women,often cross-border to Thailand and Laos. Apart fromhuman rights and dignity aspects, and the obvious affrontto PRC traditional community values, this traffickingexposes these women, and later their home communitiesto STDs and HIV/AIDS.
Economic reforms have not all been gender neutral intheir impacts on the poor or vulnerable poor. Alreadymentioned was the tendency in the early years of SOEdownsizing for female workers to be laid-off first. Also, asthe reform principle of cost recovery was applied tohealth and education services, poor rural householdsrationed their use of these services. Girls tended to bewithdrawn from school earlier than boys and women’sreproductive health care went largely unattended.
It could be argued that while the reform process has madea major structural step in substituting the market and itsneeds for command economy output targets, theachievement of a sustainable “xiaokang” society dependson recognizing and capitalizing on the linkages betweenthe production economy and the reproduction and careeconomy. The current tendency is to focus on theproduction economy with its very public attributes likeGDP and under-estimate the importance of thereproduction and care economy which is as yet poorlyprofiled by quantitative measures.
Notwithstanding this tendency, in the last decade therehas been a marked expansion in the range of government,society-based and NGO programs which seek to alleviateconditions of poverty of women and young girls. TheACWF has been a major force in this, having helped 3.5million women out of poverty during the 1994-2000 “8-7” poverty alleviation program. In the late 1990s, with theGovernment’s acceptance of microcredit models ofemphasizing female borrowers, PADO took on an activitywhich had a deliberate bias in favor of women. NGOsand donors have long supported pro-gender equityprograms, and this has performed an advocacy anddemonstration role to Government.

112 Poverty Profile of the People’s Republic of China
MINORITY NATIONALITIESThere are 56 National minorities scattered throughoutPRC totaling 167 million people, i.e. 13%. Minoritynationalities tend to live under more difficult naturalconditions compared to the Han majority. The course ofhistory has led them to inhabit high mountainous remoteregions or wide-semi arid pastoral areas or dense tropicaljungle areas. Several studies have confirmed that theincidence of poverty among minority nationalities isconsiderably higher than the majority Han people. TheNational Government surveyed counties for qualificationas poverty counties in 1994. The result was that 257 outof the 592 designated poverty counties (43%) wereminority nationality or autonomous counties. The WorldBank reports that minority counties comprise about 80%of all very poor counties with annual average per capitaincomes below 300 yuan. In 1995, 28 million people inthe 257 ethnic minority counties had per capita incomesless than the poverty line.
For egalitarian and political reasons, the Government hasgiven special treatment to promote ethnic minorities.When poverty alleviation became more sharply focused in1986, minority counties were given preference. To qualifyas a poverty county, the national standard was set as lessthan 150 yuan rural net income per capita. For minoritycounties, the standard was raised to 200 yuan. Specialallowance was made for those autonomous counties insemi-agricultural and semi-pastoral areas where thequalification was lifted to 300 yuan and 200 yuan perpeasant and herdsman respectively.
The weighting given to national minorities in the targetingof official poverty alleviation programs is not the onlymechanism the national government has used to alleviatepoverty amongst the national minorities. In theGovernment’s annual allocation of budgetary grants tothe provinces, there has been a deliberate policy to weightgrants in favor Guanxi, Inner Mongolia, Ningxia, Tibet,and Xinjiang autonomous regions and to Guizhou,Qinghai and Yunnan provinces.
There are clear signs of success in the preferentialpractices for targeting the poor minorities. For the fiveautonomous regions and three provinces mentionedpreviously, all of which have high minority populations,the number of those below the official poverty linedeclined from 21 million in 1995 to 12 million in 1999.
Because minorities tend to live in mountainous andtropical forest areas, some of the Government’s macropolicies have adversely affected their income. There is
evidence of the ban on cutting timber in the Yangtzeheadwaters, the return of sloping grassland to forests, therestriction on growing tobacco and the ban on growinghemp (which is as well as being used to make cloth can beharvested as marijuana) have reduced minoritycommunity incomes substantially notwithstanding thatthere has been a policy attempt to provide a transitionsubsidy for a period while communities developalternative income earning activities.
It is difficult to gather detailed statistics on minoritynationality welfare as the general data collection practice isto collect information on all people living within an area,including the Han people.
THE DISABLED POORThe disabled account for around 9% of the rural absolutepoor and about 40% of the urban poor. Disability is arandom phenomenon so there is no reason to expect thatthe disabled will be more concentrated in povertyprovinces. In fact around 70% of the rural disabled liveoutside the official poverty counties. It is difficult andchallenging task to provide viable income generatingopportunities for the bulk of the disabled poor.Consequently, the mainstream strategy for reducingdisabled poverty has been to strengthen the safety nets. Afund for poverty loans for the disabled poor wasestablished in 1992 and by 2000 over 2.6 billion yuan hadbeen loaned out under this program. The Governmenthas also strengthened the institutional structure thatsupports disabled persons. By the end of 2000, 80% of allcounties had established a total of 2,240 county levelservice centers for the disabled and at a more local level,60% of all townships had set up 28,430 service centersfor the disabled.
To the extent that the poor with disabilities are able todirectly participate in poverty alleviation projects, theGovernment’s strategy is to give priority to activities thathelp the impoverished disabled tackle food and clothingproblems. This means a preference for finding suitableactivities in crop production, poultry raising, aquacultureand handicrafts. Furthermore, the Government requiresall enterprises and institutions to hire a certain percentageof disabled persons, and those not doing so are requiredto contribute to the employment guarantee fund for thedisabled. Specialized skills training is also given to thedisabled to increase their opportunities for employment.Between 1996 and 2000, more than 1.1 million disabledpersons received such training. The response by the widersociety has been strong. By the end of 2001, 38,000

Vulnerable Groups 113
social welfare enterprises were employing 699,000disabled people.In rural areas, the local level of MCA continues to carryout the “5 guarantee system” which provides minimumguarantees for food, housing, healthcare and schooling.While this social safety net was weakened when thepeople’s commune system was dissolved, the localMCA’s provide a minimal subsidy to disabled “5 guarantee
families”. The coverage in rural areas of this minimumsupport to the handicapped poor is, however, only partialThe Government programs have achieved considerablesuccess in alleviating poverty among the disabled. In1992, there were around 20 million disabled poor. By theend of 2000 this number had dropped to 9.8 million. Thework to substantially reduce this number is continuinginto the Tenth Five Year Plan period.


Conclusions and Recommendations 115
CONCLUSIONS AND RECOMMENDATIONS
The PRC’s progress in reducing poverty in the last quarter of the 20th Century has been remarkable. By 1996, the country was ableto achieve the Millennium Development Goal of halving, between 1900 and 2015, the proportion of people whose income is less than$1 a day. The war against poverty in the PRC is far from over, however. There is an official willingness to see rural poverty as coveringa much wider range of people than just those under the rather austere line of 625 yuan in 2000 prices. This has involved anacceptance of the notion of the vulnerable poor, referred to officially as low income persons, as those rural households with annual percapita net incomes above the austere line but below 865 yuan in 2000 prices. Officials have recently been talking about 20 millionurban poor rather than the lower publicized numbers around the 10 million mark. Much more serious thought has been given to thedynamics of poverty and the efficacy of strategies to reduce it. There is an open willingness in Government to listen to innovativeanalysis and proposals for fighting poverty.
2000 – BEFORE AND AFTERThe PRC can rightly claim spectacular progress in reducingabsolute rural poverty levels to one eighth of what theywere in 1978 when the economic reform processcommenced – nearly all people have enough to eat andsome clothing. Rapid economic development has providedthe basis for much of the poverty reduction. Thedistributional aspects of this growth, with the easternprovinces being the powerhouses for the new marketeconomy, have contributed to the Western region beinghome to the highest proportion of rural poor. Furthermore,the specific rural poverty reduction program hasexperienced the law of diminishing returns as simpler formsof poverty vanish and more inextricable forms remain -see Figure 36. In the 1990s it was becoming progressivelymore difficult and costly to address absolute poverty.
Derived by ADB Staff from Official NBS and CFPA data.
Prior to the 1990s urban poverty was not a problem giventhat the vast majority of working age adults with urbanresidential status, through employment with Governmentagencies, institutes and SOEs, had the benefits of the“three irons”: iron (meaning guaranteed) rice bowl, ironchair (position), and iron bed (housing). With SOEreform in the 1990s and consequent lay-offs of millionsof employees, it became clear that poverty was not just arural issue.
In the case of both rural and urban reduction – althoughless so for urban - major society-based resources weresuccessfully mobilized to complement and accelerate theGovernment’s efforts to reduce poverty.
With the advent of the 21st Century, there have been anumber significant changes in the Government’sapproach to poverty reduction aimed at greatereffectiveness. For instance, in concert with a global changein thinking, the Government has recognized that povertyis a multidimensional concept. It has accepted that forrural poverty the voices of the poor must be listened tothrough a participatory process by which villagedevelopment plans will be prepared and monitored andNGOs will be mobilized to complement theGovernment’s poverty reduction efforts. Officialsresponsible for area development plans are beingexpected to make a paradigm shift so that villagedevelopment plans coming from below are integrated intothe broader planning process that they manage
Furthermore a clear political commitment has been given,backed by significantly increased budget allocations, todevelop the Western region where most of the rural poorlive by investing heavily in infrastructure, addressingenvironmental problems and encouraging businessinvestment in the region.
Figure 36: Cost per Rural Person freed from Poverty (rollingthree year average)
0
1,000
2,000
3,000
4,000
5,000
6,000
7,000
1994-96* 1995-97 1996-98 1997-99 1998-2000
Yu
an (
1997
co
nst
ant
pri
ces)
Government cost per person freed Total cost per person freed

116 Poverty Profile of the People’s Republic of China
In the case of urban poverty, the Government hasrecognized the efficacy of employment and had chosen toput more effort into retraining and re-employing manypeople who have lost their jobs through SOErestructuring. During the period when the urban poor arewaiting for job opportunities and suffering from severeincome loss, the Government at national and city levelshas made a point of expanding the Minimum LivingStandard Guarantee scheme. Also being considered andpilot tested is how social welfare schemes administered atcity level can be improved and made financially self-sustaining.
The higher incidence of poverty among the floatingpopulations drifting into cities from rural area has beenrecognized. Very recently, there has been a decision toprogressively allow the floating populations of cities toaccess urban social development services which werepreviously restricted to registered urban residents. Beijingwill be a leader in this, giving equitable access to itsGovernment schools to the children of migrant workersfrom the countryside.
PILLARS UNDERLYING POVERTYREDUCTIONThe process of making the fight against poverty in thePRC more effective benefits from assessing what workedand what did not work in the past. From 1986 through tothe end of 2000, the Government pursued ageographically-targeted approach to rural povertyreduction. Poor counties were eligible for subsidizedloans, food-for-work programs, and special developmentfunds. These counties were called the national povertycounties and renamed in 2001 as key counties for nationalpoverty reduction and development work. For most ofthe 1990s and onwards, 592 out of a total of 2,074counties were eligible recipients of this targetedassistance. With some minor variations, these 592counties were re-designated in 2001 as key counties fornational poverty reduction and development work.Geographical targeting remained but was now overlaidwith finer targeting criteria focused on poor villages andpoor households that were developed because of thelessons learned from the past.
Figure 37 shows the trend in rural poverty reductionaccording to the official poverty line for national povertycounties and other counties between 1997 and 2000. Akey finding is that the poverty reduction rate in nationalpoverty counties was lower than for the other counties.There are lessons that can be learned or postulated fromthis which include:
(i) economic growth has had a major impact onpoverty reduction irrespective of targeting;
(ii) rural poverty in the national poverty counties isconcentrated spatially and is more inextricablerelative to rural poverty in other counties;
(iii) there has been a weakening of the Government’stargeted effort away from the rural poor within thenational poverty counties;
(iv) the prime drivers for reducing rural poverty in theshort-term may be upward trends in realagricultural prices and the availability of off-farmemployment (targeted programs delivered directlyto poor villages can only have minor impact onthese drivers);
(v) past efforts at targeting did not sufficientlyemphasize the integration of the poorercommunities into existing and new growingmarkets through improved road connections.
Source: NBS. 2001. Poverty Monitoring Report of Rural China. Beijing. ChinaStatistics Press.
The World Bank has calculated that for every 1% growthin the GDP in the PRC, rural poverty declines by aroundthe 0.8%. With the PRC being one of the world’s fastestgrowing economies (GDP growth between 1995 and 2000averaged 8.6%), poverty reduction has been considerable.Macroeconomic growth creates demand for the productsand for the labor of poor people, and enables theGovernment to collect more tax revenues. With increasedrevenues, the Government has been able to finance largerscale poverty reduction programs, improvedinfrastructure linking remoter areas to bustling markets,improved education and the development anddissemination of improved production technologies inagriculture and industry.
Figure 37: Pace of Rural Poverty Reduction by County
15.4%
18.2%
5.6%
16.7%
20.0%
6.3%
0.0%
5.0%
10.0%
15.0%
20.0%
25.0%
97->98 98->99 99->2000
Pac
e of
Red
uctio
n
National Poverty Counties All Other Counties
Conclusions and Recommendations 117
Income distribution patterns, however, favor eastern overcentral and western provinces, city over rural populations,and non-household entities over households. Eachpercent of GDP growth in the eastern provincesproduced considerably more rural poverty reduction thanin the northwestern and southwestern provinces, forinstance. The first message for policymakers is to realizethe potential for accelerating poverty reduction throughemphasizing pro-poor sustainable economic growth. Suchgrowth is likely to be characterized by: (i) the increasedprovision of off-farm income earning opportunities forpoor farmers; (ii) greater integration of rural areas intoregional (meaning regions within the PRC) and nationalmarkets; (iii) expanding opportunities for the westernregion to trade with Central and Southeast Asia; and (iv)ensuring greater equity in access to financial and humancapital and natural resources.
Second, there is considerable scope for improvements ingovernance to hasten poverty reduction. This wouldreduce the leakage of targeted poverty reduction fundsaway from the rural poor. It would induce more efficientand effective use of limited financial and human resourcesby the cash-strapped lower levels of government. Newmoves since 2001 to “listen to the voices of the poor”through participatory village development planning willcontribute to the dynamics driving good governance.
For the urban poor, improvements in governance areplaying, and will continue to play, a more prominent role.Progress is being made with extending the coverage, andbuilding the sustainability, of social welfare safety nets. Anexample of this is the increase in coverage of theMinimum Living Standard Scheme (MLSS) from 4 millionurban poor at the beginning of 2001 to over 21 million inthe first half of 2003. Regulatory barriers that impede theaccess of floating populations to urban commercialopportunities and social services, especially education andhealth services, are being lowered. More effective labormarkets are being developed, and re-training of laid-offSOE employees is being increased.
Thirdly, social development has provided the poor withenhanced human capital. Research in the PRC hasconsistently confirmed that education status is closelycorrelated with the incidence of poverty. An analysis ofdata collected in the NBS’s 1988 and 1995 ruralhousehold income surveys show a qualitative change inthe impact of education on rural poverty. In 1988, thepresence in the household of at least one adult withformal education, no matter to what level, was stronglycorrelated with a reduced poverty incidence. In 1995,however, lower rural poverty incidence shifted to beingclosely correlated with how many years an adult in the
household had received education. A recent researchpaper by the International Food Policy Research Institute(IFPRI) found that for the PRC, public investment ineducation had the highest returns in terms of povertyreduction.
The PRC’s policy on education has been to achieveuniversal education up to grade 9 - that is to the end ofmiddle school. Teaching resources and enrollments havebeen expanding at secondary school level while remainingrelatively static at the primary school level. Householdsocio-economic surveys conducted as part ofinfrastructure project preparation for ADB financing inthe PRC indicate the severe burden education fees andcontributions place on poor families. The high educationfee barrier is often given by poor rural parents as thereason their children have dropped out of school. Thesame surveys show that for the poor families, girls tend tobe withdrawn from school at an earlier age than boys. Thisexclusion of the young poor from obtaining a basiceducation is, in effect, condemning another generation topoverty.
Health is often both a cause and a result of poverty.Various socioeconomic studies at village level suggest thattime out from the production economy because ofsickness, or in order to perform care and reproductionroles, are closely correlated to the incidence of ruralpoverty. It is women primarily that perform these roles.Heavier physical and psychological burdens are falling onpoor women largely because of the feminization ofagriculture, and the additional time and effort needed indegrading environments to collect water, fuel, fodder, wildculinary plants and medicinal herbs and to graze animals.The result is a decline in women’s ability to performeffectively and efficiently in the care and reproductioneconomy. This decline often goes unseen by macro-planners because it is not captured by GDP or similareconomic aggregates. Other indicators of the health, suchas high Maternal Mortality Rate (MMR), Infant MortalityRate (IMR) and Reproductive Tract Infection Rate (RTI)among poor women, reflect the difficulties of their andtheir families’ escape from poverty.
Health sector studies have shown that the greaterproportion of the PRC’s infections and parasitic diseasesafflict the poor. Among the rural population, the poorestquartile suffers three times the infectious disease rate ofthe wealthiest quartile.
The primary obstacle to improved health among the poorappears to be user fee levels. For instance, pilot schemesin national minority counties have shown that where userfees for in-hospital birthing are waived for poor women,

118 Poverty Profile of the People’s Republic of China
the rate of homebirths, MMR and IMR all droppedsubstantially. Considerable scope exists to escalate the waron poverty by making primary and secondary health-careservices accessible to the poor in both rural and urban areas.
Fourthly, enhancing the physical capital accessible by thepoor opens up self-help opportunities for them to escapepoverty. The same IFPRI study found that among physicalinfrastructure options, public investment in roads had thehighest returns to poverty reduction (3.2 persons for every10,000 yuan invested).
The link between physical infrastructure development andpoverty reduction needs to be explained. A road investment,for instance, in an area with poverty concentrations is likelyto improve both agricultural and non-agricultural activityand expand off-farm employment. Poor farmers will havemore produce to sell and will earn more from off-farmwork. This is the direct income distribution effect. Inaddition, higher productivity and expanded employmentcontribute to economic growth. This in turn affects thesupply and prices of goods which the poor consume orsell. This is the indirect growth effect. The direct and indirecteffects combined allow the poor to increase their net incomeand raise their consumption levels, and thus move out ofpoverty.
The fifth important message to policy makers is that therevenue base of local governments, particularly in poorareas, is weak. Insufficient funds are available to pay salariesand deliver even the most basic services like health andeducation. Because of the mismatch between revenuesources and expenditure responsibilities, local governmentsrespond by levying many fees and charges. This is aregressive form of taxation, driven by a limited revenuebase. Pro-poor fiscal reform is required at the sub-provinciallevel that aligns revenues and expenditures, improves thegovernance and efficient use of fiscal resources and includesa targeted fiscal transfer component.
CROSS-CUTTING THEMES IN THEFIGHT AGAINST POVERTYThree crosscutting themes have added, and will continueto add, focus and effectiveness to the three pillarsunderpinning poverty reduction identified above - whichwere pro-poor economic growth, social development andgood governance. The first theme is the promotion of therole of the private sector. One of the primary causes ofurban poverty has been loss of employment. Between1996 and 2000, SOEs and urban collectives shed 47million jobs. Also during that period, the net growth in
the urban economically active population was at least 10million. Conversely, one of the primary factors reducingrural poverty has been access by at least one householdmember to off-farm employment, in many cases meaningmigrant labor to the economic powerhouse cities in theeastern region. Creating new jobs is a necessary pre-requisite to reducing both urban and rural poverty.
Urban employment has been growing at an average of2.4% per annum since 1994. Pertinent to povertyreduction is the fact that the dynamics of employmentgrowth have changed. Over this period, the state andcollective sectors have been shedding jobs, and since 1997,have been doing so at an accelerated rate. It has been theprivate and mixed ownership sectors that have generatednew jobs, not only soaking up the majority of thosedisplaced from the public sector, but also achieving amodest net increase in total urban employment.
The PRC’s macroeconomic policies, legal frameworks andurban safety net systems have progressively placed moreimportance on growth of the private sector. This theme isnow part of the Government’s vision for the future.
The second crosscutting theme that sharpens povertyreduction focus is the pursuit of environmentalsustainability. Decelerating success rates havecharacterized the history of rural poverty reduction in thePRC as simpler forms of poverty were resolved and themore inextricable forms remained. This is reflected inFigure 36 which shows how, on a three year rolling basis,the annual outlay on targeted rural poverty reduction perrural person freed from poverty has doubled in real termsover the 8-7 program period (1994-2000). Much of theremaining rural poverty is linked to poor and oftendegraded environments – increased land degradation,high altitudes, steeply sloping lands, poor soils in karst andloess country, increased frequency of floods, extendedperiods of drought, reduced quality of water, and growingdeserts.
PRC has over 2000 years of history of taming nature on agargantuan scale. Today’s leaders of the PRC are noexception. Blanket policies to ban logging and returnsteeply sloping lands to forest are being strictlyimplemented. Massive schemes are underway to reforestbare hills and loess slopes and plant special grasses thatwill reverse desertification. Major water controlinfrastructure has been built on both the Yangtze andYellow Rivers. A scheme will divert large volumes ofwater from the Yangtze to the Yellow River in the northwhere dryness has been a major constraint ondevelopment. Donors, on a much more modest scale,

Conclusions and Recommendations 119
have been assisting the PRC’s efforts in targetingenvironmental sustainability.
The third crosscutting theme that can sharpen povertyreduction efforts is regional cooperation and integrationfor development. Most of the rural poor are located in thewestern region. Producers in the west have a locationaldisadvantage in terms of transport costs, compared to thecentral and especially the eastern region in accessingglobal markets and the rich domestic markets along theeastern seaboard. For the western region, greatercooperation and integration with the markets in SoutheastAsia and Central Asia and, in the longer term, South Asiaprovide a platform for growth. In the west, such growthwill expand demand for the produce of the rural poor andgenerate employment opportunities for both the urbanand rural poor. The Government has recognized this andthrough participating in multilateral forums, pursuingbilateral trade diplomacy and building infrastructure isputting in place a framework for enhanced regionalcooperation and integration. Donors are financingprojects and programs to support the establishment ofthis framework.
THE WAY FORWARD
The PRC Government is very committed to reduce anderadicate remnant and relatively inextricable rural povertyand the more recent blight of urban poverty. Relevantstrategies and targets are contained in the Tenth Five YearPlan (2001-2005) and the Outline for Poverty Alleviation andDevelopment of China’s Rural Areas (2001-2010). The mix ofstrategies tightens focus, attacks underlying causes likeenvironmental degradation, seizes on employmentgeneration as a primary and immediate poverty reductionweapon, supports upgrading of education levels as afurther weapon, capitalizes on the motive force of thepoor themselves, allocates considerably more resourcesinto poverty reduction, and strengthens and extendswelfare safety nets to help those who cannot, temporarilyor permanently, help themselves.
Between 2001 and 2005, 16.5 million hectares of
grassland will be resuscitated to prevent desertificationand soil erosion will be brought under control reducingpoverty in remote and mountainous areas, minority areasand old revolutionary base areas. Five hundred and ninetytwo countries have been designated by the nationalgovernment as key counties for poverty reduction anddevelopment work. Official area planning and resourceallocation will be integrated with the new participatorypoor village development planning process. Off-farmincome opportunities for the rural poor will be expandedthrough the development of small towns. Demand for theproduce of the poor will be increased by promotingindustries which process, store and transport agriculturalproducts. Access to markets will be improved byconstructing infrastructure, particularly in the West. Thisoverall thrust will be underwritten with greaterGovernment grants and credits.
In its fight against urban poverty, the Government has setitself ambitious targets to be achieved by 2005 ingenerating sufficient new urban employmentopportunities to limit unemployment. Private sector,labor-intensive businesses will be promoted, especially inthe tertiary sector. Barriers will be lowered, and incentivesoffered, to people wishing to start their own businesses.The present system of skills retraining of displacedworkers and re-employment centers will be expanded.Urban living standards will be augmented in terms ofaccess to housing, education and health. Particular effortswill be directed at creating a sound and sustainable socialsecurity system that can support those withunemployment, medical, pension, old-age and disabilityneeds.
While the Government is mobilizing its own resources ina focused fight against poverty, it is also reaching out forsupport from NGOs. The Government welcomes anexpansion in the role of NGOs in the area of povertyreduction. The Government is also seeking enhancedcooperation with international donors, both official andnon-government, to add value to the nation’s povertyreduction program, not only by supplying financial andexpert resources, but also by proposing and testinginnovative methodologies.


Appendixes 121
APPENDIX 1: REGIONAL CHARACTERISTICS FROM YEAR 2000 NBS RURALHOUSEHOLD SURVEY
Table A1.1: Per Capita Net Income by Region (all sampled households)
Region Net cash income (CNY) Net income (CNY) Proportion of net cash income to totalnet income (%)
National TotalEastern PRCBeijingFujianGuangdongHainanHebeiJiangsuLiaoningShandongShanghaiTianjinZhejiangCentral PRCAnhuiHeilongjiangHenanHubeiHunanJiangxiJilinShanxiWestern 12 PRCGansuGuangxiGuizhouInner MongoliaNingxiaQinghaiShaanxiSichuanChongqingTibetXinjiangYunnan
1,649
4,2532,8102,9231,6781,9022,8171,9312,0865,1502,9863,889
1,3421,2771,2561,4671,5931,4381,2281,387
xx8871,318xx7651,4081,294xx9611,0571,2031,123xx9481,081xx936
2,253
4,6053,2303,6542,1822,4793,5952,3562,6595,5963,6224,254
1,9352,1481,9862,2692,1972,1352,0231,906
1,4291,8651,3742,0381,7241,4901,4441,9041,8921,3311,6181,479
73
9287807777788278928291
6959636572676173
627156697564736359716763

122 Poverty Profile of the People’s Republic of China
Region Net cash income (Yuan) Net income (Yuan) Proportion of net cash income to totalnet income (%)
National TotalEastern PRCBeijingFujianGuangdongHainanHebeiJiangsuLiaoningShandongShanghaiTianjinZhejiangCentral PRCAnhuiHeilongjiangHenanHubeiHunanJiangxiJilinShanxiWestern 12 PRCGansuGuangxiGuizhouInner MongoliaNingxiaQinghaiShaanxiSichuanChongqingTibetXinjiangYunnan
xx814
1,4291,5441,319xx8681,3091,4581,1231,2461,7491,7171,340
xx974xx728xx8521,015xx469xx825xx919xx921
xx517xx690xx473xx855xx492xx463xx672xx575xx579xx736xx565xx436
1,327
1,9401,8191,9171,2811,8942,0401,4571,7902,0452,3131,846
1,5331,4791,4601,644xx9551,3021,6401,396
xx9851,097xx9631,416xx806xx8711,0401,1471,2301,062xx982xx861
61
7485696869717770867473
6449586249635666
526349606153655047695851
Appendix 1 TableA1.2: Per Capita Net Income by Region (households with per capita living consumption expenditure less than 860 yuan)

Appendixes 123
Appendix 1 Table A1.3: Infrastructure Conditions by Region (%)
Region
Proportion of villages Proportion ofhouseholds able
to drink safewater
Connectingto highway With phone Using
electricity
<2 Km awayfrom the nearestprimary school
<2 Km away fromthe nearest medical
clinicNational TotalEastern PRCBeijingFujianGuangdongHainanHebeiJiangsuLiaoningShandongShanghaiTianjinZhejiangCentral PRCAnhuiHeilongjiangHenanHubeiHunanJiangxiJilinShanxiWestern 12 PRCGansuGuangxiGuizhouInner MongoliaNingxiaQinghaiShaanxiSichuanChongqingTibetXinjiangYunnan
95
1009998
1009594999895
100100
9594939799949996
899486849889919693949597
87
10099
1006098
10097
100100100100
10087
1009096979187
768039589336897489107390
98
10010010096
100100100100100100100
100100100100100100100100
95989686
10089999999589996
86
8395929698869287409780
9488977687968895
888675749578947973657785
65
7176774778787476787572
7467745768696868
595251397041686259404244
65
9855726887839174999775
6675574952548475
4555307767535355429
7352

124 Poverty Profile of the People’s Republic of China
Region
Proportion of villages Proportion ofhouseholds able
to drink safewater
Connectingto highway With phone Using
electricity
<2 Km awayfrom the nearestprimary school
<2 Km away fromthe nearest clinic
National TotalEastern PRCBeijingFujianGuangdongHainanHebeiJiangsuLiaoningShandongShanghaiTianjinZhejiangCentral PRCAnhuiHeilongjiangHenanHubeiHunanJiangxiJilinShanxiWestern 12 PRCGansuGuangxiGuizhouInner MongoliaNingxiaQinghaiShaanxiSichuanChongqingTibetXinjiangYunnan
x93
100100100100x91x91100x98
100100
x94x94x92100x93x91x96x96
x90x95x76x89100x92x90x95x90x98x97x96
x77
100100100x63x97100100100
100100
100x77x98x82x87x91x89x78
x63x76x34x70x73x36x86x71x81xx6x64x90
x97
100100100100100100100100
100100
100100x99100100100100x99
x95100x96x93100x90x99x98100x50100x94
x87
100x50x50100x98x86x88x83
100100
x94x83x96x91x80x91x86x92
x84x84x70x89100x72x95x78x69x77x83x83
57
5050x03872836563
8550
8160715653706462
515546395538595448503139
58
9353677885839268
9667
7176544532628971
385021865355524526x56844
Appendix 1 Table A1.4: Infrastructure Conditions by Region (%)(households with per capita living consumption expenditure less than 860 yuan)

Appendixes 125
Illiterate orsemi-illiterate
PrimarySchool
Junior middleschool
Senior middleschool
Specialsecondary
school
College andabove
Enrollmentrate of
children aged7-15 (%)
Person/100 labor-aged adultsNational TotalEastern PRCBeijingFujianGuangdongHainanHebeiJiangsuLiaoningShandongShanghaiTianjinZhejiangCentral PRCAnhuiHeilongjiangHenanHubeiHunanJiangxiJilinShanxiWestern 12 PRCGansuGuangxiGuizhouInner MongoliaNingxiaQinghaiShaanxiSichuanChongqingTibetXinjiangYunnan
8.1
1.95.84.37.02.76.52.25.44.11.86.6
11.72.86.15.83.46.84.23.2
20.95.4
21.47.7
19.532.59.68.46.2
63.59.1
17.6
32.2
11.834.933.126.025.028.926.926.024.929.737.1
30.029.723.232.734.037.031.925.7
28.736.039.731.730.334.427.441.443.433.446.245.3
48.1
59.646.449.049.858.051.559.452.648.855.344.3
49.656.857.649.348.945.053.660.2
36.947.434.048.139.127.050.243.242.92.8
35.931.4
9.3
18.19.7
10.015.712.310.68.3
12.812.810.19.8
6.68.3
11.010.011.59.38.69.1
11.78.93.3
10.19.15.3
11.15.85.70.26.54.6
1.8
6.22.53.11.41.51.82.52.67.42.21.8
1.61.91.71.81.81.71.41.6
1.32.11.41.91.50.71.11.11.50.01.71.0
0.5
2.50.60.60.20.50.70.80.72.10.90.4
0.50.60.40.30.50.30.50.2
0.50.20.20.50.50.10.70.20.3
0.60.1
94
9897969398969597969598
9591959596939296
949392919082969595489888
Appendix 1 Table A1.5: Education Attainment by Region (all sampled households)

126 Poverty Profile of the People’s Republic of China
Specialsecondary
school
Senior middleschool
Junior middleschool
PrimarySchool
Illiterate orsemi-illiterate
Enrollmentrate of
children aged7-15 (%)
Person/100 labor-aged adultsNational TotalEastern PRCBeijingFujianGuangdongHainanHebeiJiangsuLiaoningShandongShanghaiTianjinZhejiangCentral PRCAnhuiHeilongjiangHenanHubeiHunanJiangxiJilinShanxiWestern 12 PRCGansuGuangxiGuizhouInner MongoliaNingxiaQinghaiShaanxiSichuanChongqingTibetXinjiangYunnan
13.2
11.19.0
13.910.7
3.38.52.56.7
16.72.16.0
12.43.17.46.3
10.17.25.24.3
27.68.4
25.27.1
33.335.611.113.1
8.669.710.225.1
35.6
13.339.643.023.427.934.033.930.350.035.036.8
30.932.325.242.741.641.735.530.2
29.544.342.136.736.335.929.044.748.628.454.649.0
44.9
57.844.840.555.359.751.558.753.133.356.450.0
51.560.258.242.939.946.053.759.1
33.941.430.248.624.824.951.138.340.2
1.730.823.2
6.3
17.86.72.5
10.79.16.05.09.90.06.67.1
5.24.39.28.18.45.15.66.4
9.15.92.57.65.73.78.73.92.70.24.42.8
1.1
0.02.20.60.60.90.81.71.5
16.71.21.7
1.71.71.61.20.41.11.20.9
0.71.70.70.81.70.91.20.91.40.01.30.3
91
10086938998949195
8594
9286949392879594
918988908285969392439783
Appendix 1 Table A1.6: Education Attainment by Region(households with per capita living consumption expenditure less than 860 yuan)

Appendixes 127
APPENDIX 2: DETAILED PROFILE OF URBAN RESIDENTS WITH PERCAPITA ANNUAL CONSUMPTION EXPENDITURE LESS THAN 2,310 YUANAND URBAN NON-POOR WITH ANNUAL EXPENDITURE GREATER THAN2,310 YUAN
From NBS Urban Household Survey of 1998
Appendix 2 Table A2.1: Proxy for PRC Urban Poverty Distribution in 1998
Non-Poor Poor Total Poverty Rate (%)AreaEast Area 47.4 43.4 46.9 10.00West Area 35.5 37.5 35.8 14.33West Area 17.1 19.1 17.3 11.96Total 100.00 100.00 100.00 11.87
SexMale 49.57 48.71 49.46 11.69Female 50.43 51.29 50.54 12.05Total 100.00 100.00 100.00 11.87
Age0-14 15.36 18.54 15.75 13.9715-64 78.35 75.22 77.96 11.45>64 6.29 6.24 6.29 11.78Total 100.00 100.00 100.00 11.87
EducationUniversity 5.46 1.59 4.98 3.79College 11.23 5.30 10.49 6.00Special or Technical School 11.71 7.52 11.19 7.98Senior High School 23.24 21.72 23.05 11.19Junior High School 27.78 34.34 28.60 14.25Primary School 15.24 20.01 15.83 15.00Other 5.34 9.52 5.86 19.28Total 100.00 100.00 100.00 11.87

128 Poverty Profile of the People’s Republic of China
Appendix 2 Table A2.2: Proxy for PRC Urban Poverty Distribution in 1998 (cont’d)
Non-Poor Poor Total Poverty Rate (%)
Industry
Farming, Forestry, AnimalHusbandryand Fishery
0.52 0.48 0.52 10.96
Mining and Quarrying 1.23 1.49 1.27 13.93Manufacturing 18.10 18.34 18.13 12.01Production and Supply of ElectricPower, Gas and Water
1.33 0.99 1.29 9.11
Construction 1.96 1.71 1.93 10.52Geological Prospecting and WaterConservation
0.72 0.65 0.71 10.87
Transport, Storage, Postal andTelecommunication Services
3.86 3.12 3.77 9.82
Wholesale & Retail Trade andCatering Services
6.55 8.00 6.73 14.11
Finance and Insurance 1.66 1.02 1.58 7.66Real Estate 0.48 0.35 0.46 9.03Social Services 3.83 4.27 3.88 13.06Health Care, Sports and SocialWelfare
3.21 1.77 3.03 6.93
Education, Culture and Arts,Radio, Film and Television
4.49 2.46 4.23 6.90
Scientific Research andPolytechnic Services
1.16 0.11 1.03 1.27
Government Agencies, PartyAgencies and Social Organizations
7.70 4.32 7.28 7.04
Others 43.19 50.92 44.15 13.69
Total 100.00 100.00 100.00 11.87

Appendixes 129
Non-Poor Poor Total Poverty Rate (%)Employment StatusState-Owned 45.16 35.31 43.94 9.54Collective-Owned 6.68 9.41 7.02 15.91Joint-Venture or Foreign Owned 1.57 0.48 1.43 3.98Private Owned or Self-Employed 1.40 2.89 1.59 21.58Private Owned, Employed 0.84 1.27 0.89 16.94Retirees Re-Employed 1.70 0.47 1.55 3.60Other Employment (e.g. babysitter) 0.28 0.76 0.34 26.53Retirees 13.51 9.56 13.02 8.72Disabled Workers 0.21 0.76 0.28 32.22Household Workers 1.18 3.64 1.48 29.19
Waiting for Jobs 1.66 4.93 2.06 28.41Waiting for Job Assignments 0.18 0.38 0.20 22.55Students 20.20 21.02 20.30 12.29Waiting for Entry to Higher Education 0.04 0.06 0.04 17.81Others 5.40 9.05 5.85 18.36Total 100.00 100.00 100.00 11.87
OccupationSenior Engineer 0.55 0.11 0.49 2.66Engineer 4.31 1.23 3.93 3.72Assistant Engineer 4.16 2.03 3.90 6.18
Technician 3.49 2.26 3.33 8.06
Above Middle - Level Cadre 0.06 0.05 0.00Section Chief Cadre 0.84 0.23 0.77 3.55Sub-Section Chief Cadre 3.86 1.62 3.58 5.37Staff Members 13.54 9.87 13.08 8.96Staff Members in Commerce 3.95 5.96 4.20 16.84Staff Members in Services 3.56 4.59 3.69 14.77Workers in Agriculture, Forestry, AnimalHusbandry, Sideline, Fishery
0.07 0.09 0.07 15.26
Workers and Staff-Members inProduction and Transportation
18.63 21.48 18.98 13.43
Workers Unclassified 42.99 50.55 43.93 13.66Total 100.00 100.00 100.00 11.87
Appendix 2 Table A2.3: Proxy for PRC Urban Poverty Distribution in 1998 (cont’d)

130 Poverty Profile of the People’s Republic of China
Non-Poor Poor TotalNumber of Household (HH) Members 3.09 3.60 3.14Number of Income Earners in the HH 2.20 2.19 2.20Number of Household Members Employed 1.80 1.85 1.80
Disposable Income 6405.26 2810.43 6032.58Wages from State Owned Enterprises 3831.70 1570.75 3597.30Wages from Collectively-Owned Enterprises 403.44 319.72 394.76Wages from Joint-Venture or Foreign OwnedEnterprises
222.51 28.06 202.36
Net Income from Private Business 108.23 116.12 109.05Income from Employment by PrivateBusiness
49.10 36.16 47.77
Income of Retirees Re-Employment 76.40 10.94 69.61Income from Employment of Other Types 8.75 13.08 9.20Income from Other jobs 170.49 157.56 169.15Income from Property 166.43 51.74 154.54Income from Current Transfers 1406.84 516.06 1314.49Other Income from Family Side Products 2.48 6.17 2.86
Living Expenses 5256.48 1790.46 4897.15Amount Spent on Food 2307.47 1026.42 2174.66Amount Spent on Clothes 548.90 184.48 511.12Amount Spent on Articles of Daily Use,Durable, Service
457.88 63.91 417.03
Amount Spent on Healthcare, MedicalTreatment and Medicines
242.25 71.36 224.54
Amount Spent on Transportation andTelecommunication
327.00 65.11 299.85
Amount Spent on Entertainment, Educationand Culture
600.35 132.73 551.87
Amount Spent on Living 522.00 193.79 487.97Other 250.84 52.07 230.24
Appendix 2 Table A2.4: Proxy for PRC Urban Poverty in 1998 (cont’d)Unit: Person per Household

Appendixes 131
APPENDIX 3: ADB ACTIVITIES IN POVERTY REDUCTION IN THE PRC
Since the end of 1998, ADB has supported poverty strategyimplementation through the following knowledge products:
TECHNICAL ASSISTANCE ACTIVITIES
Poverty Reduction Strategy and DevelopmentPlanning
TA 3610-PRC: Preparing a Methodology for Development Planningin Poverty Blocks under the New Poverty Strategy of PRC: Themain objective of the TA was to develop a multidimensionalpoverty planning methodology for county poverty reductionplanning and develop guidelines on how to make suchpoverty plans. The TA included developingrecommendations for a poverty reduction planningmethodology, including (i) planning techniques; (ii) needsanalysis; (iii) working with local governments; (iv)monitoring indicators; and (v) financial and institutionalimplications. The TA was also to provide training to nationaland local poverty reduction officials on the methodologiesand guidelines for poverty reduction planning. The resultingmethodology was adopted as official government policy in2001. The methodology contains three major parts: poorvillage identification, poor village development planning,and county-based poverty reduction planning. For the new592 key counties (which replace the previous 592 povertycounties), the most challenging issue is how to target thepoor areas within each county. To avoid previous problemof flawed targeting within the county, the criteria forselecting poor villages was defined by assessing each village’ssituation through a participatory process whereby villagersdescribed the key effects of poverty in their village andcounty. A system of weighting the indicators was developedto create an integrated village poverty index. Each countyis free to choose eight indicators (within the required threetypes, i.e., income and quality of life; access to infrastructure;and social development) and the weights according to itsown situation. All villages within the county must use thesame indicators and weights to determine poorest villagesin the county.
TA 4158-PRC: Participatory Poverty Reduction Planning for SmallMinorities : The purpose of the TA is to apply themultidimensional and participatory poverty planningmethodology developed under TA 3610-PRC (and otherbest international practices in participatory planning) to thePRC’s 22 smallest minority groups and develop a plan(including minority-specific policies) to reduce their
poverty and to protect their cultures that is realistic andachievable, given government budget commitments andconstraints. The main output, the final report, will be theconsolidated plan with policy recommendations.
TA 3468-PRC: Policy Support for PRC 2020 Project (Phase III):The objective of the TA was to help formulate a long-termdevelopment strategy for the Western region that providedpolicy directions for development planners at the nationaland local levels. In 2000, the NPC endorsed the proactive“Great Western Development” strategy to promoteeconomic growth and sustainable development in theWestern region. The TA was the third phase of ADB’sassistance for the PRC 2020 Project, designed to reviewand investigate long-term development issues and prospectsof the PRC in the year 2020. ADB’s assistance identifiedseveral challenges to be tackled during the period up to2020. Among the issues, those relating to growing regionalincome disparities, unbalanced regional development anddeteriorating/depleting natural resources were of particularconcern to the Government.
Recommendations for social and rural developmentincluded: (i) Central Government funds for health welfareprograms should work within strict criteria to ensure thatthey benefit the neediest sections of the community; (ii)since the incidence of rural poverty has fallen, theGovernment should progressively move from targetingpoor areas (poverty counties), a policy appropriate fordealing with mass poverty, to targeting poor households;(iii) western region villages have very inferior infrastructure.Local governments should assess which villages have a long-term future and which do not. Resettlement programs thatare carefully planned with significant beneficiaryconsultation are then needed; (iv) apart from villageinfrastructure, rural development programs should givepriority to agricultural research and extension, education,and health services; (v) lower priority should be given toinfrastructure investments in irrigation and transport otherthan village connections; and (vi) government lump-sumtransfer payments should play the leading role in povertyalleviation in the Western Region. The study will help togive substance to the “Great Western Development”strategy and some of the key results are being reflected inthe PRC’s Eleventh Five Year Plan.
TA 3279-PRC: Development of Economic Laws: In the widercontext of establishing a legal system that reinforces amarket economy, the ADB provided TA to help the PRC

132 Poverty Profile of the People’s Republic of China
draft a number of economic laws, including the Trust Law.The Trust Law took effect on 1 June 2001. Trusts emergedfrom the requirements of commerce and propertymanagement in common law countries. A trust providesan arrangement by which a person (individual or legal) canlet another person manage her/his/its property for thebenefit of designated persons. As well as meeting a rangeof common needs in commerce, trusts provide a legal basisfor entrepreneurs and others to set up charitablefoundations. Chapter V of the Trust Law defines thepurpose of trusts for charity and public interests as includingpoverty relief, emergency relief, assistance to the disabled,development of education, science and technology, cultureand sports, development of medical and health welfare,and protection of the environment. As in common lawmarket economies, it can be expected that the Trust Lawwill provide the private sector with a vehicle for mobilizingresources and directing them at social development,including poverty reduction. To help improve the povertydimensions of the legal/regulatory framework, this TAsupported the formulation of regulations governing privatefoundations and legal aid which were adopted by theGovernment. This work helped to provide the legal/regulatory framework to mobilize private sector resourcesto fight poverty.
Rural
TA 3150-PRC: Study on Ways to Support Rural Poverty ReductionProjects: The rural poverty study financed under this TAexamined microfinance, agro-industry, rural infrastructure,and voluntarily resettlement as poverty reduction tools thatcould be supported by international donors. It concludedthat ADB’s comparative advantages go beyond the provisionof regular lending. ADB can engage the Government inpolicy dialogue to assist with the development of moreeffective poverty reduction programs; supplementbudgetary allocations; “crowd in” and “leverage in”domestic and foreign resources from government, otherdonors and the private sector; and provide TA. ADB’sprojects can also be used as the arena for testing policy andimplementation mechanisms, support more difficult policychanges such as the abolition of subsidized lending, andprovide sufficient funding for roll-out of experience gainedby bilateral donors and UNDP that is beyond the resourcesof most other donors.
Under the TA, a high-level international povertyconference, cosponsored by the Government, ADB,World Bank (WB), and United Nations DevelopmentProgamme (UNDP), was convened in May 2000. The
main objective of the conference was for key domestic andinternational organizations and experts to makerecommendations to LGOP on its future poverty strategy.The conference was convened by then Vice Premier (nowPremier) Wen Jiabao who also headed LGOP. Twenty-twovice ministers and vice minister-level officials representingLGOP’s membership attended the conference. Around 15internationally and domestically renowned poverty expertsalso attended. Several recommendations of the conference,including some suggestions made by ADB, have beenincorporated into LGOP’s new poverty strategy. Examplesinclude looking at poverty more broadly and increasingparticipation of civil society and villagers.
In November 2002, a second set of high-level talks wasconvened in Guangxi in which senior officials of theprovincial and regional poverty and minority affairs offices(from the 12 western provinces, municipalities, andautonomous regions along with Fujian and Heilongjiang)assembled to comment on ADB’s strtegy for operations inPRC with special focus on poverty reduction. Local andinternational NGOs were also consulted on the sidelinesof the workshop. All parties supported the strategy andpoverty focus noting that ADB had a good command ofthe key strategic development and poverty reduction issuesfacing PRC. Loans can be used or poverty reduction ifproperly focused and designed, however more work needsto be done on how to integrate ADB loans into povertyreduction efforts. ADB focus on rural infrastructure isconsistent with Government priorities where such focus iskey to poverty reduction efforts.
A high-level International Conference on NGO PovertyReduction Policy was convened under the TA in October2001. It was co-sponsored by the CFPA, ADB, FordFoundation, UNDP, WB, the Mercy Corps, IFAD, andlocal NGOs. In a significant policy development, theGovernment recognized a key role for NGOs in its Ten-Year Poverty Reduction Strategy, approved in 2001. TheGovernment recognizes that NGOs can play animportant role in the country’s development by bringingspecialized knowledge, technical expertise, researchcapacities, local contacts and community support to theprocess. NGO participants at the conference cited severalfactors limiting their effectiveness. These include a lackof funding, inadequate training, a inco_mplete legalframework for NGOs, difficulties in registeringinternational NGOs, and problems in recruiting andretaining qualified staff. To address these and otherconcerns, they advocated better information sharing toidentify potential partnerships, direct funding from the

Appendixes 133
Government and international agencies, and adoption oflaws that give local NGOs clear legal standing to raise funds,cooperate with foreign organizations, and carry out theiractivities. They also called for giving a greater voice to thepoor, more research on the requirements of the poor indifferent regions, and greater support from internationalNGOs and donors in skills transfer and development ofhuman resources.
The TA includes conducting applied research through asmall pilot project in which a poor village in Nayong Countyof Guizhou Province has received a small access road,electricity, water supply, and irrigation system. The pilotproject involves designing and implementing a mechanismfor measuring the effects of such infrastructure on reducingpoverty, including the use of a carefully selected controlvillage. The goal is to analyze the impact of providing ruralinfrastructure on poverty reduction. To date, farmers inthe villages report increased incomes and quality of lifebecause the new road helps them to reach markets and theelectricity and water supply help them run agro-processingbusinesses. The pilot project is ongoing and a monitoringand evaluation (M&E) system of its impacts is beingimplemented with the assistance of local NGO andpreviously a United Nations volunteer (UNV). Such benefitswill continue to be monitored and evaluated over the nextseveral years. An important lesson learned from the pilothas been the importance of regular maintenance. Villagersrealized this after some of the infrastructure began todeteriorate due to neglect and was later addressed.
The International Institute for Rural Reconstruction (IIRR),an international NGO based in the Philippines in 2000,provided training in March 2000 for senior PRC povertyreduction officials at the national and local levels ingovernment, nongovernment, and private sector approachesto poverty. Similar training was provided in Thailand in2002.
Domestic training was also organized under the TA.Leading poverty experts from PRC made presentations andconducted workshops in the areas of international povertytheory and practice, integrated agriculture development,poverty reduction in the Philippines, participatorymethodology and theory, participatory approaches in villageplanning, participatory methodology in gender developmentand social community development, microfinance,environment and poverty reduction, participatory planningin minority areas, NGO-supported communitydevelopment, and application of participatory methodologyin infrastructure works management.
TA 3607-PRC: Policy Support for Social Security Reform underTenth Five-Year Plan: The objective of the TA was to examineoptions and develop strategies for introducing unifiedpension and medical insurance schemes in rural areas. Theconsultants visited several provinces in the eastern regionand evaluated local pilot rural pension programs. Twoseparate reports for pension and medical insurance weregenerated and published. The report for rural medicalinsurance analyzed the survey of 10 rural countiesconducted by the Harvard School of Public Health forUNICEF and received wide policy and media attention. Aworkshop for senior policy makers on rural pension andmedical insurance was held.
Urban
TA 3377-PRC: Urban Poverty Study: This study was one ofthe most comprehensive attempts to define urban povertyin PRC. In the study, poverty lines are reported for each ofthe 31 PRC provinces and the reported national povertyline is the average of provincial poverty lines each weightedby the corresponding provincial population share. Thesalient feature of the provincial poverty lines is their widevariation, which suggests that one poverty line for wholecountry would distort the regional pattern of urban poverty.The provincial pattern of urban poverty suggests that thefocus of poverty alleviation for urban areas has to bedifferent from that for rural areas. A significant percentageof the non-poor urban population remains susceptible tofalling into poverty as a result of a relatively small reductionin income. The policy suggestion is that poverty alleviationmeasures should not be confined only to those living belowthe poverty line. It should also extend to the populationwith a high risk of falling into poverty. On average, thepoverty rate among migrants to cities is 50 percent higherthan that among permanent urban residents. But the gapbetween the two poverty rates varies widely across citiesand in some cities the poverty rate for immigrants is lowerthan that for permanent residents. The Government isusing this study to formulate policies on urban poverty.
TA 3148-PRC: Pension Reform: This is a continuation ofadvisory support sponsored by international pension assetmanagement and life insurance companies, whichconducted a comprehensive diagnostic study. The TAwas to support the formulation of the administrative,legal, regulatory, and supervisory frameworks for the newreformed pension system started by the Government in1995. An actuarial model developed under TA indicated

134 Poverty Profile of the People’s Republic of China
primary objectives of the TA are to (i) develop analyticaltools to assist in predicting the direct and indirect effectsof roads, (ii) identify the effective linkages between theexpressway investment and the flow of benefits to the poor,and (iii) strengthen a baseline socioeconomic assessmentframework to effectively monitor these linkages. Towardthis end, the TA has (i) quantified the macroeconomiceffects of road projects in PRC over the past two decades;(ii) developed a monitoring framework to evaluate anddetermine the extent to which expressway investmentscontribute to bigger access to opportunity for the rural poor;and (iii) designed indicators that can be monitored for theimpacts. The preliminary final report was submitted in April2003. A case study is being organized to field test theproposed indicators and hypothetical monitoringframework. The study team has already identified an ADB-financed project, Chu-Da Expressway in Yunnan, as thecase project for fieldwork. The fieldwork will be startedupon MOF’s endorsement. An internal workshop will beheld in Manila to disseminate the outcome of the TA whenfindings of the fieldwork are incorporated into the draftfinal report.
The main findings of the TA include: (i) Good roadspromote economic growth in both the farm and nonfarmsectors, generating opportunities for the rural population,including the poor; (ii) while many studies confirm theimportance of roads to poverty reduction, the size andnature of the poverty effects and the distribution of thebenefits among the poor and non-poor remain unclearbecause of a lack of well structured case studies; (iii)targeting interventions to local conditions and involvingthe participation of local communities increases thelikelihood of success of road projects; (iv) PRC roaddevelopment, together with investments in agricultureresearch, education, electricity and telecommunications,contribute to economic growth and poverty reduction; (v)given the significantly lower cost per km of constructingsecondary roads, their marginal impact per dollar ofinvestment on poverty reduction is greater than that offirst class roads. These findings confirm that it is importantthat ADB look at a package of feeder roads to complimentthe expressways. The TA developed a monitoringframework with designed indicators to evaluate the povertyimpacts on the rural poor from expressway construction.
(iii) Energy
TA 3369-PRC: Rural Electricity Supply Study: The aim ofrural electricity supply reforms is to ensure that rural
that the foreseen financial difficulty in next twenty or thirtyyears can be avoided under the current contribution rateand benefit level and the assumption that Government isable to continue to expand the pension coverage. Mostrecommendations were received favorably by the PRCGovernment and some were implemented as part of thepilot program in Liaoning Province.
TA 3733-PRC: Policy and Institutional Support for the SocialSecurity Reform Pilot Program: The TA is to improve thefinancial and social sustainability of the social securitysystem by helping implement the Task Force’srecommendations. Selectively, the TA will support the pilotprogram in Liaoning Province (see TA3148-PRC above),help replicate the finding of the pilot program nationwide,and assist National Council for Social Security Fund(NCSSF) to strengthen its institutional capability to managefunds raised for social security. The TA conducted actuarialanalyses of the basic pension system under the pilotprogram in Liaoning and helped strengthen administrativeand regulatory capabilities at provincial and local level.Advisory support was also given to investment of individualaccounts and the management information system. Theconsulting team also recommended administrative andregulatory reform measures aimed at integrating the socialsecurity administration for better institutional capabilities.The TA also assessed the organizational structure and itsfinancial and operational performances of the NCSSF.
Infrastructure
(i) General
TA 5947-REG: Assessing the Impact of Transport and EnergyInfrastructure on Poverty Reduction: Following an initial stagecomprising literature review and identification of knowledgegaps, Shaanxi Province, PRC was selected as one of threelocations for conducting retrospective country-levelresearch into the impacts of selected transport and energyinterventions on poverty reduction (research is also beingconducted in the state of Gujarat, India, and in Thailand).Past interventions being examined include provision of ruraland provincial roads, bus service improvements, new railwaydevelopment and upgrading of rural electricity supply. Fieldwork is underway, with country-level findings and a nationalworkshop planned. In the final stage of the regional TA(RETA), drawing upon the country-level research, an overallreport of findings will be prepared, and a workshop will beheld in Manila.
(ii) Transport
TA 3900-PRC: Socioeconomic Assessment of Road Projects: The

Appendixes 135
consumers benefit from increased and reliable electricitysupply, efficiency gains, and downward pressure onelectricity prices through improvements at all levels in therural power system. The TA will recommend a package ofreform measures and a plan for their implementation. Therecommended reforms will benefit the rural poor byproviding an efficient, sustainable rural electricity supplythat will provide the incremental electricity needed for ruraldevelopment and reduce line losses and rural tariffs. Ruraltariffs are significantly higher than urban tariffs. Aninternational seminar was held.
TA 3673-PRC: Pro-poor Heating Tariff Reforms: The TA willhelp the Government reform the urban heating sector andpromote sustainable urban heating supply by (i) formulatingpro-poor national heating tariff guidelines, and (ii)establishing an effective heating tariff collection mechanism.A growing concern is urban poverty due to the growingurban unemployment brought about by enterprise reformsand government downsizing. An increasing number of theurban poor depend on unemployment benefits to meet theirbasic needs. The tariff reforms required to sustain urbanheating supply will raise the level of heating tariffs andchange the collection mechanism that requires urbanresidents to pay according to their consumption. Althoughthe changes from enterprise-based to individual-basedpayment will be reflected in wage increases, the urban poorcould find it difficult to afford the rising heating costs andsurvive the cold winter in northern PRC. A pro-poor heatingtariff structure is required to ensure sufficient heat for theurban poor and to support the Government efforts in urbanpoverty reduction and social stability.
Monitoring and Evaluation
(i) General
TA 3441-PRC: Capacity Building for Social Assessments: TheTA is designed to build capacity of design and researchagencies at national and provincial levels to conduct socialassessments for development investments. This TA hadan in-country core team of specialists in socialassessments, for planning, M&E covering involuntaryresettlement, poverty, and gender. The core team,together with associated specialists, was intended toprovide advice to local government agencies, EAs andproject sponsors for development projects, focusinginitially on those financed by ADB; and to makerecommendations on strengthening social assessments.The Government approved the publication “Guidelinesfor Feasibility Studies of Investment Projects” in March2002, which incorporates social assessments into
feasibility studies for investment projects. A nationalworkshop cosponsored by MOF, the former SDPC, ADB,and the WB was held in April 2002. The Manual on SocialAssessment developed under the TA is being finalized andedited.
TA 6073-REG: Development Tools for Assessing the Effectivenessof ADB Operations in Reducing Poverty: The goal of the TA isto enhance ADB’s contribution to poverty reduction inDeveloping Member Coutries (DMCs). The purpose ofthe TA is to improve existing approaches and pilot testcustomized poverty monitoring and analytical tools toenable better understanding and measurement of theunderlying factors and mechanisms driving changes in theincidence and severity of poverty in selected DMCs. TheTA will develop these tools within the framework of thePRPAs, CSPs, and ongoing ADB projects or programs inselected sectors and countries. The TA will focus on someof the major ADB borrowing countries (although toolswill be designed with a view to general applicability). Thetools and approaches developed through the TA will fosterbetter identification, design, and monitoring of povertyreduction programs and projects, and thereby improve inthe effectiveness of ADB-financed poverty reductionefforts throughout DMCs. The implications of lessonslearned regarding the process, structure, and resourcerequirements for carrying out poverty impact assessmentwill be reviewed in the final TA report.
(ii) Poverty Statistics
TA 5917-REG: Building a Poverty Database: The TA aims tosupport ADB’s commitment to an accelerated program tostrengthen its statistical database on poverty. The specificobjective is to build a poverty database system in ADBbased, initially, on available data collected from ADB’spoverty assessment activities, and from the borrowingcountries and other international agencies. A povertydatabase was developed under the RETA which includespoverty and poverty-related indicators from 18 countiesand other statistical information pertaining to livingstandards. Data cleaning as well as the database refinementare ongoing. The final database will be organizedsystematically as a computerized system that can be easilyaccessed by ADB staff and external users through theInternet. The final draft of the monograph was entitled“Asian Drama: Revisited.” The concluding workshop washeld in Beijing.
TA 6088-REG: Strengthening and Collection of PurchasingPower Parity Data in Selected Developing Member Countries(DMCs): The objective of the TA is to strengthen and

136 Poverty Profile of the People’s Republic of China
build sustainable capabilities of National Statistical Offices(NSOs) of the participating DMCs for collecting the datanecessary to compile PPP-based comparisons for GDP andits main aggregates. The TA will cover 23 DMCs. TheDMCs will be divided into two groups: Group I DMCswill be invited to participate in the full round InternationalComparison Program (ICP) and Group 2 DMCs will beincluded in the harmonized ICP-CPI (Consumer PriceIndex) program based on a limited coverage approach. PRChas confirmed its participation as one of the Group 2DMCs.
Civil Society and Participation
TA 5894-REG: Facilitating Capacity Building and ParticipatoryActivities II (Voices of the Poor): Participatory rural and urbanpoverty assessments were undertaken. For the ruralassessment, discussions were held with the poor in NayongCounty in Guizhou Province where ADB has a pilot projectfor rural infrastructure. The participatory assessmentrevealed that the poor and the local government agenciesmandated to assist them have different perceptions on howpoverty should be measured, the causes of poverty, theconstraints to reducing poverty, what makes a successfulpoverty reduction project, and what constitutes effectiveM&E. The main recommendations flowing from thesedifferent perceptions relate to the need to (i) broaden thedefinition of poverty to be multidimensional; (ii) maketransparent the process and the people qualified to receivepoverty reduction assistance; (iii) revise governmentextension training for farmers to better address their needs;(iv) include education and health measures as key povertyreduction tools; and (v) allow NGOs to help implementand monitor poverty reduction activities.
For the urban assessment, discussions were held with thepoor in Beijing Municipality. The participatory assessmentrevealed that the poor and the local government agenciesmandated to assist them have no official poverty line totransparently identify the poor, need to address bothphysical and psychological difficulties, little reliance onNGOs and private sector support, and concentrate moreon food and shelter needs than on quality of life andemployment needs. In addition, the needs of migrantsfrom rural areas and divorced and widowed women withchildren are largely neglected. The mainrecommendations stemming from these conclusionsrelate to the need to (i) define urban poverty to includehousing, education, and health needs; (ii) increaseattention to helping the poor find employment and/oracquire the skills to do so; (iii) expand the social insurance
system; (iv) provide specific services to migrants; and (v)provide training to urban officials on how to incorporateparticipatory approaches in their work.
TA 6109-REG: NGO Partnerships for Poverty Reduction: Theoverall goal of the TA is the enhanced development oflong-term strategic partnerships with NGOs and govern-ments to achieve poverty reduction in the Asia and Pacificregion. The specific purpose of the project is the provi-sion of funding support to a limited number of NGOs inDMCs so that they might undertake innovative povertyreduction or other activities in key ADB sectors. The RETAwill provide direct financial support to NGOs for: (i) ef-fective implementation of demonstration or pilot povertyreduction activities in key ADB sectors as identified throughapproved ADB CSP documents; (ii) NGO capacity build-ing efforts such as the establishment of NGO Informa-tion Centers; (iii) NGO-Government-ADB discussions onnational and regional poverty reduction strategies; and (v)efforts/activities leading to the design, approval, and es-tablishment of an ADB direct funding mechanism in sup-port of NGO activities.
TAs with Other Strategic Objectives and Linkage toPoverty Reduction
TA3497-PRC: Global Environmental Facility Partnership on LandDegradation: The overall objective of the TA is to formulatea broad policy and strategy framework as the basis for aGEF/PRC Partnership on Land Degradation in DrylandEcosystems. The TA supported MOF in the developmentof a coordinated and integrated response to landdegradation and desertification in the arid, semi-arid, anddry sub-humid ecosystems of western PRC. The TAreviewed the Five-Year Plans of the Ministry of Agriculture(MOA), Ministry of Water Resources (MWR), StateEnvironmental Protection Administration (SEPA), andState Forestry Administration (SFA) and prepared a broadpolicy and strategy framework to guide the formulation ofthe Partnership prepared.
TA 3548-PRC: Preparing National Strategies for Soil and WaterConservation: The TA’s objective is to assist theGovernment in developing national strategies for soil andwater conservation. The TA aims to help to improve landand water resources management, and contribute topoverty reduction and economic development. The TAconducted assessment of losses due to all forms of landdegradation; assessment of best practices for soil andwater conservation; feasible alternative strategies, theircosts, and probable impacts; stakeholder consensus onpreferred strategies; preparation of strategy plan andshort-term action plan; institutional reform model;

Appendixes 137
monitoring and evaluation network; and commissionedpapers on priority issues. The final report drew attentionto the main barriers preventing the development of asustainable countrywide program to address landdegradation. A strategic planning framework wasrecommended to address these issues. Three workshopswere conducted to discuss aspects of the study, exchangeviews and obtain feedback from the experienced resourcepersons. A major output of the TA resulted from a detailedexamination of the water and soil conservation legislativeregime and eight associated primary environmental laws.
TA 3657-PRC:PRC-GEF Partnership on Land Degradation inDryland Ecosystems: The PRC/GEF Partnership Programseeks to (i) combat land degradation and reduce poverty inselected ecoregions of national and global significance; (ii)achieve global environmental benefits through conservationof biodiversity and carbon sequestration; and (iii) generatelessons on policies, institutional arrangements, andapproaches for integrated ecosystem management forwidespread replication. The TA recommended revisions tostrategy plans, policies, laws, and programs for integratedecosystem management in dryland areas of western PRC;a institutional structure for land degradation managementin western PRC; a Country Programming Framework (CPF)for OP12 for GEF consideration; a tentative 10-year publicinvestment package, consolidating all relevant priorityprojects; a consolidated register of projects from externalsources and pipeline projects and aid agency coordinationmechanism; and high-priority projects ready forconsideration as part of the 10th Five-Year Plan period orlater. The CPF was approved by GEF in October 2002.
TA 3663-PRC: Optimizing Initiatives to Combat Desertificationin Gansu Province: This TA helped the Gansu provincialgovernment develop policies and supporting strategies andprojects to improve natural resource management and fostersustainable development by controlling and preventingdesertification and enhancing oasis ecosystem in the NexiCorridor. The TA aims to ensure that such policies andstrategies will encompass the range of conditions indesertified areas as to generally apply to the entire HexiCorridor. The TA conducted a survey of the three riverbasins in the Hexi Corridor which has lead to a number ofopportunities for project and program interventions tocombat desertification. The detailed study of the priorityriver basin was then completed and assessed the impactsof various policies and development approaches on theenvironment and on the well-being of rural communities.The TA was completed in late 2002.
TA 3799-PRC: Western Area Human Resource Development : PRC’sexceptionally rapid economic growth since the end of the 1970shas not equally benefited all regions. The March 2000 sessionof the National People’s Congress endorsed the “go west”policy, a proactive strategy to promote economic growth andsocial development of the Western Region, and to narrow thegap between the western and eastern areas of the country.The TA will focus on Western Region capacity building andhuman resource development in the fields of developmentplanning and financial management of project activities. It willcover: (i) needs assessment and analysis, (ii) development ofdetailed strategy for institutional capacity building and humanresource development, and (iii) assistance in initiating theimplementation of relevant programs, including a broad corepilot and a focused pilot on education management oninnovation. The TA will cover: (i) needs assessment and analysis,(ii) development of a detailed strategy for institutional capacitybuilding and human resource development, (iii) advisoryservices to initiate the implementation of relevant programs.ADB and the ADB Institute in Tokyo will work jointly todevelop a human resource development program designed forkey government agencies.
TA 3806-PRC: Study on Foreign Capital Utilization for WesternRegion: To create an environment that will solicit moreprivate investment to the western region by assessing theinvestment potential, identifying current bottlenecks inattracting investments and determining the changes requiredin the existing policies and regulations. The TA will alsosupport training activities to improve the capacity of localgovernment officials who are responsible for managingforeign capital in the western region. One training seminarhas been organized for local government officials. Aninternational study tour will be organized before finalizationof the project.
TA 3958-PRC: Improving Basic Education In Underdeveloped Areasthrough ICT : The TA aims to advance policy dialogue on targetedand viable applications of distance education and ICT in theWestern Region to improve quality and equity in basiceducation, emphasizing advances within the 9-year compulsoryeducation system, literacy interventions, and related programs.The two objectives of the TA are to (i) undertake a broadassessment of and identify promising innovations and strategiesfor the applications of distance education and ICT in educationwith a particular focus on supporting access to quality UCEamong disadvantaged populations including minorities, women,and remote communities; and (ii) support a very modest andtargeted pilot testing of promising approaches and technologieswith a tight pro-equity focus.

138 Poverty Profile of the People’s Republic of China
TA 4118-PRC: Combating Severe Acute Respiratory Syndrome inthe Western Region: The TA’s goal is to effectively containSARS in the Western Region, preventing cross bordertransmission and developing capacity for rapid epidemicdetection and response. Toward this goal, the TA seeks tohelp contain the outbreak of SARS in the target provincesby strengthening local capacities for SARS prevention,surveillance, management, and mitigation, with a particularemphasis on quick action to protect front-line medicalworkers, the poor, and other at-risk groups. This will beaccomplished within a framework of close collaborationwith other domestic and international partners. Lessonscollected will be shared widely, to contribute to dialogueon measures to address public health system challenges,and present new models. The TA will build capacities ofprovincial and local governments and health units to planand implement comprehensive programs to combat SARS,and will provide urgently needed equipment and supplies,focusing on identification and prevention efforts. Inaddition to training for front-line health staff (vital tocontaining SARS), information, education, andcommunication (IEC) campaigns will raise public awarenessof SARS and key prevention measures. Support will belinked to efforts combining relevant ministries, NGOs,community groups, the private sector, and internationalorganizations, and will be provided through services andrelated facilities required to implement the TA and achievecapacity building objectives.
OTHER KNOWLEDGE PRODUCTS
Staff Consultancy: Analysis on PRC’s Urban Poverty: ADB andthe Development Research Center of the State Council ofPRC conducted a study on PRC’s urban poverty in 2000– 2001 which estimated that the urban poverty line ofurban residents in terms of per capita expenditure wasY2,310 in 1998. Urban poverty incidence rate was 11.9%under this expenditure-based poverty line. Though it is acommon practice by using expenditure figure instead ofincome figure to measure poverty line, it’s not inaccordance with the official statistical practice in PRCwhere expenditure figure is hard to find in local area. Thisstudy calculated an income-based poverty line which isequivalent to Y2,310 expenditure in urban PRC. Thestudy also provided some primary analysis on the basic
characteristics of the urban people with consumptionexpenditure less than Y2,310.
Staff Consultancy: Analysis on PRC’s Rural Poverty: Given theADB goal of targeting the rural population with annualper capita expenditure less than Y860 the study wascommissioned as expenditure data is not in accordance withthe official statistical practice of PRC where povertystatistics are given in terms of income. However, PRCconducts income and consumption surveys. The main taskof the study was to transfer the poverty line of Y860expenditure into equivalent value in income and to givesome primary analysis on the basic characteristics of thepeople with expenditure less than Y860.
University Intern Study: Rural Migrant Poverty in Beijing: The2001 Fafo Institute survey of labor mobility calculated thepoverty rate for Beijing residents at 8% compared to thatof rural migrants to Beijing at a large 25%. However, thesefigures only reflect differences in income poverty; disparitiesbetween the two groups are greater when non-incomepoverty indicators such as differential access to urbanbenefits as well as legal, economic and social marginalizationare factored in. The study proposed that these povertydifferentials reflect not only differences in human capitalendowments, but also institutional barriers that imposeadditional social mobility constraints on Beijing migrants.
University Intern Study: NGOs Role in Development and their LegalFramework in the PRC: The PRC is experiencing social andeconomic reform, within which NGOs, as one of criticalcomponents of civil society, could play a important role interms of representing civil rights and designing andimplementing projects in innovative ways. The Governmenthas recognized the role of NGOs in mobilizing resourcesfor development and already founded many massorganizations and social organizations to play this function.Some of them have had made some achievements, especiallyin poverty reduction, which has been recognized by theGovernment and some scholars. The study focused on thesituation of coexistence of top-down and grassroots NGOsand how the current legal framework favors the formerand constrains the latter. The study discussed why PRCneeds NGOs, their legal framework, and suggestions forinternational support.

Bibliography 139
BIBLIOGRAPHY
Asian Development Bank (ADB). 1997. PRC: Income Distribution Study. Manila.
______. 1998. Country Briefing Paper on Women in the People’s Republic of China. Manila.
______. 1999. ADB/TA 3150-PRC: A Study on Ways to Support Rural Poverty Reduction Projects. Manila.
______. 2001a. Asian Development Outlook (ADO). Manlia.
______. 2001b. Country Economic Review, People’s Republic of China. Manila.(Note this reference is based on the ec. Reportfor 2000).
______. 2001c. Urban Poverty in PRC. Manila.
______. 2002a. Country Economic Review, People’s Republic of China. Manila
______. 2002c. Asian Development Bank and the People’s Republic of China: Working Together to Reduce Poverty. Manila.
______. 2003a. Technical Assistance to the People’s Republic of China for Participatory Poverty Reduction Planning for SmallMinorities. Manila.
______. 2003b. Report on Rural Migrant Poverty. Unpublished. ADB, Manila.
Bloom. D.E., and P.N. Malaney. 1998. Macroeconomic Consequences of the Russian Mortality Crises, World Development26.
Chen, Muhua. 1997. Speech presented at National Conference on Women and Poverty Alleviation and Double Competition.Beijing.
China Daily. 2002. Creating new jobs remains a challenge. 7 February.
China Daily. 2002. Farmers’ pension in pipeline. 15 October.
China Daily. 2003. National to narrow gap between city and countryside. 9 January.
China Foundation for Poverty Alleviation. 2001. Paper presented at the Conference on NGO’s. Beijing. November.
Chinabrief. 1999. Vol. 2 (2), May. Beijing
Cook, Sarah. 2003. After the Iron Rice Bowl: Extending the Safety Net in China. In Cook, Sarah, Naila Kabeer and GarySuwannarat, Social Protection in Asia. (Study prepared for the Ford Foundation. Har-Anand Publications, New Delhi.)
Deaton, A. 2000. Counting the World’s Poor: Problems and Possible Solutions. Paper produced for the Research Programin Development Studies, Princeton University, New Jersey. New Jersey.
Department of International Development. 2000. Poverty Elimination and the Empowerment of Women. London.
Dollar, D., and Aart Kraay. 2000. Growth is Good for the Poor. World Bank Policy Research Working Paper No. 2587.Washington, DC.

140 Poverty Profile of the People’s Republic of China
Feuchtwang, S. 1995. Social support arrangements among households in rich and poor villages: Some preliminary results of an enquiry.In Krieg, R. and M. Schadler, eds. Social Security in the People’s Republic of China. Hamburg.
Government of the People’s Republic of China. 2001a. The Tenth Five Year Plan 2001-2005. Beijing.
______. 2001b. Outline of Poverty Alleviation and Development of China’s Rural Areas 2001-2010. Beijing.
Grossman, M., and L. Benham. 1980. Health Hours and Wages. In Jacobs, P. The Economics of Health and Medical Care: AnIntroduction. Baltimore: University Park Press.
Hussain, A. 2001. Draft Report on Poverty Profile and Social Security in China. London: Asia Research Centre LondonSchool of Economics.
Information Office of the State Council of the People’s Republic of China. April 2002. Labor and Social Security in China.Beijing.
International Finance Corporation. 2000. China’s Emerging Private Enterprises. Washington, DC: International MonetaryFund.
Jalan, J., and M. Ravallion. 1998. Are There Dynamic Gains from a Poor-Area Development Program? Journal of PublicEconomics 67: 65-85.
Kang, X. 1998. The Commentary on China’s Poverty Alleviation. Paper presented for UNDP Research Centre for Eco-Environmental Sciences. Beijing: Chinese Academy of Sciences. Beijing.
Kang, Xiaoguang. 2001. Research on NGO Poverty Reduction Behavior. Unpublished.
Khan, A.R., and C. Riskin. 2001. Inequality and Poverty in China in the Age of Globalization. New York: Oxford UniversityPress.
Leading Group on Poverty. White Paper- The Development-Orientated Poverty Reduction Program for Rural China. October. 2001.
Liu, J. 1994. Informal Finance in China. In Deng, Yingtao, et al., eds. Reform and Development in China: 1978-1990. HongKong: Oxford University Press.
Ministry of Civil Affairs. 2002. China’s Urban Poverty and the Minimum Living Standard Security Scheme. Beijing: Ministry ofCivil Affairs.
Murray, Bruce. 2002. PRC Projects for 2003 Target Poorer Provinces. Media release. 18 December. Beijing.
National Bureau of Statistics. 1997. China Statistical Yearbook 1997. Beijing: China Statistics Press.
______. 1998a. China Statistical Yearbook 1998. Beijing: China Statistics Press.
______. 1998b. Marked Achievement Made in Poverty Reduction in Rural China. Market and Demographic Analysis.Vol. 4, No. 6.
______. 2000a. China Statistical Yearbook 2000. Beijing: China Statistics Press.
______. 2000b. China’s Rural Poverty Monitoring and Evaluation Report 2000t. Beijing: China Statistics Press.
______. 2001a. China Statistical Yearbook 2001. Beijing: China Statistics Press.

Bibliography 141
______. 2001b. China’s Rural Poverty Monitoring and Evaluation Report 2001. Beijing: China Statistics Press.
______. 2002. China Statistical Yearbook 2002. Beijing: China Statistics Press.
Organisation for Economic Co-operation and Development. 2002. Overseas Development Flows to the People’s Republic ofChina. Available: http://www.oecd.org.
Park, A., and Q. Chang. 2001. Microfinance with Chinese Characteristics. World Development Vol. 29 (1): 39-62.
People’s Daily. 1998. 28 May.
______. 2003. January 9.
Pfeffermann, G. 2001. The Role of Private Enterprise in Reducing Poverty. Paper presented at The Asia and Pacific Forum onPoverty. Manila: Asian Development Bank.
Pouliquen, L.Y. 1999. Rural Infrastructure from a World Bank Perspective: A Knowledge Management Framework. Washington,DC.: World Bank.
Pruden, Mark. 2003. Draft of a Master’s thesis in progress.
Ravallion, M. 1994. Poverty Comparisons. Chur: Harwood Academic Publishers.
______. 2001. Measuring Aggregate Welfare in Developing Countries. How Well Do National Accounts and SurveysAgree? Policy Research Working Paper 2665, World Bank, Washington, DC.
Ren, Caifang, and Xiaojie Chen. 1969. Situation and Trend of Poverty in Urban China. Research Reference 65.
Riskin, C. 1994. Chinese Rural Poverty: Marginalized or Dispersed? American Economic Review, Papers and Proceedings84(2): 281-84.
Shen, H. 1997. The Delivery System of Poverty Alleviation and Self-organization. Sociological Research, No. 5.
Sheng, Laiyun. 2002. China’s Rural Residents with Consumption Less Than 860 Yuan: Targeting and Characteristics.Background Report for Rural Survey Organization of the National Bureau of Statistics and the Asian DevelopmentBank, Beijing.
Sobel, David. 2000. Key Issues on Supporting Poverty Reduction. Speech delivered to International Conference onChina’s Poverty Reduction Strategy in the Early 21st Century. May: ADB.
Spence, Jonathon D. 1991. The Search for Modern China. New York: W.W. Norton and Company.
State Council. 1994. Circular on Strengthening the Investigation and Control of Prices of Necessary Goods and Services.
State Statistical Bureau. 1997. Chinese Agricultural Yearbook, Beijing. China Statistics Press.
Tang, P., Laiyun Sheng, and Pingping Wang. 2001. Poverty Monitoring in Rural China. Statistical paper presented at theWorld Bank/PIDS workshop on Strengthening Poverty Data Collection and Analysis, Manila, 30 April – 3 May.
United Nations Development Programme (UNDP). 1997. China. Human Development Report. UNDP: Beijing.
______. 2003. Pro-Poor Micro Policies in China. Report prepared for UNDP Asia and Pacific Regional Workshop onMacroeconomics of Poverty Reduction., Katmandu, 4-6 January 2003.

142 Poverty Profile of the People’s Republic of China
The Economist. 1998. No job, no house, no welfare. 30 May.
Van der Tak, C.M. 2002. Study on Poverty and Environment in China. Report for the Royal Netherlands Embassy in China.February 2002.
Wang, P. 1999. Can China Escape Poverty by the End of the Century? Market and Demographic Analysis 1999 (7).
Wang, S. 1999. Microfinance Sector in China, Institute of Agriculture Economy, Chinese Academy of Agricultural Science,Beijing.
Wang, Yanzhong. 2002. Chinese Active Labor Policy and Urban Anti-Poverty. Paper presented at the Urban China Anti-Poverty Forum, Beijing, 12-13 December.
Wang, Youjun. 2002. Analysis of PRC’s Urban Poverty. Background paper prepared for the ADB, Beijing.
Wanmali, S., and Islam, Y. 1997. Rural Infrastructure and Agricultural Development in Southern Africa: A Center-Periphery Perspective. The Geographical Journal 163:259-269.
Weiss, John. 2001. Poverty in Western China: Exploring the Policy Options. Study prepared for the Asian DevelopmentBank Institute.
______. 2002. Explaining Trends in Regional Poverty in China. Study prepared for the Asian Development BankInstitute. December 2002.
Wong, Christine P. W., Christopher Heady, Wing T. Woo. 1995. Fiscal Management and Economic Reform in the People’sRepublic of China. Hong Kong: ADB.
Wong, Christine P.W. ed. 1997. Financing Local Government in the People’s Republic of China. Hong Kong: Oxford UniversityPress.
World Bank. 1992. China: Strategies for Reducing Poverty in the 1990’s. Washington, DC: World Bank.
______. 1994. World Development Report: Infrastructure for Development. Washington, DC: World Bank.
______. 2000. China: Overcoming Rural Poverty. Report No. 21105-CHA. East Asia and Pacific Region, RuralDevelopment and Natural Resources Unit. Washington, DC: World Bank.
______. 2001. World Development Report 2000/2001: Attacking Poverty. Washington, DC: World Bank.
______. 2002. Overseas Development Flows to the People’s Republic of China (On-Line). Available: http://www.worldbank.org/.
Wu, Guobao. 2001. The Tenth-Five Poverty Reduction Development Strategy of Rural China. Beijing: China Academy of SocialScience.
Wu, G. 1994. Goal Conflicts in Poor Areas: Growth, Budget Solvency, and Poverty Alleviation. Paper presented at theDiscussion Forum on China’s Poverty Policies. Beijing, 26 October.
Xie, G. 1988. Comments on Price Change of Agricultural Products. Rural Economy Sketch, No.1.
Zhou, Xuejin. 2000. Voice of the Poor. Report on Participatory Urban Poverty Analysis in Beijing. Beijing: ADB.

Bibliography 143
Zhu, L., and Z. Jiang. 1995. Yigong-Daizhen: A New Experience with Labour-Intensive Public Works in Poor Areas. InEmployment for Poverty Reduction and Food Security. Edited by Joachim von Braun. Washington, DC: International FoodPolicy Research Institute.
Zhu, Ling. 1997. Poverty Alleviation in the Transition of Rural China. Paper presented at Regional Expert Meeting onCapacity Building to Alleviate Rural Poverty, Beijing, 25-28 March.
Zhu, Rongji. 2001. Report on the Outline of the Tenth Five-Year Plan for National Economic and SocialDevelopment. Delivered at the Fourth Session of the Ninth National People’s Congress, Beijing, 5 March.


Index 145
INDEX
4
4 in, 7 Out Program ..................................................................... 16
5
5 guarantee families .................................................................... 1135 guarantee system ..................................................................... 113
8
8-7 program ............................ 16, 25, 41, 50, 57, 67, 69, 70, 84, 1118-7 Program ................................................................................. 16
A
ABC .............................. 49, 53, 55, 56, 57, 59, 60, 61, 62, 63, 79, 81absolute poor ................................. 14, 34, 37, 55, 58, 102, 103, 112ACCYL ........................................................................... 54, 74, 105ACWF ............................................................... 54, 72, 74, 105, 111ADBC .................................................................................... 55, 61agriculture .................................................................................... 79Agriculture Bank of China ................................................. See ABCAll-China Communist Youth League ............................ See ACCYL
B
bilateral donor assistance .............................................................. 81broad poverty ................................................................... 86, 87, 88
C
Candlelight Project ....................................................................... 75CANGO ...................................................................................... 75CASS ........................................................................... 60, 61, 62, 81Center for Integrated Agricultural Development ......................... 76Center for the Study of Poverty of the Chinese Academy of Social
Sciences ................................................................................... 76CFamPA ....................................................................................... 74CFPA ..................................................................................... 74, 75China Association for NGO Cooperation ................... See CANGOChina Family Planning Association .............................. See CFamPAChina Foundation for Poverty Alleviation .........................See CFPAChina National Charities ....................................................See CNC
China Population Daily ...................................................... See CPDChina Population Welfare Foundation ............................. See CPWFChina Poverty Research Association ............................................ 75Chinese Academy of Social Sciences ................................. See CASSchunlei jihua ........................................................ See Spring Bud PlanCNC ............................................................................................. 75communes .................................................................................... 22county .......................................................................................... 19County Civil Affairs ..................................................................... 53CPD ............................................................................................. 74CPWF .......................................................................................... 74
D
deep poverty ............................................................................... 85, 88Development Research Center of the State Council .............. 86, 97disabled ...................................................................................... 112disadvantaged poor ................................................................ 36, 37domestic private firms .................................................................. 71
E
economic growth ......................................................................... 44education .......................................................................... 10, 11, 49
gender ............................................................................ 110, 111migrant workers ..................................................................... 110
employment ............................................................................. 7, 11urban unemployment rates ...................................................... 97
environmentgender .................................................................................... 111sustainability ........................................................................ 8, 11
ethnic minoritiesspecial policies ....................................................................... 112
F
fazhan zijin .................................................. See Development Fundsfeminization of agriculture ......................................................... 111FFW ..................................................... 53, 54, 55, 56, 57, 64, 65, 66Finance, the State Economic and Trade Commission .......See SETCfiscal policy ................................................................................... 49floating migrant population .......................................................... 92formerly poor ............................................................................... 37FPC ........................................................................................ 60, 61FPL ........................................................................................ 86, 87Funding of Poor Cooperatives ............................................ See FPC

146 Poverty Profile of the People’s Republic of China
G
GB ......................................................................................... 60, 61gender .................................................................................... 10, 11
gender dimensions of poverty ........................................................ 109getihu ................................................. See small individual businessesGini coefficient ............................................................................ 47Glorious Scheme .......................................................................... 71GNP ............................................................................................ 46GONGOS ............................................... 24, 50, 53, 55, 72, 74, 105governance .................................................... 35, 70, 72, 74, 76, 100government poverty alleviation .................................................... 56government-organized non-government organizations ............... See
GONGOSGrameen Bank ......................................................................See GBgrey economy ....................................................................... 99, 105gross national product ........................................................See GNPgrowth
agricultural ............................................................................... 48industrial .................................................................................. 48
guangcai shiye ..................................................... See Glorious SchemeGuojia Shenjiwei .................... See National Investigation Commission
H
Hand in Hand Action ................................................................... 74health services .............................................................................. 49Hui ......................................................................................... 55, 56
Biao Hui .............................................................................. 56Yao Hui ............................................................................... 56
Lun Hui ................................................................................... 56hukou ............................................................................................ 93
I
IFC.................................................................................. 71, 99, 106illiteracy ...................................................................................... 109
women ................................................................................... 109inflation ....................................................................... 16, 20, 48, 61infrastructure .......................................................................... 62, 63
rural ......................................................................................... 64INGO ........................................................................................ 105International Finance Corporation ....................................... See IFC
J
jinguo fupin xingdong ............. See Women’s Poverty Alleviation ActionProgram
jobless workers .....................................................................See wuye
K
key counties for national poverty reduction anddevelopment ................................................................ 14, 20, 68
Kunming Center for Biodiversity and IndigenousKnowledge............................................................................... 76
L
Labor Bureaus .................................................................... 102, 103labor mobility ............................................................................... 43laid-off workers ...............................................................See xiagangLGOP .................. 24, 50, 52, 54, 58, 61, 64, 74, 77, 79, 81, 102, 104LGP ............................................................................ 50, 52, 53, 54low income households .......................................................... 36, 37
M
macroeconomic policies ............................................................... 50MCA ................................................ 53, 54, 71, 74, 87, 93, 102, 113MDG ..................................................................................... 26, 27microcredit ............................................................................. 60, 61microfinance ..................... 36, 55, 60, 61, 62, 63, 74, 75, 80, 81, 106Millenium Summit ........................................................................ 26Millennium Development Goal .........................................See MDGMillennium Development Goals .......................................See MDGMinimum Living Standards Scheme ..................................See MLSSMinistry of Agriculture ..................................................... See MOAMinistry of Civil Affairs .................................... See MCA, See MCAMinistry of Labor and Social Security ........................... See MOLSSMLSS .............................................................. 53, 97, 102, 103, 104MOA ................................................................................ 15, 23, 54MOF ................................... 53, 54, 55, 56, 57, 60, 61, 66, 74, 77, 81MOLSS ................................................................. 54, 102, 103, 106
N
National Development and Reform Commission ........... See NDRCNational Investigation Commission ............................................. 65national minorities ...................................................................... 112National Poverty Reduction Conference 1996 ............................. 59national savings rate ..................................................................... 88NBS Urban Household Survey 1998 ............................................ 95NBS Urban Poverty Survey 1999 ................................................. 92NBS Urban Study Organisation ................................................... 95NDRC................................... 50, 53, 54, 55, 64, 65, 74, 77, 102, 106NGO............................... 61, 69, 70, 71, 72, 73, 74, 75, 76, 105, 111Nongcun Xinyong She ....................................................... See RCCNongye Yinhang ................................................................ See ABCnon-performing loans .................................................................. 59
O
ODA ................................................................................ 77, 81, 82OOF ............................................................................................ 77Outline for Poverty Alleviation and Development of China’s Rural
Areas (2001-2010) .................................................................... 67

Index 147
P
PADO ........................................................... 50, 52, 59, 66, 74, 111PBOC ........................................................ 50, 53, 55, 56, 60, 61, 81Poor Area Development Fund ..................................................... 66poverty
broad poverty .......................................................................... 30deep poverty ............................................................................ 30definition of ....................................................................... 13, 22extreme .................................................................................... 26extreme poverty ....................................................................... 30net income poverty .................................................................. 13rural poverty
definitions ....................................................................... 13targeting .......................................................................... 14
poverty linespoverty lines compared ....................................................... 30diagnostic urban poverty line .............................................. 86urban benefit poverty line ................................................... 86
diagnostic urban poverty line ............................................. 17, 19dollar a day .............................................................................. 16
See GPL,NBS poverty line ............................................................... 15, 17official rural poverty line ...................................................... 1, 11
Poverty Reduction .................................................................... 5, 11poverty reduction strategies
government expenditure on poverty reduction ........................ 25poverty reduction strategies
Ten Year Plan 2001-2010 ......................................................... 20three stage poverty reduction strategy ..................................... 22
poverty reduction strategiesfive guarantees ......................................................................... 53
poverty reduction strategiesarea development strategy........................................................ 56
poverty reduction strategiesloan programs .......................................................................... 60poverty reduction strategiesthree wests ............................................................................... 66
poverty reduction strategiestenth five year plan .............................................................. 67
poverty reduction strategiesprivate sector ....................................................................... 70
poverty reduction strategiesprivate sector ....................................................................... 70
poverty reduction strategiesten million in three years ........................................................ 103
poverty reduction strategieslaid-off employees assistance ................................................. 103
poverty reduction strategiesunemployment insurance scheme ...................................... See UI
Poverty Research Center of the Institute of AgriculturalEconomics ............................................................................... 76
PPP .............................................................................................. 16private sector ................................................................................ 79Private Sector ........................................................................... 8, 11Project Happiness ........................................................................ 74Project Hope ................................................................................ 74pro-poor growth .................................................................... 36, 46purchasing power parity ...................................................... See PPP
R
RCC ................................................................................. 55, 62, 63RCCs ..................................................................... 53, 55, 61, 62, 63Red Cross ................................................................................... 105red hat .......................................................................................... 99regional cooperation ................................................................. 8, 11Research Institutes ....................................................................... 75residence permit .................................................................See hukouROSCA ............................................................................... See HuiRotational Savings and Credit Associations ......................... See Huirural infrastructure ................................................................. 62, 63rural pension schemes .................................................................. 53rural poor
institutional responsibility ................................................... 50definitions ....... See poverty: broad poverty, deep poverty, and
extreme povertydistribution .......................................................................... 32categories ............................................................................ 37poverty line ............................................................................. 39unit cost .............................................................................. 67
Rural Povertylevels .................................................................................... 1, 11
rural-urban income disparity ........................................................ 43rural-urban income gap ................................................................ 47
SSAIC ............................................................................................ 99sanxi .......................................................................... See three westsshehui danwei ................................................ See Social OrganisationsShehui Fupin ........................... See society-based poverty alleviationshiye ............................................................................................... 94shou la shou ............................................................ See Hand in Handsiying qiye .................................................. See domestic private firmssmall and medium enterprises ............................................ See SMEsmall individual businesses ........................................................... 71SME ............................................................................................. 99social organisations ...................................................................... 75social safety nets ........................................................................... 43social security
rural ......................................................................................... 53society-based poverty alleviation .................................................. 56SOE ........................................................................ 94, 97, 100, 103
reformwomen ............................................................................... 110
SOEs .................... 55, 71, 82, 85, 88, 94, 97, 100, 101, 103, 104, 106Song Qingling Foundation ........................................................... 75Spring Bud Plan ........................................................................... 74State Administration of Industry and Commerce ............. See SAICState Council Leading Group on Poverty Alleviation and
Development ..................................................................See LGPstate owned enterprises ...................................................... See SOEsubsidized loans ..................................................................... 56, 57Subsidized Loans ......................................................................... 58
Ttargeted poverty programs ..................................................... 46, 48Third Front Industrialization ....................................................... 97

148 Poverty Profile of the People’s Republic of China
Third Plenum ............................................................................... 23three nos ...................................................................................... 88town and village enterprises ............................................... See TVEtownship ......................................................... 19, 22, 24, 52, 57, 65trusts ............................................................................................ 71TVEs ............................................ 24, 25, 48, 49, 55, 56, 57, 58, 100
U
UI ....................................................................................... 103, 104underemployment ........................................................................ 44Unemployed workers ...........................................................See shiyeurban poor
overview .............................................................................. 85distribution .......................................................................... 90Urban PoorCategories ............................................................................ 94
urban povertydistribution .......................................................................... 90profiles ................................................................................ 94
V
Village Committees ................................................................ 53, 65vulnerable groups ......................................................................... 79vulnerable poor ...................................................................... 36, 37
W
White Paper ............................................................................ 25, 64
White Paper on rural Poverty Reduction ...................................... 22White Paper on Rural Poverty Reduction ............................22, 26, 67, 75women ................................................................................... 72, 74
land rights .............................................................................. 111trafficking in .......................................................................... 111Women’s Poverty Alleviation Action Program ................... 72, 74
Women ................................................................ 21, 54, 73, 74, 109World Trade Organization ................................................. See WTOWTO ......................................................................... 43, 47, 93, 100wuye ............................................................................................... 94
X
xiagang .............................................................................94, 98, 103xiang ............................................................................. See township
Y
Yigong Daizhen ....................................See Food For Work SchemeYJDF ............................................................................................ 74Youth and Juvenile Development Foundation ..................See YJDFYunnan Academy of Social Sciences ............................................ 76
Z
Zhengfu Fupin ........................ See Government Poverty Alleviation