powerpoint presentationgattonweb.uky.edu/faculty/scott/eco461-fall2016/tacit vs. overt... · and...
TRANSCRIPT


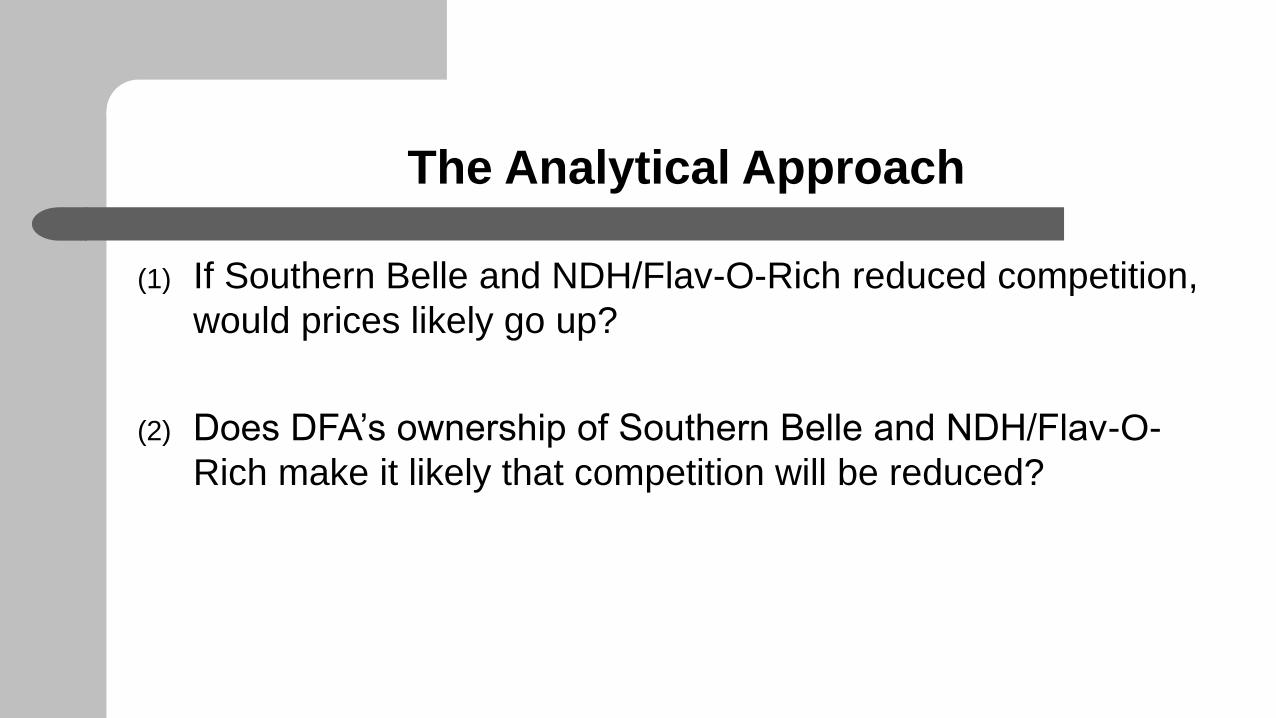
The Analytical Approach
(1) If Southern Belle and NDH/Flav-O-Rich reduced competition,
would prices likely go up?
(2) Does DFA’s ownership of Southern Belle and NDH/Flav-O-
Rich make it likely that competition will be reduced?

Merger Guidelines Framework
Relevant Product Market
Relevant Geographic Markets
Market Participants and Increased Concentration
Likely Adverse Competitive Effects
– Unilateral
– Coordinated
Likelihood of Entry by Other Firms
Efficiencies

The Relevant Markets
Product market: School milk
– Half pints of fresh milk
– Delivered according to school delivery requirements
Geographic market: Individual school districts or groups that
conduct joint bids
– Separate auctions with separate prices
– No arbitrage

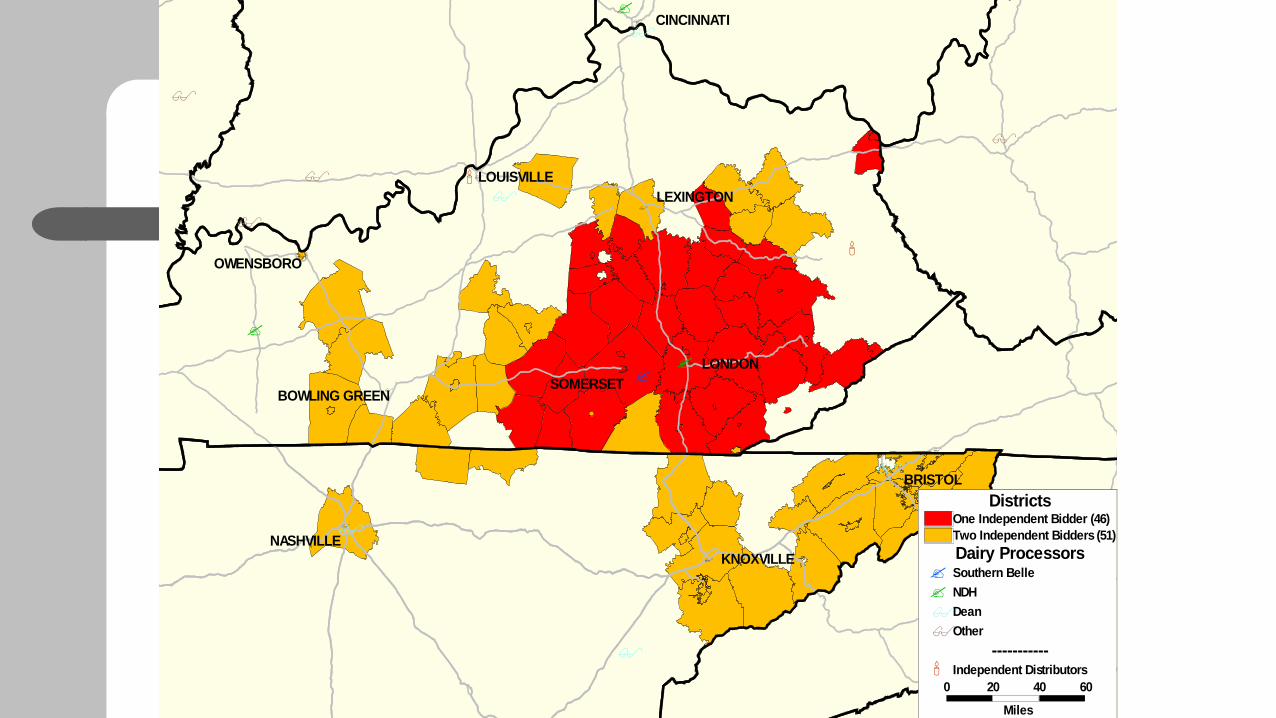
The Market Participants
Bidders within the previous four years– 47 two-bidder districts
– 51 three-bidder districts
The importance of local commercial distribution
Changes in ownership of processors and milk distributors
$
$
$
$
$
$
$
$
$
$
$
?
$
$
??
$
$
$
?
$
$
$
'
'
0 20 40 60
Miles
DistrictsOne Independent Bidder (46)
Two Independent Bidders (51)
Dairy Processors? Southern Belle
? NDH
$Dean
$Other
-----------' Independent Distributors
LEXINGTON
CINCINNATI
LONDON
SOMERSET
BRISTOL
KNOXVILLE
BOWLING GREEN
OWENSBORO
NASHVILLE
LOUISVILLE

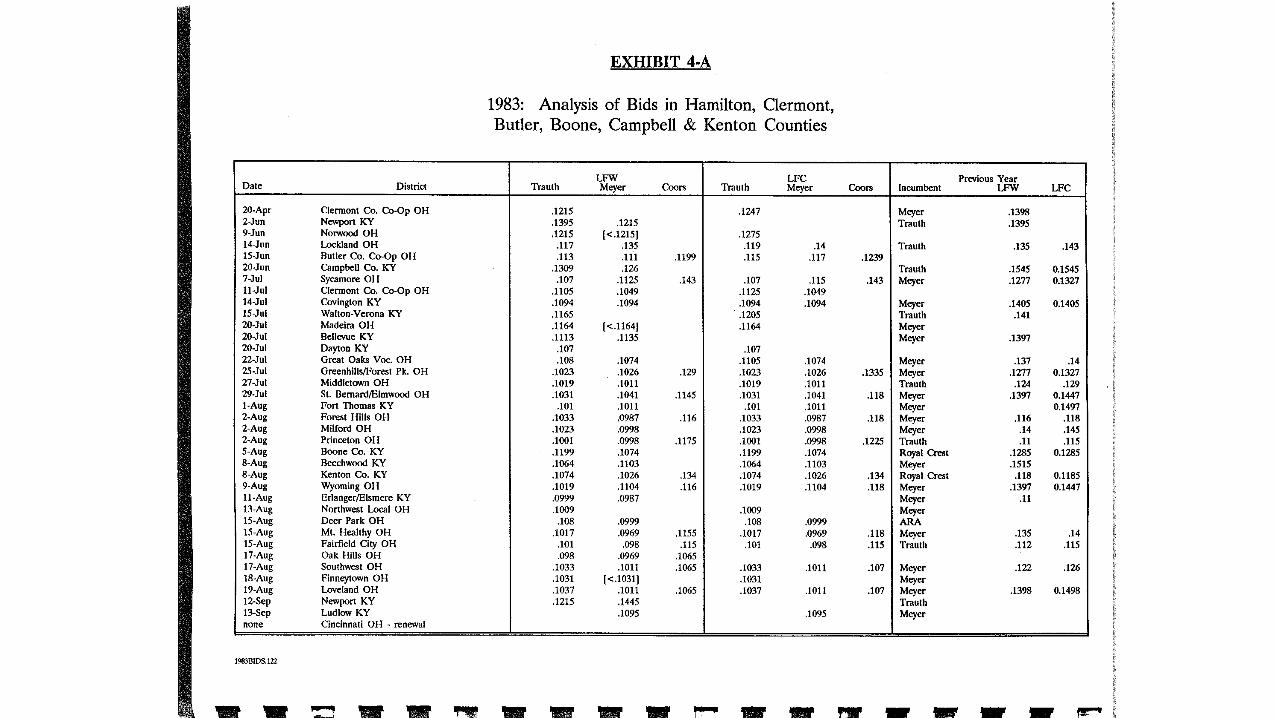
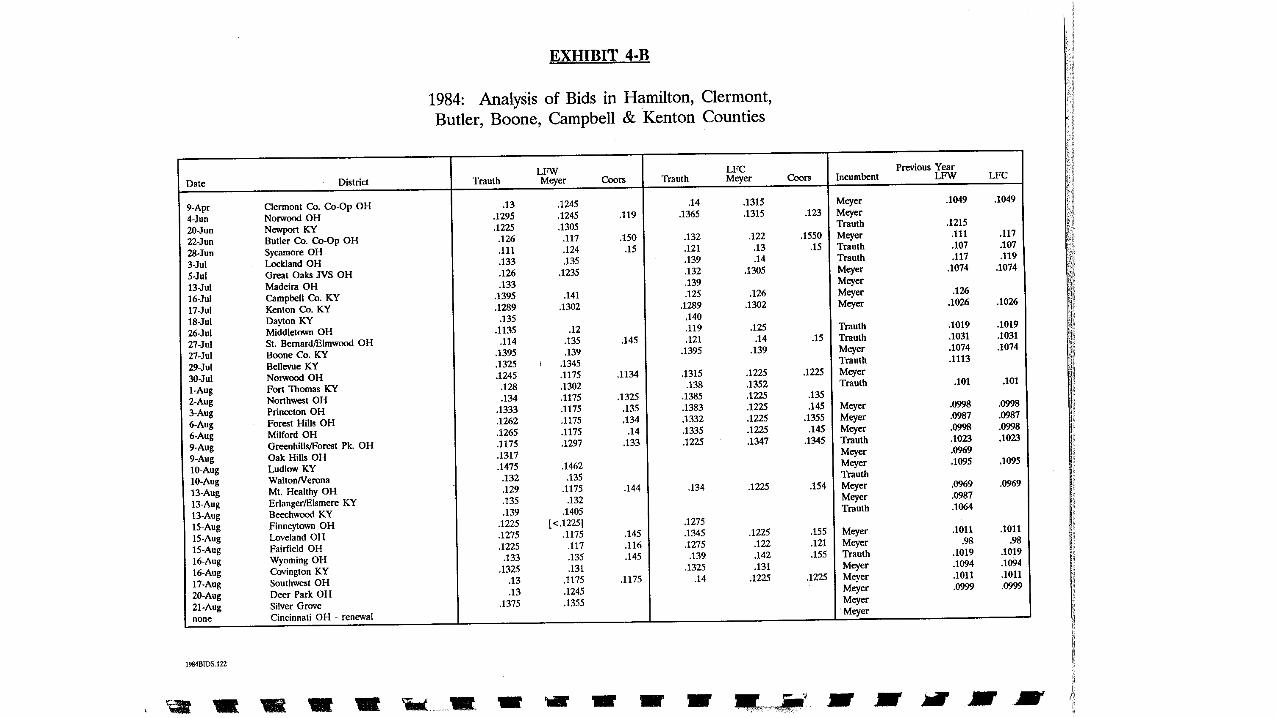
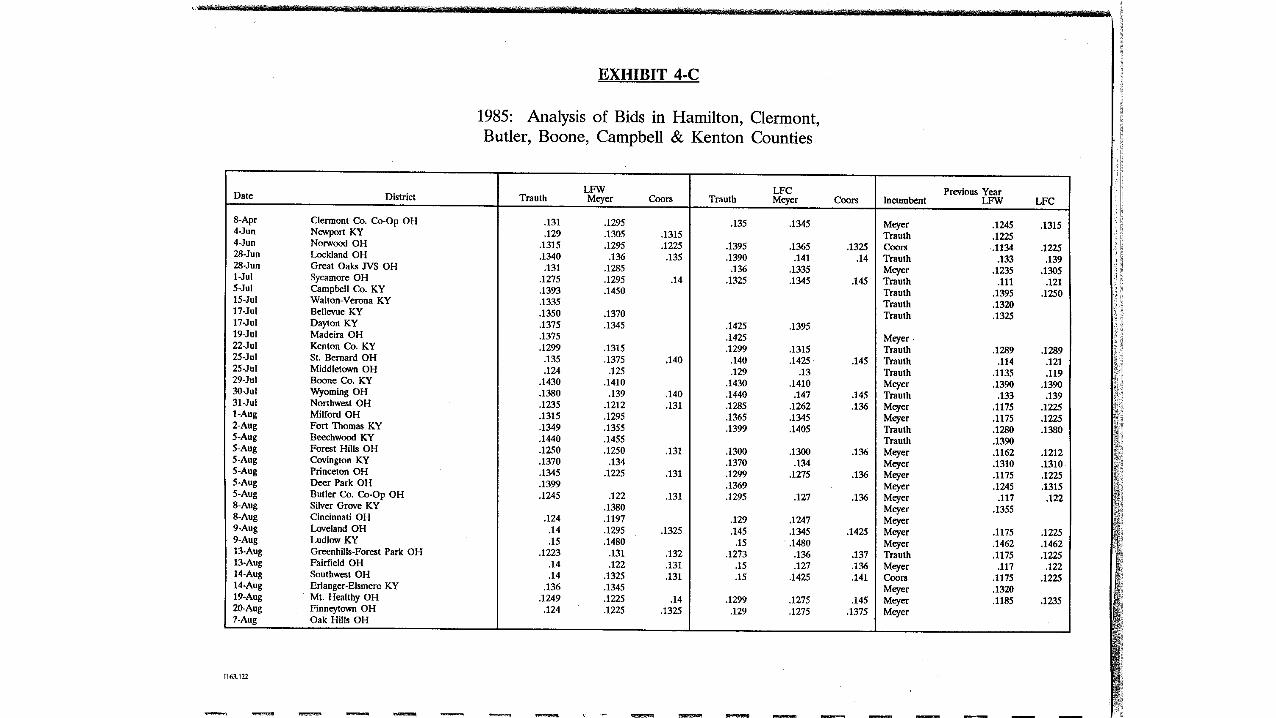
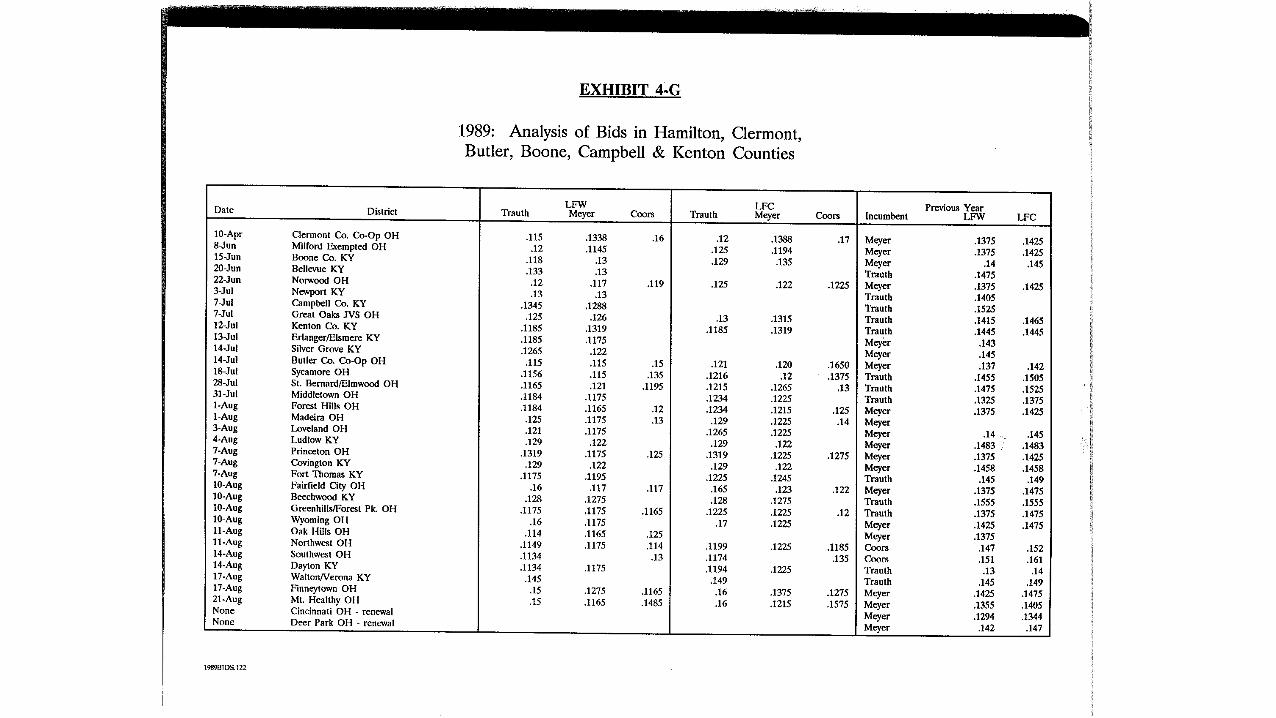
Statistical Evidence
The statistical approach
The bid data
The results
– Reducing bidders from two to one
– Reducing bidders from three to two

Control Variables
The bid year (‘99 to ‘02)
Fixed price bids
Unknown whether bid is
Fixed or Escalated
Distance around a
school district
1st closest – 3rd closest
dairies
Number of meals served
in the school district
Which coop (CKEC,
KEDC, NETCO, Other)
the district used if it did
not independently solicit
a bid

Estimated Effects of a Change in the Number of Bidders on Low-Fat Chocolate
(Compared to 2-Bidder Markets)
1 Bidder
3 Bidders
4 Bidders
-1.00¢
-0.80¢
-0.60¢
-0.40¢
-0.20¢
0.00¢
0.20¢
0.40¢
0.60¢
0.80¢
Ch
an
ge i
n C
en
ts p
er 1
/2 P
int
of
Lo
w-F
at
Ch
oco
late
Mil
k
The Effect of the Number of Bidders on the Low Bid
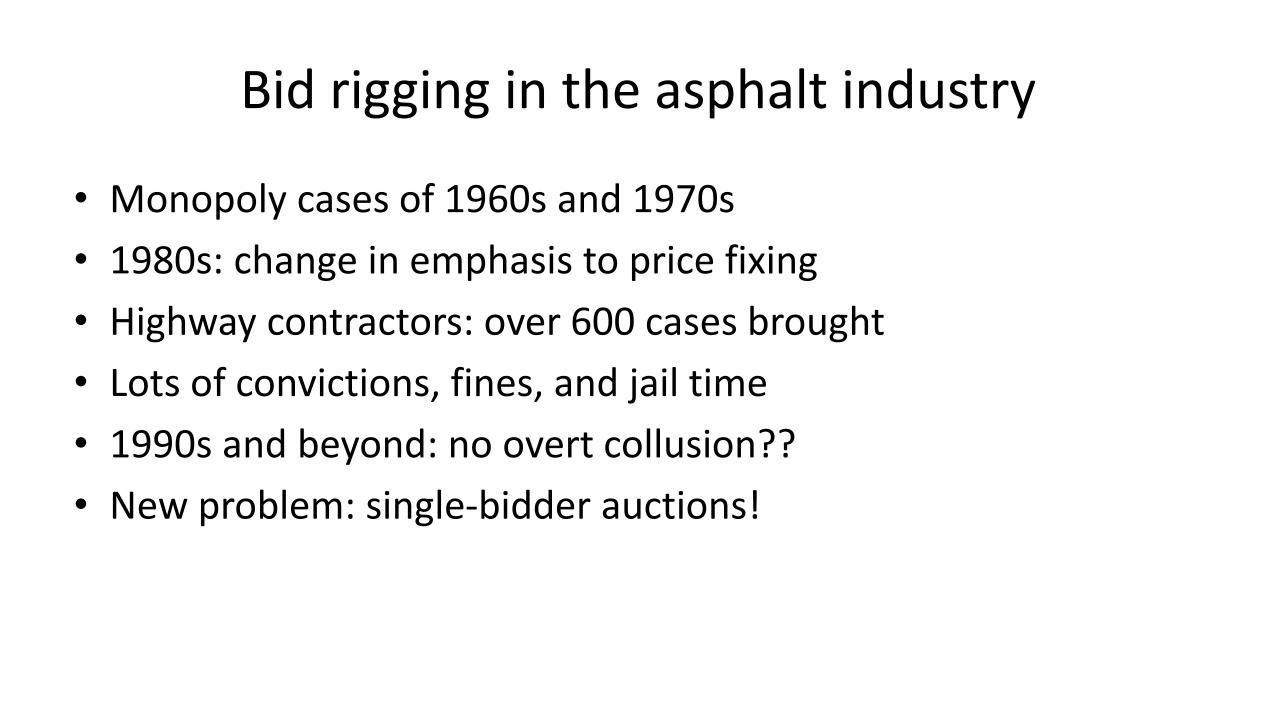
Bid rigging in the asphalt industry
• Monopoly cases of 1960s and 1970s
• 1980s: change in emphasis to price fixing
• Highway contractors: over 600 cases brought
• Lots of convictions, fines, and jail time
• 1990s and beyond: no overt collusion??
• New problem: single-bidder auctions!

Table 1: Summary Statistics of all projects in Kentucky – 2005 to 2007
Number of
Bidders
Asphalt
Paving
All Other
Projects*
Asphalt
Paving
All Other
Projects*
Asphalt
Paving
All Other
Projects*
1 680 154 437.8 737.6 2.22 2.38
2 287 223 121.8 800.8 -13.53 -6.02
3 76 211 36.0 488.3 -16.73 -13.22
4 29 153 11.4 174.4 -15.35 -16.02
5 3 83 1.8 144.0 -14.15 -19.52
6 43 49.8 -17.22
7 23 44.0 -21.30
8 12 17.1 -16.07
9 7 4.6 -26.08
12 1 0.7 -11.05
Grand Total 1075 910 608.8 2,461.1 -3.84 -10.39
*These other projects include grade and drain, bridge, mowing, concrete, etc. Some of these projects have
asphalt components as part of the project.
Number of Projects
Total Value of Projects
($ in millions)
Over or Under
Engineer's Estimate (%)
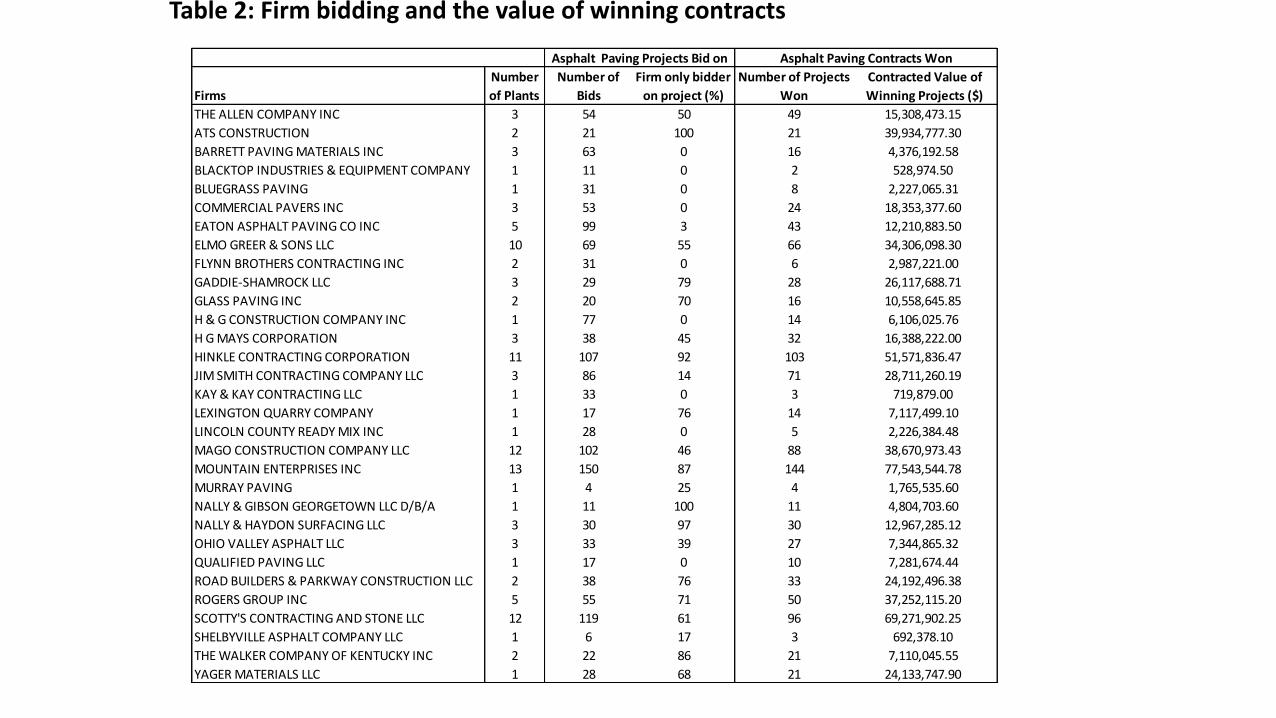
Table 2: Firm bidding and the value of winning contracts
Firms
Number
of Plants
Number of
Bids
Firm only bidder
on project (%)
Number of Projects
Won
Contracted Value of
Winning Projects ($)
THE ALLEN COMPANY INC 3 54 50 49 15,308,473.15
ATS CONSTRUCTION 2 21 100 21 39,934,777.30
BARRETT PAVING MATERIALS INC 3 63 0 16 4,376,192.58
BLACKTOP INDUSTRIES & EQUIPMENT COMPANY 1 11 0 2 528,974.50
BLUEGRASS PAVING 1 31 0 8 2,227,065.31
COMMERCIAL PAVERS INC 3 53 0 24 18,353,377.60
EATON ASPHALT PAVING CO INC 5 99 3 43 12,210,883.50
ELMO GREER & SONS LLC 10 69 55 66 34,306,098.30
FLYNN BROTHERS CONTRACTING INC 2 31 0 6 2,987,221.00
GADDIE-SHAMROCK LLC 3 29 79 28 26,117,688.71
GLASS PAVING INC 2 20 70 16 10,558,645.85
H & G CONSTRUCTION COMPANY INC 1 77 0 14 6,106,025.76
H G MAYS CORPORATION 3 38 45 32 16,388,222.00
HINKLE CONTRACTING CORPORATION 11 107 92 103 51,571,836.47
JIM SMITH CONTRACTING COMPANY LLC 3 86 14 71 28,711,260.19
KAY & KAY CONTRACTING LLC 1 33 0 3 719,879.00
LEXINGTON QUARRY COMPANY 1 17 76 14 7,117,499.10
LINCOLN COUNTY READY MIX INC 1 28 0 5 2,226,384.48
MAGO CONSTRUCTION COMPANY LLC 12 102 46 88 38,670,973.43
MOUNTAIN ENTERPRISES INC 13 150 87 144 77,543,544.78
MURRAY PAVING 1 4 25 4 1,765,535.60
NALLY & GIBSON GEORGETOWN LLC D/B/A 1 11 100 11 4,804,703.60
NALLY & HAYDON SURFACING LLC 3 30 97 30 12,967,285.12
OHIO VALLEY ASPHALT LLC 3 33 39 27 7,344,865.32
QUALIFIED PAVING LLC 1 17 0 10 7,281,674.44
ROAD BUILDERS & PARKWAY CONSTRUCTION LLC 2 38 76 33 24,192,496.38
ROGERS GROUP INC 5 55 71 50 37,252,115.20
SCOTTY'S CONTRACTING AND STONE LLC 12 119 61 96 69,271,902.25
SHELBYVILLE ASPHALT COMPANY LLC 1 6 17 3 692,378.10
THE WALKER COMPANY OF KENTUCKY INC 2 22 86 21 7,110,045.55
YAGER MATERIALS LLC 1 28 68 21 24,133,747.90
Asphalt Paving Projects Bid on Asphalt Paving Contracts Won

Highway procurement auctions
• Types of contracts: new construction, bridges, asphalt resurfacing, trimming and mowing, etc.
• Funding often separated by county, so projects often delineated by county lines
• Monthly bid-letting, projects advertised well in advance, prequalification of bidders
• Sealed-bid auction, collusion checks ex post
• Qualified bidders are publicly revealed prior to the auction in Kentucky!
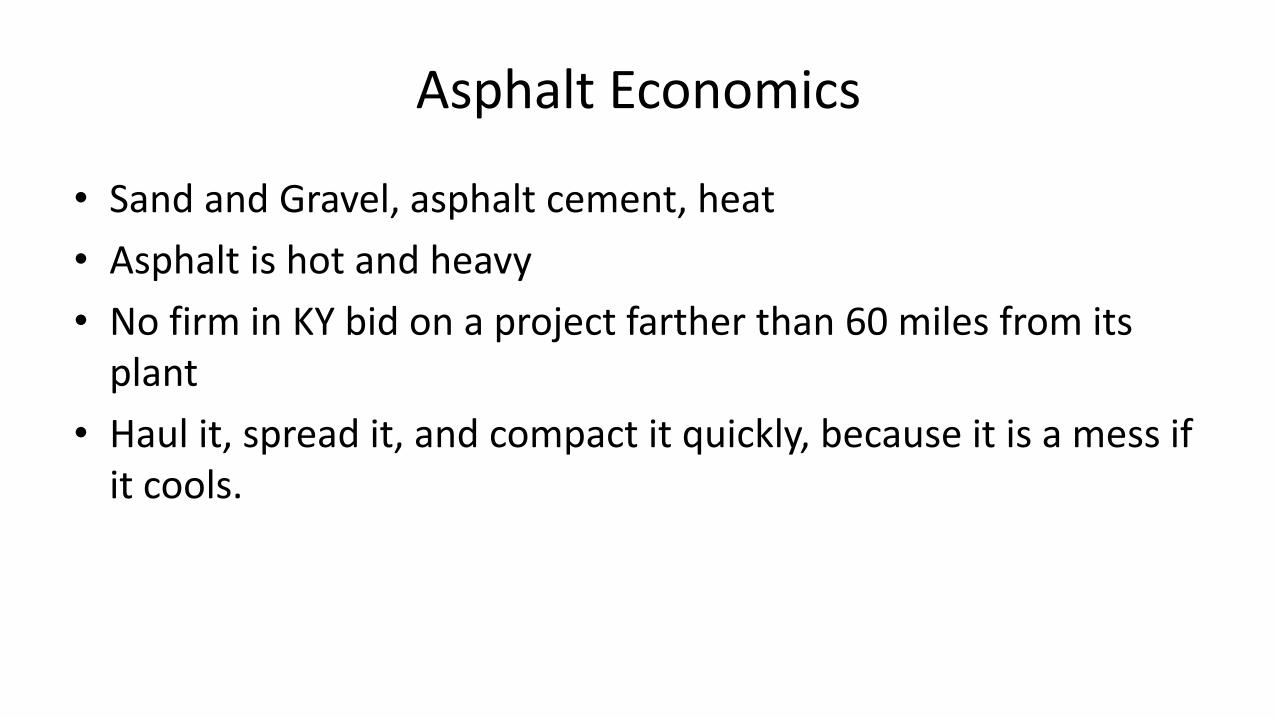
Asphalt Economics
• Sand and Gravel, asphalt cement, heat
• Asphalt is hot and heavy
• No firm in KY bid on a project farther than 60 miles from its plant
• Haul it, spread it, and compact it quickly, because it is a mess if it cools.

Appendix A-1: Diagram of Asphalt Paving

Coordination of bidding in a repeated game
• Competitive markets in Kentucky: Louisville area and northern Kentucky area
• Oligopoly markets: spatially separated firms when transportation costs are significant
• Natural monopoly markets: eastern Kentucky

Figure 1: Asphalt Plant Locations in Kentucky

Data
• Publicly available data from KYTC on all highway procurement auctions: 2005-07
• Location of project
• Location of asphalt plants
• Focus on asphalt jobs: clearly delineated geographic markets and hence lots of duopoly/oligopoly markets in KY
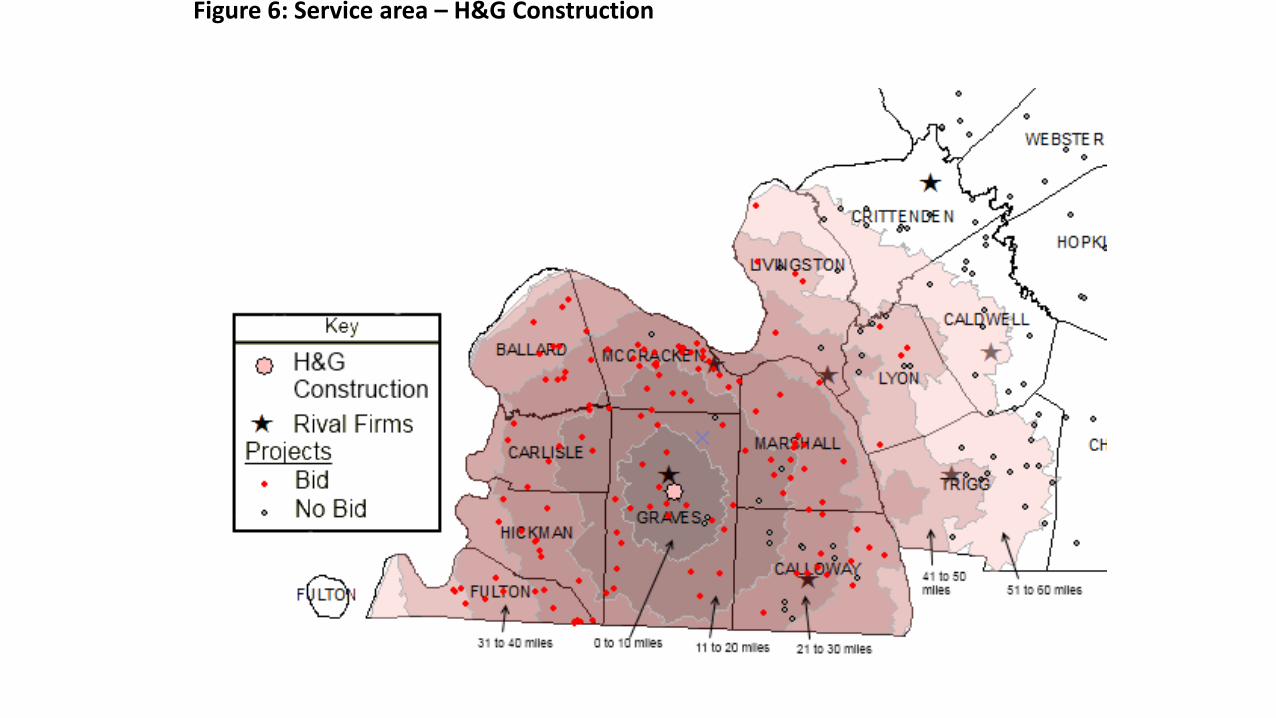
Figure 6: Service area – H&G Construction

Figure 7: Bidding behavior of four firms in Central Kentucky
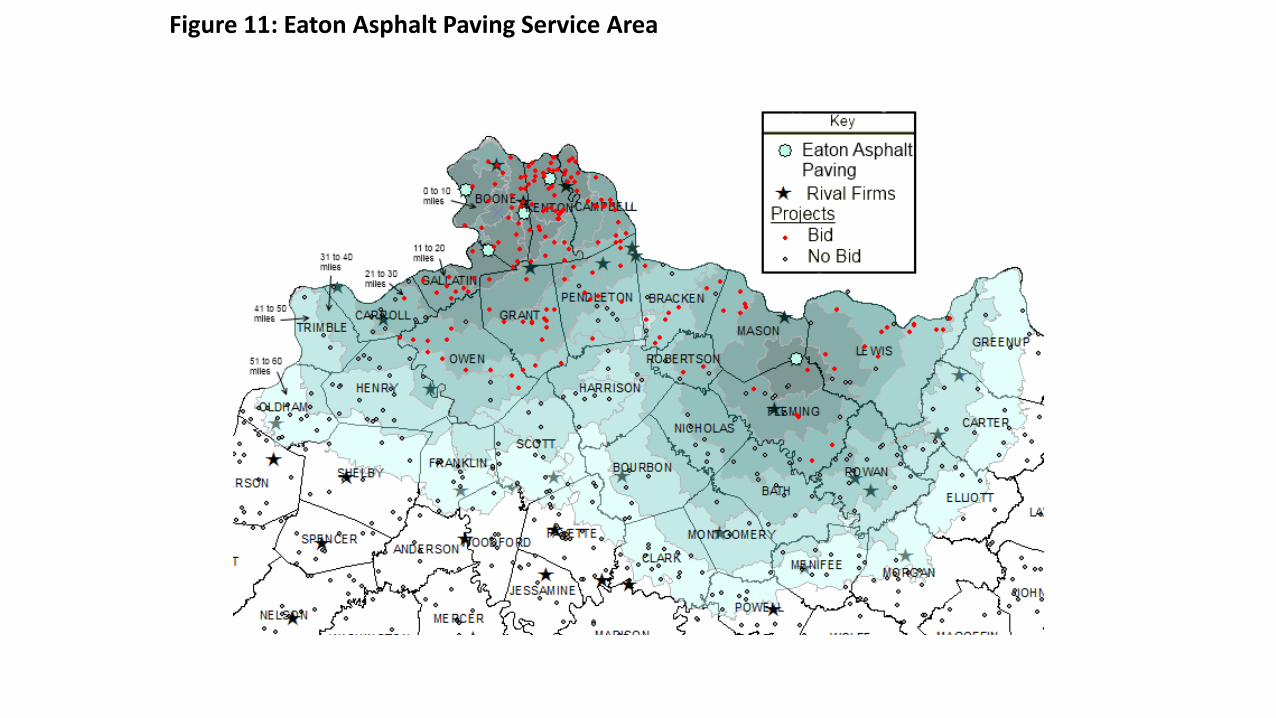
Figure 11: Eaton Asphalt Paving Service Area
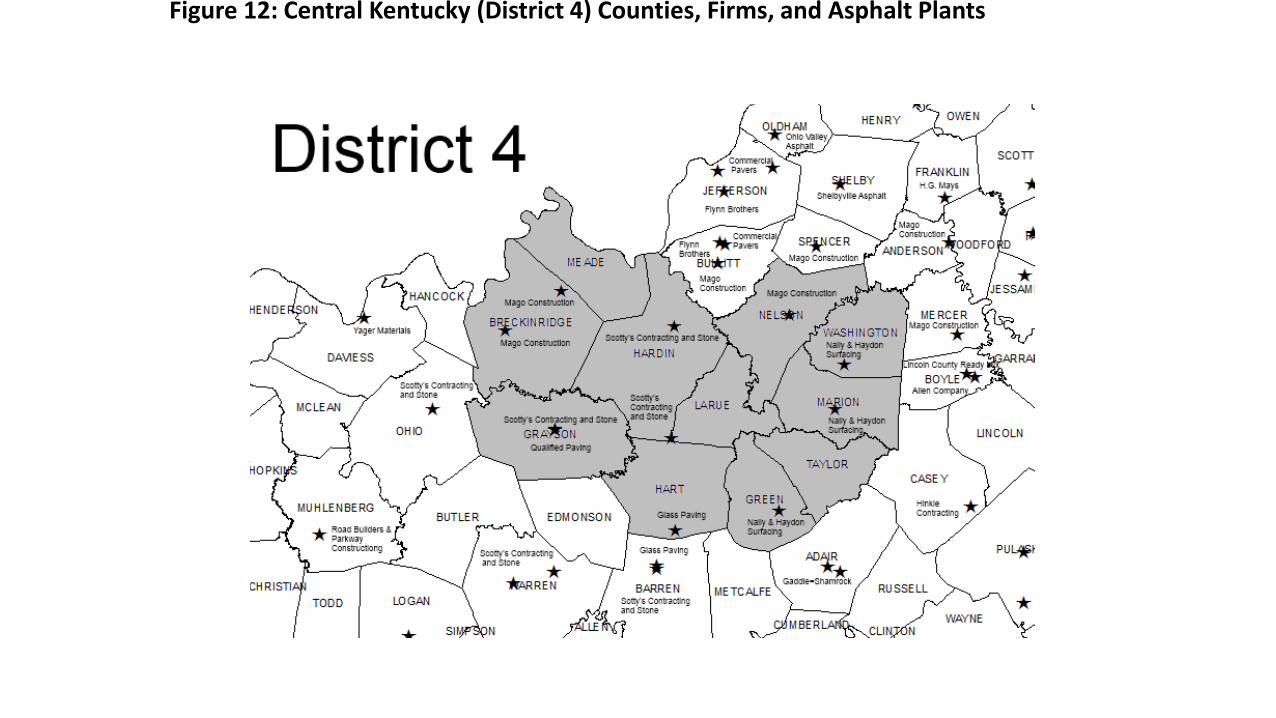
Figure 12: Central Kentucky (District 4) Counties, Firms, and Asphalt Plants
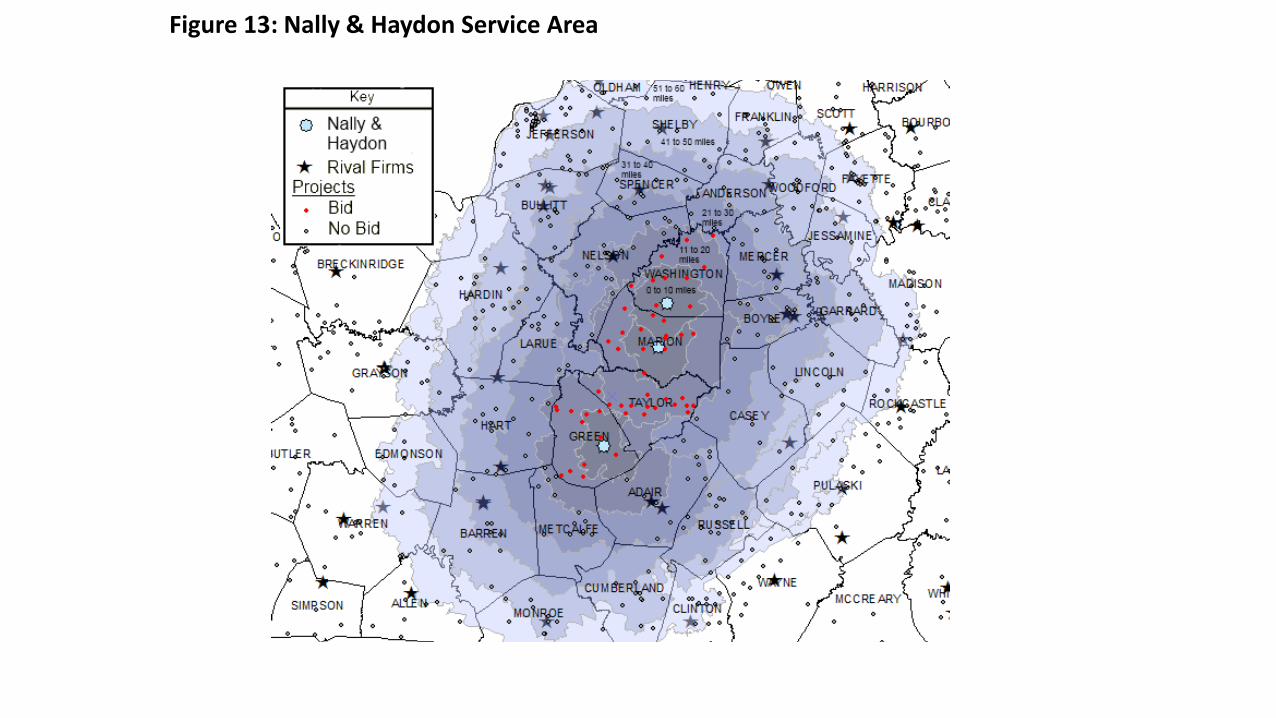
Figure 13: Nally & Haydon Service Area

Figure 14: Eastern Kentucky (District 12) Counties, Firms, and Asphalt Plants
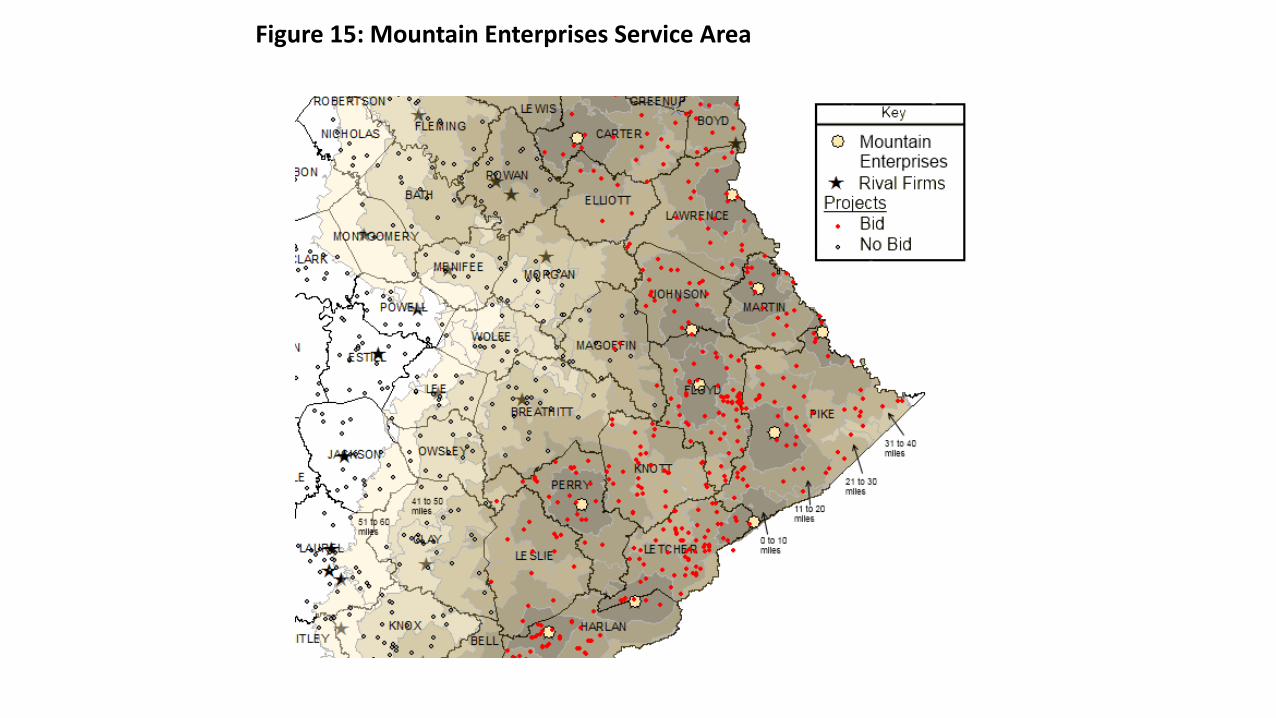
Figure 15: Mountain Enterprises Service Area