powerpoint presentation - aonhewitt chinatcmchina.aon.com/tcm/2013 rewards hr practice...
TRANSCRIPT
- Leading Companies
2013 Rewards Strategy and
HR Practice Executive Summary
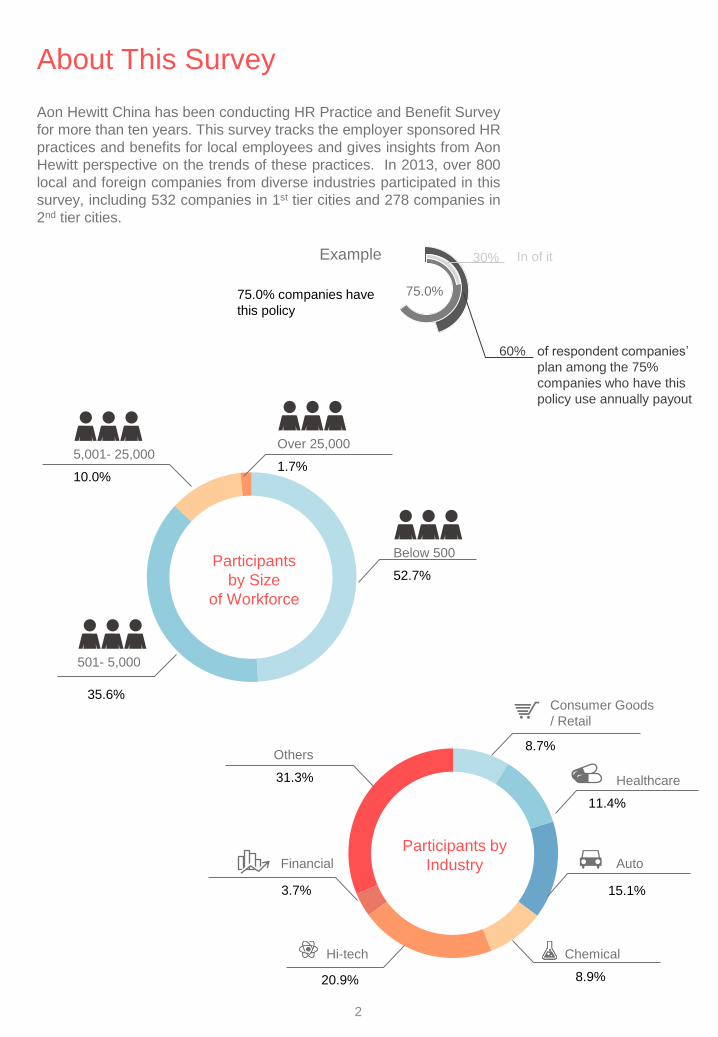
Below 500
52.7%
501- 5,000
35.6%
5,001- 25,000
10.0%
Over 25,000
1.7%
Participants
by Size
of Workforce
Aon Hewitt China has been conducting HR Practice and Benefit Survey
for more than ten years. This survey tracks the employer sponsored HR
practices and benefits for local employees and gives insights from Aon
Hewitt perspective on the trends of these practices. In 2013, over 800
local and foreign companies from diverse industries participated in this
survey, including 532 companies in 1st tier cities and 278 companies in
2nd tier cities.
Consumer Goods
/ Retail
8.7%
Healthcare
11.4%
Chemical
8.9%
Hi-tech
20.9%
Financial
3.7%
Others
31.3%
Participants by
Industry
About This Survey
Auto
15.1%
2
Example
75.0% companies have
this policy
75.0%
In of it 30%
60% of respondent companies’
plan among the 75%
companies who have this
policy use annually payout
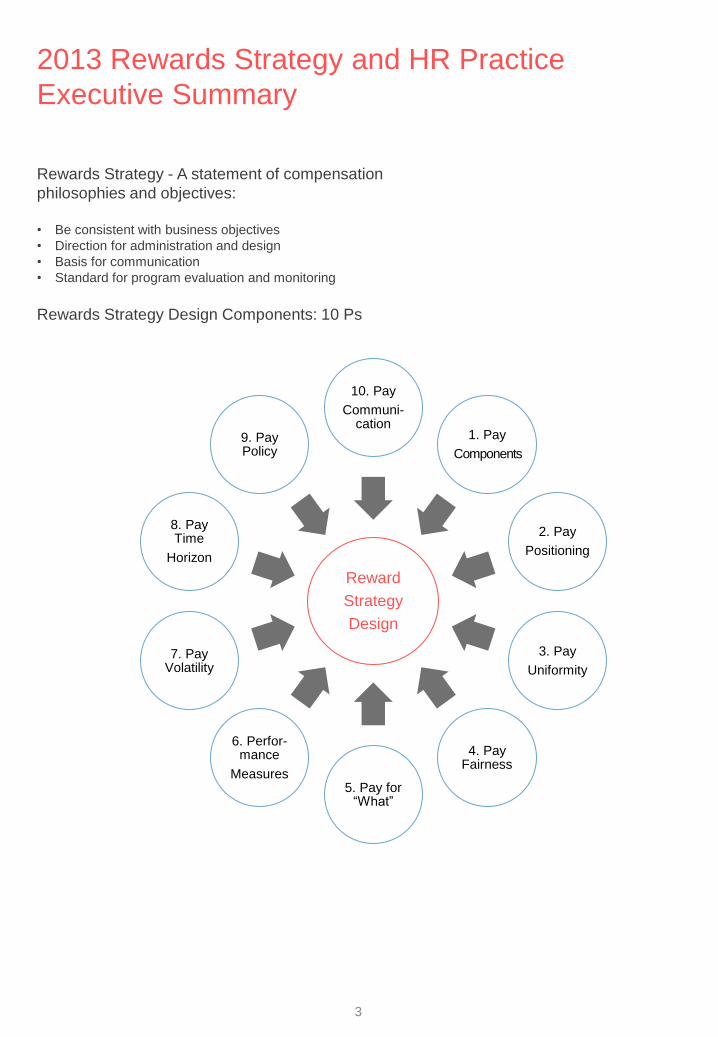
Rewards Strategy - A statement of compensation
philosophies and objectives:
• Be consistent with business objectives
• Direction for administration and design
• Basis for communication
• Standard for program evaluation and monitoring
Rewards Strategy Design Components: 10 Ps
2013 Rewards Strategy and HR Practice
Executive Summary
Reward
Strategy
Design
10. Pay
Communi-cation
1. Pay
Components
2. Pay
Positioning
3. Pay
Uniformity
4. Pay Fairness
5. Pay for “What”
6. Perfor-mance
Measures
7. Pay Volatility
8. Pay Time
Horizon
9. Pay Policy
3
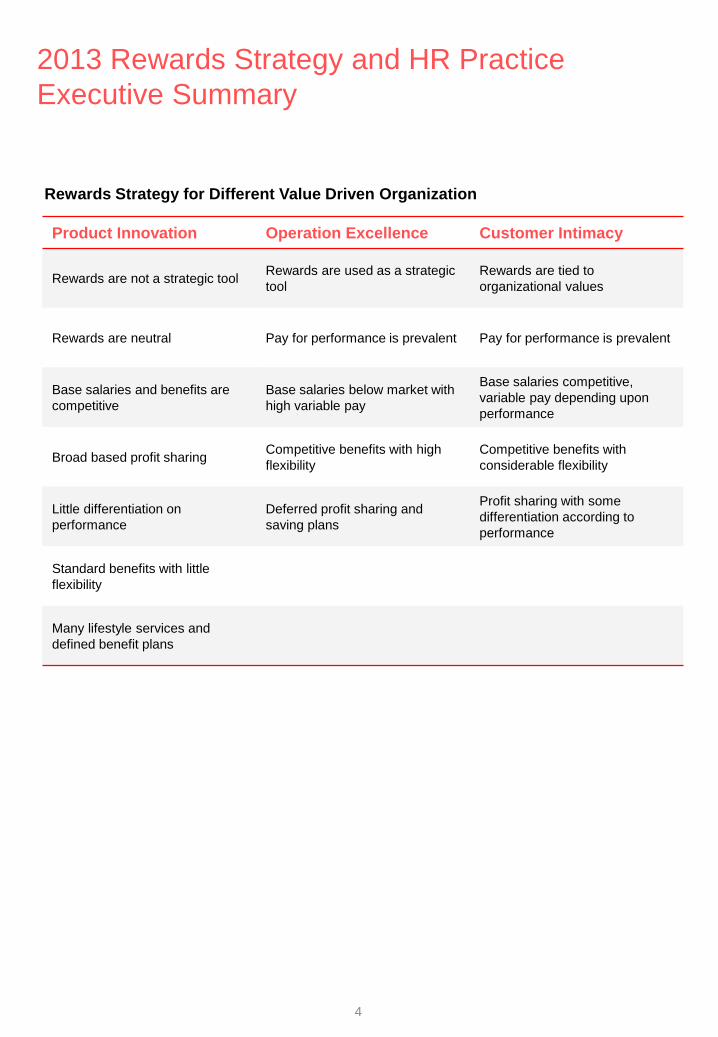
Product Innovation Operation Excellence Customer Intimacy
Rewards are not a strategic tool Rewards are used as a strategic
tool
Rewards are tied to
organizational values
Rewards are neutral Pay for performance is prevalent Pay for performance is prevalent
Base salaries and benefits are
competitive
Base salaries below market with
high variable pay
Base salaries competitive,
variable pay depending upon
performance
Broad based profit sharing Competitive benefits with high
flexibility
Competitive benefits with
considerable flexibility
Little differentiation on
performance
Deferred profit sharing and
saving plans
Profit sharing with some
differentiation according to
performance
Standard benefits with little
flexibility
Many lifestyle services and
defined benefit plans
2013 Rewards Strategy and HR Practice
Executive Summary
Rewards Strategy for Different Value Driven Organization
4
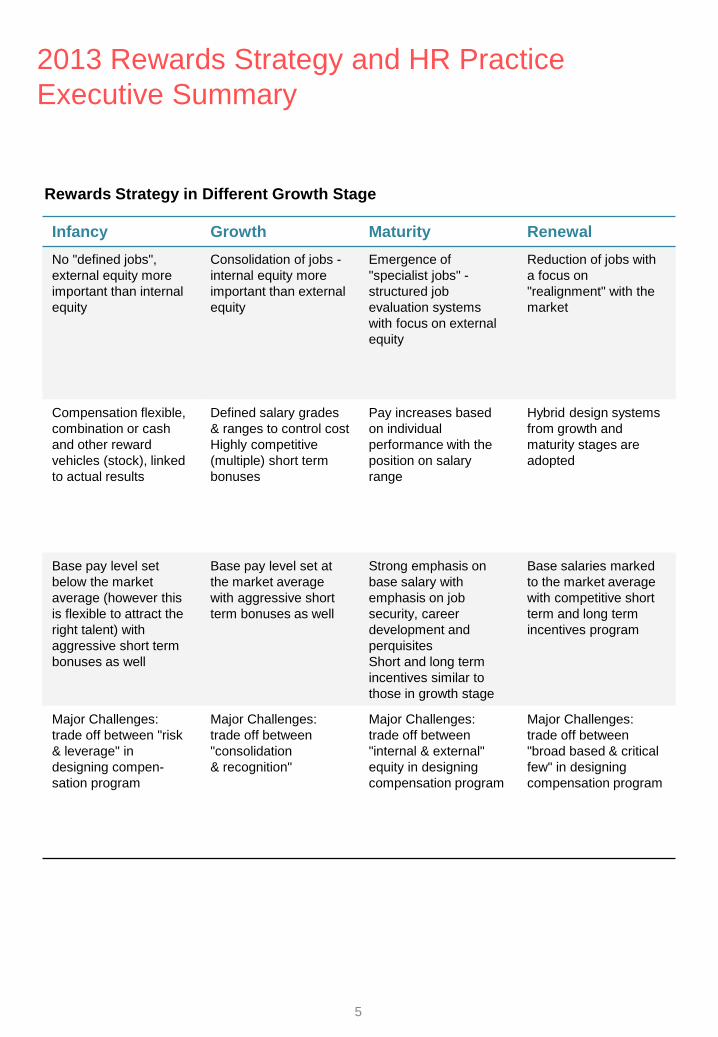
Infancy Growth Maturity Renewal
No "defined jobs",
external equity more
important than internal
equity
Consolidation of jobs -
internal equity more
important than external
equity
Emergence of
"specialist jobs" -
structured job
evaluation systems
with focus on external
equity
Reduction of jobs with
a focus on
"realignment" with the
market
Compensation flexible,
combination or cash
and other reward
vehicles (stock), linked
to actual results
Defined salary grades
& ranges to control cost
Highly competitive
(multiple) short term
bonuses
Pay increases based
on individual
performance with the
position on salary
range
Hybrid design systems
from growth and
maturity stages are
adopted
Base pay level set
below the market
average (however this
is flexible to attract the
right talent) with
aggressive short term
bonuses as well
Base pay level set at
the market average
with aggressive short
term bonuses as well
Strong emphasis on
base salary with
emphasis on job
security, career
development and
perquisites
Short and long term
incentives similar to
those in growth stage
Base salaries marked
to the market average
with competitive short
term and long term
incentives program
Major Challenges:
trade off between "risk
& leverage" in
designing compen-
sation program
Major Challenges:
trade off between
"consolidation
& recognition"
Major Challenges:
trade off between
"internal & external"
equity in designing
compensation program
Major Challenges:
trade off between
"broad based & critical
few" in designing
compensation program
2013 Rewards Strategy and HR Practice
Executive Summary
Rewards Strategy in Different Growth Stage
5
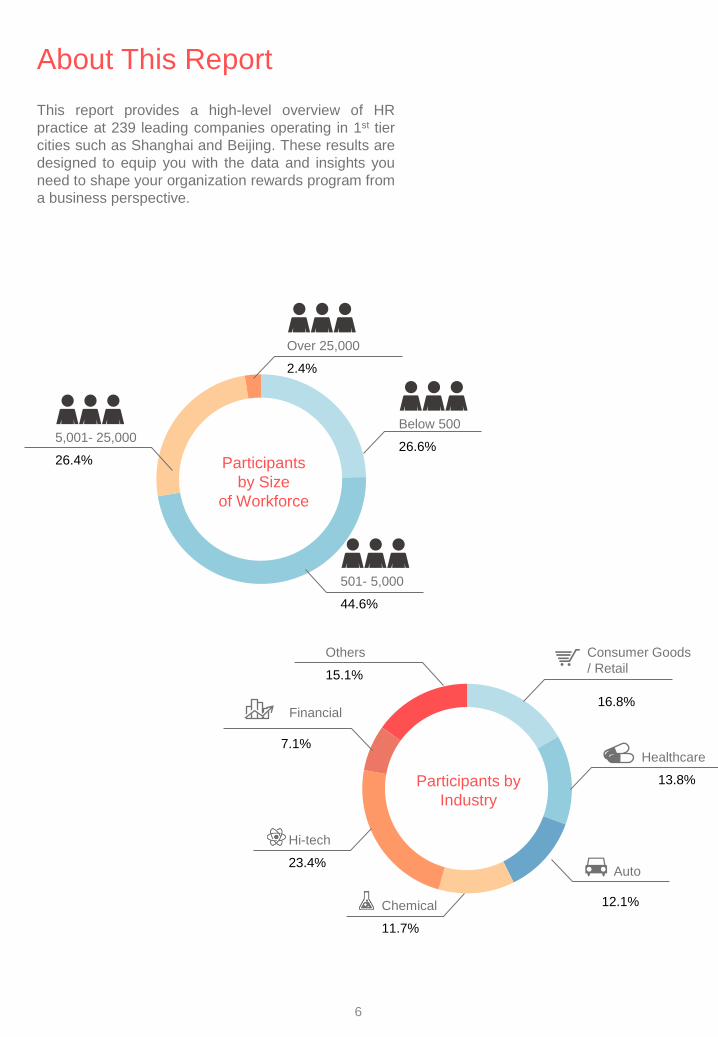
Below 500
26.6%
501- 5,000
44.6%
5,001- 25,000
26.4%
Over 25,000
2.4%
Participants
by Size
of Workforce
This report provides a high-level overview of HR
practice at 239 leading companies operating in 1st tier
cities such as Shanghai and Beijing. These results are
designed to equip you with the data and insights you
need to shape your organization rewards program from
a business perspective.
Consumer Goods
/ Retail
16.8%
Healthcare
13.8%
Auto
12.1% Chemical
11.7%
Hi-tech
23.4%
Financial
7.1%
Others
15.1%
Participants by
Industry
About This Report
6
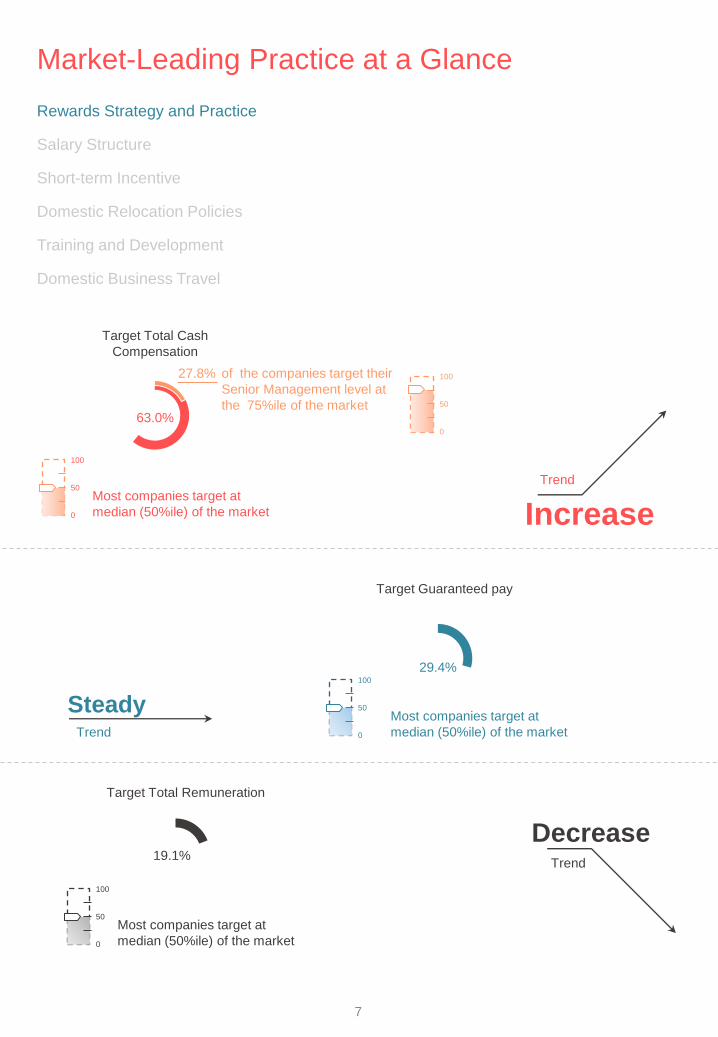
Market-Leading Practice at a Glance
Rewards Strategy and Practice
Salary Structure
Short-term Incentive
Domestic Relocation Policies
Training and Development
Domestic Business Travel
19.1%
Target Total Remuneration
Most companies target at
median (50%ile) of the market
50
0
100
Target Total Cash
Compensation
Most companies target at
median (50%ile) of the market
50
0
100
50
0
100 27.8%
63.0%
of the companies target their
Senior Management level at
the 75%ile of the market
Target Guaranteed pay
Trend
Decrease
Steady Trend
50
0
100
Most companies target at
median (50%ile) of the market
29.4%
Increase
Trend
7
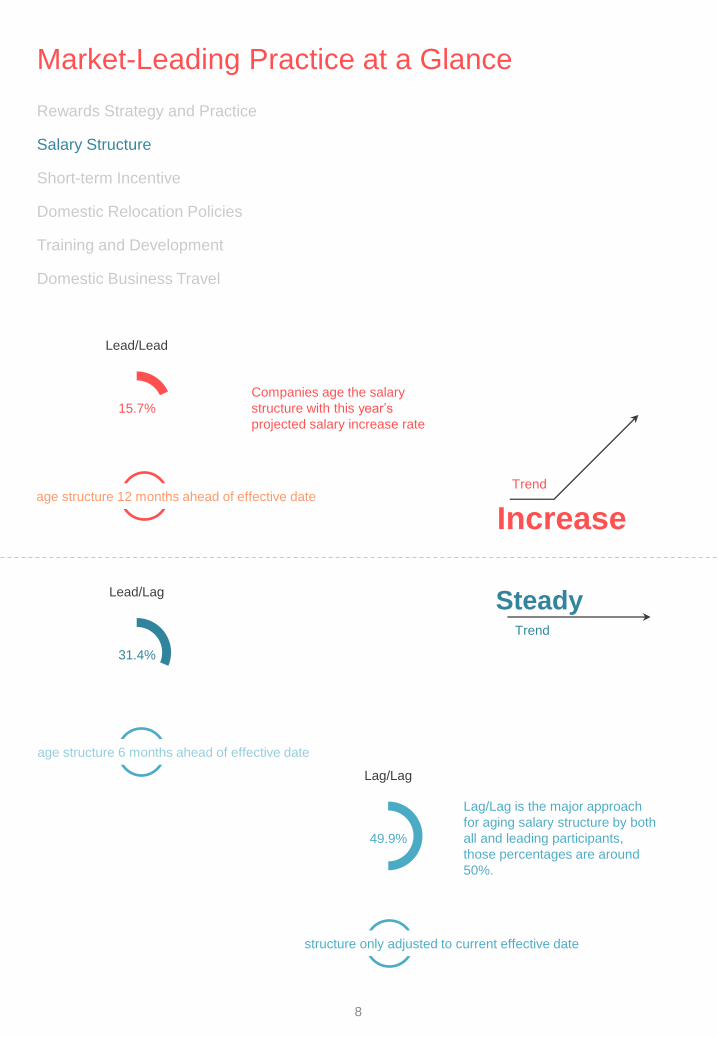
Rewards Strategy and Practice
Salary Structure
Short-term Incentive
Domestic Relocation Policies
Training and Development
Domestic Business Travel
Increase
Trend
15.7%
Lead/Lead
Companies age the salary
structure with this year’s
projected salary increase rate
Steady Trend
31.4%
Lead/Lag
49.9%
Lag/Lag
Lag/Lag is the major approach
for aging salary structure by both
all and leading participants,
those percentages are around
50%.
age structure 6 months ahead of effective date
age structure 12 months ahead of effective date
structure only adjusted to current effective date
Market-Leading Practice at a Glance
8
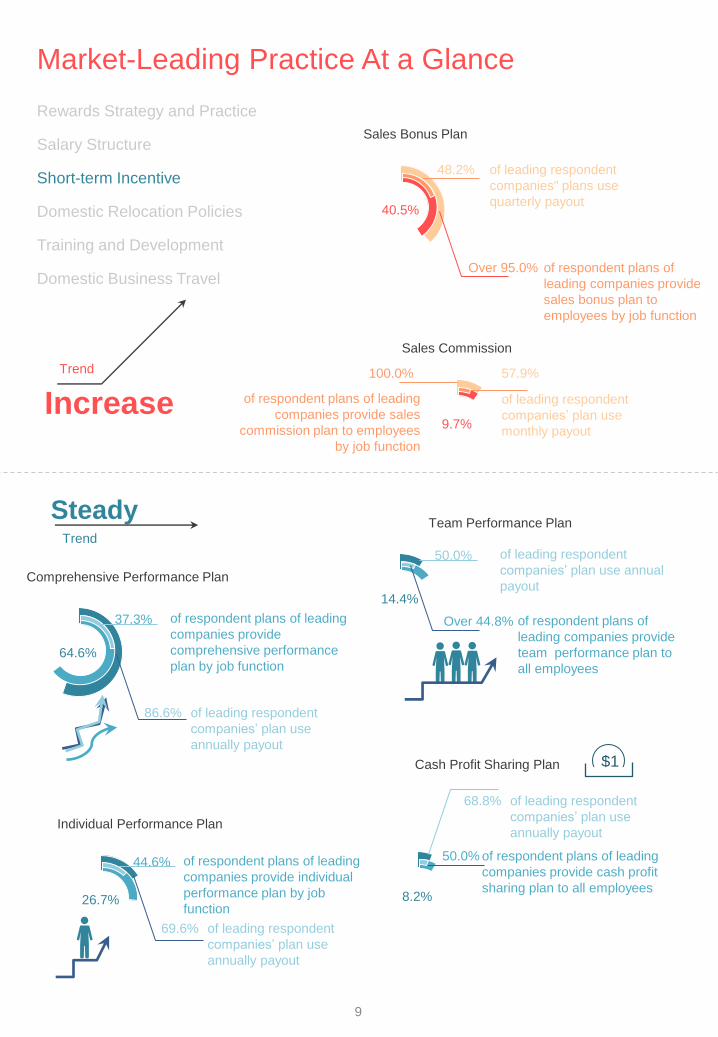
Comprehensive Performance Plan
64.6%
of respondent plans of leading
companies provide
comprehensive performance
plan by job function
37.3%
86.6% of leading respondent
companies’ plan use
annually payout
Rewards Strategy and Practice
Salary Structure
Short-term Incentive
Domestic Relocation Policies
Training and Development
Domestic Business Travel
Individual Performance Plan
26.7%
of respondent plans of leading
companies provide individual
performance plan by job
function
44.6%
69.6% of leading respondent
companies’ plan use
annually payout
Team Performance Plan
14.4%
of leading respondent
companies’ plan use annual
payout
50.0%
Over 44.8% of respondent plans of
leading companies provide
team performance plan to
all employees
Increase
Trend
Steady Trend
Market-Leading Practice At a Glance
Sales Bonus Plan
40.5%
of leading respondent
companies" plans use
quarterly payout
48.2%
Over 95.0% of respondent plans of
leading companies provide
sales bonus plan to
employees by job function
Cash Profit Sharing Plan
8.2%
of respondent plans of leading
companies provide cash profit
sharing plan to all employees
50.0%
68.8% of leading respondent
companies’ plan use
annually payout
Sales Commission
9.7%
of respondent plans of leading
companies provide sales
commission plan to employees
by job function
100.0% 57.9%
of leading respondent
companies’ plan use
monthly payout
$1
9
Rewards Strategy and Practice
Salary Structure
Short-term Incentive
Domestic Relocation Policies
Training and Development
Domestic Business Travel
Increase
Trend
Steady Trend
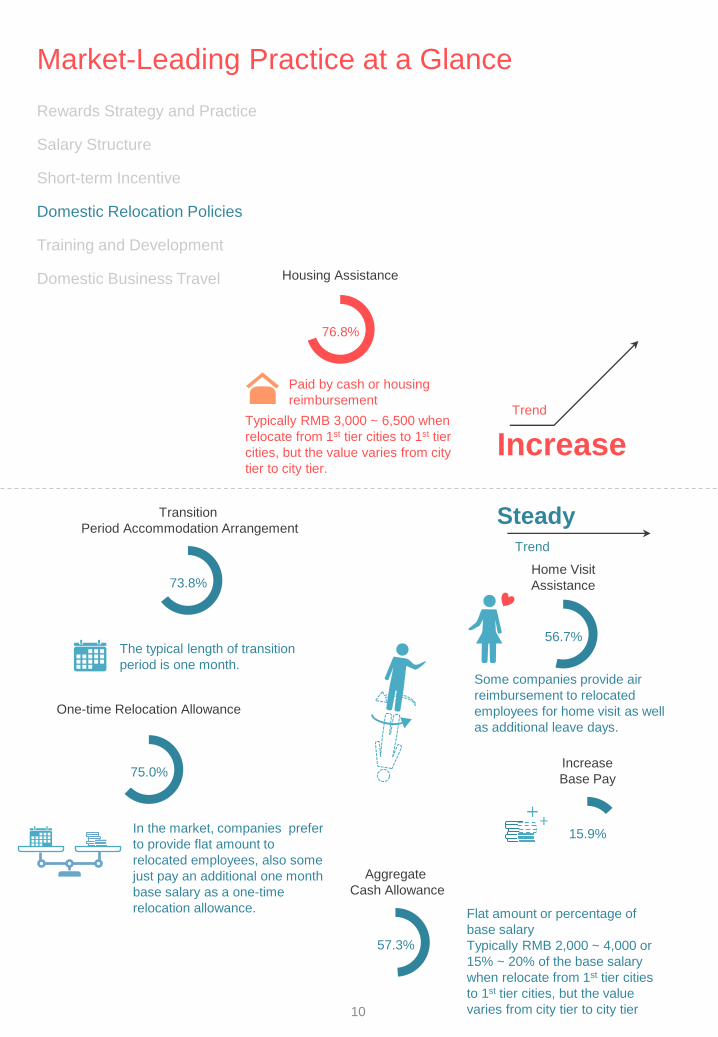
73.8%
Transition
Period Accommodation Arrangement
The typical length of transition
period is one month.
75.0%
One-time Relocation Allowance
In the market, companies prefer
to provide flat amount to
relocated employees, also some
just pay an additional one month
base salary as a one-time
relocation allowance.
57.3%
Aggregate
Cash Allowance
Flat amount or percentage of
base salary
Typically RMB 2,000 ~ 4,000 or
15% ~ 20% of the base salary
when relocate from 1st tier cities
to 1st tier cities, but the value
varies from city tier to city tier
76.8%
Housing Assistance
Paid by cash or housing
reimbursement
Typically RMB 3,000 ~ 6,500 when
relocate from 1st tier cities to 1st tier
cities, but the value varies from city
tier to city tier.
15.9%
Increase
Base Pay
56.7%
Home Visit
Assistance
Some companies provide air
reimbursement to relocated
employees for home visit as well
as additional leave days.
Market-Leading Practice at a Glance
10
Rewards Strategy and Practice
Salary Structure
Short-term Incentive
Domestic Relocation Policies
Training and Development
Domestic Business Travel
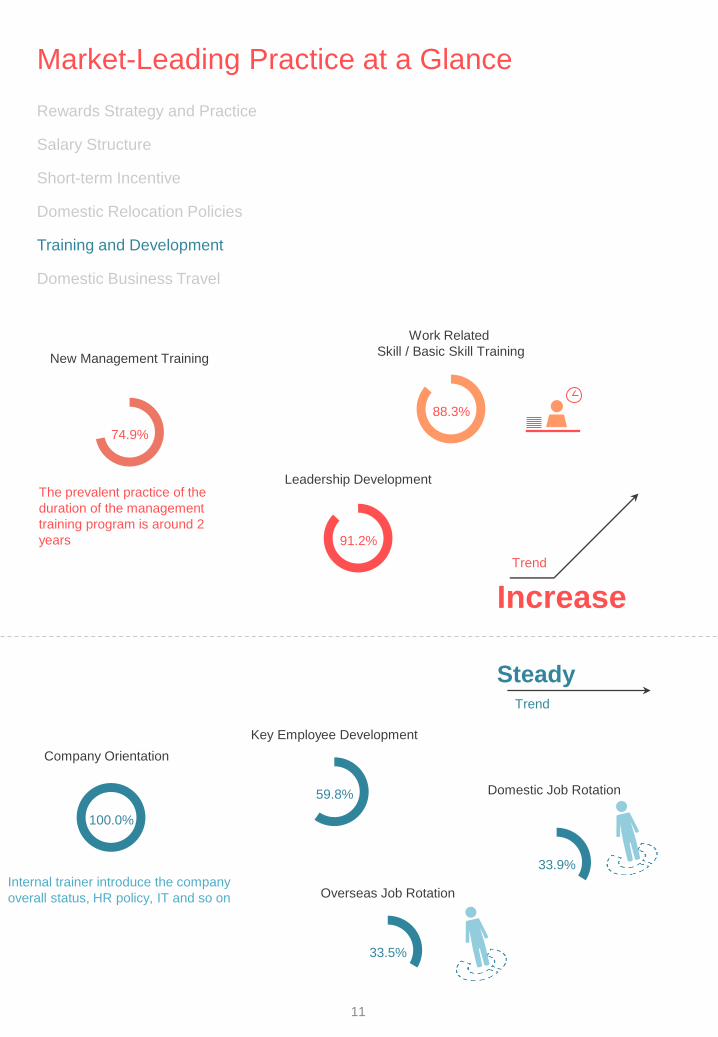
100.0%
Company Orientation
Internal trainer introduce the company
overall status, HR policy, IT and so on
59.8%
Key Employee Development
88.3%
Work Related
Skill / Basic Skill Training
Increase
Trend
Steady Trend
33.5%
Overseas Job Rotation
74.9%
New Management Training
The prevalent practice of the
duration of the management
training program is around 2
years 91.2%
Leadership Development
Market-Leading Practice at a Glance
33.9%
Domestic Job Rotation
11
Rewards Strategy and Practice
Salary Structure
Short-term Incentive
Domestic Relocation Policies
Training and Development
Domestic Business Travel
Steady
Trend
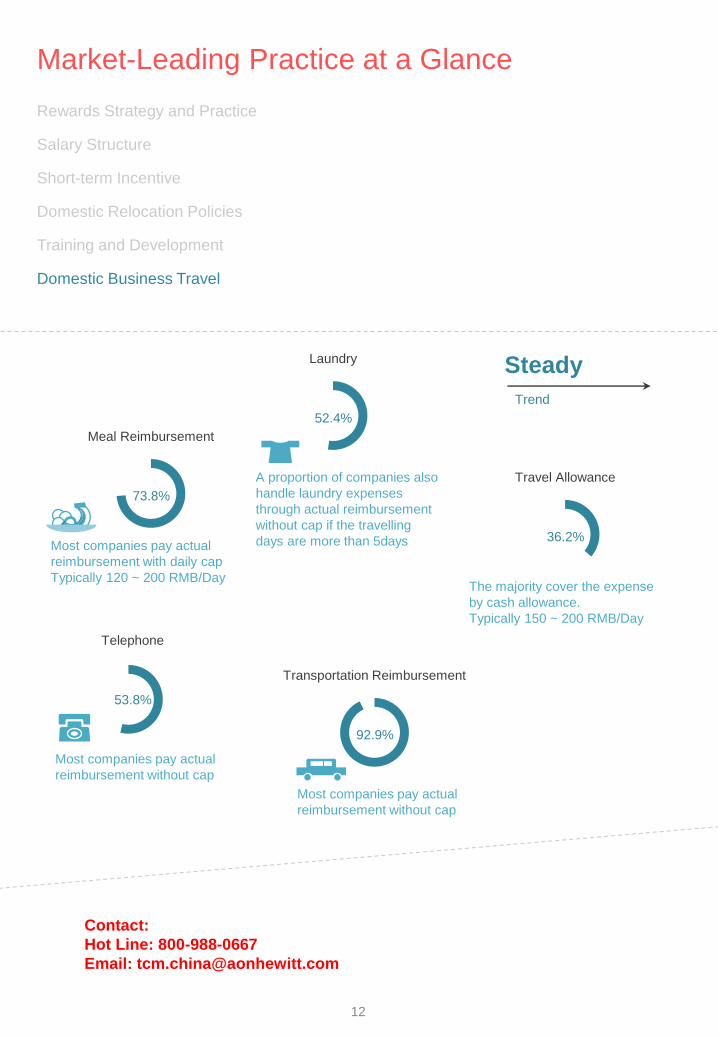
36.2%
Travel Allowance
The majority cover the expense
by cash allowance.
Typically 150 ~ 200 RMB/Day
73.8%
Meal Reimbursement
Most companies pay actual
reimbursement with daily cap
Typically 120 ~ 200 RMB/Day
92.9%
Transportation Reimbursement
Most companies pay actual
reimbursement without cap
53.8%
Telephone
Most companies pay actual
reimbursement without cap
52.4%
Laundry
A proportion of companies also
handle laundry expenses
through actual reimbursement
without cap if the travelling
days are more than 5days
Contact:
Hot Line: 800-988-0667
Email: [email protected]
Market-Leading Practice at a Glance
12