ppowerfulowerful rrelationshipselationships/media/files/financial reports... · ·...
TRANSCRIPT

ANNUAL REPORT2009
PowerfulPowerfulRelationshipsRelationships

PowerfulRelationships
=PowerfulResults
HighlightsHighlights20092009
Earnings before interest, tax, depreciation, amortisation and
fair value movements of fi nancial instruments grew 25 per cent
to $260 million.
Underlying earnings after tax grew 28 per cent to $118.8 million.
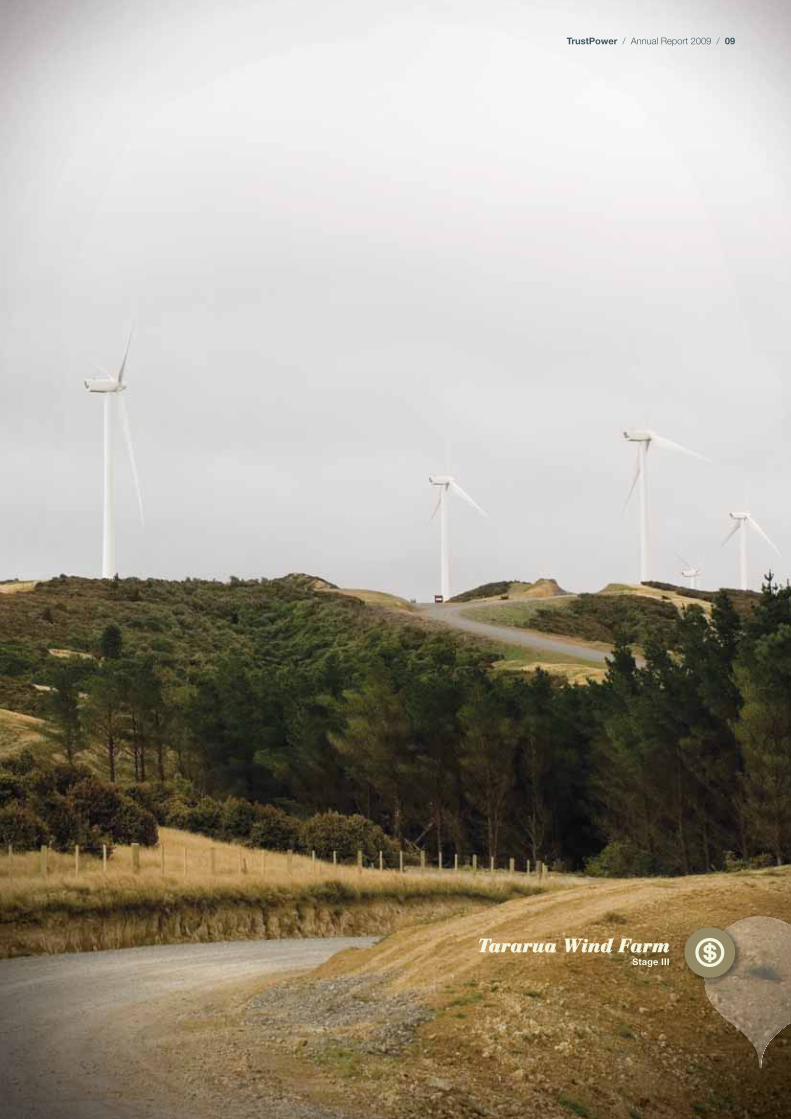
Successful completion of Stage I – comprising 98.7 MW – of Snowtown Wind Farm project in South Australia, the Company’s
fi rst offshore project.
Resilient trading result despite very challenging conditions
experienced through winter 2008.
Strategic FocusStrategic Focus20102010
Complete successful resource consenting outcomes for the Wairau
and Arnold hydro projects.
Implementation of new customer care and billing system.
Protect and grow TrustPower’s premium retail brand.
Development of Australian business strategy including progressing
feasibility of new wind development opportunities in South Australia, Victoria and New South Wales.
Contents
Successful First Project Across the Tasman . . . . . . . . . . 02Directors’ Report . . . . . . . . . . . . . . . . . . . . . . . . . . . . . . . . . . 04Chief Executive’s Report . . . . . . . . . . . . . . . . . . . . . . . . . . . 08Deep Stream, Win-Win for Otago . . . . . . . . . . . . . . . . . . . 12Board of Directors . . . . . . . . . . . . . . . . . . . . . . . . . . . . . . . . . 14Management Team . . . . . . . . . . . . . . . . . . . . . . . . . . . . . . . . 15About this Report . . . . . . . . . . . . . . . . . . . . . . . . . . . . . . . . . 16Sustainability Outlook . . . . . . . . . . . . . . . . . . . . . . . . . . . . . . 17Celebrating Volunteers in our Community . . . . . . . . . . . 20Preferred Partner for Top Energy . . . . . . . . . . . . . . . . . . . . 22Our Customers . . . . . . . . . . . . . . . . . . . . . . . . . . . . . . . . . . . . 24
Relationships Count . . . . . . . . . . . . . . . . . . . . . . . . . . . . . . . 26Environmental Performance . . . . . . . . . . . . . . . . . . . . . . . . 28Sustainable Economic Performance . . . . . . . . . . . . . . . . 31Corporate Governance Statement . . . . . . . . . . . . . . . . . . 34Financial Statements 2009 . . . . . . . . . . . . . . . . . . . . . . . . . 37Auditors’ Report . . . . . . . . . . . . . . . . . . . . . . . . . . . . . . . . . . 38Statutory Information . . . . . . . . . . . . . . . . . . . . . . . . . . . . . . 69Security Holder Information . . . . . . . . . . . . . . . . . . . . . . . . 72Sustainability GRI Index . . . . . . . . . . . . . . . . . . . . . . . . . . . . 74Directory . . . . . . . . . . . . . . . . . . . . . . . . . . . . . . . . . . . . . . . . . . 77Financial Calendar . . . . . . . . . . . . . . . . . . . . . . . . . . . . . . . . . 77

TrustPower / Annual Report 2009 / 01
At TrustPower we believe it’s the quality and At TrustPower we believe it’s the quality and strength of our relationships that set us apart.strength of our relationships that set us apart.
We don’t stop at just what is expected but alwaysWe don’t stop at just what is expected but alwayslook further. What are the extra little things that look further. What are the extra little things that
make a difference? We believe it’s this singlemake a difference? We believe it’s this singleminded commitment that gives us a strategic minded commitment that gives us a strategic
advantage and will continue to deliveradvantage and will continue to deliverpowerful ongoing results.powerful ongoing results.
customers
peoplecommunities
stakeholders
environment

02
BBByyy ttttaaakkkkkiinngg aaannnn oooouuuuttccccooommmmeee ffffooccuusseeedddd aaaannnddd pppprrraaaaggggmmmmmmaaattttiiicccc aaaapppppppprrrrooooaaaacccchhhh ttooo tthhheeee ccoonnsssttttrrrruuctionnn oofff tthhhee Snoowtowwn WWWWiiinnnndddd FFFFaaaarrrrmmmm,,,, oouuurrrr fifififi rrrssstttt eeennnnttttrrrryyyy iinnttoo Ausssttrrrraaaalliiaa, wwee wweere able tto dddeeelliiivveeeer tthee pppprrrroooojjjjeeeecccctttt aaaahhhheeeaadddd oooff aaaalllllll exxppeeeccccttaatiions. NNooww sseeccuurreellyy iinn ooopppeeraaattiioonnnnaaaalll pppphhhhaaaasssseeee,,, tttthhhheeee wwwwiiiinnnndddd ffaarrmmmm iiss ppeerrffoorrmminngg bbrriillliiaannttllyy.POPOWEWWEEERRFFULUL RELELATATIOIONSNSHIHIPSPS == PPOWOWERERERERRRRRFUFUFF L L RERESUSUSUUSUSS LTLLTLTSSSS
Successful First Project Across the Tasman

TrustPower / Annual Report 2009 / 03
Adapt and Deliver Adapt and Deliver in a New Countryin a New CountryBuilding new relationships was a key focus prior to and during construction of the Snowtown Wind Farm. A key relationship was, naturally, with turbine supplier, Suzlon Energy Australia Pty Ltd, which had a “turnkey” contract to supply, install, and commission the entire project. Our relationship with Suzlon, meant both parties could maintain an open, fair and trustworthy approach, ensuring everybody focused on results rather than getting sidelined as inevitable issues and challenges arose. The relationship was such that Suzlon happily allowed TrustPower direct contact with project sub-suppliers, giving us a signifi cant network of people and expertise to call on for future Australian projects.
alialaliialililiiiiiliiiiiaaa aa aaa aa aaaaaaaaaaaa EstEstEstEEstEstEstEsEsEstEsEststablaablblablablablablablbablblablllaabababbbbbb ishishishishishishhshhiishshishishsshiiingingingingingingingngingngingnginginggggnginggg an an an a annnnnnnnananana as asas as asasasasssa setsetsetsetetettsetsesetsesssss inininininninininininnnin inn inn innin AuAuAuAuAuAuAuAuAuAuAuAuAuAu Au Au AuAuA strstrstrstrstrstrststrstrttststrtstrstss alialalialialalialialiaalia aaweweweweweweeeweww r r wr wr wr wwr wr wwr wwwwwithithithithhhhhhhithhithithithithithhth a a a aa aaaaa a nonotnotnototnotnotnotnotnonotnotnotnonnottt ononononon onnnnnn onoo ly ly lyly lyyyly ly lylyylyyy proproproprproproooproooppppppropropprooovidvidvidvidvidvidividvidvidvididdvididvv es es es es es sses eses eeeeeseeese TruTruTruTruTruTruTTruTruTruTruTTruTTT stPstPstPststPstPstPtPstPstPPs oweoweowwoweweweoweoweeowowwowwwwwww
t alalal alaalaal alalalalalalalalllllsoso sososo oo sossosssooso soo oo addaddaddaddaddaddaddadadddaadaddaddadda ddadddaa ss ts ts tss ts ttttttts ts ts o o ooo oo oooooooplaplaplalplaplaplaplaplaplaplappppplaplaplaplaplap tfotfotfotfotfotfotfotfoofoootfotfotfofoffofoorm rmrmrm rm rm m rmrm rrrmrmm forforforforforforforoforforofoorrfoffff r g g gr g grgrgrgr grg g ggrgg grggg grgrowtowtowtowtowtwtowtowtowwtowowwowwwow h, hh, hhhh, hh, h,hh,h, butbutbutbutbutbutbututbutbubutbbubuuuubututu alaa amememememememememeememeemememmememmemem d dididdidi didi didididi ddi di di verveveverveerverererrrvervvvevevvv rerrveveeereverrrrverrv revee sitsitsitsitsitsitiisittitsitsissitsititiittsitsitttsitssitsss ts y wy w wy wy wwy wy wy wy wwy wwy wwwwwwwwwwy wy wy wyyyyy eeee e e e eeee ee eeeeeeeethethethethethethethethehethehthetththethhh ge ge ge geegege ge ge gegegenenernernnerernernerrenerrrnernenernnenennere atiatiatitatiatiatiatiatiatitaaatiatiaatiatiatitiatitiatiatiaatiataa oooooonononononooooooonoononon onoon oonoononon n incincincincncccncncncnncnnincnnininciiii omomomomommmomomoooommmoo
nnnn Ne Ne NeNNeNeNNeNeNeNeNeNe NNee NeNNNN NeNNNNNew Zw Zw Zw Zw ZZ Zw ZZZZZZZw Zw Zw Zw Zw Zw ZZw ZZw Zw Zw Zw Zw Zww Zw ZZZw Zw Zw ZZZZZZw eealealealealealealllealealaalaealalaeeeaeallalalealalaaaeaae andandandandandandanddanddanddandanddandandandandandandndandandanda ddddandaaandandaanaandd BBBBBBBBBBB. BBBBBBBBB. B. B. BBBBB. BB. B. BBBB. BBBBB. . BBBB yyyy yy yyy yy yyyyy y yyyyyyyyycurcccurcurcurcurcurccccurcurcuuuuu renrererenrenennnnrennnrenrenrennr tlytlytlytlytlytlytlytlytlytlyltlytlytlytlyltlltlyy en enenenene en enenenn ee joyjoyoyjoyjoyjoyjoyojojoyjoyjoyjoyyjj in in inin in inin innnnnin N NNNNNNbb eeeeeeeeeeeee ooofofoo of of ofof of of ofofof ofofofooffof of th ththth thth th th thth thth thththtththththht thhhh thtt the be bee be be be be be be be bee beeeeee bee bbe b be bbestesteseseststesttteste testestesestestessttesteestestessts wwi www wi wi wiwiwiw wiii wiwwwiwwwwiwiwwiwiwiwww wiwww ndndndndndnddndnddndnd dnd ndndnndnd nddnnnnnd nnndndndnnnnddnnnnd farfarfarfarfarfarffarffarfarfararfffaffaf m m mmmm mm mmmmbuibuibuibuibuibuiuibuiuibubububuiiiuiuiuibuuibuu ldldildildildildildildlldildll nng ngng ngngng ngnnngng ng ng oonon onon onononoonononnono oneoneoneononeoneoneneonneneonennsitsisitssitsitsitsitsitsisitsitsittsitsss tts e aaaaraaaaaraaarralialialiailialialialialialiaiaaliaiaaaaiaiaiiai , w, ww, w, w, ww, wwwwwwww, wwww, w, www, e he he he he hhe hee he he he he hhe hhhhe hee he he he hhaaveaveaveaveaveaveaveaveaveaveaaveeavavevveveaveaveavevaveavavvavve es eseses eses eseseseseses eseesssseesssesesee tabtabtabtabtabababbbbabtabbtabtatabbtabtabtaabtaabtabtatattata lislislislislisiiislisilislislilislislislisslisisislislisislisisssssssshedhedhedheddddhedhedheddhedhedhedhhhedhhedhedhhehhhehedheeededde itittttiittes es eseeesesesses eseses ssssesssssesses inin nininininininininnn nnnnnnn AusAusAusussAusAuususAAAAAAAAAuuusAuAuuusAuAuAuuuussuuuAuuAAAustrtratrtratratratttrarttrra sa sa sa sa sa sssa sa a sa sa sa sa sa ssaa saaaa ssssssa sa seeeeeeeeeeeeeeeee ccncncnccncncnccccccccccccccccccccccccomeomeomeomeomeomeomeomeomemeeemememeomeomomemeomeomomemomomeomemomememomoo eoo ee ststsstsstststststst st sststststtt s st s stst ststssstsststststtstsss reareareaereareareaeeareeareareareaeaeaaeaareareareaeareaee m cm cm cm cm cm cm cm cm cm cm cm cm cm ccm cm compompompompompompompompomomommompompompompompompomompompommmpompo pomppmo letletetletletletletetletetetetetetetletetleletelettteeeteeteee elyelyelylelyelyyelyyelyelyyelyelyelylyelyelyelyelelylyyeleelylyyellylelyelyyyyye yy ecuecuecuecuececueccecuuuucucuccucure rere rerere re reerere rre rerrree inincncncinncincinciininncnnnncncnnnnnnnnnnnnnnnnnnnnnnncnniniindindindndndnddddnddinddddindindindinndndindindndddinindininndeeepepepepepepepepeppepepppepepepepepepepeeeeeppeep eeeeeeeeeeeeeeeeeent ntntnt ntnt nt ntnt nntnnnnntnnnnnntnt ofofofofofofofofof offoooof ofooof ofofoffof of ooo NewNewNNNNewNNewNewNewNewNewNewNewNewNewNewNewwNewNewNewNewNewNewNewNewNewNewewNewNewNeeweNewNewNewNewwwewwNeNeewwNNewewwNNN wwwwwww Ze ZeZe ZeZeZeZZeZeZe ZeZeZZee ZeZZeZeeZeeZeZeZZZ ZZZ ZZ Z lllllalalalaalaalaalaalaalalaalaalalalaalaalalaaalaaalaalaalaalaalaalaalaalaalaalaalaalaalaaaalaalaalaalaalaalaalaaalaalalaaaaaaalaaalaaaaaaaaaaaalalaalaaaaaaaaalaaalaaaaaa nndnd nd ndd ndndndnndddndndndnnndnnnddnnndnddnnnndndnndnnnnnnnndndndndndnnnddn weaweaweaweaweaweaweaweaweaeweaweaweawewwweweawweaweeweaewweaeweaweewwewewwwwwww awwwwww thetheththhthethethethhthehtheheththethehhethethethethethethhehethethettttheheerrrrrrr rrrrrrrrrrr rrrrrrrpepepepepepepepepeepepepepeeeeeeependendendendedndendendendedndedndeddddnddandandandandandandnandandnandanddandndandandandandandnddandddnddda dddddaa m mmm mmmmm mmmmmm mmmmmmmm kekekekekekekekekeeekekekekekekekekeeeeeeeeeeekeeeeekeekek t ct ct ct ct ccct ct ct ct cttt ct ct ct ct ctt t ctttttttt ccttt ctt cttt cccondondondondondondondonondondondnddondondondondondonddonndondondnondndondondondonnonnndnddddondo itiitiititiitiitiitiitiitiitiitttiitittititititititttttionsonsonsonononsonsooonsonsnnononsnnnnsssssssssssnsonsooononnsssssssnsonsonsonsnonsssssssnsnssssonnnnsssonsnnssonssnnonsnnsonsnonsonssnnssonsons.....mamammaamaamaamaaaaaaarkrkrkrkkrkrrkrkrkkk
AsAs AsAs As As As AsAsAss s s As As AsAs As AAsAsAs AsAAAAAAAsAAAssAsAsAsA papapapapapapapapapapapapapapapapapapapppaapapppaaapppppapapapapapppparararararaararraarararararaaaaaraaa tt ot ot ot ot ooot ot oot ott oot oot oot ot of of of of of of of of off of off of of off of off of oooff oof off uururur ur ur ururuuuur uruur uuurr focfocfocfofocfococfocfococfocfocfocfocoocfocfocfoffoooo us usus usuussus uus susususus uususuus uuuuuu oon ononon on on n n oonnnon thethethethethethethethehethethethethethehthett e envenvenvenvenvenveenenvenvenvenvenvnvnvenvvvvenvenvnvenvenvenvenvenvnnvnvenvenvennnveneennenvene vve iiriiririiiiiiiiiiiroroiroroirorororooororooroooroorrorororirir nmenmenmnmemnmenmnmenmenmenmenmemnmnmnmeenmenmenmenmeemnmenmen nt,nntnt,nt,nt,tntntnt,nnt,tnt,nnttnnnnt,nt, w wew weweweweeweewe wewewwweewwewee wew es e es esesesesesesses essseesess tatabtabtabtabtababtabtababtabtabbtabtabtatabtabbbbabat blislislislisisssslissisisslisslissllisli hedhedhedhedhedhedheddedhedhhedhedhhedhhedhedeeheehhhheeed st st stst st stt stst st stsssssst stststronronronronronronronronronononronronronrononononoooorororrorr nno gg gggg gg g g ggggggggggggggggrelrelrelrelrelrerelrelelrelrelreeelrelrelrelreelrelreleeeereeelelllllr lelee aaaaaaaaaaaaaaaaaaaaaaaaaaaaaatiatatiatiatiatiattittititiitiittatt onsoonsonsonsonsononononsonsonsonononsnnsonsoonsononnonnsnnnonnnonononsonsoonsnsonssshiphiphipiphiphiphiphiphhipihipph piphiphhhiphiphihipips ws s ws ws ws ws wws wws wwwsssss ws ws wwws ithithithithhhithithhithhhhithithhhtttt ththththththththththththththhth the Ae Ae Ae Ae Ae AAAe AAe Ae AAe Ae Aeeeee boborborborborborborbororbboborborrrborrorbbobbbobooorigiigigigigiigiigiigiggiggigigiggigiigigiiigiii nalnannalnalnalnalnalnalnalnalnallnanaalnaallnalna peoppeopeopeopeopepeopepeoeopeopeopeopeoppeoepeopeopppeopeopepeeeopeoopppeeeopppppp oeooeoeoopeeopeooeoopepepeop opeopepeooooooooooooooooooplepplepleplepleplepleplepleplepleplepleplepplepleplepp eplepple iin in in ininin in inninnnnnnnnn th ththth ththhtht thth thththth ththhhhh eeee Se Se Se Se Se Se Se Se Se Se Se See Se Se SSSSSeee See Snonownownownownowowownowwwnownownoowwon won woo towtowtowtototowtowtowowowowwtowowowtowwtowowown rn rn rnnn rn rn rnn n r n rrrn rn rrrreegiegiegiegiegiegiegiegeggegiegiegegegiegiegieggiee on.on.on.onon.on.on.ooon.ononnon.onnon TheTheTheTheTheTheThhTheheTheeheeTheTheTheThhehehTheThhTheThehheheeTheTT eThTheTheheehhThThhhhhThhThThhhhehThheeeeeeeeeeeesesese se se se se seseseseseseesseeessee rerelrerelrelrelrelrelrelreleleleeelllee atiatatatiatiatatatiatiiatiiatiattattiatittititiata iaaattttiooononsonsonsonsonsonsnsnsnsoonssnsnsonssnsonsoooonoooo sssnssshiphiphiphiphhiphiphiphiphhiphiphiphiphiphhhipppps rss rs rs rs rrs rs rs rss rs rs resuesuesuesuesesuesuesususuesueesueesususueseee usultelteltelteteteltelteltettlteltelltetltttteeeed idd id id id id id idd i id idd iddd idddd ddd n tn tnnn tn ttn tn tn ttn tn tn n tnnnn tn tn ttn hehe hehe hehe hhe eheheheeheheelocloclococococlocloclococococococlococlocococl cocococloccoccoloool cloccaaaaaaaaaaaaaaaaaaaaalal alaal al aaalaal AAAboAboAboAboAboAbooAboAAAbooAboAAAAboAAboA oA oAAb iiirigrigrigrigrigrigriggriggrr grr grigrigriggginainainainnainainainainaanaiininaaininininanaall pl pl pl pl ppl pl pl pppl ppp pl plll ppl eopeopeopeopeoooeopeopeopeoppeopeopeopeopopeopeopeoeopoooooeeoo lelleele ele le eleleeeeeee e haphaphaphaphaphaphaphaphaphapaphaaphapaphaphapapahapaphhaphapphhh ppilpilpilpilpilpilpilpilppilpilpipilippipiiipilppp y y yyyyy yyyyyy yyyy yyyyyyyyyyyyyyyyyyyyyyyyyyyyyyatattattattatattattattattattattattattattattattatattattattattattaattattttattttatttttattttattattaattttttttttttttttttttttttttttttttttttatttttattttttttttatatttaaaaattaaaatttttattttaattttttaaaa eneneneneneneeeneeneeneneeeeeneneeeeeneeeeeeeenenndnddnddnddndndndndndndndndndnddnddndndddndingingingngngngngingginginginginginggingngngngingingnggggggg ththt thtth th thtthh ththtthht thtttttthtththttt e se se see se se se se see seeeee se ee e se iteiteiteiteiteiteiteteiteteteiteiteiteet as as asasaas asasass aaaasasasasaaaaaaaas a an anaan an an anan an ananananaanannaanand wd wd wd wd wd wd wd wd www w wd wd wwwd wwwd wd wwdd wd wwd wd wd wwdd wddd hehenhenhehehenhenhenenhenhenhenhenhehenheheennenennenehhhehehhhehh nnnh n reqrreqreqrereqreqeqeqeqeqreqreqqqreqqqreqeqeqqreqreqeqrererereqreererererereqereereqeeeeeeqequiruiruiruiruiruiuiruiiiiiuiriiiuiruiuiiiiiiuiruiruiruiriruiruiruiuiruiruuiruiruiruiruuuiuiuiruiuiuirruiruiruirruirrriirrruiruu eeeeeerrrrrrrrrrrreeed,ed,ed,eded,ed,ed,ed,ed,ed,ededed,ededed,ed,ed,ed,ed,ded,ed,ed,eded,edd,,,, as asaas as aaas as a asaaaa as sississississississisisissississsistintintintintinntintintintttininng tg tg tg ttg tgg tg tg ttg t g he he he hehe hehe he he eheheheee concococonconconconconcooconcocoooncoconc strstrstrstrststststrstrststrstrst uctuctuctuctuctucucuctctucttuctucctuctionionionionionioniononionionionononnoonnonnonoonnn ttteateateateateateateateateateateateateeateateetteateattteaeaaeeeeeaeaeeam tm tm tmm tm tm ttm ttm tm ttm tmmm ttm tmm tm ttm ttmm tooooo ooo o oooo oooooooo ooooooo ao ao ao ao ao aao ao aavoivoivoivoioivoiiiioivoioivoivoivoivovovvvvo d ad aad ad ad ad adddd ad ad ad ad ad ad dd ad addddd aareareaeareareareaeareareaarearrereee s os os os os os os os os os oooooooooss os f hf hf hf hf hf hf hf f hf hf hf hf hhhf hhf hffff hf hf hff hhhf iststististstististttististtististisiiiii oorioooriorioriioriooo cc c c cccccsigsigsigigigsigsigsigsigsigsigsigsigsigigsigssigsiggsiggsisiggsigiigs gnifinifinifinifinifinifinifinifinififinifinifinififinnifinifinninifinifiififinnifi caccaca ca ca cacacaa ca caca caaacacaaaaacaccaca cacc cancencencenncnncnncncncncencncenncccencceececececececeececee, a, a, a, a, a, a, aa, a, aaa, a, a, aa, , and ndndndndd nd ndndnd nd nnd nn ararearearearearearearearearearearearaaaa eas asasasasasasasasas asaasssasaaasass conconcconconcononconoconcononconconconco taitaitaiaiitataitaaaiatata ninninninninninninnninninn g g gg g ggggnatnatnatnatnatnatnatnatnatnatnatnatnatnatnanatnanatnananatnananatnatnatnnanatnatnnnnnnnnannatnatnatnnnannnnan iiveiveiveiveiveiveiveveiveiveviveivevvevveiveviveiveveiveveiviveiveveveveveveeeev ve veveve ve ve ve vevevev vve ve ve ve veeeveve vevvevvvvve vvvvvv v vegetgegetgetgegetgetgettgetgetgetgetgetgetgetgetgetgetegetgeteeeetggegeetgetgetgegeg atiatatiatatatiatatatiaatiatatiatitaataatitiiiatiatiatiatitiiatiatatitatitiion.on.on.on.on.oonon.on.non.n.on.on.on.on.non.non.on.n Fo Fo Fo FoFo Fooo FoFooFFoFF Fo FoFoooFooFoFoollllollollollolloollollollolloollollollloooll owinwinwinwinwinwinwinwiiiwiwinwinww nng g g gg gg g g gggggggcomcomcomcomcomomomomoocomomomcomcomcomomomcoocomomcoccccocomcco plepleplepleplepleppleepleeplepleplepleplpplepleeeplpppllepllelelpppp titiotiotiotiotiotiotiotiotioooitiotiotiiotiootiotiotitiotiot ot oooooot n on on on on on on on oon oooon on on on oon ooon on on oon nnnn ooon oooof tf tf tf tf tf tff ttf tf tf tf tf tf tf tf tff tf tff tf tttffff ttf tff the hehehehhhehehehehehehehe hhe ehheeheheheeee ppppppppp ood odod odddod ddddod dooddddodddheeeeeeee proproproproproproproproprpropproprorprorpprojecjecjecjecjecjecjecjecjececjececjjejecjececje t, t, t, t, t, t,t,t, ttttt,,, thethethethethethethethethethethethethethehethehe go gogg go go go gogg gog gooo googoggg od odododdododdododddodododdoooworworworworworwororworworworwworworworworworwwworwoorwororworworworrrworrorworw rrw kinkinkinkinkinkikinkinnkkinkinkinkinkinkinkinnkinkinkinkkkinkininnnnnnkinnnk nk g rg rg rg rgg rrg rrg rg rgg rg rgg rgg rgg rg rg rg rg g rgggg rgg g rg elaelaelaelaelaelaelaelaelaelaaaaelaaaelaelaelelaeelaelaelaaaaelae aelaae aelaelaeeleleelele tititiotioiotiotiotioiotiotiotiotiottiotiotiotiioioot oioioootitioi nshnshnshnshnshshnshshhshshshnshnshnshnshnshnshshnshnshnshnshnsshnnnshnnsnshshnsnshnnsshsnsnshnshnshns ip ipip ipip ipipippipiip iippip ip pppip ipip ccccc ss ananananananan ananannanananan anananananaannananannnananananaananandddddddddd dddddd dddd dd dddd pppppppp conconcoconconcononconconconconconoconnnoncc noncontintintintintintintinintininintinintttiniinintttii uesuesuesuesuesuesuesuesuesueueseueueueessssssssues a a aaaa awwe wwewe we we we wewwwe wwe wewe we wwwwwwwwwwwewewwwweeweewe areaaareareareareareareareearereareaareareeeareeeeeareeeea eaa eaaaa eeeaa eeeereeer alal al al aalal al alla alaalaallalllalaaalaa rearerererereareareeeareareaeareaerearrrereaearreearerearreareaeeaeaee dy dy dy dy dy dy dy dy dydydydydy dydy dy ydydydydy ydy dyydyyy iinvinvinvinvinvinvinvinvinvinvinvnvinvnvnvinvnvnvvinvnvi vvvnnviiinnnvn olvolvolvolvolvolvolvolvolvolvolvolvolvolvolvolvvolvolvoolvolvolvolvoolvolvolvooooo vvo vingingingngnginginginginginginginginngngningninnniii ggg gggggggggggggggggggggggggggggggggggrourourourourourourourourourourooourourourourourrorourourooorourouooorour p ip ipp iip ip ip ip ip ip p ip ip p ip ip ip p ip ip ip ipppppp nnn n nnn nnnnnn nnnnngngngngnggnggggggggggggg ththt th thh t thththththththtthe ge ge ge ge ge gee e ge e e e e gee ge ethethethethethethethethethethehethethethetheththetthethehhehehhthehhtheheeeheeeeheehehettt e pl pl pl pl pl plplplpl pl plpl pl p pl pl pl plplplpppll p ppll plplppppp annannannannannannannananannannannannannannannannaaannannaannannannannannannanna nnnananannnnannningingingingngngnggngngngngingngnggnginginggingingnggingiinginggngnginngggggg of ofof ofof ofofof of of ofooofof ofofofo of ofofoffffofoff ofo StStStSS StStSt StSt StSt StStSS StStStSSS StStSSttSSttttSt St StStStSStStageageageageageageageagegeagageageeaageageageageageaageagagageageaggeagaagegeagea eageag 2 2 2 22222 2 2 2222 22 2222 22 oooooooooooooo hethehththethehehethehthehehethethehethhehetheheheheheheheheheeheeehhheeheeeh of ofof of of foof ffofoof oooo thtthhtttttttttttSSnoSnoSnoSnoSnoSnoSnonoSnoSnoSnoSnoSnoSnonoSnoSnoSnoSnoSnonnonoSnoSnoSnonnnnooSnnSnnnnSnonoowtowtowtowtowtowtowtowtowtotwtowtowtotowtowtowtotwtowtototototootowtowtowtotoooowtowtowtwtowtoowtowwwwtw wwnwn wn wwn wnwn wn wn nnnnwnwn wnwnwnwnnnnnwnwnn wn wn nnnnnnnwn wnwnwwnnnnnnnwwnnnnnnw devdevdevdevdevdevdevdevdevdedevdevddevdevdevevdevdevevevdedeedevdeededdevdevedevd vdevede eloeloeloeloeloeeloeloeloeloeloeloeloeloeloeloeloeloeleloeloeloeloeloeloeelolloelololl pmepmepmepmepmpmpmepmpmepmepmepmepmepmepmemepmepmemepmepmmpmepmpmpmemepmeepmpmempmeepmepmempppmp nt.ntntnt.nt.nnt.nt.nt.nt.nt.ntnt.ntntntntnt.nt.nt.nt.t.ntntntntnt.n
TheTheTheTheTheTheTheTheTheTheTTheTheeTTTheThTThee Sn Sn Sn SnSnSSnSnSnSnSn Sn SnnSnowtowtowtowtowtwtowtowwwowowtowtowtooow ooottttownownownownwnwnwnownowww cococ co co cocommummummumumummmmmmummumunitnitnitnitnitnitnitnity wy wy wy wy wy wyy wyyy wwy waas asas asaasas asheahehehheaheaheaheaheaheaheaheaheaheaheaeeaeeavilvilvililvilivivivvily iy iy iy iy iiiyy iy y iiy iyy iyy iy iy nnnnnnnnnnnvonvonvovonvonvonvonvonvoovv lvelvelvelvelvvlvelvevelveveved id iddd idd id id d id id innn tn tn tn tn tnnn tn tn thehehe he heheheheheh proproproproproproprooprppp jecjecjecjecjecjeccjeceeject, t, t, tt, t, t,t, incincincincinncincncncnccncncccciinccn lludludludludluddludl dlududududludludludluddddddiniinininiinininininningngngngngingnngingngn su sususu suusu susussus su susuupplpplpplpppplplpplppplpplpplpppppp yinyiyinyinyinyinyinyinyinnyiny nininny llg lg lg lg g lgg lg aboabobboaboabooaboaboababoaba oa ur ur uur ururuuuurruu andandandandandandddandandnaa accaccaccaccccaccaccacccaccaaccaccaaccaccacccccacccaccaccaccccccccacccomomomomooomomoomomooomomoommomomomooommmmmmmmmmmmmmmmmmmm odaododaodadaodaaodaaodaodaodaoododao tiotiotioitiotiotiotiootioottionnn. nnnn. nn.n. n. nnn TheThThTheheheThTheeThTheTT eTTheehe wiw wiiiwiw ww wiw wwiindddndndnd ndnd ndndddd ndnd ffffarfarrfarfaafarfara m m mmmmmm mmmopeopeopeopepeopopopeeeooo ep nnnnnnnninninninninnnininninng cg cg cg cg cg cg cg cg eereereereereereereeee monmonononmoonomonnmonm y, yyy, yyy helh lhelhehehelhelelhelhelhelhhh d od od oodd o oood oddd n tn tn tn tttn tn tttthhehhehhe hehe hehe e hehhhhh maimaimaimaimaimaiiinn n n nnssstststrstrstrstrstrststrstrs eeeeeeeeeeeeeeeteeteeteteteet of of of ofofofofo th thth thhhe te te e tte ttownownownownownowownownowwwnshishihshihshiishissh p ip ip ip iiipp pp n tn tn tn tn tttn tn ttnn tn the he he hhehe e e e fofoforfororforforfoforfo m om oom om om omm f ffffffa oa oa oa oa oa oa oa oaa oa oa oa oooa ooaa nnnnnnnne-nenene-nnne-ne-nenee dayddayddayddayyydadaydaydayy fefefe fefefe fefefestistististitstistististististivalvavalvalvalvalvalvavalvalvalv , ww, ww, w, ww, ww ww, w, wwaaaaaasas asas s ss ass aas s s plapplaplaplaplaplaplaplaplap nnennennenneeed wd wwd wd wd d ithithithiththithhhhhttththt thethethethethhehhthhethehethetheethethethee lo lololololl lololocalllcalcallcalcalcacal CoCoC CoC Co Co CoCo CoCommummummummummmumummummunitnitnitnitnitnitni y Myy My MMy MMy MMy Manaanaanaananananagemgemgemmgemgemmmg eeentenenentntentntnteentnteenttt AssAssAssAssAssAssssAssAssAsssssssssssssAssssA ssssssssociociiociocociocc atiatatiattatiaa on.on.onnoonon CeCeCeCCCe CeCeCe CeCeCeCeelebl bblebbleblebeblebeebblebe tttratttratrratraatr ingingngingininginginginnginggngg nonnonono no no no nonono n t ot ot oot ot oot oottt t ooot t nlnlynnlynlynlynlynlnnlylyyyy tththethetheeththeheethhethehhththeheee wiwiwiwiwwiwwiw nd nd nd nd nd nd nd nnd farfarfarfarfarfarfararfararara m, m,m,m, mm, m,m, m, mmm, butbutbutbutbutbutbutbutbuttb t al al aaala alal ala so so so soso osoooo thethethehethetheeht e wi wiw www derderderderderdededderde comcomomcommo i iiritttttt ititittititit attattattttattattattttatttraracraracracaccrracracacraccctedtedtedtedtedtedtedtedtedtedtedtedd an ananan an ananana mmmunmunu ityity sp spspiriirir t, t, it it it aestestesttestesestestimimiimi tttto ao ao aaoo aaaaao ao aa to tottototot tototo totoootownwnwnwnwwnwwnwnwnwnwnmamamatedtedted 2,2 2,00000000 pe pep oplople te to ao awitwitwwitittwitwwitwwith ah ahhh ah ah ah ah ah a aa po popop pulpulpulpulpu atiatiation oon of off jusjusst 4t 444400.0000.
TheTTheTheTheTheTheTheTTheTThTheThTheee rerererereeeeee rer rere rereeeeeelatlatlatlatlattlatlatttllatlatlataattionioniononioniononionioniooioioooooo shishishihhshishishshhihhhs ps pspsps ps pspsss pspppssp betetbetetbbetbebebetbetbeetb weeweweeweeweeweeeeeeeeeweeweeweeeweewweeeewee n onnn on oonnn on on on on oon onn ooouur ururur ur ururur uuur r stastastatstastastastaastaafffffffff ff ffff ff f andandndandanandandaandddddandandnn coc co cocococo co cococcocontrntrntrntntrntrntrntrntrntrrntractactactactactactacttctctc orsorsorsorsssorsorsorsorsorsoro s wewerwerwwewerwerwerwereerwerwwererwere ee ee ee ee ee ee ee eee eextextextextextextextextexteextensinsinsinsinsisinsinsinsinsnnsnsnsnsnsnsnsns ve.ve.ve.ve.ve.ve.eeve.eevve A A A A A A AAA AA googoogoooogooggoogoogoogoogooggoo d ed ed eed ed ed ed eed d examxamxamxamxamamxamxamamxamxamxammmmpleplepleplplplepleplppplpleplepleeep of ofofof ofof of of of offofoff lilililili li liliaisaisiaisaisaisaisaisaisaisaisaisaaisaiaisa on on on oon on on oonoon ono wwiwwitwitwitwitwittwitwitw ttw twittwwitwitwittww hh h th th thh thhh hh th thhhh thh thhh thhhhehehhe hehe hhe hhe hehe hhehe locloclococlocllloclococloclocololoclocloclolooccccccccccc lalllalalalalalal al alaalcomcomcomcomcomomcomcococcomcommcomccomcomco munmumumunmmunmunmunmummunnmuunmunnnnunnnununmunnnnnnnnnnnu ityitytyititytityitytyityitityitityitytyityityitytyityityitytytyyyyyyyy ananananananannananananan anana an ana aand kd kd kkkkkkd kd kkddd kd kkkd d key eyeyeyey yyey eyeyey eyeyyeeyey eyyy stastastastastastastastastastttasstastaststasts kehkehkehkehkehkehhhkehkehhhkehkehehekehkehkehehkehhkee oldoldoldoldoldlddddooooldoldoldooldoldoldoo erserserseerrersrsrsserserssreerserseerserser oc ocococ ococ ocococococ oocococccurcurcurucucurcurcuucurcurcurcurcurcurucuc redredredreddddreddredddredredrededdedereded whwhwh whwhwhwh whwhwhwh wh wheeen en en en en nnnn en nennenne thethethehthethethethethhhehttheheee loclocloclocloclocoocococcococal al al al alal al aala bbusbusbusbusbusbbbusbusbusbubusb hhfi hfihfihfi hfi fi hfi fifihfi hfi hfi hfi firere re rerererreerrere fi gfifi gfi gfi gfi gfi gfifigfi gfigfi htihtihtihhhtihtihhtt ng ng ng gng ggg teateateateaeaeaeaaattetee m wm wm wm wm wm wmm wm wwwwwm asasassasasas as s sas shoshoshhhhhoshoshoshohoshoshoshohshohhshoshoshoshoshosh wnwn wnwnnwnwnwnwnwwwwwwwnnwn wn nwnwnwn aroaroaroaroaroaroarororoaroroaarooaroaroaaa undundundundundundundundundndnduuunduundundundundundunddddd th th ththh th ththththh t t t t e se se se se see iteiteiteettitettiteiteeeeettt , , , ,, ,,totottototo totototo tto to to toooto helhelhelelhelhhelhehehelhehehelhhee p tp tp tp tp tp tp tp tpp hemhemhemhemhememhhemhemhh ununnununununuuunnderdderderderdererdderdederderderd rrrstastattstattstastastastastasttaasttastssstsstss dndnd ddnd ddnd dndndndnndnnd worworworworwowoowowowowoworowoworo k ok ok okk ok ok ok ookkkkk n sn sn sn snn snn sn snn siteiteteteitetetiteiteiteee a ananananananana an anaaa d dd dd dd dd dd dd ddd dd dd dd ddd ddddeteeteeteeteeeteeteeteetete rmirmirmirmirmirmirmirmrmrr ne nene nenene neneneeoptoptoptptptoptptptpptooppop imaimamaimaimaimaimaimaiimimimmiimimammi l al al aaaal aaaal aaal accecceccecceccecccecceccecccccecec ss.ssssss.ss.ss.ssssssss.ss ThTh Th Th Th ThTThThThhTh T e ce ce ce ce ce cce cconsonsonsonsonsonsssoonsnnnonssnsstrutruttrutrutrutrutrutrutrutruurtructictictictictictictictictiction ononon on on ononoon teaeateateateateateaeateateaateteateeae m’sm’sm’sm’m’sm’sm’smm’smm ss re re ree re rereeer latlatlatatlattttlatattionionionionionionnshishishishishishhshsshssshh p p p pppwitwitwitwitwwitwwitwwitwiw th th th th tth th th th he he he he he hehehe hehe hehe firfi rfi rrfi rfi rfi fi rfi fi fi e fififie fifie fifie fie fie fie fie fie fieeee ghgh gh ghgh ghgh ghghghgggggg tertertererterterterteeree s ps ps ps ps ps ps ps pps rovrovrovroroovrovorovrovrovrovroroved ed ed ed ededed ededed eded tototo toto toto ttto to to be be bebe be be be bebe bebbeeeb a ba ba ba ba ba ba ba ba ba onuonuonuonuonuonuonuuonuuuonuuo us, s, sss,s, ss, , sss whewhewhewhewhehwhewhewhewhehwhewhehhewhewhewhwhewhehewhehew n tn tn tn tn tn tnn tt tn n heyheyheyheyheyheyheyheyheyheyhehehheyheheyywerwerwerwerwewewererwere ae ae ae ae aae abblebleblebleblebleblebleblee toto toto to toototoot sp sp sp sp sp sp spspppot ot ot otot ot ot otottoo a fia fia fia fia fia fia fia fia fia fia fi rere re rere re re rere ree in in in in in inininin innnnn a aa a a a a a aa fiefiefi efi efi efi efi efi efififi efi eeeld ld ldldldld ld dlld d sevsevsevsesesevsevsevsevseveveveraeraerareraeraeraeraeraraeral kl kl kl kl kl kl kl kkiloiloiloiloilooiloiloilometetmetmettmetmetmetmetmettmm resresresresresresresesesrresr awaawaawaawaawaawawawawawawaaawaawaawaaawaawaawaawaawwawwwwwawaaayyyyyy,yyy, y,y,y,yy, yyyy,y,y,y,yy andandandandndanndanannandandandndandandddddddddnaa al alalalalaalll ala al alaaaaaaalaaalalalerterterterterterterttteertertertertrtreeerrerere th thththththhththht th thtt e fie fie fie fie fie fie e fie fie fie fiee rere re re re re rere re se se se se sese sese sesservirvirvirvirvirvirvviviviviivivivicececececece ceeecee ece pripripripripriipriprpriprirpp or ororor oror rororoo tototo totoototootottoo thetheththethethethethehetheththethh fi fi fifi fi fifififi fifi fi re re reeeere reee re rere sprsprsprsprsprprspsprsprsprsprsprsprssprsprsprsppsprpssprspp eadeadeadeadeadeadeadeadeeaeaeadee ddingingingingingingingngggggg......
Local RelationshipsLocal Relationships
Community SpiritCommunity Spirit
Investment Investment Confi denceConfi dence
Caring for the Caring for the EnvironmentEnvironment

04
Financial PerformanceTrustPower’s consolidated underlying earnings after tax excluding fair value movements on fi nancial instruments, which are inherently volatile, and prior year adjustment for change in tax rate was $118.8 million for the year ended 31 March 2009. This represents an increase of 28 per cent compared with $92.6 million for the same period last year.
Earnings before interest, tax, depreciation, amortisation and fair value movements on fi nancial instruments (EBITDAF) grew by 25 per cent to $260.0 million from $208.0 million in the previous year.
Profi t after tax attributable to the shareholders of the Company was $105.1 million compared with $98.1 million for the prior year. This includes the impact of fair value movements on fi nancial instruments and prior year adjustment for change in tax rate.
Operating revenue of $785.4 million increased 15 per cent on the previous year as a result of higher energy prices charged to those customers paying spot market prices through the fi rst half of the year together with a $17.0 million revenue contribution from telecommunication services, $8.4 million from sale of carbon credits and $24.2 million from the Snowtown Wind Farm in South Australia.
Operating expenses including energy and line costs increased 11 per cent on the previous year, primarily driven by higher wholesale electricity costs during the fi rst half of the year.
Total electricity volume sold by the Company in New Zealand was 4,032 GWh compared with 4,540 GWh in the year to 31 March 2008 mainly due to the restructure and volume reduction of a large industrial contract. Customer numbers increased to 227,000 at 2009 year end from 222,000 a year earlier.
The New Zealand electricity market was volatile through the fi rst half of the 2009 fi nancial year with a combination of low wind production, low hydro infl ows and reduced HVDC transmission capacity causing signifi cant increases in wholesale prices. The major South Island hydro storage
lakes remained at lower than average levels through until September 2008 which elevated wholesale electricity prices for a number of months.
While TrustPower was negatively impacted through the fi rst quarter because of these market conditions, it was favourably impacted in the second quarter due to high infl ows into its own catchments which enabled the Company to run its hydro generation plant strongly during a period of high prices.
The second half of the fi nancial year has seen above average infl ows into key South Island hydro catchments and storage levels being quickly replenished and remaining at above average for the remainder of the fi nancial year. Consequently, wholesale electricity prices have fallen signifi cantly.
The Company’s New Zealand generation production of 2,127 GWh for the year was up 5 per cent on the previous year but around 190 GWh down on expected long term average. Total hydro production was up 96 GWh (7 per cent) on the previous year due to signifi cantly higher North Island hydro production (up 204 GWh or 37 per cent) off-set by a 107 GWh (12 per cent) decline in South Island hydro production. Wind production was up 2 per cent on the previous year but was down 11 per cent on expected long term average performance. Most of this shortfall occurred in the autumn months of the fi rst quarter.
Below average wind production during the third quarter from the Snowtown Wind Farm contributed to a 16 GWh (6 per cent) lower than expected output for the 2009 fi nancial year of 254 GWh. All 47 turbines have now passed fi nal acceptance testing under the turbine supply contract. TrustPower is pleased with the successful execution of the fi rst stage of this wind farm which is the Company’s fi rst project constructed outside of New Zealand.
Following the introduction of International Financial Reporting Standards (“IFRS”), the accounting standards require that certain changes in the fair value of fi nancial instruments be refl ected in the Income Statement.
Directors’Report
Bruce HarkerBE(Hons) ,
PhD (Elec. Eng) , MIPENZ
Chairman

TrustPower / Annual Report 2009 / 05
Deep StreamDeep StreamOtago

06
TrustPower utilises various fi nancial instruments to hedge electricity price risks, foreign currency risks and interest rate risks to which it is exposed. While the Company utilises valid economic risk management instruments to hedge these risks, these instruments must also meet the stringent criteria prescribed under IFRS in order to qualify for hedge accounting. For those instruments that do not qualify for hedge accounting, the change in fair value is recognised in the Income Statement.
The fi nancial instruments in TrustPower’s portfolio that do not qualify for hedge accounting are mostly interest rate swaps and Energy Hedge Market transactions. Due to the signifi cant drop in long term interest rates in both New Zealand and Australia over the second half of the fi nancial year there has been a signifi cant fair value reduction in the interest rate hedge portfolio.
Return on average equity, adjusted for fair value movements on fi nancial instruments but including the impact of the revaluation of generation assets was 8.8 per cent (last year 7.9 per cent).
Group operating cash fl ow was $214.2 million for the 2009 fi nancial year versus $161.0 million in the previous year.
Taking into account the shortfall in production from the Company’s own generation assets and volatile wholesale prices in the fi rst half of the fi nancial year, the result was good.
The governance of energy trading and oversight of risk management continues to be a focus. Inherently a company with 100 per cent hydro and wind generation assets will have some periods with below average generation and at times, this will occur with some correlation to when New Zealand’s major hydro catchments are also dry. TrustPower’s geographic diversity of asset location moderates this variability considerably but it does not eliminate it. TrustPower’s risk management policies aim to assess these inherent risks and ensure that fi xed priced contracted sales to customers are in line with the Company’s own generation capacity and externally contracted generation with only a manageable level of residual risk.
Financial PositionTrustPower’s balance sheet as at 31 March 2009 remains in good shape. Shareholders’ funds have increased to $1,430 million from $1,257 million.
TrustPower has a policy of independently reviewing the value of its generation assets at least every three years. The last valuation was completed as at 31 March 2007. However, IFRS require that key valuation inputs are re-examined annually and if there has been a material change then a revaluation must be undertaken.
TrustPower has determined that there have been material changes in forward electricity prices which warrant a revaluation being completed. Additionally, a number of generation projects were completed since the last revaluation namely, Tararua Stage III Wind Farm, Deep Stream hydro and the Snowtown Wind Farm. Consequently, Deloitte Corporate Finance has independently valued the Group’s generation assets as at 31 March 2009.
The fi nancial impact of the revaluation has been an uplift in generation asset values of $259.7 million. $204.1 million has been accounted through the revaluation reserve in equity with the balance of $55.6 million accounted as an increase to deferred tax liability.
Debt (including subordinated bonds) to debt plus equity was 33.9 per cent at year end, including the
impact of the revaluation of generation assets, versus 34.3 per cent in the previous year.
TrustPower continues to maintain high levels of committed credit facilities. Including subordinated bonds the Company currently has NZD equivalent of 1 billion of committed debt funding in place. As at 31 March 2009 Group net debt was $705 million. Given the ongoing uncertainty in fi nancial markets the Company has recently accepted refi nancing offers for $100 million of bank facilities due to mature in July 2009 together with a $20 million increase. These facilities have been extended to July 2011.
Capital StructureDuring the fi nancial year TrustPower successfully raised $100 million of seven year subordinated bonds from retail investors. TrustPower is one of only three corporate issuers that have successfully raised subordinated debt over the last two years and this achievement is testimony to the Company’s investment brand and conservative capital structure.
The Company purchased 236,312 shares on market at a weighted average price of $6.91 over the period October to December 2008 in accordance with the Share Buyback Programme approved by Shareholders at the last Annual Meeting.
Generation Development and Capital ExpenditureGood progress has been made on a range of growth options in New Zealand and Australia.
TrustPower currently has consents for 420MW of wind farm development in the South Island and is well advanced with a further 118 MW of South Island hydro consents at Arnold and Wairau.
In Australia, the TrustPower Group has planning consent for up to another 235 MW of capacity at the Snowtown Wind Farm and is awaiting approval for an extension to the 48 MW Myponga Wind Farm planning consent.
TrustPower is progressing negotiation with a small number of parties that have appealed the Arnold consent with the objective of avoiding another costly Environment Court process.
The Wairau consent appeal will inevitably go through an Environment Court process and a hearing has been scheduled for October 2009. The Company is undertaking further analysis in preparation for this process.
Good progress is being made in reaching agreement with landowners for potential wind farm developments at a number of New South Wales, Victoria and South Australia sites.
Forecast capital expenditure in the 2010 fi nancial year is expected to be around $38 million which includes generation expenditure undertaken as part of the Company’s 10 year asset management plan, small hydro enhancement projects and implementation of the Company’s new customer care and billing system.
Generation development costs to be expensed in the 2010 fi nancial year are projected to be around $7 million continuing the high level of investment in growing the Company’s portfolio of investment options. TrustPower is working to ensure that it is in a position to progress renewable projects should the Company conclude that shareholder value is likely to be created.

TrustPower / Annual Report 2009 / 07
SustainabilityTrustPower is fi rmly committed to sustainability principles and progress in relation to achieving its sustainability goals is provided in this annual report.
TrustPower takes its environmental obligations very seriously and has detailed systems and focussed resource in place to help manage compliance with its ever increasing level of consent conditions.
Pleasingly, TrustPower continues to report only a very small number of minor non-compliance events and none of these events have resulted in any signifi cant adverse environmental consequences.
TrustPower continues to invest heavily in its Community Awards Programme. This year the National Awards were held in Palmerston North and once again there were a number of outstanding examples of voluntary work being undertaken in communities throughout New Zealand.
In addition to the Community Awards Programme, TrustPower has a portfolio of other sponsorship initiatives regionally targeted at assisting education, the arts and wider communities through support of school music festivals, youth orchestras, photographic competitions, the Bay of Plenty rescue helicopter in association with the Tauranga Energy Consumer Trust and signifi cant regional events that are of benefi t to the wider community.
Regulatory IssuesThe Government is undertaking a review of the climate change legislation. A government select committee is due to report to Parliament shortly and the Government has advised that it intends to have an amended Emissions Trading Scheme (“ETS”) enacted by September 2009. However, the Government has also indicated that it would like to see harmonisation, where possible, with the proposed Climate Pollution Reduction Scheme (“CPRS”) that the Australian Government was targeting to introduce by July 2010. The Australian Government recently announced that the introduction of the CPRS will be delayed to mid 2011. It is likely that the CPRS will not be approved by the Australian Senate without the support of minor parties. This could cause further delays in fi nalising an amended ETS in New Zealand.
The Australian Government has announced that it will increase the Mandatory Renewable Energy Target (“MRET”) from 9,500 GWh per annum to 45,000 GWh by 2020 and for the scheme to remain in place through to 2030. The extension of this scheme will support new renewable energy development in Australia, in particular wind development which is currently viewed as the most economic renewable generation option. Legislation is expected to be passed to extend the scheme by July 2009.
On 1 April 2009, the Minister of Energy and Resources announced that there will be a ministerial review of the electricity market. The stated objective of the review is to improve the performance of the electricity market and its institutions and governance arrangements. The review will consider the fi ndings of a number of recent or upcoming reviews and investigations including the recently released Commerce Commission report on wholesale market competition. A Technical Advisory Group of six experts has been appointed to support the review process and advise the Minister. A discussion paper is expected to be provided to Cabinet in June and released for public consultation in July. Any legislative change arising from the review is expected to be enacted by June 2010.
DirectorsIn accordance with the Company’s Constitution, Mr Michael Cooney, Mr Geoffrey Swier and Sir Ron Carter will retire at the 2009 Annual Meeting and being eligible offer themselves for re-election.
In January 2009 Mr Lloyd Morrison took leave of absence from the Board due to health reasons. The thoughts and best wishes of the Board and the team at TrustPower are with Lloyd and his family as he takes the time to focus on his health. Mr Marko Bogoievski, Chief Executive of Infratil, has been appointed as an Alternate Director during Mr Morrison’s leave of absence.
AuditorsPricewaterhouseCoopers has indicated its willingness to continue in offi ce.
DividendThe Directors are pleased to announce a fi nal dividend of 17 cents per share, partially imputed to 9 cents per share, payable 8 June 2009 (record date of 29 May 2009). This together with an interim dividend of 16 cents per share provides a total payout of 33 cents per share for the 2009 fi nancial year compared with 30 cents per share for the 2008 fi nancial year, representing dividend growth of 10 per cent. The Company anticipates ongoing growth of normal dividends.
The Company also paid a 10 cent unimputed special dividend in December 2008. The Directors have approved a further unimputed special dividend of 10 cents per share with the same record and payment dates as the fi nal dividend. The Company believes that following the payment of the fi nal and special dividends it is positioned to pursue growth opportunities.
OutlookNew Zealand hydro storage is currently well above average for this time of year and TrustPower’s hydro storage lakes are also at above average levels. The current New Zealand hydro storage position should ensure a comfortable level of electricity supply to meet demand over the 2009 winter.
TrustPower believes that New Zealand’s signifi cant wholesale and retail price rises, driven initially by the end of the era of cheap gas and more recently to cover costs of moving to a renewable generation future, will moderate somewhat but price rises above infl ation are still likely for a period, especially as New Zealand dollar weakness will refl ect into the costs of new projects. While modest demand reduction may occur due to current recessionary conditions and new generation may be deferred due to recent capacity increase providing a suffi cient supply buffer, we expect this situation to be of short duration.
While it is too early to make predictions about the 2010 fi nancial year, it is worth noting that the Company is well positioned to meet its customers’ needs and to pursue further development of electricity generation assets when it is economically justifi able.
BJ HarkerChairman

08
Financial PerformanceThe Directors’ report sets out the detailed fi nancial results, but of particular note is the increase in EDITDAF of 25 per cent, the like-for-like adjusted net earnings increase of 28 per cent, and the Group operating cash fl ows increasing by 33 per cent to $ 214.2 million compared to last year.
The year has been especially challenging, with winter 2008 being one of the worst in recorded New Zealand hydro history. Our geographically diverse generation portfolio certainly assisted us to manage our exposure to high wholesale prices, but with both the North Island and South Island hydro catchments drying up at the same time, we suffered earnings losses in the fi rst quarter of the year. The second quarter saw our hydro lakes begin to replenish while the big lower South Island lakes remained comparatively dry. This allowed our fi rst quarter losses to be recouped plus some, setting the Company up for a good result. A full year of the Tararua Wind Farm Stage III, the progressive commissioning of both the Snowtown Wind Farm in South Australia and the Deep Stream hydro scheme in Otago contributed to the year’s earnings growth.
Our CustomersDuring the year, the opportunity arose to secure additional residential customers, particularly in the Dunedin and Southland markets, when a competitor announced signifi cant power price increases coupled with a proposed increase in fees to Directors. We also secured the electricity output contract for the Ngawha
geothermal power stations in Northland, allowing us to secure nearly 5,000 new customers in the local area.
There was strong competition for customers across most of our markets during the year with 11.5 per cent of customers nationally changing suppliers. Our customer losses were 21,073 customers or 9.6 per cent of our total customer base, pleasingly less than the national average.
Customer service standards were enhanced during the year with average Call Centre grade of service increasing from 62 per cent to 78 per cent (target 80 per cent), and our Company was again acknowledged as the top customer service performer in independent service research surveys of electricity retailers.
During the year a large industrial customer chose to purchase their electricity directly from the wholesale market instead of through our Company, which reduced industrial market sales by 587 GWh. Sales to residential and commercial customers increased by 78 GWh or 2.6 per cent.
Additionally, during the early winter of 2008, the electricity industry proactively and collectively called on consumers to save power resulting in our sales volume being reduced by about 5 per cent over that two-month period.
Our Kinect telecommunications brand has continued to grow during the year, with total sales topping $17 million. The Kinect brand not only allows us to offer our electricity customers an alternative service on their one monthly bill, but it also provides a great sales team resource which can swap from selling telecommunications product to winning new electricity customers at a moments notice when opportunities arise.
Chief Executive’s Report
The global economic crisis is placing signifi cant stress on the New Zealand economy, businesses and individuals. Our strong balance sheet, service oriented retail brand, investor confi dence and electricity sector focus places our Company in a good position to weather this economic downturn.
Keith TempestBBS
Chief Executive
TrustPower / Annual Report 2009 / 09
Tararua Wind FarmTararua Wind FarmStage III

10
Generation DevelopmentDuring the year the 99 MW Snowtown Wind Farm Stage I in South Australia was progressively commissioned, and offi cially opened by the South Australian Premier in November 2008. This project was the culmination of several years of investigation and research into the Australian electricity industry. The Australian electricity industry and regulatory environment is quite different to New Zealand, and we wanted to adopt a cautious and risk averse approach to this ‘beach head’ into Australia. A ten year power purchase arrangement with a large Australian electricity retailer secures the sale of 90 per cent of the Snowtown Wind Farm’s current 99 MW output. The site has future capacity for a further 235 MW of wind generation. Another consented site south of Adelaide is capable of hosting a 48 MW wind farm, and we have signed land access agreements on a number of potential sites in New South Wales, South Australia, and Victoria.
We commissioned the 6 MW Deep Stream (Otago) hydro scheme during the year, after a number of minor teething problems during commissioning. This scheme is very innovative in terms of its design and construction, with almost all components being New Zealand made, including the turbines and buried fi breglass penstocks. The scheme required the creation of a large lake behind a 19 metre high earth dam, and all the disturbed areas have been replanted using local native tussock.
The proposed Mahinerangi Wind Farm (Otago, 200 MW) and Kaiwera Wind Farm (Southland, 240 MW) are now fully consented. The Arnold (West Coast) and Wairau (Marlborough) hydro developments are both consented at Council level but subject to the Environment Court appeal process.
Looking forward to when New Zealand has a large number of wind farms, wholesale electricity prices may become more volatile - especially on windless days. We have identifi ed over 50 enhancement opportunities involving our existing hydro schemes, which have the potential to either increase lake storage, increase plant capacity or both. Most of our hydro schemes were built to provide ‘peaking capacity’, in that they have high output capacity relative to the stored water available, as a consequence they are ideally suited to a volatile wholesale electricity priced market.
We are also investigating opportunities for combining electricity generation with rural land irrigation, especially in areas where water storage is available and where the soils are dry but fertile. We have identifi ed Canterbury as having signifi cant potential as an ideal location for a large-scale electricity generation / irrigation project.
Existing Generation PortfolioThe 2008/9 year was particularly dry, and not particularly windy, resulting in our overall production being 190 GWh below long term averages, although 5 per cent above last year through the addition of new capacity.
During this last year New Zealand also faced a number of signifi cant and often quite long duration transmission fault outages, which shut down large parts of major metropolitan areas seriously inconveniencing businesses, transport, communications and households. At the same time, National Grid owner/operator Transpower and the Electricity Commission have been working hard to establish a far-reaching investment programme to improve the reliability and capacity of the national grid.
We are also very mindful of the necessity to maintain our own generation plant and electrical infrastructure to minimise the likelihood of failures. A comprehensive ten year asset management plan was implemented several years ago, and is updated on an annual basis. The Plan monitors and identifi es in advance plant and equipment that will require refurbishment or replacement. One of the measures we have used to monitor the outcomes from the Plan is failed start statistics. Failed starts measure the number of times our hydro generators don’t work when we require them to. In 2000, our hydro machines failed to start on average one time in every 133 attempts. In 2009 that fi gure has reduced to just one time in every 564 attempts, equating to 37 failures out of 20,873 machine starts. Back in 2000 most machine starts were performed manually by staff at the station, but now they are all controlled electronically from our control centre at Mount Maunganui.
Government Strategy and RegulationIt is interesting to note that TrustPower has continued to grow and prosper regardless of the continual uncertainty around successive Governments’ energy sector strategies and regulations. Each year in our Annual Report we explain the pending changes in Government Policy and proposed regulatory reforms, but to date they have had little impact on our business. What they do impact on however is the timing of new investments and the diffi culties and costs of bringing new investments to fruition.
The Resource Management Act has posed a signifi cant and costly hurdle, especially to our hydro development projects. Despite this, we have successfully negotiated those hurdles with 100 per cent success to date.
The existing Government Policy Statement and Energy Strategy have been amended or ignored by the recent incoming Government, and a review panel has been established to again look at the electricity sector. The Emission Trading Scheme legislation has been put on hold while a review is undertaken. The Electricity Commission’s roles and responsibilities are being reconsidered, and the Commerce Commission’s review, following a lengthy investigation, has recently been made public.
We consider that while continuing to have maximum exposure and input into Government strategy and regulation, we are best to focus on enhancing the long-term value of our company, and delivering improved returns to our stakeholders.
The Community and the EnvironmentWe continue to place a signifi cant focus on both our customers’ communities, and the natural environment surrounding our generation assets.
Our fl agship TrustPower National Community Awards programme touches tens of thousands of people each year in the 23 regions where the programme is run.
A full year of the Tararua Wind Farm Stage III, the progressive commissioning of both the Snowtown Wind Farm in South Australia and the Deep Stream hydro scheme in Otago contributed to the year’s earnings growth.

TrustPower / Annual Report 2009 / 11
The programme recognises volunteers and the vast array of activities in which they are involved. In addition, we also support a wide range of community activities where we can assist local organisations maximise the contribution from their own initiatives to their local community.
We work closely with Government and local environmental agencies to ensure the fl ora and fauna in the regions hosting our generation assets are protected and enhanced.
With over 3,000 Resource Consent conditions to monitor and comply with, many being part of the daily generation dispatch decision processes, it was pleasing this year to record just fi ve breaches, all minor in nature. This number is half of those recorded in the previous year and less than one quarter of prior history. Previously I mentioned the vastly improved asset maintenance programme and reduced incidences of failed starts. Breaches of consent conditions often result from plant failure with water being either released or not released as a direct consequence of that failure. Our focus on reduced plant failure has effectively been a win-win, resulting in enhanced fi nancial outcomes while at the same time reducing incidents that result in breaches of resource consents and the potential for adverse environmental impacts.
Looking AheadHistory has shown that a combination of our strategic, yet risk averse, approach to development, our unique geographical spread of well maintained and managed generating assets, our careful development and nurturing of key internal and external relationships and our competent, well trained and well engaged people have together given TrustPower the ability to consistently outperform our competitors.
In a diffi cult international fi nancial environment, where there is the added challenge of potential regulatory and market environment changes, we are confi dent that our Company’s strengths leave us well placed to continue to deliver the outcomes and results that all of our stakeholders, including shareholders, have come to expect from us. Indeed, the culture of our Company is such that we look ahead with confi dence and excitement about our future.
Keith TempestChief Executive
0%
10%
20%
30%
40%
50%
60%
70%
80%
90%
Call Centre Grade of Service
Grade Achieved
Target
Apr 08 May 08 Jun 08 Jul 08 Aug 08 Sep 08 Oct 08 Nov 08 Dec 08 Jan 09 Feb 09 Mar 09
Trend
Failed Starts
2004 2005 2006 2007 2008 20090.00%
0.25%
0.50%
0.75%
1.00%
% of attempted starts that fail
12
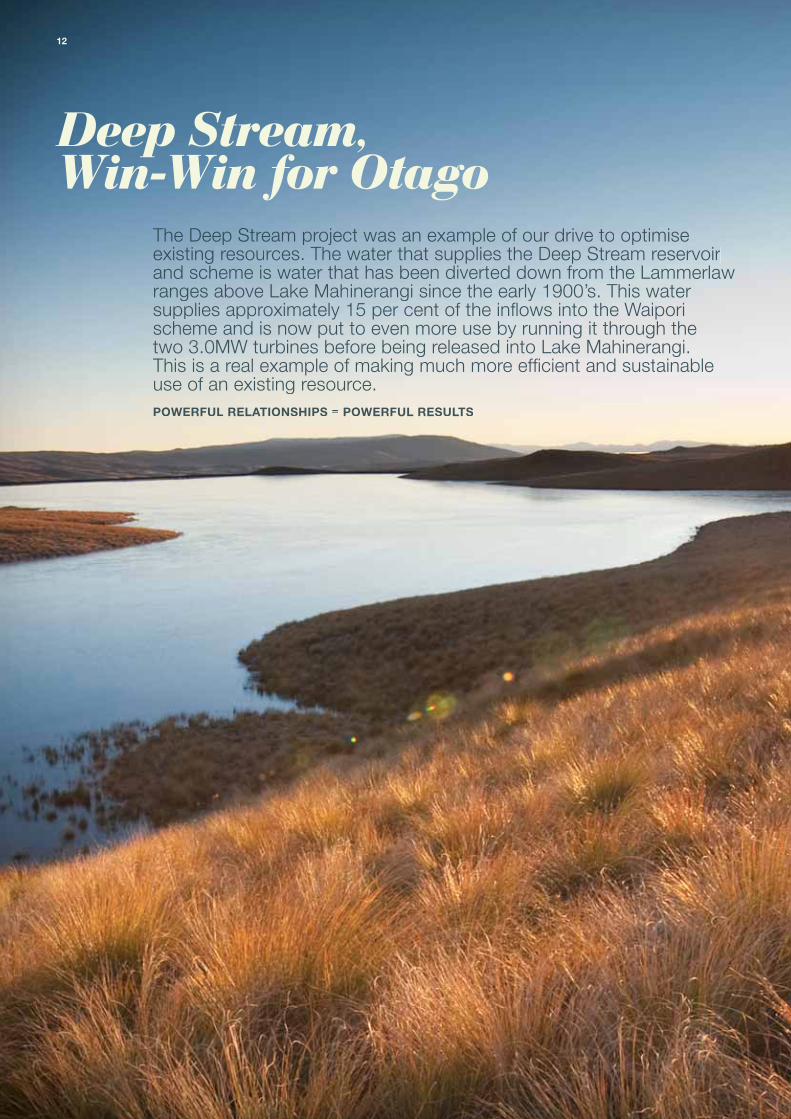
The Deep Stream pprroojjeecctt wwaas an example of our drive too ooppttiimmiissee existingg rreessoouurrccees. The water that suppliess tthhee DDeeeepp SSttream reservoir aanndd scheme is water that hass bbeeeenn ddiivveertted down from the Lammerlawranges above Lakkee MMaahhiinneerangi since the early 1900’s. This water supppplliieess aapppproximately 15 per cent of the infl ows into the Waiporischeme and is now put to even more use by running it through the two 3.0MW turbines before being released into Lake Mahinerangi.This is a real example of making much more effi cient and ssuussttaaiinnaabbllee use of an existing resource.POPOWEWERFUL RELATIONSHIPS = POWERFUL RESULTS
Deep Stream, Win-Win for Otago

TrustPower / Annual Report 2009 / 13
Powering Dunedin
Successful AgreementsSuccessful Agreementsnd accessThoThoughugh ou our rr relaelatiotionshnshipip appapproaroach c we successfully reached lad lans ts to optimise agragreemee ents with Landcorp and City Forests, allowing all partiesese DeDepartmenttheir use of the land whilst protecting the existing environment. The oughohout theof Conservation and Historic Places Trust were also involved thro
he Blaack plaplanninning ng stastagesges to to en ensursure te thathat co consenservarvatiotion an nd preservation of thceived the d theRock Scientifi c Reserve and Historical and ArA hchaeollogiogiggggggg calc sites recneeenenenen dindindindin Ci Ci CC ty yCithihhihighighighighighighihighighighigighighighigghiggghighighighigghighhighighighighighighighh hhhhhhhhhhhhhhhhheshheshhheshhheshesheshhhhhesheshhhehesttttt pt pt pt p iiiiriorio ititrittrityy. ThrThThrThrougougougoughouhouh t ct ccononsonsonstrutrut ctic on on extextextenennnsensnsenen iveiveveveee lilili li lililiiaaaiaiaisaissaaissisonnn nnon o witwititwwitwitwitwitwitth Dh DDh Dh Dhh h hhh uuurerereeeeeeeeereererrrrrrr dd ddddCouCCouncicil, l, CluCluthathaa Di Di Distrstrstrstrictictictct C Co Co Councu cu il il andaandandan OtOOt O agoagoagoagoogo R R ReReReeeR gigigiogioigiog onalnalalalalnalan CoCoCoCoCCoCoooouncuncuncncuncuuncncuuu ill eensensnssensssnsuurururururuuu
comcomcomplipliancance we wwithithithh rururururulesleslesleses an an aand td td td td hehe hhe raprapidid id id rrresreressessoluoluoluoluoo ttiotiootiotionnn n on on oof iff if if if iissssussussussusssss ues.es.ses.eseses
Made in Made in New ZealandNew ZealandThe Deep Stream project was built using a 100 per cent New Zealand labour force, with a total of 15 contracts over the construction period resulting in the employment of between 40 and 70 people at any one time in environmental, engineering and construction disciplines. During construction and commissioning periods there was a high use of people from within the greater Dunedin and Clutha districts, providing employment and revenue directly to the area. A highlight for TrustPower was our ability to purchase high effi ciency turbines from two Christchurch fi rms, HydroWorks and Mace Engineering. These units were designed and customised to TrustPower’s specifi c operating requirements, and constructed to a very high standard.
CCCCCiCiititttttCittCiCitittCC ttCCiCitCCCCiCiCitittCCCiitCCiiitC tCiCitty Cy CCCy Cy Cy CCy Cy y Cy CCCCCy Cy CCCCCCCyyyyyyyy ooounoounununnoounnoounoununooounounoooouoouoouununnounoounno ccilcilcilcilcilccilcililcilcilicilc ( ((D(D(D(D ((D((D((D(D ((D(D ((D(DD(D((DD(DD(((( CCCCCCCC)CC)CC)CC)CC)CCC)CCCCCCCCCCCCCCC)CCCCCCCCCC )))))))) w w weeeewe weweewewew we weweewewe ThrThrThrThrThrThrTThrThrThrThrThrThThThrThTh ouoououougougougougouougougouoo gugugugougoouououguggo gh oh h oh oh ooh oh h h oh h oh oh ooooooouuuur urururuur ur uruuuu relrelelrerelrelrelrelelrrelellatiatiatatiatiatiatiatiatiatiatiiat onsonssssononsonsonsonsonsonson hiphiphiphiphhhipppphhhiph pppp wi wiwi wi wiwiwiwiithththththth th ththhthhh thethehehethehethethethththethet DuDuDu Du Du DuuDuDDDDDD neneneeddededneennneneneednnneedededinnnnininin ninn Cbbbbbbbbbbbblllllle llllele e le lelelelelee aarrarrarrarrarrrrrararrarrarrarrarrrarrarraaananangggggggangangngngangangngngngganaananngaanannnnngangeeemeeememememeemeeeemeemeemeemeemememeemeemeee tttttnttnt tntnttnt ntnnt nntntnt t n fffffffforforforforfforforfofofofoforrfoforrf ttthhhttthhththtth hhtththh ththhthth t ttht lle lle lle le lee lle le leaeaseaseaasasssasssseeaeasassaseasasssssee see eeeee ee e e e eeeee werwerwerwereree ae ae ae ae bleblebleblebleb tot too cocococome mem to to oo a mma mmutututuutuuttualallally ay aayy grgrgregregrererregrgrreeabeabeababbbbbbeabbeabblllllll
dadad d ddadaaadadaddaammmmmsmmms,ms,ms,mms,ms,ms,s,s,ms,mm ,mm la lalala la laa la la laake kke kkke e kekekkkk andandandnanddddndananandanandandnnandn ssosoo sossooosoooomememe mme me me memem cancancancancancacacacancancancanccacancancancan lalsalsalsalsalsalsalsalslalsalsalsalsalsa sa ofof fofff thethethethethee lalala lalaland ndnd nnnd on onnonon on on no whiwhiwhiwhiwhiwhiwwhiichchch ch ch ch chc thethethethethethetheheeeeeee DeDeDeDe DeDeDeDD DDD ep epep ep ppppep ep p StrStrStrSStrStrtrStrtrStrreeeeameamamamamamee maaameamm d d ddddddnnnnnnnnnn th t t tthhhhthhh tthhtttheee e e e DDDDDDDDee DDDDe e e CCCC CC CCCCCCCC CCCCCCCCCCCC domdomdomdodomdododododdd mod estestesteststesttsteststttsttsstse ic icic ic cc c icicicccciciccicicc watwatwatwatwwatwatwwawatwatwwawatwawatwatwatawatawwaawwaa er er ererreeer eeeer ee supsupsupssusupupupupsupssususussuppppplyplyplyplyplyplyplyplyplyplyplypplyylyylyplylyplyyy wwerwerw rwerwere be be be be be be be bbuiluuuiluiiuiluiluiliu tt. t. . TheThTThTheTheTheThee la lalala lake keke keke ee isis is is sitsitsitssituatuatuatuatated ed ed ededed wiwitwitwitwitwiww ttttttw hinhinhinhinhinhinhinh n
terererererterterererrerterermmm m aaaaam aammm m ammm amm aam aam aaaaccccccccccccccecceccccccecceccceeecceccecceccec ss,ss,ss,ss,ssss,ss,ssssssssss,sssssssss,ss,ss,s,,,s, TTT Tr TrTr Tr Tr Tr TrTrTTTTTTTTTTTTTTT ustustustustuustustustustuu ttttPowPowPoPowowwowPowPoPowowwP wP weereerer er er ererrrrrrr maimaimaimaimaimaimmmaima ntntntntantantatatataanntanntatanttataaaatn aaattnt insininsnsinsininsinsinsnssssssnsnnnnnnnns catcatcatcatcatcc ttc chmchmchmchmchhmchmhmchc mmmmmententeenententtntntntntn an an annn anananaaaaa d id id id id d n rn rn rn rretetuetuetuetut rnrnrn rn forforforforfororfooooo lo lo lo lo lololololoong nng g gng ngg g ngngngng teteteteesusuupupupupupsuuppupupuppppppplyplyplplypppplyplyplyplyplyplylyyyy fo fofofofofofofoffff fo fofffoff rr r tttttr tr ttttr rr tr ttr hhe he he he hehe he heheeheh DCCDCCDCCDCCDCCDCCCDCCDCCDCCDDDDD . . B. B BBBBBB. B. . othothothothothothhththtot pa pa ppapapapappapapaaartirtirtirttitititititirties es eeees eeeeeeeees s ss hhavhavhahahaavhavavavvvhavavhavvhahaavhhahaaaahhh ee ee ee ee eee eanaaanan an aanaaaan on on on onon nnn ccccalcalcalcalcalccalcalccccall el el el eeeemermermermermmermermmm gengegengengengengengeengenegennncycccy ccy cy ccy cy watwatwatwatwattatwatwatwawwawa eeeeer er er eee ssssupssususuuususuu
e e ccrecrecrrererecrererecreeecrcrrrerrerreccr atiaaatatiaatiatiatiatiiia iit on ononon on on on oooon onooonoooono of of of of ofof of of of of of foooooooooooooooo wwwwwwwatwaatwatwatwatwatwatwwwaaawww ter er er erreeeeeerer stostostostoststostostostotostotostostostostotostotttttttttttorrragragragragragragragragragragrrrragragge fe fe fe fe fe ffe fe fe fe e fe fee e ffe orororororoor oroorror r botbobotbotbotbotbootbotbotbottttttth gh gh gh gh gh gh gh gh gh gh gh gh gh gh gh h ghhhh h hhh ghhhhh gh gh ggggeneeenennneeneeneeeeee eeeneeee ennnnnnn ratratrararatratratatatratttrarrr tr tra iiioniononionionnonniononioi nionoo benbenbebenbenbenbeenbennebebebenennnnnnne efi efi efifiefi efi eeeee dtedtedtededtededddddeeededed gr gr gr grgrrrg eateateateateateateaatattatatttly ly ly lylyy frofrofrorom tm tm tttttm ttmm hhehehe he he hehehehhhe cccccccceeeeeeeeencyncyncyncyncyncyncyncycycyncncyyncyccc w wawa wawwawawwawawawaaawa waaaawwwawawaattttetereerrterertertererereereerrerrteterrr sss s susususususuussususuuuusu sssusuuuussuuss ppppppppppppppplpplppplppppppppppppp yy, y, y, y, y, y, y, y, y, yyy, at atatatttat at nononono nono ooonooonoooooooo coscoscososcosscosccoscososcososcoscoscosc st tt tt tt tt tt tt tt tttt ttt tt tttto to to to to tooooo to to to toooo ttthhe he he ee ehehehheehhehhee ratratraratrattratatratattratratrra epaepaepepaepaepaepaepaepaaeepeepaeeepaepppp yeryeryeryeryerereerryyerrryerryeryeryyyyy s.ss.s.s.s.s.ssssssss.aanandandnndndndandandandndndndnndddand th th th th ththththththhhe Ce Ce Ce CCe Ce Ceeeee Ce Ce Cityityityity’s ’s ’s’s ’s’ss emeemeemeememeemeemeemeee eem rgergergergergergegegeeeeeeennnnnnn
Protecting our Protecting our EnvironmentEnvironmentThroughout building and commissioning the Deep Stream hydro project our total focus on protecting the existing natural and historical environment, and ensuring any effects of the project were minimised. This ensured the scheme integrated well into the existing pastoral environment, and with the establishment of the new lake and waterways, new birdlife is now fl ocking to the area.
Benefi ts for Local Rate PayersBenefi ts for Local Rate Payers
DeeDeeDeeDeeDeeDe p Sp Sp Sp Sp Stretretrttrream has been buibu lt tosupupsupsupsupplelepp mmemenmennment tt tt thehe he exiexistitisting ng WaiWaiWaiporpopo i iHydH ddHyy roooo Electric Powwwer e SchS hhemee , whiwhwhiwhiwhichchchcchch proprovidvides es eleelectrct icicity ty dirdirectectly ly intntinti o oo o o D Duneunedindin Ci City.ty. It It de delivliversersrse addddaddditiitionanal el eleclectritricitcityy eequiquivalvalentententent toto to tosupsupsupupppppplyplypp iningngnngngngng ap ap ap apapppproproprop ximximximateatetetet lylyly y 3,03 03,03 00000 00 aveveveveeeeeeeragragragragge e Ne Ne New wew ZeaZeaZeaZealanlanlanland d hdd housousehoeholds, proproproproovvvvvvvidvivvidvidvidinginginging ad addditditditi ioniononalallal al aa secsecses uriur ty ty of osupsupsupppppplyplyplyply to to DuDuD dnedinin CitCitCCity wy wy hilhilst st
timmising the he useuse of waterer th that at hasasoptimmisbeeenen availablee to to t the mainalways s bee
eme.Waipori s schem

14
Board of Directors
Bruce HarkerBE( Hons) , PhD ( Elec. Eng ) ,
MIPENZ
Chairman
Michael CooneyLLB
Director
Sir Ron Carter KNZMBE( Hons) , ME,
DistFIPENZ, D.E ( Hons)
Director
Geoff SwierMCom ( Econ ) , MAICD
Director
Marko BogoievskiBCA, CA , MBA ( Harvard )
Alternate Director
Sam KnowlesMSc ( Hons)
Director

TrustPower / Annual Report 2009 / 15
Management Team
Keith TempestBBS
Chief Executive
Mike KedianBSc ( MechEng ) ,MSc ( Eng ) , MBA
Generation Manager
Karen BoyteBBS, MBS ( Hons) , MHRINZ
Human ResourceManager
Robert FarronBBS, CA , CFIPNZ
Chief FinancialOffi cer & Company
Secretary
Peter CalderwoodBE( Hons) , ME, MIPENZ
Strategic BusinessDevelopment
Manager
Therese ThornBE( Hons)
Trading & RiskManager
Chris O’HaraBAgrSc, Dip. Bus
Energy SalesManager
Nelson N TkatchBSc, BCom, ISP, HISP
Chief InformationOffi cer

16
About thisReport
The Reason for this ReportAt TrustPower we believe that producing an annual sustainability report is an essential part of being a good corporate citizen. This report provides a means of communicating with a range of stakeholders on the full range of our activities. Consistent with previous years we report on sustainability in conjunction with our annual report.
MaterialityTo determine which issues are of material importance, we considered issues that might impact our operations, the environment, the communities in which we operate, or substantially impact our individual customers and stakeholders.
Material measures are those identifi ed from stakeholder interaction (page 18) and key risks (page 17). By choosing these measures we have produced a report aimed at all stakeholders.
Sustainability Reporting GuidelinesThis Annual Report is available on our website, www.trustpower.co.nz and is compiled with reference to the Global Reporting Initiative (“GRI”) Sustainability Reporting Guidelines Version 3.0 (“G3”). We have assessed our compliance with the reporting guidelines at the Application Level (B).
The GRI guidelines provide a voluntary reporting framework used by organisations around the world as the basis for sustainability reporting. The GRI is the generally accepted framework for ‘measuring, disclosing, and being held accountable to internal and external stakeholders for organisation performance toward the goal of sustainable development’.
The GRI consists of a framework and guiding principles as well as a range of ‘indicators’ that reporting organisations can report against. Indicators are chosen on the basis of materiality or signifi cance to the business and / or stakeholders. Not all indicators are reported on in this report.
Pages 74-76 show the full list of G3 indicators, where they are reported on in the report and to what extent they are reported.
Reporting PrinciplesWe have reviewed GRI’s G3 Reporting Principles in an effort to provide a balanced and reasonable representation of our sustainability performance.
We have applied the key principles of materiality, completeness, context, comparability, accuracy, timeliness, clarity, reliability and boundary setting.
Reporting Period, Accuracy and CompletenessThis report is based on the performance and information for the fi nancial year to the end of March 2009. We use in-house reporting systems to collect data for the GRI process.
Boundary of the ReportThis report covers the operations of TrustPower and all of its subsidiaries. Outside the scope of this report are outsourced customer services and a variety of fi eld services contractors.
External AssuranceThe fi nancial statements have been audited by PricewaterhouseCoopers. Independent review of the Company’s impact on green house gases ‘carbon footprint’ has been completed by Landcare.
The remainder of the report has not been subjected to independent review. We are considering a full independent review of next year’s report.
Who We AreWe own 594MW of hydro and wind generation spread throughout New Zealand from the Kaimai scheme in the Bay of Plenty to Waipori in Otago. These assets produce an average of 2,320 GWh per year. During the year we also completed the construction and commissioning of a 98.7MW wind farm in South Australia which is expected to produce around 390 GWh per year.
We supply electricity to around 227,000 customers and provide 30,000 telecommunications services to 20,000 customers throughout New Zealand. We have 394 employees working throughout New Zealand and two employees in Adelaide, South Australia. Around 69 per cent of New Zealand employees are based in our Tauranga head offi ce.
Our ValuesOur PRIIDE values are
PassionRespectIntegrityInnovationDeliveryEmpower
Our vision is to be the leading renewable energy company in Australasia.

TrustPower / Annual Report 2009 / 17
Sustainability Outlook
Our performance this year was strong across the fi ve areas we report on.
Area Measure 2008 Actual 2009 Actual 2009 Target 2010 Target
Economic EBITDAF Growth 6% 25% 8-12% 8-12%
Staff 1 Staff Survey 4.9 4.9 >5.15 >5.15
Environmental Resource Consent Breaches
8 5 0 0
Customer 2 Customer Satisfaction 97% 95% >85% >95%
Community Stakeholder Consultation
Completed Completed Complete detailed stakeholder consultation
Complete detailed stakeholder consultation
1 Scale ranges from 0 (worst) to 7 (best)2 Customers rating good or excellent
A more detailed analysis can be found in pages 21-33.
All businesses face risks and challenges. Our key risks and challenges are summarised in the table below.
Category Key Risks / Challenges Approach Targets Progress
Economic Unable to meet future demand for electricity
Shareholder value growth
Develop a pipeline of opportunities for new investment
Maintain strong focus on effi ciency of operation
Invest in economic growth projects
Focus on long term sustainable pricing
Costs benchmarked at below industry average
New projects all economically viable
New projects completed on time and to budget
Prices set at levels so customer base maintained
1
Environmental Need to minimise environmental impact of generation schemes
Overall impact on carbon emissions
Work closely with special interest groups and the local community to minimise impact of new generation
Comply with resource consents
Maintain carbon neutrality
Zero signifi cant resource consent breaches
Certifi ed carbon neutral
Our People Need to retain and develop a team to produce ongoing performance
Extensive training and development programme
Succession planning and internal promotion
75% of management roles fi lled by internal promotion
Continuous improvement in staff survey results
Staff survey exceeds international benchmark
Community Relationships with and an understanding of local communities is required to effectively operate the business
Community engagement including sponsorship and community awards
Consultation around resource issues
Maintain a strong corporate profi le in all areas in which we operate and build relationships within those communities
No resource consents turned down due to lack of consultation
Customer Dissatisfi ed customers prevent sustainable economic performance
Competitive pricing
Excellent customer service
Information and advice
Carbon neutrality
Net customer churn <2%
>85% satisfaction in survey
Certifi ed carbon neutral
Green = Achieved Amber = Partially achieved Red = Not achieved
1 Deep Stream delayed with some budget overruns
At TrustPower we believe that sustainability means building a long term business through relationships with everyone we interact with. In order to report on our progress in this regard we report economic, staff, environmental, customer and community related measures.
18
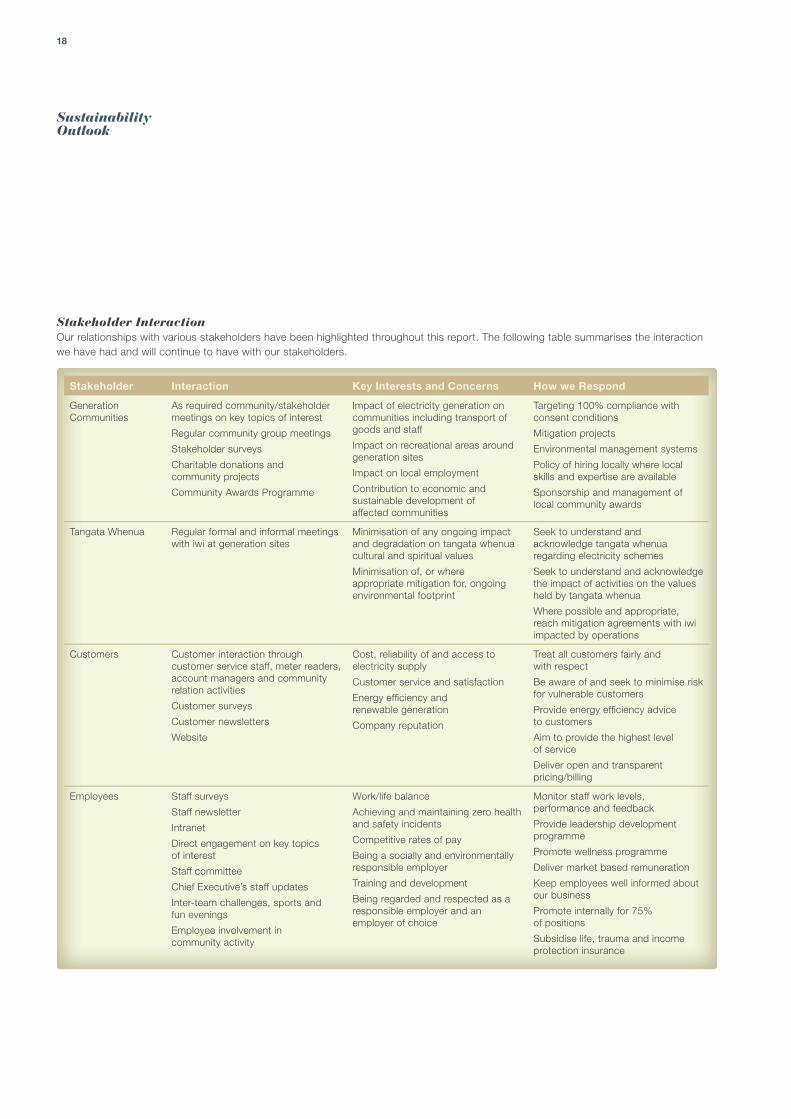
Sustainability Outlook
Stakeholder InteractionOur relationships with various stakeholders have been highlighted throughout this report. The following table summarises the interaction we have had and will continue to have with our stakeholders.
Stakeholder Interaction Key Interests and Concerns How we Respond
Generation Communities
As required community/stakeholder meetings on key topics of interest
Regular community group meetings
Stakeholder surveys
Charitable donations and community projects
Community Awards Programme
Impact of electricity generation on communities including transport of goods and staff
Impact on recreational areas around generation sites
Impact on local employment
Contribution to economic and sustainable development of affected communities
Targeting 100% compliance with consent conditions
Mitigation projects
Environmental management systems
Policy of hiring locally where local skills and expertise are available
Sponsorship and management of local community awards
Tangata Whenua Regular formal and informal meetings with iwi at generation sites
Minimisation of any ongoing impact and degradation on tangata whenua cultural and spiritual values
Minimisation of, or where appropriate mitigation for, ongoing environmental footprint
Seek to understand and acknowledge tangata whenua regarding electricity schemes
Seek to understand and acknowledge the impact of activities on the values held by tangata whenua
Where possible and appropriate, reach mitigation agreements with iwi impacted by operations
Customers Customer interaction through customer service staff, meter readers, account managers and community relation activities
Customer surveys
Customer newsletters
Website
Cost, reliability of and access to electricity supply
Customer service and satisfaction
Energy effi ciency and renewable generation
Company reputation
Treat all customers fairly and with respect
Be aware of and seek to minimise risk for vulnerable customers
Provide energy effi ciency advice to customers
Aim to provide the highest level of service
Deliver open and transparent pricing/billing
Employees Staff surveys
Staff newsletter
Intranet
Direct engagement on key topics of interest
Staff committee
Chief Executive’s staff updates
Inter-team challenges, sports and fun evenings
Employee involvement in community activity
Work/life balance
Achieving and maintaining zero health and safety incidents
Competitive rates of pay
Being a socially and environmentally responsible employer
Training and development
Being regarded and respected as a responsible employer and an employer of choice
Monitor staff work levels, performance and feedback
Provide leadership development programme
Promote wellness programme
Deliver market based remuneration
Keep employees well informed about our business
Promote internally for 75% of positions
Subsidise life, trauma and income protection insurance
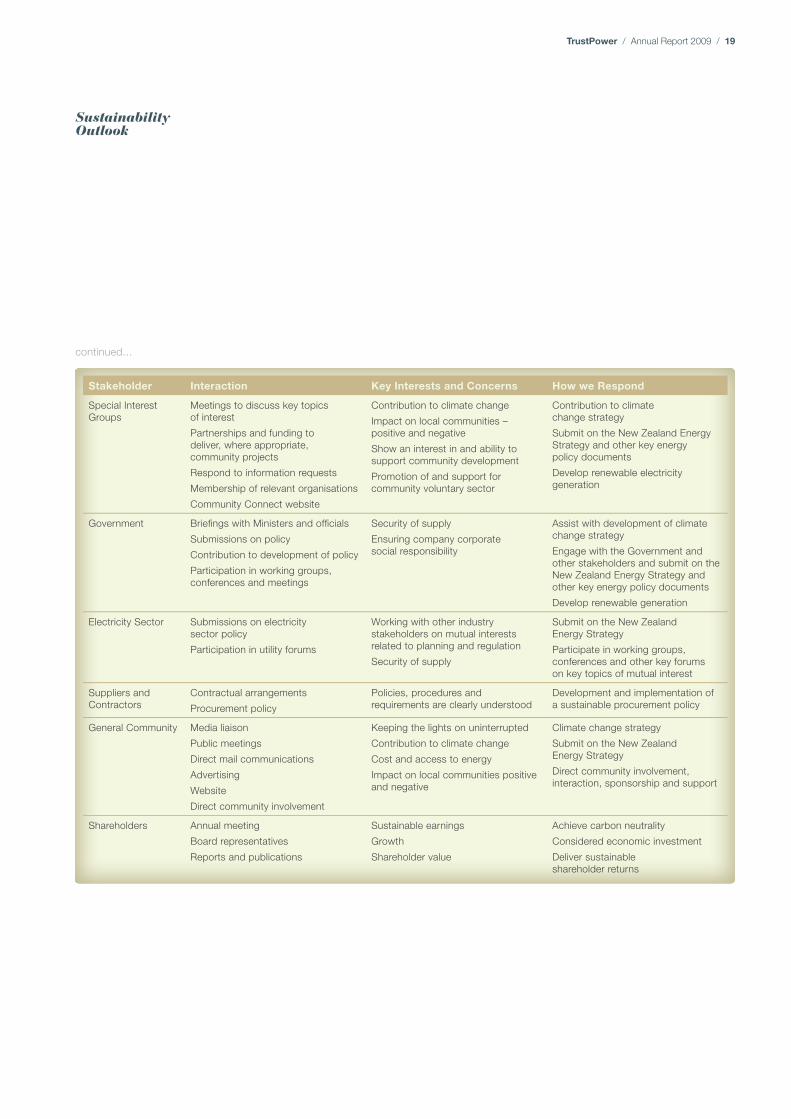
TrustPower / Annual Report 2009 / 19
Sustainability Outlook
Stakeholder Interaction Key Interests and Concerns How we Respond
Special Interest Groups
Meetings to discuss key topics of interest
Partnerships and funding to deliver, where appropriate, community projects
Respond to information requests
Membership of relevant organisations
Community Connect website
Contribution to climate change
Impact on local communities – positive and negative
Show an interest in and ability to support community development
Promotion of and support for community voluntary sector
Contribution to climate change strategy
Submit on the New Zealand Energy Strategy and other key energy policy documents
Develop renewable electricity generation
Government Briefi ngs with Ministers and offi cials
Submissions on policy
Contribution to development of policy
Participation in working groups, conferences and meetings
Security of supply
Ensuring company corporate social responsibility
Assist with development of climate change strategy
Engage with the Government and other stakeholders and submit on the New Zealand Energy Strategy and other key energy policy documents
Develop renewable generation
Electricity Sector Submissions on electricity sector policy
Participation in utility forums
Working with other industry stakeholders on mutual interests related to planning and regulation
Security of supply
Submit on the New Zealand Energy Strategy
Participate in working groups, conferences and other key forums on key topics of mutual interest
Suppliers and Contractors
Contractual arrangements
Procurement policy
Policies, procedures and requirements are clearly understood
Development and implementation of a sustainable procurement policy
General Community Media liaison
Public meetings
Direct mail communications
Advertising
Website
Direct community involvement
Keeping the lights on uninterrupted
Contribution to climate change
Cost and access to energy
Impact on local communities positive and negative
Climate change strategy
Submit on the New Zealand Energy Strategy
Direct community involvement, interaction, sponsorship and support
Shareholders Annual meeting
Board representatives
Reports and publications
Sustainable earnings
Growth
Shareholder value
Achieve carbon neutrality
Considered economic investment
Deliver sustainable shareholder returns
continued...

20
e TruTruTrust tsThe KuKukupkuppa Daa a Da Doveoveeovee CCh ChChCh Chariariiariaritababtabtablele le TTururwaswas anaanana nounounouncenn d runner-er-up up at at ouuuunitnitnitnitn y y y y2002200008 T8 TrustPower National CoCommummun
AAwAwards. The e Trust’s voluluntenteerserse ee e initiated a prorograrammemme ininto MerMerrivaivaivaivalelelele
Primary Schohoolol that saw aw mummumm s, s, dads, , andand co communitnitty vyy voluoluntenteersers makmakee lunchess fo fooor sr sr sr sttudttudents who ho ho ohowwere arrirrir vinvingg ag ag t st school with no o o o
s ssslunnch.ch.h. As AsAs a a resrr ult, the school hahahahahahaahaaaahaahass seee eeeseeseeeen an a decreease in the absentententntentntnttntententnteentn e
tion ononononcoucount and a higherer pa partirticipcipatiatataatatataaatatataatiat oin class activiv ties.
Merivale SchoolMerivale SchoolL to R: Linda Thompson, Keith Tempest,
Shirley Teepa and Lauren Bunyon with pupils; Angel Todd and Courage Hiku

TrustPower / Annual Report 2009 / 21
The formula is simple – the public can nominate voluntary organisations that they think are doing a great job in their community, for some reward, but most importantly, for recognition. With fi ve categories – Health and Wellbeing, Art and Culture, Sport and Recreation, Heritage and Environment, and Education and Child/Youth Development – the Awards attract huge interest from a broad cross section of society including the media, who value an opportunity to highlight some of the positive things happening in the community.
The relationship value is huge – for everybody. TrustPower gains from the relationships developed with the community, councils, and the media. Councils benefi t from the same relationships, aptly summed up by one mayor, who, surveying the room at a Community Awards presentation function, made the comment “This is fantastic – we have over 100 people in this room, who all make a huge difference to our community. As a council we don’t usually get the opportunity to interact with these people – most of our time is spent dealing with the people who either have, or create, problems.”
The Community Awards programme works for the volunteers as well because they get the opportunity to hear about what other like-minded people are up to and, through the networking opportunity created by the Awards, interact with community leaders, learn from others and share ideas, problems and solutions. The media gain from the opportunity to write or broadcast items that counterbalance the almost constant stream of bad news that fl ows across journalists’ desks. At the same time, local media gain a better understanding of what is going on behind the scenes in their community and develop valuable contacts for future reference.
On a smaller scale, our sponsorship of selected community organisations has continued to deliver benefi ts to those organisations, to TrustPower, and to the wider community. A good example is the Alexandra Musical Society, which gathers together an array of amazing talent from around the region for one major annual production, run each year alongside the region’s Blossom Festival. TrustPower’s sponsorship provides some fi nancial assistance, while in return we receive
tickets to host customers and guests to opening night – giving us an opportunity for staff to interact with customers and to foster relationships, while at the same time ensuring the Society has a full house for what is the most important night of its year.
More recently, we have elected to move away from some traditional event sponsorships, which tend to have a very short focus of a few weeks and sometimes only a few days, in favour of another initiative, the TrustPower Lend a Hand Foundation.
Offering year-long engagement and much greater benefi ts to the wider community, the Foundation had its beginnings fi ve years ago in a partnership between TrustPower and the St Kilda Rotary Club in Dunedin. Recently the concept has been expanded to include the whole of the South Island’s West Coast, in partnership with three local Rotary Clubs, and Snowtown in South Australia (where we own and operate a signifi cant wind farm), in partnership with the local Lions Club.
The Lend a Hand Foundation concept sees TrustPower provide seed funding for a Trust designed to give a “hand up”, rather than a hand out, to needy individuals, families or small community organisations, which would otherwise struggle to receive much needed assistance. With added fi nancial and “in-kind” input from Rotary (or in the case of Snowtown, Lions), local businesses, and trusts, as well as enthusiastic support from schools, welfare agencies and local councils, the TrustPower Lend a Hand Foundation is well on its way to providing much needed assistance to the West Coast and Snowtown communities, as it has in Dunedin over the past fi ve years.
The Lend a Hand concept, like our Community Awards programme and other smaller sponsorships, helps TrustPower keep in touch with the communities where we either have customers or operate generation facilities, and at the same time helps those communities keep in touch with people from TrustPower. Progressing this concept will remain a focus in the future.
As one of the participants at the grand fi nale National Community Awards famously said, “Volunteers don’t get paid – not because they are worthless, but because they are priceless”. At TrustPower, we believe the same applies to relationships, and the thinking, actions and behaviours of our people, and in the fi nal analysis their and the Company’s achievements and performance, refl ect that.
A key to the success of TrustPower’s community relations programme has been our focus on relationships. The best and largest example is our Community Awards programme, run in partnership with local councils, and currently encompassing 23 regions with further additions planned over the next two years.
Celebrating Volunteers inOur Community
“Volunteers don’t get paid – not because they are worthless, but because they are priceless”

22
KKaaiikkoohheee bbaasseddddddddddd TTTTTTTTTTTTTTTTTTTTTTTTooooooooooooooooppppppppppppp EEEEEEEEEnnnnnnnneeeeeeerrrrggggyyyy, iiiiinnnnn aaaaaaddddddddddddiiiittttiiioooooonnnnnnn tttttoooo oooowwwwwwwnnnnnniinngg and managing the nneettwwoorrkk tttthhhhaaatttt dddiisstrrrriiiiiiiiiiiibbbbbbbbbbbbbbbbbbbbbbbbbbbuuuuuuuuuuuuuuuuuuuuuuuuttttttttttttttteeeeeeeeeessssssss eeeeeeeelllllleeeeeeeccccttttrriiiiccccciiitttyyyy tttttthhhhhrrrrrrroooooooouuuuugggggghhhhhooooouuuuttttt ttttttthhhhhhhhee Far North, owns and oppeerraatteess tthhee NNggggaaaawwwhhhhhhhaaaaaaaaaaaaaaa gggggggggggggggggggggggggggggggggeeeeeeeeeeeeeoooooooootttttttttttthhhhhhhhhheeeeeeeerrrrrrmmmmaaallll ppppppooooooowwwwwweeeerrr sssttttaaaaatttiiiooooonnnnn.... FFFFFFFoollowing a major extension project, ttthhhheee NNNNNNgggggggggggggggggaaaaaaaaaaaaaaaaaaaaawwwwwwwwwwwwwwwwwwhhhhhhhhhhhhhaaaaaaaaa sssssssttttttttaaaaaaaaatttttttttiiiiiooonnnnnn’’’ssssss ccccaaaappaaaacccciiitttyyyyy wwwwwaaaaaasss expanded to 27MW - enough to poowwwweeeerrrr mmmmmmmmmmmmmmmmmmmmmooooooooooooooooooosssssssssttttttttttttt oooooooooooofffff ttthhee hhhhhoooooommmmmmeeeeeesss aaannndddddd bbbbbuuuuuuusssssssssiiiiiinnesses onthe Top Energy network.As Top Energy Chief Executive RRRRuuuusssssssssssssssssssssseeeeeeeeeeeeeeellllllllllllll SSSSSSShhhhhhaaaaaawwwwww sssssaaaaiiiiiddddddd aaaaatttt ttthhheeee ttttiiimmmmmmmmmmeeeeee, thhee expansion led to Top Energy not onlllyyy llllllllooooooooooooooooooooooooooookkkkkkkiiiinnnnnnggggg fffooor aaa lllllloooooonnnnnnnnnnggggg ttttteeeerrrrmmm pppppppppaarttnneerr ttoo buy the station’s output, but for a partnneeeerrrrrrrsssssssssssssssshhhhhhhhhhhhhhhhiiiiiiiiipppppppppppppppp tttthhhhaaaaattttt wwwwwoooooouuuuuuuullllldddddd eennnnssssuuurrreeeeeeeeeee lloccaaaallll ppeeople benefi ted from the growth of the Nggaaaaaaawwwwwwwwwwwwwwwwwwwwwwwhhhhhhhhhhhaaaa ssssttttaaaaaaaatttttiiiooonnnnnn. TTTTTTrrrrruuuuussstttttPPPoooooooooowwwwwwwwweeerrrr’’’’ssss pprrooppoossal to both purchase the station’s outputtt aaaaaaaaaaaaannnnnnnnnnnnnnnnndddd tttoo bbbbbbrrriiiinnnnngggggggg gggggggrrrrrreeeeeeaaaaaaaattteerrrrrr rreettaaiill ccoomppetition to Top Energy’s consumers shoowwwwwwwwweeeeeeeeeeeeeeedddddddd tttttthhhhhheeeeee lllllloooooooonnnnnnggggggggggg------ttttttttteeeeeeeerrrrrrmmmmcommmmiittmmeenntt ttoo partnership sought by Top Energy.POPOWEW RFULL RRELELATATIOIONSNSHIHIPSPS = PPOWO ERFUL RESULTS
Preferred Partner for Top Energy
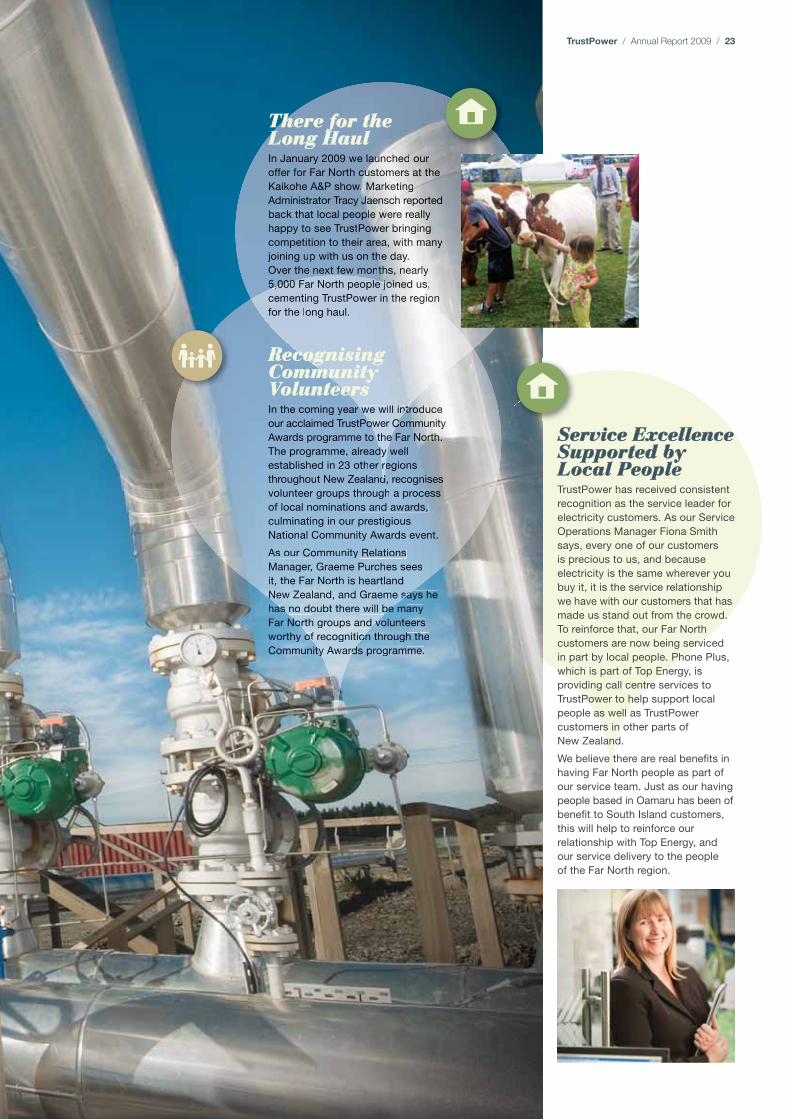
TrustPower / Annual Report 2009 / 23
Service Excellence Service Excellence Supported by Supported by Local PeopleLocal PeopleTrustPower has received consistent recognition as the service leader for electricity customers. As our Service Operations Manager Fiona Smith says, every one of our customers is precious to us, and because electricity is the same wherever you buy it, it is the service relationship we have with our customers that has made us stand out from the crowd. To reinforce that, our Far North customers are now being serviced in part by local people. Phone Plus, which is part of Top Energy, is providing call centre services to TrustPower to help support local people as well as TrustPower customers in other parts of New Zealand.
We believe there are real benefi ts in having Far North people as part of our service team. Just as our having people based in Oamaru has been of benefi t to South Island customers, this will help to reinforce our relationship with Top Energy, and our service delivery to the people of the Far North region.
In In JanJana uarrua y 20099 we we la laalaaaaaaaaaaaaaaaauuuuuuuununcunununuuuunuuuuuunuuuuuu hhheheheeedededdddddh ded o o oououourrrrrrr r roffoffofff er er ere forforor Fa FaFar NNr Nr Nortorth ch cccccccccuuuuuustustustustusustuuuuuusuuustuuusuu omeomeomeommeomeomeooooo rsrsrsrs rrrrrrr at at at tat at atat tta ththththehehehehetheh KaiKaiKKKa kohkohkok e AAe AAe AAA&P&P &P &PP&PPP shoshoss ww.w..w... . . ....... w. MMMaMaMaMarararrrMaarMMMMMMM ketketketketkk te ininngngngngnngnggii ggggggggggggg AdmAdmdmAdminiininn strstratoatoatotor r Tr Tr Tr TTr TTracracrr y Jy JJJJJJJJJJJJJaaeaeenenenenenaeenaaenaae sschscscschschchchchhchschhchschhcsccccccccccccccccc re rer rrrereeee r ppppopopooororrpppp tetetededdtet d bacbacbaca k tk tk thathathat lo lo localcalcalcalalalcal pe pe p peopopplplplpllllplpllleee we ww wwwwwwwe wwe wwe wwwwwwwwwe wwe wwe wwweererrereeereereeeee rrrereeeeeeereaaaallalllla llla la yy yyyhaphaphappy py py to toto seeseesee Tr TrTrrrTT ustusustuuuuu PoPooowowwwwwwwwwwwowwwowweeerer er er bbbbrrrriribb ibrb nnngngggggiigng nnnnnggggg g nnggcomcommpetpetpe itiitii on on to to thethhetheehetht ir rir arrrererereererrea er aaa, , aaa wwwwwwwwiwitwitttwiw hh h mmmmmmhh maaaanananynyyyyanaaaaan joijoininning ug up wp withith uss us o onononoo thhhhhhhhhhhhhhe e e d dddddeee aaaaayayayayyyy.y.y. OveOver tr the he nexnext ft ffew mmonmmontttththhhhshshsthtth , , nnnnnnnneearearearearreearlylyly ly y ly lllly5,05,00000 jjjjjjooioiinnnneeeededddddd d dd ed ussss,s,ss 5,000 FarFar NoNorthrth pe people e jjjjjjoooioinn
egioioiooooioionnnn nnnnnncemcemententinging Tr TrustustPoPower innnn n ttthheheee rrrregioforfor th the le longong ha haul.ul.
There for the There for the Long HaulLong Haul
In In n thethe co coominming yg yearear w ntntrrrorooododdddrororrrrrr uceuuceucucuucuceuceuceuceeuuceeuc wewe wi w ll ll intntintnttourour ac acclaclaimeimed Td TrustPotPower CoCooC mmmmmmmmmmuuuuuuumm uumm um uum nnitnititititnititnitnitnnin tttyyyyy y yoower CCAwaA rdsd programme to the FaFarar NNNNNoNoooooooooo NNoNoortrthrthhhhrthhrtrthrthhhhhhhhhrthhhrtthhhhrtthhhhrrthrtrtrtthrrrrth.. . the The prprogrogrammamme, , alrreadeady wellll dy estestablablblablishishishisheded ed d in in in 23 223 2 othothother er er regregggionnss srerthrthrrougououghouhout Nt New ew ZeaZeaZe lanlana dd, recrecececogognno nno iisiseseei sssssss sssssddvolvolvovoluntuntuntunteereereeree gr gr gr groupoupoupoups ts ts ts thhrohroh ughhugh a prorororoceceeeesesscee ss ssof ofof of loclocloclocal alal al nomnomnomnominainainainatiotiotiotions ns s andand aw aa ardddrds, s, culc minnatiat ng ng in n ourur pr prestestigigigiousoususo NatNationional al ComCommunmunityity Aw Awardards es s es es s vennntt...t
AsAs As ourour Co Commummunitnity Ry Relaelatiotions ns ManManageager, GraG emeeme P PuPurchr es seeees sss sit,i , thhe Far NorNooNo th t is heartland N saysaysaysasasasa s hhs he eeeeNeNewNewwNe ZeZ ZeZeeealaalaalaalaal ndnd,nd,n an an a d Gd Gd raeraeeeme me me me sasasasahahashahahashashas be be b manmanmanmanmany y yyas noon dodo doubtubtb th thereere w will be beFaFararFarF NoNor d volvovololvvovovolvolov untuntuntuntntttntnteeeereerereereeerrere s ss s sNoorthrthth gr grgrgrooupoupoupoups as as as as nd nd nnn vvwwwoworworwowww ththythythythyyy oofofofo ononnonononn th ththhth thththt ththrourourourrourourourourouough gh gh gh gh gh gh g thethhthethethththethofofof rere rererecogcogcogcogo initnitnitionioiiioCCoComomomomommmomommmC mmmummunmunnnnmmmm itityityitityy drdddds ps ps ps ppppps ppprogrogrogrogrogrogrogroggrogramramramamamrammramramrammmmmmmmemememememememe.meme.me.me.etytyyyy AwAw AwAwwardardardr
Recognising Recognising Community Community VolunteersVolunteers

24
Kinect Breaks Kinect Breaks Growth Records Growth Records With around 30,000 phone and internet services provided to our customer’s right around New Zealand, Kinect is one of New Zealand’s fastest growing telecommunications providers.
Kinect sources its phone services from Telecom Wholesale and according to account manager Kim Stewart, Kinect has produced amazing growth in a short time.
Kim says that Telecom Wholesale sees Kinect as a future star niche player in the telco market and is working closely with Kinect to keep developing innovative products and services for Kinect customers.
Kinect customers are also very happy with the service they are getting. Our most recent survey shows that 94 per cent of our customers are satisfi ed with the service they get from Kinect, with 51 per cent very satisfi ed and 30 per cent saying their expectations were completely exceeded.
In March our Kinect brand entered the Tauranga business telecommunications market, and results so far are very promising. After a successful Tauranga rollout, we will be offering Kinect services to business customers throughout New Zealand.
Dunedin Customers Join TrustPower Join TrustPower Late last year Dunedin customers were looking for a change, so we invited them to join us. And they did – in droves. In the year to 31 March 2009, close to 7,000 Dunedin customers switched to TrustPower. We’re delighted these customers have chosen us and we’ll do our very best to give them the service and respect that they deserve.
TrustPower has always been, and will continue to be selective about gaining customers, but Dunedin and the Far North will remain a focus for us.
Now with 25 per cent of the Dunedin market we intend to keep growing both our Dunedin customer base and our involvement in the Dunedin community.
Our Waipori power station is an integral part of Dunedin city’s power supply, and the future development of our Mahinerangi Wind Farm will further strengthen our ties with Dunedin and the Otago province.
TrustPower’s Market Share in Dunedin
0%
5%
10%
15%
20%
25%
30%
October2008
November2008
December2008
January2009
February2009
March2009
TrustPower’s Market Share in the Far North
%0
2%
4%
6%
8%
10%
12%
14%
16%
January2009
February2009
March2009
Kinect’s Customer Satisfaction
Completely exceededexpectations
Very Satisfied
Satisfied
0%
20%
40%
60%
80%
100%

TrustPower / Annual Report 2009 / 25
Our Customers
For TrustPower, a relationship with our customers means:Trust – that we will accurately bill and allocate our customers’ payments, and that what we say is true.Support – that sometimes, when our customers struggle to pay, we will be fl exible and offer solutions.Caring – that we will be involved in our customers’ communities and that our service people will show our customers that they aren’t “just a number”.Solving problems – when things go wrong we sort things out quickly and amicably.Real people – we treat our customers how we would like to be treated, and it’s more than OK for our service people to have a chat or a laugh with our customers.
Customer Service - Going 1 to OneDuring 2008 we introduced “1 to one” in our service centres. 1 to one is an acronym of sorts for “One Quality Conversation to Engage and Enjoy”.
In other words, our service people aim to do it once and do it right for our customers, but they also take the time to have an engaging conversation that both they and our customers enjoy. We implemented a detailed programme, supported by training, to achieve this.
Our Customers are the Best JudgeThe success of the 1 to one programme is monitored against specifi c quality benchmarks, and through post call customer surveys. In these surveys our customers are asked to rate the service they received, with a target rating of either very good or excellent by 95 per cent of our customers. Results are shown below:
Customers Demand SustainabilityConsumers continue to exhibit a growing preference for sustainability. As demand and customer awareness grow, consumers are increasingly insisting that companies actually “walk the talk” in terms of claims about sustainability and eco-friendliness.
Our portfolio of renewable generation and our reputation for providing innovative solutions means TrustPower is well placed to not only meet that demand, but to clearly differentiate our company from our competitors. While some companies are now struggling to catch up, over 80 years of strong commitment to building a long-term sustainable business has left TrustPower well positioned now, and for the future.
That commitment is not only being recognised by customers, but is increasingly forming a signifi cant part of their decision to choose TrustPower as their electricity retailer.
In the past year TrustPower has acquired several nationwide customers that were looking for a number of non-price attributes. Key considerations were our sustainability and our ability to support their own sustainability initiatives.
In choosing TrustPower, our customers were satisfi ed that our company could enable them to achieve effi ciencies by consolidating their business with one supplier, and at the same time create the opportunity for a sharing of knowledge and to learn from each other’s experiences regarding sustainablity.
Customer RewardsThrough our Friends, Friends Extra, and BusinessChoices programmes, we reward the majority of our customers with discounts for their loyalty and payment history.
74 per cent of eligible residential customers have now joined our Friends Extra program, nearing our target of 80 per cent.
86 per cent of eligible business customers have taken up our BusinessChoices rewards program, also nearing our target of 90 per cent.
Customer SafetyWe comply with or exceed customer safety requirements with respect to electrical safety and the protection of medically dependent or vulnerable customers.
Customer InformationA range of information is available to our customers to help them to improve energy effi ciency, and choose the best electricity or telecommunications package option for their needs.
A “relationship” with a power company may not sound that appealing to many of us. But when you break down what that actually means, it really is what our customers want.
TrustPower’s Customer Satisfaction
Please rate our agent, on the concern and, care they
displayed while dealing with your call
How well did our agent resolve your enquiry?
Overall, how would you rate the service you received today?
0%
20%
40%
60%
80%
100%
Actual
Target

26
Everyone knows that relationships are important. Almost ten years ago when I fi rst started with TrustPower as a graduate I knew that relationships were going to be an important part of my new career.
When you work in an environment where others are prepared to support you and give you the help that you need, you quickly fi nd yourself doing the same.
Recently I was appointed as Manager of Data Management. It is the fi rst managerial position I have had and it brought with it new challenges. The relationships I have built up at TrustPower made me feel confi dent about accepting the challenge.
The leadership programmes that TrustPower provide for me allow me to continue my development, and are supported by regular one on one time with members of the Senior Management Team. These Managers show a genuine interest in how I am going, and a willingness to provide me support or guidance. Furthermore these sessions give me an opportunity to share my ideas and fi nd out more about different areas of the company.
At the end of the day I believe it’s the relationships I have formed, and the opportunities those relationships enable, that makes my working for TrustPower continue to be exciting and rewarding.
Matthew JamesMatthew JamesManager of Data Management

TrustPower / Annual Report 2009 / 27
One of the key measures of our success has been our annual staff engagement survey, which measures the strength of the relationships staff have with TrustPower as a company, with the leadership within the company, and with each other. Engagement is defi ned as an employee’s willingness and ability to help their company succeed, largely by providing discretionary effort on a sustained basis. It’s like contributing to and treating the company as though you own it. Efforts to increase employee engagement have a real impact on improving relationships both within, and with, an organisation.
Initial survey results (2003) showed that team cohesion and organisational justice were the key drivers for work satisfaction, and these, in turn, were strongly correlated with high turnover intentions. Drivers like leadership quality, organisation commitment and citizenship behaviours hardly featured and it is these qualities that differentiate high performing companies from others. As a result TrustPower introduced a programme to transform our relationships with staff, and develop a sustainable legacy for the future.
Ongoing surveys have statistically shown that the interventions directed at improving TrustPower satisfaction are likely to have enduring effects. The higher an employee’s satisfaction with the performance feedback process, team cohesion, work satisfaction and managerial support, the greater the overall organisational satisfaction and engagement are likely to be. We are proud that our measurement indices include a signifi cant reduction in intention to leave as well as signifi cant increases in other positive indices.
The power of this transformation in relationships can be seen in the changes that have occurred. Currently
TrustPower sources approximately seventy percent of its Tauranga entry level vacancies through the e-recruitment programme (people interested in working at TrustPower) and staff referrals. Recruitment advertising costs have reduced by 54 per cent, despite a growth in employee numbers of 38 per cent over the same period (2003-2008). Administration costs related to recruitment and selection have also reduced signifi cantly over the same period and voluntary turnover has more than halved, signifi cantly reducing costs and productivity losses.
Over 90 per cent of internal vacancies (including promotions) are fi lled by existing staff, and our ongoing investment in leadership development has had a signifi cant infl uence on this statistic. Five new roles were created during the year to resource new opportunities. Furthermore, desirable career paths have clearly evolved across the company as leaders have developed more effective behaviours. TrustPower continues to employ and promote on a merit basis.
A proactive new employee 3,6 and 9 month feedback process supports the positive perception shift in terms of TrustPower being a leading employer of choice - a direct result of improved recruitment, selection and induction processes which have been successively introduced since 2006.
More than 50 per cent of our staff now recommend TrustPower as a great place to work, and there has been no turnover in key talent or identifi ed successors since these processes were implemented.
Developing powerful relationships with staff has led to powerful results, with our operating surplus increasing by 60 per cent per employee over the last six years.
Relationships Count
For the past six years, the major focus of our people strategy has been developing healthy and productive relationships.
Voluntary Turnover
Volu
ntar
y Tu
rno
ver/
Tota
l Em
plo
yees
TrustPower
0%
5%%
10%
15%
20%
25%
Benchmark (Online Executive Search - May 2009)
2007 2008 2009
Injury Incident Rate (per 200,000 hours worked)April 2004 to March 2009
Our target is to reduce incident rate by 25% year on year
Ann
ual T
otal
Inju
ry R
ate
0
5
10
15
20
25
2004/05 2005/06 2006/07 2007/08 2008/09
2008 Engagement SurveyBenchmark Results
0.00
1.00
2.00
3.00
4.00
5.00
6.00
Benefits &Compensation
Index
CareerDevelopment
Index
CommunicationsIndex
EmployeeCommitment
Index
EmployeeRetention
Index
Innovation &Risk-Taking
Index
ManagerQualityIndex
WorkEnvironment
Index
TrustPower Data
Ind
ex
Benchmark Data (Corporate Executive Board Global Survey)

28
TrustPower – TrustPower – A Responsible GeneratorA Responsible GeneratorFiFisFisFisFisissFisFisFiFisFFisFisFiFisF sFisFisssFisFiFF sFissssF hh ahhh ah ah aaah aaaaaah aahh ah ah aaahhh aaahh aaah ah aahhh aahh aacceccecceccecceccececcececcccceccececccecceccecccceeeccccecceecceeeeeecceeeccecceceeecececcceccccc ssss ssssssssssssssssssssss ssssssssssssssssssssssssssssssssssssssssss tttottottotototttttttttttttttto toto to ootottotoototo too ooooo thethethethethehthethethehheththethheheheheehetheththet eeeheeh hehehehheheheheheheeh hehehehehehehee dadwadwadwadwadwadwadadwadwdwdwadwadwadwadwaddwdadwadwddddadwadwd ateateateateateateateateateateeateeateataaaa rsrssrsrssrsrs srssrsssrsrsrrsrrss ofofoffoffoffofofofofofofofooffffofof oof ofoff rivriviirivrivrivrivrivrivrivrrivrivvvrrivvr verserserrerrsrsserssssserseersssersrrsersersserserse sersrserrss isisiis is isisississsisii anan anan ananananannaanan ana ananaanaanann is isis is isissssissississisisssuesuesuesuesuees eesueuees eeeeesueeeeeueueueesu wewe we w wew wwewwewweweewewewweweew mumusmumummusmumusmusmuusussusussmum smuuuusssumususmm tt tt at aat at aat aaatt attt aat at aat aattt att aat at addrddrdddrddddddrdddddrdrrdddrddddddddddrddddrddrddddddddddddddddddrddrdddddd rdddd eeeeeeeeeerrrrrreesessessessesssessessessesseseeseesssssesssssessssssee ssesssssssssse sss onononononononnon onoon onoooonno o aa a aaaaaaaaa a aaaaaaaaa a aa aa a ccccconconcoooococoooconnnconconooconnnnconooonocoonnoconcoconooconnconcocccoconccocoontintintitintininitintintitintinttinitintintint ntinintinintinitinininuouuouuuouuouuououuouuouuououooouuouuoouuououuouuouuououououuouuu s bs bs bbs bs bs bbbs bs bs bs bs bs bsss bs bs bbasiasasiasiasiasasiasasissisiasiassssasaaasiaasissssssssasiasasssssaassss s. ss. sssss. s.ssssss.s..s WhiWhiWhiWhiWWWhiWhiWhWhihiWhWhiWWhWhhihiWWhWhWhWWWWWWhiWhWhWWWWWhW llelee elele elllle eleele aaacacacacaccccccaccaccaacaaccaacacacac esessessessessessesesssssesssssssss fofofofofofooo fo fofofoo f rrrrrr rrnatnanatnatnatnatnatatatatnatnaatatattnattnnattaanatna iveiveiveiveiveiveiveiveiveiveiviveeveveiveiveeeveeevevevev fififi fi fi fififififififififififififififififififififififi fishhhsshhssssssshssssssshshhhsh sh shhshhshshhhhhsh is iis is sisisisssss a fa faa fa fffa ffa fa ffaaa focuocuocuocuocuocuuocuoccus os os os os oosss os oooos oooooooooos oof mf mf mf mf mf mf mmf mf mmmmf mf mmf mmf mff mf mf mf mf mf mmmmucuchucuchuchchchuchchchhuchuucucchuchucuucchu hhuuuchucuuucu of ofofofofofoffoff o oofooffoofooofffoofo oof ououououououuoooour mr mr mmr mmr mr mr r mr mmrr mr mmmmmmmmmmmmmmmmmitiitiitiitiititiititititiittigatgagatgattgatatgatgatgattataatgagagaggagatggg ionionioniononiononionionoonn atatat atatat atatat att aataatat exexexexex exexex exe exexexeeexe istististististtttistttistisstisti tstingingingngingngngnggnngggginggnininngingingg scschschschscscscschschhschschhschchschschschhchhchhschhhschhhhhcc ememeemeeeememeeemmmemememeemeemeememeemeemeememmeeemeeeeeeeemeeeeemeeeemeeeemeeeemeeemmeeeee eeeeeeeeees, s,s, s, sss, s,ss, thithihithhhhithththithithithihhhththitthiithihiis cs cs cs cs cs cs cs ccccs cs css cs s an an an aanan nnanaaanaaa oftofttoftoftofttoftoftoofoofofteneenenenen en en eeen n eeenee be be bbeeebe bebeeeb achacachachachacachachacacaacchaac ievievievevevevevvevievievievevevevvved ed eded dddded ededed ed eedddededededd momormormorrmormormormormormormorrmormmorrrmomorrro e eee e e ee ee ee eee eee eee eee e easiasiassasiasisiaaasasiasisssiiasiaaaaaa ly ly ly lyy ylylyly yyyy yllyyy (m((((((mo(mo(mo(mo(mo(mo(momo((mo(mo(mo((moomoo(mo(( st st stttssssstsssnanatnanataaatatatatttttattnanaatnattatnatttnanatnataatttnatnataatttttnatttttttnanattttttatiiiiiiveiveiveiveveveiviviveiviveiveiveiveveiviveeiveeiveviviveveeeiveivivveviveivivevevveivveeeeeeeeee fi fi fi fi fi fi fifi fififififish sh shhhshshshshhsh sh sshshhhshsh areaaaarearearearreeareareaareareareareeeararareaaaa eee e eeee effeff efefe efefe efefef efeefffffefefefececececececfefeccfeecffecfeecccfefeff tivtivtivtivtivtivtivvtivitivtivtitivt vvvt e ce ce ce ce ce ce ce cee cee ce cccclilimiimlimlimlimmimimmiimmmmmbebberrrbebereeebererrbebeberrberee s) s) s) s)s)s)s)))) thathathathhathahathahathaan fnn fn ffffffn fn fn fffn ffor or orororororrooror or oo intiintintinttnttttntnintntintintii rodrodrodrodrododrodrodrrododrorodduuceuuceuceuceceeuceuceeeuceuceddddddddddd dddddsspespespspsspepespeespesspespesssspespespespespspspspppepespsspppepeecccccccccccccc eieieieieciecieciec eec eieeieees sss ss ss ss sss ss sssssss ss sssss uchuchuchuchuchhhhuuchuucuchchchchuchcuchuch asaaaasas asaaas as asasaa trtrtrtrtrtrttttttrttr trtrtr trtrrrrtrtrrt outoutoutououtououtoututtouttouttoutoutututuutouto to .... .. .
Innn nIn In nIn nnInInInInnn FeFFFFFFFFFFeFFFFFFFFFFebebebebbebbbebeebebbruaruauuruaauaruauaruaruary ryry ry ryrry ryry ryyyyry yry yy thithithththithiththithithtthihis ys ys ys ys ys y ys yss yssssss eareareaeaeareareareararrearee ra , aaaa, a, aaaaaaaaaaaaaaaaaa, , aaaaaaaas ps ps ps ps pps ps ps ps ps ps ppps ppppppppppartartartttartrtrttttartarttta ofoofof of ofooooooooof rerere resousosousouououssousouso rcercercrcercececercr eccr e cocco co coc cooo consensensensensesensesnsensensensn entnt ntntnt nnnntnnreqreqreqreqreqreqqqreqreqreqqqreqrrerequuuuuuiruiuiuiruiruiruiruiruiruuuiruiruiruuuiruiriuiuiuiuu eemeememeemeemeemeemememeeemeemementsntsntsntsntsntsntsntsn s, mm, mmmm, mm, mmmm, mmm, m, mm, mmmm, m, embembembembembembembembemembeemeembembmeeem erserserrersrsrserserrerereeerss ofo off of of ofofofofoofffooffo ouououo ouououououououoouu ou ouou r Er r EEr Er Er Er EEr Err EEnvinvinvinvnvnvnvnviivnvvn ronronronnononronroronrororo menmenmenmenmenmenmenmenmennmmenm t Tt Tt Tt Tt Tt Tt Tt Tt TTt Tttt Tt Tt Teameameamameameameameameameaeameamameammmmmm wewe wew we weew wew wew ww rerereeerererereerrerrinvinvinvnvinvinvnnvinvinvvnvinvinnvvvvooooooolvolvolvolvolvvolvollvolvolvvvolvolveeed ededed ed edeed ed ed e in in in inininiin nnn a fia fia fia fifia fia fia fifia fia a fi shshshsh shsh shshhsssss sasasasa sa sasasaalvalvavaval aalvalvalvavavvaaage ge ge ge ge gegegege gegeggeg andandandandandananddaanddda daand rerere re rerere reeeereerrreestostostostostostoostoostss ostt ckickikckicckkikickickikcc ng ng nggngng ngngn proproproproproproproproppprooooogrgragrgragragragraagragragrararararaaarag mmemmmemmemmemememmemmmmmmmmemmmmm in inninin iniinnnin thethethethethethethettththethththeththetheeeee Ma MaMaMaMa Ma MaMMaMaM MaMaMMaaMarlbrlbrlbbbrlbrlbrlbrlbrrlbrllbrlbbrl orooroorooroororoorooroororoooror ughughughughughghughu hhghghuu hghghhh Re ReRe ReReReRe Re RReeeRR giogiogiogiogioiiogiogioogioogiogg n. n. nn. n.n.nn. nnn. ThiThiThiThThThiThThihThThThT s ws ws ws ws ws wws ws ws wss wwwwwwwasasasas aaaaas asss s s a gaa ga ga gaa ggga ga ga ggreareaeareareeeareareareaeae t ot ot ot ot ot ot ot oott oppoppoppoppoppoppoppoppoppoppopp rturturtuturtrtutrturtrtrtrt nitnitnitnitnitnitnitnititttnitnittnn yy yy yyyy yyy yyforforforfororforforforforfforf rfofoofoo ououououoououo r srr sr sr srr sr sr sr ssstaftafttafaftaftaataft f tf tff tf tf tff tf tf to go go go go go go go gget eet et etetet etetet teet outoutoutuoutououtttoutoooutou in iniiniininiininto ttoto tto ttotooto o thethethethetheththeeeethet ettthe fi fi fififi fi fififififi fi fi eldeldeldeeldeldeeleldelddeeeldeeldeldel , a, a a, a, aaaand nd ndnd nd dn to to tttooto tooto to o devdevdevdevdevdevevdedevdeded eloeloeloeloeloeloooe op p pppppp ppprelrelrelelelelreleeeerereee aaaatataaaaattatiatiatiatttiatitttt onsonsonsonsonsnsnsonsnssshiphiphiphiphiphhiphipphipps wss ws ws ws ws wwws wwwithithithiithithithithitithithiti ot otot ototototooo hererherherrerheeh rr st ststst stsst sttsssstakakeakeakeakeakeakeakeakek holhoholholholholhoohooholo derdererderderdderderdererdererrderrrrrerers. sss. sss. s.
TheTheTheTheTheTheTheTTheTheeTheThTh ss ssssssssssssasassasasasasasaasalvalvalvalvalvavvaalll age ge ge geege geg andandandandandandandandnda d tr tr tr trtrrransansansansnsansnsansansansssferferferferererferferr op opop opopop opop opopperaeraereraeraeeraerararatiotiotioiiotiotiotioiooooon inn in in in in innn in n in n in iin i iiii iiiinvnnvonvnvovonvonvovvoonvoonvonvonvonvonvovnvonvonvonvvvnvovonvovnvnvnvonvonvonvnvoonvonvonvonvovnvnvonvonvonvonvonnvnvonvonvonvnvonvn llll elvelvelvelveevelveevelvevelveeveelvelvelvelvelveevevelvevelvevelvevelvelvelvelvel ddddddddddddd ad ad addd ad aaadd ad ad ad adddd aad aad aad ad aad addd ad addd ad pprpprpppprpprpprprprpppppprprprprpprppprprpprppprpprppprppppprpprprrr iiioxio ioxioxiiioxioxioxixoxioooxxxioooxooxxoxioxioxiooxooxxxxxxiiixioxoxoxxxoxioxiooxxoximatmatmatmatmatmatmatmatmatmamamatmatmatmatmatmamatmatmatmmmmm llllllllllllllllellllely twetwetwtwtwetwetwetwetweetwewettweentynnntnntyntyntynnntytytytytytyyyyy iniinini inn indivdivdivdivddivdivddivd viduidududududududuudd alsalsaalsalsaals frfr fr frrfrfrrfrfrom omommom omomooomom difdifdifdifdifdifdifdifdiffferferfeferferferfererfereferererererererererrrrrrferrerrerrrerrrrerrrrrrrreeenenenenenenenententententententententnntententenententententenententenenenenteneenneeeeeeeeeene organisations comcomcomcommingitogtogtogtogtogogtogtogtogtogogooo ethethetethethethethhethhethhhthe hethe hee eehhhher erer r andandaanddandandanddanand ne nen ne nenennettittiittitittiittttiting ng ng ngngnggngnngngnggg fisfisfisfisfissfi sfifi sfi ssssfisssfisssssssssssssshhhhh fh fh fh fh fh fh fh fh fh fhh fh ffh fhhhh fh fh ffh fh fh fh fh fh fh fh fhhhh fhh ffh fhh rrrrrrom poolssssss ddu dududuuddududuuuuuudddurinirinrinrinrinrinrinrinrinrrinrriiriningg ag ag aaaaag ag aaaag aaaag aag ag ag ag ag aag aggg ppplplplpplp plppl plplplp plpppp aannaannannannannannnnnnnnnnnnannnnnnnnnnn ed ed edededed eedeeed d dewdewdewddewwwdewwddewdewwdewde ateateateateatetateateateateaateaa etaateriririririrrinrinrinrininring. g. gggggg On OnOn OnOOOOnOOOn OnOOOOn On Onnn nnn nnn Onn nn ononononeoneoneoneoneoneoneoneeoneeoneoneoneononononeoneeeoneonononeeoneeoneoneononeoneoneoneoneoneoneonennononenonnoonnnn ooo occasion, ssssomeomeomeomeeeomemememee 111155515 111151515151115515551151555000000 t0 t000 t0 tt0 ttt0 tt00 ttt tttt00 rourourourourourourourouuurourourourourourout wt wtt wt wt wwwwt wt wt wt wt wwt wwwt werereereereeererrereeeeeeeeeeeerereeerereereeeereerrereeeerreee eeeeeeeeee e salsalsalsalsalsalsaalsasalsalallass llvagvavagvvagvagvavagvagvagvagvagvvvvvagvaagvaav ed ed edededded deded dedd iiniinnininnininninininnnnnnnnnnnn oooooooooooonononononeooooooooooooo net. Once nnetteettetteeeettt ed,d,dddd,dd,d, th ththth thth th thththththtth tthhhhee fie fie fie fie fie fie fie fifie fifie fifiee fie s ssh sshhhhh sshshhshshshshhhhshhs w we wwewewweweweewwewwweewewww rererere re rre rerrree e e rreer traratrattratratratratrtrratrrrararatt nnnssspspsssspspppsspnspspppsspspnssnspspsnn pppoortortortortortortortortoortooortoortorortorttedededddedded ed eddededed edeeedddto to totoo to tototo tttoot a laa la laa la la la a laa a argargarargrgrgrgargargarargrgargargrgrggge ee e e e ee hhhhhhhhhhhhhe hhhhhhhhhhhhhhhe hhhhhhhhhhhhhhhhhhhhhhhhhhe hhhhhhhhhhhhhhhhhhhe hhhhhhhhee hhhhhhhhhhhhe ooooldooooolding tank forforfororrrr tata ta ta tataatatataagggggigggggggiiggigggigggiggggggggiggggggggigigggggggggggggigggggggiggggggg ngnngngngng,ng,ng,nng,nng,ng,ng,gngngngnnngggg tth th ththhththththththhhhheeneeeenen nenenenenenn nnennn en lololoaoaoaloaoaoaoaoaaloaaaaalo ddddddededeeededdddddeddedededdedddddededd dedeedeed dd in in ininn ininininnniniin smsmsmsmsmsm sm smsmsm smsm smmmallalallallallallallllalallalla numnumnumnumnumnumnumummuumumun berbeberberberberbererberberberberbeeb rrb ssss s s s s s iiiis s iis iiiss isss iiiiiiiiiiiiisss iiiiiis iiiiis nnnnnnntontonnntontontonntonnnntontn a ma monnsosoooooooooooos on bnn bn bn bn bn bn bbbbnn ucucucucccckkkkkkkkkkkuckkckckuckucckkkkkkcckkcckkeeteeteteteet,et,et,eet,eeeet, anananana ananananaanaanannnnddd td td tddd tddddd tdd td td td td td d rrrananaanranranrarrranaranaarar spospospopppspospospospoooopospospopospospopospopp rterrterterteeeertertterteeeer eert ddd d d bbbbbbbdd bbbbdddd by y yy yyyyyhelhelhelhehelheheelhelehhehhheehhele icoicicoicoicoococococoooooi ptpteptptptpteteteteteeeeeeeeeeeeeeeteeeeeeptpteeeeeeeeeptteeepp eeeeeeeteteeeeeeteeeeeeeeeteeeeeep eeeeeeeteeeeeeeep eeeeeeteeeeeteeeepteppteptteeeteeerr trrr tr tr trrrrr ttr trrrrr tr trr trrrr trrrrrrrrrrrr r o suittaababaabbabaababaababbblabbbabllbblblblblblllllleee le le lee le l le oococococaocacacaaocaocaoo aaao aocacatttiotiotiottitittiootiooooonsnnsnsnsssssss s nssssnssssnsssnsnsssns ininnnnin inin in ninn ththhthethehethethehhhetheethee ttwtwtwtw twtw tw twtwwwwtwwwwooo ro o o ro rrrrroo ro ooo ro o ro roo rro iveiiiiveiveveveiveiiveivevvvvv rrsrsrs rs srss rsrrssrsrs ffffffororororffororrorrfforffforforffooo c caca cacaa caaaaaa caccc caarefefrefrefrefrefrefrefreee ul ul lul llulhanhanhananhanhahanhanhahanaaaa d rd rdd r rrrd d d rd rrrrrrrrrrrrrrrrrrrrrd reeeeeeeeeeleleleleleleeleeeleeeeleleleeeleleleeleeeeeelelllleleleelleleeeeleleeeleleeeeleeeleeleleeeeleleleeeeeeeeeeeeeeeeeeeeeeee ase. OOOOOOOOOOvvvvvvevevevevevererererrrvveveverrevvereeeererrevererererererrveer ttttththththththtthhhthth tht tthhthhtththhh thhheeeeeeeeee ceeee ce ce ce eee ce ce ce cccccccccccooououourouuroururoururooooou sssessese se e sese eese ee ooof ofof fof offoofofof oofof off ffoufoufooufoufoufououfoufoououuuf uff uur dr dr dr dr dddr dr ddr ddr dddaysaysaysaysaysaysaaysaysaysayaaaaysysa , a, a, aaaaaaaapprppppprpprprrpppprprrpprpppprppppp oooxioxioxoxioxioxioxioxioxioxixoxox matmatmatmatmatmatmammatmatmamatmaatattelyelyelyelyelyeee y3535350350350350350353503503 03 fififi fififififi fifi fi fi fi fi fi fi fi fi fififi fifififi fi fififi fififi fi fi fi fi fi fifi fi fi fi fi fifi fifififififi fifi fifi fififififififififififififififisssssssssh h h sssssh sssssssh wwewewewewerwerwewerwerwerwewerwerewwerewerwerwerwererw rerererereererrw rerwerrre e te te te te te te teee teeee tteee tteee tee teeeeeee te te te te te te ttteee te tte ttee ttttaaaagagagagagaggaggggggggggagaagagaagggaggagagggggaagggggagggggggaggggagagggaaagaggaagaaggggagggggggggeeeeeedededddeeeededdddeeeeedddddedddddeedeeeded dded ddeededddddeeeeeed dddddandandandandandd rr rrrrrddddddd reerrrererrrrrerereeerrereerrreeeeeeeerelleeaeaeaaealeallleleaeeaealeeeealeeeealleeeaaleeeleellleleeaelelelleasedsedsedsedsededsedsededddddes in in ini inin inininnininn th th ththhht th thththhisis is is sis ssssis wwawawawayayayywayayywayywaywwaaywaawayaay...
TrustPower / Annual Report 2009 / 29
As a consequence of the large number and wide geographic distribution of our schemes, we have a direct and signifi cant inter-relationship with all aspects of the environment, and a wide range of stakeholders.
The majority of our hydro schemes operate from lakes, with some being operated as run of river schemes. Over 80 per cent of the storage is contained in the fi ve largest lakes, which have an approximate storage of 2.8 billion cubic metres and cover a combined area of approximately 6,828 hectares. During an average year approximately 39.5 billion litres of water pass through these fi ve schemes before being returned to existing natural waterways.
Each of the schemes operates under a Resource Consent. These consents contain conditions that were established following an extensive consultative and regulatory review process. TrustPower’s key measure of environmental sustainability is compliance with these consents.
We have set ‘Environmental Polices’ which provide guidance to help achieve our goals, supported by an ‘Environmental Management System’ which identifi es a series of objectives and actions that ensure the Company can meet its responsibilities. Our objectives include (but are not limited to) complying with all environmental legislation, accurately reporting, monitoring and minimising all non-compliance events, implementing inclusive and fl exible consultation programmes, improving our resource use and effi ciency and ensuring that all staff are adequately trained to perform their roles, including reducing solid waste generated from operations.
Our New Zealand based activities of generating and retailing electricity are certifi ed as not contributing to the build up of green house gases.
In addition to monitoring and mitigating adverse environmental effects resulting from the operation of existing schemes, we seek to avoid the generation of adverse environmental effects from any proposed schemes. This is achieved through the preparation of appropriate and robust Assessment of Environmental Effects reports, and effective consultation with key stakeholders as a critical component of any application for resource consent. The success of this approach has been evident with the resource consent application for the proposed Arnold Scheme, and the reconsenting of the existing Patea Scheme, where agreements were reached with key stakeholders either prior to or during the hearing phase.
Avoiding Non-Compliance EventsTrustPower’s goal is to have zero non compliance events. Currently TrustPower holds 462 resource consents, containing 2,769 conditions with which TrustPower must comply. This number is set to increase over the next two years following the recent granting of resource consents for two wind farms in the South Island of New Zealand, and the conclusion of the proposed Arnold and Wairau hydro schemes, consents for both of which will be reviewed by the Environment Court this year.
Following the review of our compliance record and monitoring system, we undertook further on site training workshops to ensure our site staff kept compliance at the forefront of their daily activities. This training will be repeated next year and also provided to head offi ce staff. As a result of the initiatives implemented over the last four years TrustPower’s non compliance events have been reduced from 18 (2006 – 2007) to fi ve for the current year. All fi ve were reported to the appropriate regional authorities, which determined four were not signifi cant,
EnvironmentalPerformance
Our goal is to minimise the potential adverse environmental impact and maximise (where practicable) all positive environmental effects for each of our 21 generation schemes. We currently operate 19 hydro schemes and the country’s largest wind farm in New Zealand, and another large wind farm in Australia.

30
with no enforcement action required. The fi fth event is awaiting a determination. A further breach that occurred and was reported last fi nancial year, resulted in an infringement notice being issued in April 2008.
Managing Contaminant ReleasesThe term ‘contaminant release’ refers to the uncontrolled or accidental release of a hazardous substance or contaminant. One contaminant release occurred in the year. This event was associated with the new Deep Stream hydro scheme and resulted in the release of fi ne clay sediments into Broad and Lee Streams in Central Otago. We commissioned independent studies to assess the overall impact of the event, and these highlighted that the effects were localised and would not result in any long-term negative effect on the environment. Despite these fi ndings, the event resulted in TrustPower being issued with an infringement notice.
Stakeholder SurveyAs part of our desire to improve performance against our ‘Environmental Policies’ and the Environmental Management System, a stakeholder satisfaction survey was undertaken. The objective of this survey was to ensure TrustPower, when dealing with stakeholders during a resource consent program or in compliance reporting, was conducting itself in a manner that could best achieve our underlying goals.
The results of the survey highlighted our strengths as initiating consultation early and sharing information openly. We were applauded for always raising compliance issues promptly and again sharing information openly. The feedback included comments that our staff were considered genuine in their dealings, and that this was effective in developing trust and confi dence.
As a result of the survey feed back we have developed a consultation document which will allow all staff undertaking consultation to ensure consistency is maintained through the process whether it is a small or large project.
PlanningTrustPower has existing assets and new development applications involving 20 District Councils and 10 Regional Councils throughout New Zealand. TrustPower also monitors planning documents, in regions where we have development aspirations, involving 63 Council regions throughout New Zealand.
Involvement in the planning process is critical to ensuring our existing assets are adequately protected, and enhancement or further development is not unduly restricted. Along with second-generation plans, many national policy documents and strategies, as well as the Resource Management Act itself, are being amended.
During the past year, three of the most notable planning outcomes were:• Submission on, and presentation to the Select
Committee for, the Resource Management Amendment (Streamline and Simplify) Bill.
• Securing recognition for the benefi ts of renewable energy over non-renewable energy generation throughout a number of second generation district plans.
• Signifi cant involvement with the Horizons One Plan, the fi rst combined District and Regional Plan, and Regional Policy Statement.
New Development ProjectsOur proposed Kaiwera Downs and Mahinerangi Wind
Farms were both granted resource consents this year and we are continuing to progress the proposed Arnold and Wairau hydro schemes. The Wairau proposal is due to be heard in the Environment Court starting October 2009, while the Arnold proposal is scheduled to be heard in the Environment Court in early 2010.
EnvironmentalPerformance
During an average year approximately 39.5 billion litres of water pass through our fi ve schemes before being returned to existing natural waterways.
Non Compliance Events2004 - 2009
Num
ber
of E
vent
s
0
5
10
15
20
25
2004 2005 2006 2007 2008 2009
Source of Own New Zealand Generation
GW
h's
Pro
duc
ed
0
500
1,000
1,500
2,000
2,500
2005 2006 2007 2008 2009South Island Hydro
North Island Hydro
Wind Generation

TrustPower / Annual Report 2009 / 31
Our New Zealand revenue comes primarily from the sale of electricity to retail and commercial customers, with an increasing contribution from the sale of telecommunications services. TrustPower’s portfolio of assets is now worth more than $2.5 billion, including the most recent asset valuation uplift of over $250 million. Of this amount, over $80 million was related to the recently completed Snowtown Wind Farm in South Australia. This large uplift is refl ective of the increased revenue that the wind farm assets will produce in the future, and supports the wisdom of our investment decisions to date.
Communication with StakeholdersWe actively communicate our progress and future intentions with shareholders and other groups through a variety of mediums. All shareholders are welcome to attend our annual meeting which is well attended every year, and this, along with this annual report, is the primary means of communicating with our shareholders. Briefi ngs are
held regularly with equity analysts both on an individual basis and through regular investor presentations. As a result of these briefi ngs, and share market announcements, we believe we have been able to keep the market well informed. To reinforce this, all of our investor presentations are placed on the TrustPower website for viewing by all shareholders and the general public.
The Year AheadTrustPower is well placed to weather the current global economic downturn. The steady nature of our earnings should mean we will be less adversely affected than many other businesses. Our aim is to provide another year of earnings growth in line with our economic goals. A major challenge for us in the coming year will be our progression of business cases for new generation projects, to the point of commitment to construct, in a challenging economic and regulatory environment. Refer to the Directors’ and the Chief Executive’s reports for project details.
At TrustPower our economic goal is to produce steadily growing profi tability over the long term. This allows us to provide our shareholders with increased returns, without the risks associated with rapid growth.
SustainableEconomic Performance
Five Year Economic Summary Mar 05 Mar 06 Mar 07 Mar 08 Mar 09
Electricity customer numbers 000’s 225 220 219 222 227 Telecommunication customer numbers 000’s 0 0 15 26 30 Customer sales (GWh) 5,873 4,724 4,575 4,540 4,032 Weighted average spot price of electricity purchased ($/MWh) 43 94 63 64 120 Hydro generation production (GWh) 1,811 1,523 1,667 1,472 1,568 Wind generation production (GWh) 260 268 274 546 558 Weighted average spot price of electricity generated ($/MWh) 39 91 62 63 112
$M $M $M $M $M
Operating Revenue 612 677 626 681 785
EBITDAF 173 186 196 208 260 Fair Value Movements of Financial Instruments - - 2 1 20 Amortisation and Depreciation (28) (28) (28) (32) (44)Interest Paid (33) (29) (27) (40) (52)Tax Expense (39) (48) (41) (39) (59)Net Profi t After Tax 73 81 102 98 105
Shareholders’ Equity 883 896 1,217 1,257 1,430
Current and Other Assets 78 133 117 254 107 Fixed Assets 1,257 1,263 1,905 2,057 2,373 Intangible Customer Base Assets 42 39 43 40 40 Total Assets 1,377 1,435 2,065 2,351 2,520
Current and Other Liabilities 88 131 132 231 107 Deferred Tax Liability 46 48 207 207 251 Term Debt 360 360 509 656 732 Total Liabilities 494 539 848 1,094 1,090
Net Assets 883 896 1,217 1,257 1,430
Earnings Per Share (cents) 23 26 31 31 33Dividends Per Share - excluding special dividends (cents) 20 23 27 30 33Return on Average Shareholders’ Funds 8.3% 9.1% 9.7% 7.9% 7.8%

32
Conservative Risk Profi leEver since our shares were fi rst listed publicly in 1994 our shareholders have seen a consistent rise in the value of their investment. As shown in the graph below, a $1,000 investment in TrustPower shares in 1994 would, if all dividends were reinvested, now be worth $28,778.
The spot price of electricity can be very volatile with large changes seen between different times of the year and different areas of the country. The key to minimising this risk is to match our customers’ demand for electricity with generation or other sources of supply. This reduces the need to purchase electricity at spot. By establishing a long term supply of electricity from independent generators and our competitors we have been able to supply more customers and continue to provide stable, growing earnings over time.
Many of these relationships are very strong having been built over a number of years. However in order to grow in a sustainable way we are constantly looking for new partners to work with (see Top Energy story page 22).
In these troubled economic times we are proud of our reputation of providing stable growth in both earnings and dividends. We are confi dent of maintaining both of these features of our history into the future.
0
5
10
15
20
25
30
35
40
TrustPower Total Shareholder Return
Total Shareholder Return (Dividends Reinvested) (LHS)
$ P
er S
hare
Ele
ctri
city
Pri
ce $
/MW
h
Share Price (Adjusted for Share Split) (LHS)
0
10
20
30
40
50
60
70
80
1994 1995 1996 1997 1998 1999 2000 2001 2002 2003 2004 2005 2006 2007 2008 2009
Estimated Wholesale Price Path (RHS)
-2
-1
0
1
2
3
4
Annualised Gain and Gross Dividend Return
$ C
hang
e on
Prio
r Ye
ar
2005 2006 2007
Share Value Gain
Gross Dividend
20092008

TrustPower / Annual Report 2009 / 33
SustainableEconomic Performance
0
500
1,000
1,500
2,000
2,500
Composition of Non Current Assets
$M
2005 2006 2007 2008 2009Hydro Generation
Wind Generation
Other
Customer Base
EBITDAF
$M
2005 2006 2007 2008 2009June Quarter
September Quarter
December Quarter
March Quarter
0
20
40
60
80
100
Operating Revenue and EBITDAF
$M
2005 2006 2007 2008 2009EBITDAF
Operating Revenue
0
100
200
300
400
500
600
700
800
Underlying Earnings After Tax and Dividends(Excluding Special Dividends)
$M
2005 2006 2007 2008 2009Underlying Earnings After Tax
Dividend Declared
0
20
40
60
80
100
120
Overhead Costs and Customer Numbers
Electricity Customers (LHS)
Cus
tom
ers
000’
s
$ P
er E
lect
rici
ty C
usto
mer
Telecommunication Customers (LHS)
Mar 2005 Mar 2006 Mar 2007 Mar 2008 Mar 2009
Overheads Per Electricity Customer (RHS)
0
20
40
60
80
100
120
140
0
50
100
150
200
250
300
350
0
500
1,000
1,500
2,000
2,500
3,000
3,500
Total Assets and Debt Ratio
Generation Assets (LHS)
$M
Other Assets (LHS)
2005 2006 2007 2008 2009
Debt to Debt + Equity (RHS)
0%
5%
10%
15%
20%
25%
30%
35%

34
Role of the Board of DirectorsThe Directors are elected by the shareholders and are responsible to the shareholders for the performance of the Group. Their focus is to enhance the interests of shareholders and other key stakeholders and to ensure the Group is properly managed. The Board draws on relevant corporate governance best practice principles to assist and contribute to the performance of the Group.
The Board has developed a charter that outlines responsibilities that encompass the following:• Setting the strategic direction of TrustPower and
monitoring management’s implementation of that strategy.
• Selecting and appointing (and, if appropriate, removing from offi ce) the Chief Executive, determining his/her conditions of service and monitoring his/her performance against established objectives.
• Ratifying the appointment (and, if appropriate, removing from offi ce) the Chief Financial Offi cer and Company Secretary.
• Ratifying the remuneration of senior management consistent with their employment agreements.
• Monitoring fi nancial outcomes and the integrity of reporting, and, in particular, approving annual budgets and longer-term strategic and business plans.
• Setting specifi c limits of authority for management to commit to new expenditure, enter contracts or acquire businesses without prior Board approval.
• Ensuring that effective audit, risk management and compliance systems are in place to protect the Company’s assets and to minimise the possibility of the Group operating beyond legal requirements or beyond acceptable risk parameters.
• Monitoring compliance with regulatory requirements (including continuous disclosure) and setting ethical standards and then monitoring compliance with those standards.
• Reviewing, on a regular basis, senior management succession planning and development.
• Ensuring effective and timely reporting to shareholders. The Board has nine scheduled one day meetings, an
extended strategic planning meeting at least once a year, at least four Audit Committee meetings and several unscheduled meetings to consider and/or review substantial projects and any other special circumstances that may arise from time to time.
The full Board determines the board size and composition, subject to limits imposed by the Company’s Constitution which is required to comply with the NZX Listing Rules. The Constitution provides for a minimum of three Directors and a maximum of seven.
The Constitution and NZX Listing Rules also require that while there are a total of six or seven Directors, two must be independent Directors. As at 31 March 2009, the Board has determined that the independent Directors of TrustPower are RP Carter, GJC Swier, and IS Knowles and the non-independent Directors of TrustPower are MJ Cooney, BJ Harker, and HRL Morrison. None of the Directors are executive offi cers of the Company.
The Board has established two standing Subcommittees being; the Audit Committee and the Remuneration Committee.
Audit CommitteeThe Board has established a standing Audit Committee consisting of three Board members. The Committee meets at least four times a year. Members of the Committee are: GJC Swier (Chairman), BJ Harker, and RP Carter.
The role of the Audit Committee is formally recorded in a charter document approved by the Board of Directors. The primary objective of the Committee, as set out in the charter, is to assist the Board in fulfi lling its responsibilities relating to accounting and reporting practices of the Group. In particular, the Committee’s main responsibilities are to:• Review and report to the Board on the annual report,
the interim fi nancial report and all other fi nancial information published by the Group or released to the market.
• Assist the Board in reviewing the effectiveness of the organisation’s internal control environment.
• Determine the scope of the internal audit function and ensure that its resources are adequate and used effectively, including co-ordination with external auditors.
• Oversee the effective operation of the risk management framework.
• Recommend to the Board the appointment, removal and remuneration of the external auditors, and review the terms of their engagement, and the scope and quality of the audit.
• Review and approve, within established procedures, and before commencement, the nature and scope of
Corporate Governance Statement

TrustPower / Annual Report 2009 / 35
non-audit services being provided by the external auditors. These procedures include quantitative and qualitative thresholds for the review, and include all relatively signifi cant projects.In fulfi lling its responsibilities, the Audit Committee
receives regular reports from management and the internal and external auditors. It also meets with the internal and external auditors at least three times a year – more frequently if necessary. The internal and external auditors have a clear line of direct communication at any time to either the Chairperson of the Audit Committee or the Chairperson of the Board.
The Remuneration CommitteeThe Board has established a Remuneration Committee which has two Directors as members, BJ Harker and GJC Swier. The role of the Remuneration Committee is formally recorded in a charter document approved by the Board of Directors.
The primary objectives of the Remuneration Committee are to: • Help enable the Company to attract, retain and
motivate executives and Directors who will create value for shareholders.
• Fairly and reasonably reward executives having regard to the performance of the Company, the performance of the executives and the general pay environment.
• Help the Company comply with the provisions of the Employment Relations Act 2000, the Companies Act 1993, the NZX Listing Rules and any other relevant legal requirements.The responsibilities of the Committee include:
• Reviewing and recommending to the Board for approval the remuneration policy for Directors and senior executives and ensuring that the structure of the policy allows the Company to attract and retain Directors and senior executives of suffi cient calibre to facilitate the effi cient and effective management of the Company’s operations.
• Annual review and recommendation to the Board for approval of the remuneration packages of all Directors and senior executives of the Company.
• With reference to the Board, managing the employment or deployment of the Chief Executive and negotiation of employment terms.
• Participation in the process of employment of the Chief Financial Offi cer and recommendation to the Board of its confi dence in any appointment.
• Establishment of appropriate performance criteria, from time to time, for the Executive Share Option Plan and to make recommendations to the Board.
Other Sub CommitteesThe Board has established a sub committee including BJ Harker, MJ Cooney and RP Carter to oversee any transaction to be undertaken by the Company in relation to on-market share buybacks.
The Board also established a sub committee including AT Jackson and IS Knowles to oversee the business case for the design and implementation of a replacement customer care and billing system.
Review of Board PerformanceAn annual review of the performance of the Board and individual Directors is undertaken by the Chairman.
The Institute of Directors on-line survey is currently utilised as a mechanism for undertaking this review.
Compliance with NZX Corporate Governance Best Practice Code and Other GuidelinesAs a listed issuer TrustPower is required to disclose in its Annual Report whether, and to what extent, its corporate governance principles materially differ from the NZX Corporate Governance Best Practice Code.
TrustPower believes that it complies in all material respects with the Code. However, it should be noted that the TrustPower Board has chosen not to constitute a Nominations Committee as recommended by the Code. The Board has decided that Director nominations are able to be handled more effectively by the full Board.
Code of EthicsA Code of Ethics has been developed and approved by the Board. TrustPower is committed to maintaining the highest standards of honesty, integrity and ethical conduct and has adopted a Code of Ethics to deter wrongdoing and to promote:• Honest and ethical conduct, including the ethical
handling of actual or apparent confl icts of interest between personal and professional relationships.
• Full, fair, accurate, timely and understandable disclosure in reports and documents fi led by the Company and in other public communications made by the Company.
• Compliance with applicable laws, rules and regulations.• Internal reporting to the Board of Directors of
violations of this Code of Ethics.• Accountability for adherence to the Code of Ethics.
The Code of Ethics is not an exhaustive list of acceptable or non-acceptable behaviour, rather it is intended to guide decisions so they are consistent with TrustPower’s values, business goals and legal and policy obligations.
Failure to follow the Code of Ethics may lead to disciplinary action being taken, which may include dismissal. The Code of Ethics applies to the Board of Directors and the Company’s employees.
Internal ControlThe Group has adopted a system of internal control. The system is based upon written procedures, policies, guidelines and organisational structures that provide an appropriate division of responsibility, sound risk management, a programme of internal audit, and the careful selection and training of qualifi ed personnel.
While the Board acknowledges that it is responsible for the overall control framework of the Group, it recognises that no cost effective internal control system will preclude all errors and irregularities.
Risk ManagementThe Group has developed a comprehensive, enterprise-wide risk management framework. Management actively participate in the identifi cation, assessment, and monitoring of new and existing risks. Particular attention is given to market risks that could impact on the Group. Management undertake regular reporting to appraise the Audit Committee and the Board of the Company’s risks and the treatment of those risks.

36
The Audit Committee reviews and if considered satisfactory, recommends for approval by the Board annually, the Company’s insurance programme.
Wholesale Electricity Trading PolicyThe Group has adopted a Wholesale Electricity Trading Policy to manage the risk relating to the purchasing of electricity from the wholesale electricity market. Derivative instruments can be used to set the price of electricity at a future nominated time. The Wholesale Electricity Trading Policy allows wholesale electricity trading to occur within risk limits set by the Board.
Treasury PolicyThe Group has a Board approved Treasury Policy to manage fi nance, interest rate, foreign exchange and foreign investment risks. The Policy approves the use of certain instruments for risk management purposes, and it prohibits any activity that is purely speculative in nature. It also sets out exposure limits, delegated authorities and internal controls. The Policy is reviewed by management annually and independently every three years.
Delegated Authorities PolicyThe Group has a Delegated Authorities Policy in place that has been approved by the Board. The Policy provides limited authority to certain Group executives to purchase goods and services, enter into sales contracts and approve credit, sign deeds, indemnities and guarantees, and sign other contracts and documents. The Policy is reviewed annually.
Environmental PolicyThe Group recognises the importance of environmental issues and is committed to the highest levels of performance. To help meet this objective the Group has developed and is proactively implementing both environmental policies and a comprehensive environmental management system. These have been established to facilitate the systematic identifi cation of environmental issues and to ensure that they are managed in a structured manner. These measures allow the Group to:• Monitor its compliance with all relevant legislation.• Continually assess and improve the impact of its
operations on the environment.• Encourage employees to actively participate in the
management of environmental issues.• Use energy and other resources effi ciently.• Encourage the adoption of similar standards by the
Group’s principal suppliers, contractors and distributors.• Ensure procedures are in place to appropriately deal
with any adverse environmental event that may occur.
Group Information PolicyThe following is the Group’s policy regarding the disclosure of Group information:
No Director of the Group may disclose information which that Director has received in his or her capacity as a Director or employee of the Group, being information that would not otherwise be available to the Director, to(a) a person whose interests that Director represents; or(b) a person in accordance with whose directions or
instructions the Director may be required, or is accustomed to act in relation to the Director’s powers and duties,
without the prior consent of a Subcommittee of the Board established to authorise the disclosure.
Confl icts of InterestWhere any TrustPower Director has a confl ict of interest or is otherwise interested in any transaction, that Director is required to disclose his or her confl ict of interest, and thereafter neither participate in the discussion nor vote in relation to the relevant matter. The Company maintains a register of disclosed interests.
Insider TradingIn order to protect TrustPower’s reputation and safeguard employees who may want to buy or sell TrustPower securities, the Company’s Securities Trading Policy requires an approved procedure to be followed by all staff and Directors. Certain employees of the Company are required to make additional disclosures under the Securities Markets Act 1988.
Whistleblowing PolicyTrustPower has established a Whistleblowing Policy in order to facilitate the disclosure and impartial investigation of any serious wrongdoing. This policy advises employees of their right to disclose serious wrongdoing, and sets out TrustPower’s internal procedures for receiving and dealing with such disclosures. The policy is consistent with, and facilitates, the Protected Disclosures Act 2000.
Other Corporate PoliciesThe Group has a number of other policies covering but not limited to human resource activities, health and safety, buildings and security and disaster recovery planning. These policies are regularly reviewed and approved by senior management and where appropriate the Board.
Internal AuditThe Group has established an outsourced internal audit function that is responsible for monitoring the Group’s system of internal fi nancial control and the integrity of the fi nancial information reported to the Board. Internal audit operates independently from the Board and reports its fi ndings directly to the Audit Committee. Internal audit liaises closely with the external auditors, who review the internal audit work undertaken to the extent necessary to support their audit opinion.
The Role of ShareholdersThe Board aims to ensure that shareholders are informed of all major developments affecting the Group’s state of affairs. Information is communicated to shareholders in the annual, interim reports, and various announcements to NZX. Quarterly operational information is also provided following the end of each quarter. The Board encourages full participation of shareholders at the annual meeting to ensure a high level of accountability and identifi cation with the Group’s strategies and goals.

TrustPower / Annual Report 2009 / 37
The Directors are responsible for ensuring that the fi nancial statements give a true and fair view of the fi nancial position of the Company and the Group as at 31 March 2009 and their fi nancial performance and cash fl ows for the year ended on that date.
The Directors consider that the fi nancial statements of the Company and the Group have been prepared using appropriate accounting policies, consistently applied and supported by reasonable judgements and estimates and that all relevant fi nancial reporting and accounting standards have been followed.
The Directors believe that proper accounting records have been kept that enable, with reasonable accuracy, the determination of the fi nancial positions of the Company and the Group and facilitate compliance of the fi nancial statements with the Financial Reporting Act 1993.
The Directors consider they have taken adequate steps to safeguard the assets of the Company and the Group to prevent and detect fraud and other irregularities.
Directors’ResponsibilityStatement
The Directors are pleased to present the fi nancial statements of TrustPower Limited and subsidiaries for the year ended 31 March 2009.
Bruce HarkerChairman
Geoff SwierDirectorC
om
pan
y R
egis
trat
ion
Num
ber
HN
6040
40D
ated
: 15
May
200
9

Chartered Accountants Auckland
PricewaterhouseCoopers188 Quay Street Private Bag 92162 Auckland 1142, New Zealand www.pwc.com/nz Telephone +64 9 355 8000 Facsimile +64 9 355 8001
Auditors’ Report To the shareholders of TrustPower Limited
We have audited the financial statements on pages 39 to 68. The financial statements provide information about the past financial performance and cash flows of the Company and Group for the year ended 31 March 2009 and their financial position as at that date. This information is stated in accordance with the accounting policies set out on pages 43 to 47.
Directors’ Responsibilities The Company’s Directors are responsible for the preparation and presentation of the financial statements which give a true and fair view of the financial position of the Company and Group as at 31 March 2009 and their financial performance and cash flows for the year ended on that date.
Auditors’ Responsibilities We are responsible for expressing an independent opinion on the financial statements presented by the Directors and reporting our opinion to you.
Basis of Opinion An audit includes examining, on a test basis, evidence relevant to the amounts and disclosures in the financial statements. It also includes assessing:
(a) the significant estimates and judgements made by the Directors in the preparation of the financial statements; and
(b) whether the accounting policies are appropriate to the circumstances of the Company and Group, consistently applied and adequately disclosed.
We conducted our audit in accordance with generally accepted auditing standards in New Zealand. We planned and performed our audit so as to obtain all the information and explanations which we considered necessary to provide us with sufficient evidence to give reasonable assurance that the financial statements are free from material misstatements, whether caused by fraud or error. In forming our opinion we also evaluated the overall adequacy of the presentation of information in the financial statements.
We have no relationship with or interests in the Company or any of its subsidiaries other than in our capacities as auditors, tax consultants and providers of financial advisory services.
We have obtained all the information and explanations we have required.
In our opinion: (a) proper accounting records have been kept by the Company as far as appears from our examination
of those records; and (b) the financial statements on pages 39 to 68:
(i) comply with generally accepted accounting practice in New Zealand; (ii) comply with International Financial Reporting Standards; and (iii) give a true and fair view of the financial position of the Company and Group as at 31 March
2009 and their financial performance and cash flows for the year ended on that date.
Our audit was completed on 15 May 2009 and our unqualified opinion is expressed as at that date.
38

TrustPower / Annual Report 2009 / 39
Income Statements
GROUP PARENT
2009 2008 2009 2008
For the year ended 31 March 2009 Note $000 $000 $000 $000
Operating Revenue
Electricity sales 8 744,762 656,961 721,421 656,961
Carbon revenue 8,377 2,011 8,377 2,011
Meter rental revenue 4,473 3,846 4,473 3,846
Other customer fees and charges 3,518 3,394 3,519 3,381
Telecommunications sales 17,024 12,670 17,024 12,670
Other operating revenue 7,242 2,574 6,355 2,491
785,396 681,456 761,169 681,360
Operating Expenses
Energy costs 207,525 179,643 207,525 179,643
Generation production costs 30,341 27,780 27,187 27,572
Line costs 202,284 187,947 202,284 187,947
Market fees and costs 15,244 18,183 15,244 18,183
Meter rental costs 2,716 2,606 2,716 2,606
Other customer connection costs 1,613 939 1,613 939
Other fi xed and investment asset charges/(credits) 9 1,552 (408) 1,922 318
Employee benefi ts 26,263 24,554 24,592 24,554
Telecommunications cost of sales 13,143 9,246 13,143 9,246
Other operating expenses 10 24,746 22,933 38,746 35,150
525,427 473,423 534,972 486,158
Earnings Before Interest, Tax, Depreciation, Amortisation and Fair Value Movements of Financial Instruments (EBITDAF) 259,969 208,033 226,197 195,202
Fair value (gains) / losses on fi nancial instruments 5 19,567 (985) 8,682 (654)
Amortisation of intangible assets 24 5,690 5,145 5,690 5,145
Depreciation 21 38,678 27,249 14,126 13,511
Operating Profi t 196,034 176,624 197,699 177,200
Interest paid 11 53,366 41,274 46,093 45,647
Interest received 11 (999) (1,462) (4,329) (6,141)
Net fi nance costs 52,367 39,812 41,764 39,506
Profi t Before Income Tax 143,667 136,812 155,935 137,694
Income tax expense 12 38,592 38,679 47,117 41,970
Profi t After Tax Attributable to the Shareholders of the Company 105,075 98,133 108,818 95,724
Basic earnings per share (cents per share) 7 33.3 31.1 34.5 30.4
Diluted earnings per share (cents per share) 7 33.2 31.1 34.4 30.3
Supplementary DisclosureUnderlying earnings after tax is presented to allow stakeholders to make an assessment and comparison of underlying earnings after removing the non-cash fair value movements of fi nancial instruments.
Underlying Earnings After Tax 3 118,772 92,636 114,895 92,213
Underlying earnings per share (cents per share) 7 37.7 29.4 36.4 29.3
The accompanying notes form part of these fi nancial statements

40
Statements of Recognised Income and Expense
GROUP PARENT
2009 2008 2009 2008
For the year ended 31 March 2009 Note $000 $000 $000 $000
Fair value gains/(losses) [net of tax]:
- Generation assets 15 204,085 - 109,200 -
- Movements in cash fl ow hedge reserve (including electricity price derivatives) 17 (11,427) 17,434 (15,554) 18,685
Effect of change in corporate tax rate on:
- Revaluation reserve 15 - 14,169 - 13,509
- Cash fl ow hedge reserve 17 - (206) - (206)
Currency translation differences 18 5,519 595 - -
Movements in employee share option reserve 18 65 (21) 65 (21)
Net Income Recognised Directly in Equity 198,242 31,971 93,711 31,967
Profi t for the Year 105,075 98,133 108,818 95,724
Total Recognised Income for the Year Attributable to the Shareholders 303,317 130,104 202,529 127,691
The accompanying notes form part of these fi nancial statements

TrustPower / Annual Report 2009 / 41
Balance Sheets
GROUP PARENT
2009 2008 2009 2008
As at 31 March 2009 Note $000 $000 $000 $000
Equity
Capital and reserves attributable to shareholders of the Company
Share capital 14 174,754 176,055 174,754 176,055
Revaluation reserve 15 862,370 658,575 695,110 586,200
Retained earnings 16 387,666 411,574 353,555 373,720
Cash fl ow hedge reserve 17 (1,158) 10,269 (1,158) 14,396
Other reserves 18 6,437 853 323 258
Total Equity 1,430,069 1,257,326 1,222,584 1,150,629
Represented by:
Current Assets
Cash at bank 19 27,416 115,198 4,467 6,138
Bond deposits on trust 2,700 2,700 2,700 2,700
Accounts receivable and prepayments 20 73,750 99,143 68,861 98,175
Derivative fi nancial instruments 5 2,738 3,905 2,738 3,905
Taxation receivable - 7,279 - 6,722
106,604 228,225 78,766 117,640
Non Current Assets
Term receivable 4,039 1,719 4,039 1,719
Property, plant and equipment 21 2,372,896 2,056,974 1,546,467 1,424,722
Derivative fi nancial instruments 5 3,542 21,236 3,542 20,905
Investments in subsidiaries 23 - - 368,014 381,712
Other investments 521 518 - -
Intangible assets 24 39,516 40,266 39,516 40,266
Deferred tax asset 28 - 1,819 - -
2,420,514 2,122,532 1,961,578 1,869,324
Total Assets 2,527,118 2,350,757 2,040,344 1,986,964
Current Liabilities
Accounts payable and accruals 25 84,695 222,061 77,654 110,118
Unsecured subordinated bonds 27 - 50,511 - 50,511
Derivative fi nancial instruments 5 3,501 8,207 3,501 2,311
Taxation payable 3,220 - 1,422 -
91,416 280,779 82,577 162,940
Non Current Liabilities
Unsecured bank loans 26 471,473 443,888 284,973 336,971
Unsecured subordinated bonds 27 260,671 161,528 260,671 161,528
Derivative fi nancial instruments 5 22,352 582 11,798 582
Deferred tax liability 28 251,137 206,654 177,741 174,314
1,005,633 812,652 735,183 673,395
Total Liabilities 1,097,049 1,093,431 817,760 836,335
Net Assets 1,430,069 1,257,326 1,222,584 1,150,629
Net Tangible Assets Per Share $4.41 $3.86 $3.75 $3.52
The accompanying notes form part of these fi nancial statements

42
Cash Flow Statements
GROUP PARENT
2009 2008 2009 2008
For the year ended 31 March 2009 Note $000 $000 $000 $000
Cash Flows from Operating Activities
Cash was provided from:
Receipts from customers 808,204 643,869 788,166 644,732
808,204 643,869 788,166 644,732
Cash was applied to:
Payments to suppliers and employees 563,400 445,963 549,448 445,733
Taxation paid 30,587 36,859 30,466 36,845
593,987 482,822 579,914 482,578
Net Cash Flow from Operating Activities 29 214,217 161,047 208,252 162,154
Cash Flows from Investing Activities
Cash was provided from:
Sale of property, plant and equipment 494 2,967 418 2,109
Return of bond deposits on trust - 400 - 400
Return of electricity market security deposits 55,400 15,800 55,400 15,800
Interest received 1,393 1,462 4,328 6,141
57,287 20,629 60,146 24,450
Cash was applied to:
Advances to subsidiaries - - 13,990 86,264
Interest capitalised in construction of property, plant and equipment 3,556 6,851 371 1,132
Lodgement of electricity market security deposits 55,400 12,800 55,400 12,800
Purchase of property, plant and equipment 191,562 105,236 15,650 25,907
Purchase of intangible assets 4,941 2,860 4,941 2,860
255,459 127,747 90,352 128,963
Net Cash used in Investing Activities (198,172) (107,118) (30,206) (104,513)
Cash Flows from Financing Activities
Cash was provided from:
Bank loan proceeds 319,355 282,010 245,861 175,092
Bond issue proceeds 100,000 - 100,000 -
Issue of shares 333 1,397 333 1,397
419,688 283,407 346,194 176,489
Cash was applied to:
Bond brokerage costs 1,317 - 1,317 -
Purchase of own shares 1,634 - 1,634 -
Repayment of bonds 50,511 86,182 50,511 86,182
Repayment of bank loans 298,357 50,235 298,357 50,235
Interest paid 53,748 38,538 44,819 44,139
Dividends paid 129,273 91,439 129,273 91,439
534,840 266,394 525,911 271,995
Net Cash Flow from/(used in) Financing Activities (115,152) 17,013 (179,717) (95,506)
Net Increase/(Decrease) in Cash, Cash Equivalents and Bank Overdrafts (99,107) 70,942 (1,671) (37,865)
Cash, cash equivalents and bank overdrafts at beginning of the year 115,198 44,256 6,138 44,003
Exchange gains/(losses) on cash, cash equivalents and bank overdrafts 11,325 - - -
Cash, Cash Equivalents and Bank Overdrafts at End of the Year 27,416 115,198 4,467 6,138
The accompanying notes form part of these fi nancial statements

TrustPower / Annual Report 2009 / 43
Note 1: General Information
Reporting Entity
The principal activities of TrustPower Limited (the Company or Parent) and its subsidiaries (together the Group) are the development, ownership and operation of electricity generation facilities from renewable energy sources and the retail sale of electricity and telecommunications services to its customers. All signifi cant operations take place within New Zealand and Australia.
The Company is a limited liability company incorporated and domiciled in New Zealand. The address of its registered offi ce is Truman Lane, Te Maunga, Mount Maunganui. The Company is listed on the New Zealand Stock Exchange.
These fi nancial statements relate to the year ended 31 March 2009 and have been approved for issue by the Board of Directors on 15 May 2009.
Note 2: Statement of Accounting Policies
The principal accounting policies adopted in the preparation of these audited fi nancial statements are set out below. These policies have been consistently applied to all the periods presented, unless otherwise stated.
2.1 Basis of Preparation
These audited fi nancial statements have been prepared in accordance with New Zealand Generally Accepted Accounting Practice (NZGAAP). They comply with New Zealand equivalents to International Financial Reporting Standards (NZ IFRS), International Financial Reporting Standards (IFRS) and other applicable New Zealand Financial Reporting Standards, as appropriate for profi t-oriented entities.
Entities Reporting
The consolidated fi nancial statements of the Group are for the economic entity comprising TrustPower Limited and its subsidiaries. The consolidated entity is designated as a profi t-oriented entity for fi nancial reporting purposes.
Statutory Base
TrustPower Limited is registered under the Companies Act 1993 and is an issuer in terms of the Securities Act 1978. The fi nancial statements have been prepared in accordance with the requirements of the Financial Reporting Act 1993 and the Companies Act 1993.
Historical Cost Convention
These fi nancial statements have been prepared under the historical cost convention, as modifi ed by the revaluation of generation assets and derivative fi nancial instruments which are stated at fair value.
Estimates
The preparation of fi nancial statements in conformity with NZ IFRS requires the Group to make judgements, estimates and assumptions that affect the application of policies and reported amounts of assets and liabilities, income and expenses. The areas involving a higher degree of judgment or complexity, or areas where assumptions and estimates are signifi cant to the fi nancial statements are disclosed in note 6.
Functional and Presentation Currency
The functional and presentation currency used in the preparation of these fi nancial statements is New Zealand dollars, rounded to the nearest thousand.
2.2 Principles of Consolidation
Subsidiaries
Subsidiaries are all entities over which the Group has the power to govern the fi nancial and operating policies generally accompanying a shareholding of more than one half of the voting rights. Subsidiaries are fully consolidated from the date on which control is transferred to the Group and they are no longer consolidated from the date that control ceases.
The purchase method of accounting is used to account for the acquisition of subsidiaries by the Group. The cost of an acquisition is measured as the fair values of the assets given, equity instruments issued and liabilities incurred or assumed at the date of exchange, plus costs directly attributable to the acquisition. Identifi able assets acquired and liabilities and contingent liabilities assumed in a business combination are measured initially at their fair values at the acquisition date, irrespective of the extent of any minority interest. The excess of the cost of the acquisition over the fair value of the Group’s share of the identifi able net assets acquired is recorded as goodwill. If the cost of the acquisition is less than the fair value of the net assets of the subsidiary acquired, the difference is recognised directly in the income statement.
Inter-company transactions, balances and unrealised gains on transactions between Group companies are eliminated. Unrealised losses are also eliminated but are considered as an impairment indicator of the assets transferred. Accounting policies of subsidiaries have been changed where necessary to ensure consistency with the policies adopted by the Group.
2.3 Segment Reporting
A business segment is a group of assets and operations engaged in providing products or services that are subject to risks and returns that are different from those of other business segments. A geographical segment is engaged in providing products or services within a particular economic environment that are subject to risks and returns that are different from those of segments operating in other economic environments.
2.4 Trade Receivables
Trade receivables are initially recognised at fair value and subsequently measured at amortised cost using the effective interest method, less provision for impairment. A provision for impairment of receivables is established when there is objective evidence that the Group will not be able to collect all amounts due according to the original terms of the receivables. The amount of the provision is the difference between the assets carrying amount and the present value of estimated future cash fl ows, discounted at the original effective interest rate. The amount of the impairment loss is recognised in the income statement.
44
2.5 Financial Assets
The Group classifi es all of its investments as fi nancial assets at fair value through the income statement, held to maturity fi nancial assets or loans and receivables. The classifi cation depends on the purpose for which the investments were acquired. Management determines the classifi cation of its investments at initial recognition.
Financial Assets at Fair Value through the Income Statement
Financial assets at fair value through the income statement are fi nancial assets held for trading. A fi nancial asset is classifi ed in this category if it is acquired principally for the purpose of selling in the short term. Derivatives are classifi ed as held for trading unless they are designated as hedges. Assets in this category are classifi ed as non-current assets where the remaining maturity of the asset is greater than 12 months; they are classifi ed as current assets when the remaining maturity of the asset is less than 12 months.
Held to Maturity Financial Assets
Held to maturity fi nancial assets are stated at amortised cost less impairment losses.
Loans and Receivables
Loans and receivables are non-derivative fi nancial assets with fi xed or determinable payments that are not quoted in an active market. They are included in current assets, except for maturities greater than 12 months after the balance sheet date. These are classifi ed as non-current assets. Advances to New Zealand based subsidiaries are interest free while advances to overseas based subsidiaries incur interest at a market rate.
Regular purchases and sales of fi nancial assets are recognised on the trade-date – the date on which the Group commits to purchase or sell the asset. Investments are initially recognised at fair value plus transaction costs for all fi nancial assets not carried at fair value through profi t or loss. Financial assets carried at fair value through profi t or loss are initially recognised at fair value, and transaction costs are expensed in the income statement. Financial assets are derecognised when the rights to receive cash fl ows from the investments have expired or have been transferred and the Group has transferred substantially all risks and rewards of ownership. Available-for-sale fi nancial assets and fi nancial assets at fair value through profi t or loss are subsequently carried at fair value. Loans and receivables are carried at amortised cost using the effective interest method.
Gains or losses arising from changes in the fair value of the ‘fi nancial assets at fair value through profi t or loss’ category are presented in the income statement within fair value movements of fi nancial instruments, in the period in which they arise. Dividend income from fi nancial assets at fair value through profi t or loss is recognised in the income statement as part of other income when the Group’s right to receive payments is established.
Interest on available-for-sale securities calculated using the effective interest method is recognised in the income statement as part of other income. Dividends on available-for-sale equity instruments are recognised in the income statement as part of other income when the Group’s right to receive payments is established.
The fair values of quoted investments are based on current bid prices. If the market for a fi nancial asset is not active (and for unlisted securities), the Group establishes fair value by using valuation techniques. These include the use of recent arm’s length transactions, reference to other instruments that are substantially the same, discounted cash fl ow analysis and option pricing models, making maximum use of market inputs and relying as little as possible on entity-specifi c inputs.
The Group assesses at each balance sheet date whether there is objective evidence that a fi nancial asset or a group of fi nancial assets is impaired. In the case of equity securities classifi ed as available-for-sale, a signifi cant or prolonged decline in the fair value of the security below its cost is considered as an indicator that the securities are impaired. If any such evidence exists for available-for-sale fi nancial assets, the cumulative loss (measured as the difference between the acquisition cost and the current fair value, less any impairment loss on that fi nancial asset previously recognised in profi t or loss) is removed from equity and recognised in the income statement. Impairment losses recognised in the income statement on equity instruments are not reversed through the income statement. Impairment testing of trade receivables is described in note 2.4.
2.6 Property, Plant and Equipment
Generation assets are shown at fair value, based on at least three-yearly valuations by independent external valuers, less subsequent depreciation. This valuation is reviewed annually and if it is considered that there has been a material change then a new independent valuation is undertaken. Any accumulated depreciation at the date of the revaluation is eliminated against the gross carrying amount of the asset, and the net amount is restated to the revalued amount of the asset. All other property is stated at historical cost less depreciation. Historical cost includes expenditure that is directly attributable to the acquisition of the items. Cost may also include transfers from equity of any gains/losses on qualifying cash fl ow hedges of foreign currency purchases of property, plant and equipment.
The cost of assets constructed by the Group, including capital work in progress, includes the cost of all materials used in construction, direct labour specifi cally associated, resource management consent costs, and an appropriate proportion of variable and fi xed overheads. Financing costs on uncompleted capital work in progress are capitalised at the specifi c project fi nance interest rate, where these meet certain time and monetary materiality limits. Costs cease to be capitalised as soon as the asset is ready for productive use and do not include any ineffi ciency costs.
Subsequent costs are included in the asset’s carrying amount or recognised as a separate asset only when it is probable that future economic benefi ts will fl ow to the Group and the cost of the item can be measured reliably. The carrying amount of any replaced item is derecognised. All other repairs and maintenance are charged to the income statement during the fi nancial period in which they are incurred.
Increases in the carrying amount arising on revaluation of generation assets are credited to the revaluation reserve in shareholders’ equity. Decreases that offset previous increases of the same asset are charged against the revaluation reserve directly in equity. All other decreases are charged to the income statement.
Land is not depreciated. Depreciation on all other property, plant and equipment is calculated using the straight-line method at rates calculated to allocate each asset’s cost over its estimated useful life. Depreciation is charged on a straight line basis as follows:
Freehold buildings 2% Generation assets 0.5-8%Metering equipment 5% Plant and equipment 10-33%
The assets’ residual values and useful lives are reviewed, and adjusted if appropriate, at each balance date.
An asset’s carrying amount is written down immediately to its recoverable amount if the asset’s carrying amount is greater than its estimated recoverable amount.
Gains and losses on disposals are determined by comparing the proceeds with the carrying amount and are recognised within other fi xed and investment asset charges/(credits), in the income statement. When revalued assets are sold, the amounts included in the revaluation reserve are transferred to retained earnings.

TrustPower / Annual Report 2009 / 45
2.7 Investment in Subsidiaries
Investments in and advances to subsidiaries are recorded at cost less any impairment writedowns.
2.8 Emission Rights
The Group receives tradable emission rights from specifi c energy production levels of certain renewable generation facilities. The future revenue arising from the sale of these emission rights is a key matter in deciding whether to proceed with construction of the generation facility and is considered to be part of the value of the generation assets recorded in the balance sheet. Proceeds received on the sale of emission rights are recorded as deferred income in the balance sheet until the committed energy production level pertaining to the emission right sold has been generated.
Emission rights produced are recognised in the balance sheet if the right has been verifi ed, it is probable that expected future economic benefi ts will fl ow to the Group, and the rights can be measured reliably. Emission rights are initially measured at cost. After initial recognition, the emission rights are carried at fair value with any changes taken to the income statement. Fair value is determined by reference to an active market. If the emission rights cannot be valued because there is no active market, the emission rights are carried at cost less any subsequent accumulated impairment losses.
2.9 Intangible Assets
Customer Base Assets
Costs incurred in acquiring customers from other electricity supply companies and telecommunications companies are recorded as a customer base intangible asset. The customer bases are amortised on a straight line basis over the period of expected benefi t. This period has been assessed as 20 years for electricity customer bases and 5 years for telecommunication customer bases. The carrying value of the customer bases is reviewed annually by the Directors and adjusted where it is considered necessary.
Computer Software
Acquired computer software licences are capitalised on the basis of the costs incurred to acquire and bring to use the specifi c software. These costs are amortised over three years on a straight line basis except for major pieces of billing system software which are amortised over no more than seven years on a straight line basis.
Costs associated with developing or maintaining computer programmes are recognised as an expense as incurred. Costs that are directly associated with the development of identifi able and unique software products controlled by the Group, and that will probably generate economic benefi ts exceeding costs for more than one year, are recognised as intangible assets. Costs include the employee costs incurred as a result of developing software and an appropriate portion of relevant overheads. Computer software development costs recognised as assets are amortised over their estimated useful lives (not exceeding three years).
2.10 Revenue Recognition
Revenue comprises the fair value of consideration received or receivable for the sale of electricity, telecommunications and related services in the ordinary course of the Group’s activities. Revenue is shown net of goods and services tax, rebates and discounts and after eliminating sales within the Group.
Customer consumption of electricity is measured and billed by calendar month for half hourly metered customers and in line with meter reading schedules for non-half hourly metered customers. Accordingly revenues from electricity sales include an estimated accrual for units sold but not billed at balance date for non-half hourly metered customers.
Customer consumption of telecommunications services is measured and billed according to monthly billing cycles. Accordingly revenues from telecommunications services provided include an estimated accrual for services provided but not billed at balance date.
Interest income is recognised on a time-proportion basis using the effective interest method.
Dividend income is recognised when the right to receive payment is established.
2.11 Employee Entitlements
Employee entitlements to salaries and wages, non monetary benefi ts, annual leave and other benefi ts are recognised when they accrue to employees. This includes the estimated liability for salaries and wages, annual leave and sick leave as a result of services rendered by employees up to balance date.
Share-based Compensation
The Group operates an equity-settled, share-based compensation plan. The fair value of the employee services received in exchange for the granting of the options is recognised as an expense. The total amount to be expensed over the vesting period is determined by reference to the fair value of the options granted, excluding the impact of any non-market vesting conditions (for example, profi tability and sales growth targets). Non-market vesting conditions are included in assumptions about the number of options that are expected to vest. At each balance sheet date, the entity revises its estimates of the number of options that are expected to vest. It recognises the impact of the revision to original estimates, if any, in the income statement, with a corresponding adjustment to equity.
The proceeds received net of any directly attributable transaction costs are credited to share capital when the options are exercised.
Bonus Plans
The Group recognises a liability and an expense for bonuses, based on a formula that takes into consideration the profi t attributable to the Company’s shareholders after certain adjustments. The Group recognises a provision where contractually obliged or where there is a past practice that has created a constructive obligation.
Termination Benefi ts
Termination benefi ts are payable when employment is terminated by the Group before the normal retirement date, or whenever an employee accepts voluntary redundancy in exchange for these benefi ts. The Group recognises termination benefi ts when it is demonstrably committed to either: terminating the employment of current employees according to a detailed formal plan without possibility of withdrawal; or providing termination benefi ts as a result of an offer made to encourage voluntary redundancy. Benefi ts falling due more than 12 months after the balance sheet date are discounted to their present value.

46
2.12 Foreign Currencies
Items included in the fi nancial statements of each of the Group’s entities are measured using the currency of the primary economic environment in which the entity operates (the functional currency). These fi nancial statements are presented in New Zealand dollars, which is the Parent’s functional and presentation currency.
Transactions denominated in a foreign currency are converted to New Zealand dollars at the exchange rate on the date of the transaction. Monetary assets and liabilities arising from foreign currency transactions are translated at closing rates at balance date. Gains or losses from currency translation on these items are included in the income statement.
The results and fi nancial position of all the group entities (none of which has the currency of a hyperinfl ationary economy) that have a functional currency different from the presentation currency are translated into the presentation currency as follows:
• assets and liabilities for each balance sheet presented are translated at the closing rate at balance date• income and expenses for each income statement are translated at average exchange rates• all resulting exchange rate differences are recognised as a separate component of equity.
On consolidation, foreign exchange differences arising from the translation of the net investment in foreign operations, and of borrowings and other currency instruments designated as hedges of such investments, are taken to the foreign currency translation reserve. When a foreign operation is partially disposed of or sold, such foreign exchange differences are recognised in the income statement as part of the gain or loss on sale.
2.13 Generation Development
The Group incurs costs in the exploration, evaluation, consenting and construction of generation assets. Costs incurred are expensed in the income statement unless such costs are highly likely to be recouped through successful development of, and generation of electricity from, a particular project. Where costs meet this criteria and are capitalised they will ultimately be amortised over the estimated useful life of a project once it is completed. The Directors review the status of capitalised development expenditure on a regular basis and in the event that a project is abandoned, or if the Directors consider the expenditure to be impaired, a write off or provision is made in the year in which that assessment is made.
2.14 Borrowings
Borrowings are recognised initially at fair value, net of transaction costs incurred. Borrowings are subsequently stated at amortised cost; any difference between the proceeds (net of transaction costs) and the redemption value is recognised in the income statement over the term of the borrowings using the effective interest method.
Borrowings are classifi ed as current liabilities unless the Group has an unconditional right to defer settlement of the liability for at least 12 months after the balance sheet date.
2.15 Insurance
The Group has property, plant and equipment which is predominately concentrated at power station locations that has the potential to sustain major losses through damage to plant with resultant consequential costs.
To minimise the fi nancial impact of such exposures, the major portion of the risk is insured by taking out appropriate insurance policies with appropriate counterparties. Any uninsured loss is recognised in the income statement at the time the loss is incurred.
2.16 Impairment of Non-fi nancial Assets
Assets that have an indefi nite useful life, for example land, are not subject to amortisation and are tested annually for impairment. Assets that are subject to amortisation are reviewed for impairment whenever events or changes in circumstances indicate that the carrying amount may not be recoverable. An impairment loss is recognised for the amount by which the asset’s carrying amount exceeds its recoverable amount. The recoverable amount is the higher of an asset’s fair value less costs to sell and value in use. For the purposes of assessing impairment, assets are grouped at the lowest levels for which there are separately identifi able cash fl ows (cash-generating units). Assets other than goodwill that suffer an impairment are reviewed for possible reversal of the impairment at each balance date.
2.17 Cash and Cash Equivalents
Cash and cash equivalents include cash on hand, deposits held at call with banks, other short-term highly liquid investments with original maturities of three months or less, and bank overdrafts. Bank overdrafts are shown within borrowings in current liabilities in the balance sheet.
2.18 Cash Flow Statement
The following are the defi nitions used in the cash fl ow statement:• cash is considered to be cash on hand and deposits held at call with banks, net of bank overdrafts• operating activities include all activities that are not investing or fi nancing activities• investing activities are those activities relating to the acquisition, holding and disposal of fi xed assets and investments• fi nancing activities are those activities, which result in changes in the size and composition of the capital structure of the Group. This includes
both equity and debt not falling within the defi nition of cash. Dividends paid in relation to the capital structure are included in fi nancing activities.
2.19 Goods and Services Tax (GST)
The income statement and cash fl ow statement have been prepared so that all components are stated exclusive of GST. All items in the balance sheet are stated exclusive of GST, with the exception of billed receivables and payables which include GST invoiced.
2.20 Income Tax
The income tax expense comprises both current and deferred tax. Income tax is recognised in the income statement except to the extent that it relates to items recognised directly in equity, in which case the income tax is recognised directly in equity.
Deferred income tax is provided in full, using the liability method, on temporary differences arising between the tax bases of assets and liabilities and their carrying amounts in the fi nancial statements. The following temporary differences are not provided for: the initial recognition of assets or liabilities in a transaction other than a business combination that at the time of transaction affects neither accounting nor taxable profi t, and differences relating to investments in subsidiaries to the extent that they will probably not reverse in the foreseeable future. Deferred tax is determined using tax rates (and laws) that have been enacted or substantially enacted by balance date and are expected to apply when the related deferred tax liability (asset) is settled (realised).
Deferred tax assets are recognised to the extent that it is probable that future taxable profi t will be available against which the temporary differences can be utilised.

TrustPower / Annual Report 2009 / 47
2.21 Derivative Financial Instruments and Hedging Activities
Derivatives are initially recognised at fair value on the date a derivative contract is entered into and are periodically remeasured at their fair value. The method of recognising the resulting gain or loss depends on whether the derivative is designated as a hedging instrument, and if so, the nature of the item being hedged. The Group designates certain derivatives as one of the following:
• hedges of the fair value of recognised assets or liabilities or a fi rm commitment (fair value hedge)• hedges of highly probable forecast transactions (cash fl ow hedges)• hedges of net investments in foreign operations.
The Group documents, at the inception of the transaction, the relationship between hedging instruments and hedged items, as well as its risk management objectives and strategy for undertaking various hedging transactions. The Group also documents its assessment, both at hedge inception and on an ongoing basis, of whether the derivatives that are used in hedging transactions are highly effective in offsetting changes in fair values or cash fl ows of hedged items. The fair values of various derivative instruments used for hedging purposes are disclosed in note 5. Movements on the hedging reserve in shareholders’ equity are shown in the statement of recognised income and expense. The full fair value of a derivative is classifi ed as a non-current asset or liability when the remaining maturity of the derivative is more than 12 months; it is classifi ed as a current asset or liability when the remaining maturity of the derivative is less than 12 months.
Fair Value Hedges
Changes in the fair value of derivatives that are designated and qualify as fair value hedges are recorded in the income statement, together with any changes in the fair value of the hedged asset or liability that are attributable to the hedged risk.
Cash Flow Hedges
The effective portion of changes in the fair value of derivatives that are designated and qualify as cash fl ow hedges are recognised in shareholders’ equity. The gain or loss relating to the ineffective portion is recognised immediately in the income statement.
Amounts accumulated in equity are recycled in the income statement in the periods when the hedged item affects profi t or loss. However, when the forecast transaction that is hedged results in the recognition of a non-fi nancial asset, the gains and losses previously deferred in shareholders’ equity are transferred from shareholders’ equity and included in the measurement of the cost of the asset.
When a hedging instrument expires or is sold, or when a hedge no longer meets the criteria for hedge accounting, any cumulative gain or loss existing in shareholders’ equity at that time remains in shareholders’ equity and is recognised in accordance with the above policy when the transaction occurs. When a forecast transaction is no longer expected to occur, the cumulative gain or loss that was reported in shareholders’ equity is immediately transferred to the income statement.
Net Investment Hedge
Hedges of net investments in foreign operations are accounted for similarly to cash fl ow hedges. Any gain or loss on the hedging instrument relating to the effective portion of the hedge is recognised in shareholders’ equity. The gain or loss relating to the ineffective portion is recognised immediately in the income statement.
Derivatives that do not Qualify for Hedge Accounting
Certain derivatives do not qualify for hedge accounting. Changes in the fair value of these derivative instruments that do not qualify for hedge accounting are recognised immediately in the income statement.
2.22 Share Capital
Ordinary shares are classifi ed as equity. Incremental costs directly attributable to the issue of new shares or options are shown in equity as a deduction, net of tax, from the proceeds.
Where the Company purchases the Company’s equity share capital (treasury stock), the consideration paid is deducted from equity attributable to the Company’s equity holders until the shares are cancelled or reissued. Where such shares are subsequently reissued, any consideration received is included in equity attributable to the Company’s equity holders.
2.23 Trade Payables
Trade payables are recognised initially at fair value and subsequently measured at amortised cost using the effective interest method.
2.24 Leases
Leases in which a signifi cant portion of the risks and rewards of ownership are retained by the lessor are classifi ed as operating leases. Payments made under operating leases (net of any incentives received from the lessor) are charged to the income statement on a straight-line basis over the period of the lease.
2.25 Dividend Distribution
Dividend distribution to the Company’s shareholders is recognised as a liability in the Group’s fi nancial statements in the period in which the dividends are approved by the Board.
2.26 Comparative Information
Where necessary certain comparative information has been reclassifi ed in order to provide a more appropriate basis for comparison.
2.27 Adoption Status of Relevant New Financial Reporting Standards and Interpretations
The Group has elected not to early adopt the following applicable standards which have been issued but are not yet effective:
• NZ IAS 1 (Amendment) Presentation of Financial Statements - effective from 1 January 2009. The amendment requires a number of changes to the presentation and disclosures in fi nancial statements;
• NZ IAS 23 (Amendment) Borrowing Costs - effective from 1 January 2009. The amendment requires an entity to capitalise borrowing costs directly attributable to the acquisition, construction or production of a qualifying asset as a part of that asset. The option of immediately expensing those borrowing costs will be removed;
• NZ IFRS 2 (Amendment) Share Based Payments - effective 1 January 2009. The amendment sets out the treatment of non-vesting conditions. It also clarifi es the accounting treatment on cancellation for both equity and cash settled schemes;
• NZ IFRS 3 (Revised) Business Combinations - effective from 1 July 2009. The amendment includes a number of updates including the requirement that all costs relating to a business combination must be expensed and subsequent remeasurement of the business combination must be accounted for through the income statement; and
• NZ IFRS 8 Operating Segments - effective from 1 January 2009. NZ IFRS 8 replaces NZ IAS 14. The new standard requires a ‘management approach’, under which segment information is presented on the same basis as that used for internal reporting.
While the adoption of these standards is not expected to have a material impact on the Group’s fi nancial statements from a measurements perspective, the adoption of NZ IFRS 8 and the amended NZ IAS 1 is expected to result in changes to the presentation of the fi nancial statements.

48
Note 3: GROUP PARENT
Underlying Earnings After Tax 2009 2008 2009 2008
$000 $000 $000 $000
Profi t After Tax Attributable to the Shareholders of the Company 105,075 98,133 108,818 95,724
Fair value (gains) / losses on fi nancial instruments 5 19,567 (985) 8,682 (654)
Adjustments before income tax 19,567 (985) 8,682 (654)
Change in income tax expense in relation to adjustments (5,870) 325 (2,605) 216
Change in corporate tax rate 12 - (4,837) - (3,073)
Adjustments after income tax 13,697 (5,497) 6,077 (3,511)
Underlying Earnings After Tax 118,772 92,636 114,895 92,213
Note 4: Segment Information
Primary Reporting Format - Business Segments
As at 31 March 2009, the Group is organised into two main business segments:
• development, ownership and operation of electricity generation facilities from renewable energy sources (“Generation”)• retail sale of electricity and telecommunications services to customers (“Retail”)
As the Generation segment derives substantially all of its revenue from internal transfers, it is not a separable reporting segment. Therefore, in accordance with the requirements of NZ IAS 14 Segment Reporting, there is only one reportable segment being Retail.
Secondary Reporting Format - Geographical Segments
The Group’s two business segments operate in New Zealand and Australia. The revenue, assets and capital expenditure of the Group are split between the two segments below:
GROUP
2009 2008
$000 $000
Sales
New Zealand 761,205 681,373
Australia 24,191 83
785,396 681,456
GROUP
2009 2008
$000 $000
Assets
New Zealand 2,176,667 2,063,229
Australia 350,451 287,528
2,527,118 2,350,757
GROUP
2009 2008
$000 $000
Capital Expenditure
New Zealand 24,674 40,990
Australia 62,313 141,624
86,987 182,614

TrustPower / Annual Report 2009 / 49
Note 5: Financial Risk Management
Financial Risk Management Objectives
TrustPower’s activities expose it to a variety of fi nancial risks: electricity price risk, interest rate risk, exchange rate risk, liquidity risk and credit risk. The Group’s overall risk management programme focuses on the unpredictability of fi nancial markets and seeks to minimise potential adverse effects on the Group’s fi nancial performance. The Group uses derivative fi nancial instruments to hedge certain risk exposures. Risk management is carried out under policies approved by the Board.
Fair Value of Derivative Instruments GROUP PARENT
2009 2008 2009 2008
$000 $000 $000 $000
Current
Interest rate derivative assets - 174 - 174
Electricity price derivative assets 2,738 3,731 2,738 3,731
2,738 3,905 2,738 3,905
Interest rate derivative liabilities 1,683 - 1,683 -
Electricity price derivative liabilities 1,456 2,311 1,456 2,311
Exchange rate derivative liabilities 362 5,896 362 -
3,501 8,207 3,501 2,311
Non-current
Interest rate derivative assets 3,156 2,055 3,156 1,724
Electricity price derivative assets 386 19,181 386 19,181
3,542 21,236 3,542 20,905
Interest rate derivative liabilities 18,416 494 7,862 494
Electricity price derivative liabilities 1,848 88 1,848 88
Exchange rate derivative liabilities 2,088 - 2,088 -
22,352 582 11,798 582
The changes in the fair value of fi nancial instruments recognised in the income statement and the cash fl ow hedge reserve for the year to 31 March 2009 are summarised below:
Recognised in the income statement GROUP PARENT
2009 2008 2009 2008
$000 $000 $000 $000
Interest rate derivatives (21,446) (40) (10,561) (371)
Electricity price derivatives 1,879 1,025 1,879 1,025
(19,567) 985 (8,682) 654
Recognised in the cash fl ow hedge reserve GROUP PARENT
2009 2008 2009 2008
$000 $000 $000 $000
Interest rate derivatives 2,768 - 2,768 -
Electricity price derivatives (22,570) 26,707 (22,570) 26,707
Exchange rate derivatives 3,445 (3,034) (2,451) (14)
(16,357) 23,673 (22,253) 26,693

50
Financial Instruments by Category
GROUP Loans and
receivables$000
Assets at fair value through
profit and loss$000
Derivatives used for hedging
$000
31 March 2009
Assets per the balance sheet
Derivative fi nancial instruments - 3,438 2,842
Trade and other receivables excluding prepayments 72,208 - -
Cash and cash equivalents 27,416 - -
Bond deposits on trust 2,700 - -
Term receivables 4,039 - -
Other investments 521 - -
31 March 2008
Assets per the balance sheet
Derivative fi nancial instruments - 5,054 20,087
Trade and other receivables excluding prepayments 97,806 - -
Cash and cash equivalents 115,198 - -
Bond deposits on trust 2,700 - -
Term receivables 1,719 - -
Other investments 518 - -
Liabilities at fair value through
profit and loss$000
Derivatives used for hedging
$000
Other financial liabilities at
amortised cost$000
31 March 2009
Liabilities per the balance sheet
Unsecured bank loans including bank overdrafts - - 471,473
Unsecured subordinated bonds - - 260,671
Derivative fi nancial instruments 21,357 4,496 -
Trade and other payables - - 84,695
31 March 2008
Liabilities per the balance sheet
Unsecured bank loans including bank overdrafts - - 443,888
Unsecured subordinated bonds - - 212,039
Derivative fi nancial instruments 2,893 5,896 -
Trade and other payables - - 222,061
PARENT Loans and
receivables$000
Assets at fair value through
profit and loss$000
Derivatives used for hedging
$000
31 March 2009
Assets per the balance sheet
Derivative fi nancial instruments - 3,438 2,842
Trade and other receivables excluding prepayments 67,368 - -
Cash and cash equivalents 4,467 - -
Bond deposits on trust 2,700 - -
Term receivables 4,039 - -
Other investments - - -
Note 5 continued

TrustPower / Annual Report 2009 / 51
PARENT Loans and
receivables$000
Assets at fair value through
profit and loss$000
Derivatives used for hedging
$000
31 March 2008
Assets per the balance sheet
Derivative fi nancial instruments - 4,723 20,087
Trade and other receivables excluding prepayments 96,886 - -
Cash and cash equivalents 6,138 - -
Bond deposits on trust 2,700 - -
Term receivables 1,719 - -
Other investments - - -
Liabilities at fair value through
profit and loss$000
Derivatives used for hedging
$000
Other financial liabilities at
amortised cost$000
31 March 2009
Liabilities per the balance sheet
Unsecured bank loans including bank overdrafts - - 284,973
Unsecured subordinated bonds - - 260,671
Derivative fi nancial instruments 10,803 4,496 -
Trade and other payables - - 77,654
31 March 2008
Liabilities per the balance sheet
Unsecured bank loans including bank overdrafts - - 336,971
Unsecured subordinated bonds - - 212,039
Derivative fi nancial instruments 2,893 - -
Trade and other payables - - 110,118
Electricity Price Risk
The Group is required to purchase a percentage of its electricity sold off the electricity spot market. This leaves the Group exposed to fl uctuations in the spot price of electricity. The Group has entered into a number of electricity hedge contracts to reduce the commodity price risk from price fl uctuations on the electricity spot market. These hedge contracts establish the price at which future specifi ed quantities of electricity are purchased. Any resulting differential to be paid or received is recognised as a component of energy costs through the term of the contract. The Group has elected to apply cash fl ow hedge accounting to those instruments it deems material and which qualify as cash fl ow hedges while immaterial contracts are not hedge accounted.
The aggregate notional volume of the outstanding electricity derivatives at 31 March 2009 was 617 GWh (31 March 2008: 1,116 GWh).
The hedged anticipated electricity purchase transactions are expected to occur continuously throughout the next four years from balance sheet date consistent with the Group’s forecast electricity generation and retail electricity sales. Gains and losses recognised in the cash fl ow hedge reserve on electricity derivatives as of 31 March 2009 will be continuously released to the income statement in each period in which the underlying purchase transactions are recognised in the income statement.
Sensitivity Analysis
The following tables summarise the impact of increases/decreases of the relevant forward electricity prices on the Group’s post-tax profi t for the year and on other components of equity. The sensitivity analysis is based on the assumption that the relevant forward electricity prices had increased/decreased with all other variables held constant.
GROUP PARENT
2009 2008 2009 2008
$000 $000 $000 $000
Increase/(decrease) to profi t of a 10% increase in electricity forward price (1,679) 258 (1,679) 258
Increase/(decrease) to profi t of a 10% decrease in electricity forward price 1,679 (258) 1,679 (258)
Increase/(decrease) to equity of a 10% increase in electricity forward price 4,100 (9,019) 4,100 (9,019)
Increase/(decrease) to equity of a 10% decrease in electricity forward price (4,100) 9,019 (4,100) 9,019
Note 5 continued

52
Interest Rate Risk
The Group’s bank borrowings are all on fl oating interest rates. The Group has various interest rate fi nancial instruments to manage exposure to fl uctuations in interest rates. Any resulting differential to be paid or received on the instruments is recognised as a component of interest paid. The Group has elected to hedge account only a limited number of these instruments.
The aggregate notional principal amounts of the outstanding interest rate derivative instruments at 31 March 2009 was $576,188,000 (31 March 2008: $325,768,000).
Interest payment transactions are expected to occur at various dates between one month and ten years from the balance sheet date consistent with the Group’s forecast total borrowings.
Effective interest rates for the Parent and the Group are disclosed in note 26.
Sensitivity Analysis
At 31 March 2009, if interest rates at that date had been 100 basis points higher/lower with all other variables held constant, post-tax profi t for the year would have been adjusted by the amounts in the table below, mainly as a result of the fair value change in interest rate derivative instruments which are not hedge accounted.
GROUP PARENT
2009 2008 2009 2008
$000 $000 $000 $000
Increase/(decrease) to profi t of a 100 basis point decrease in interest rates (11,906) (3,846) (7,147) (2,350)
Increase/(decrease) to profi t of a 100 basis point increase in interest rates 11,906 3,872 7,147 2,428
Increase/(decrease) to equity of a 100 basis point decrease in interest rates (14,178) (3,846) (9,420) (2,350)
Increase/(decrease) to equity of a 100 basis point increase in interest rates 14,178 3,872 9,420 2,428
Exchange Rate Risk
The Group has entered into a number of forward exchange contracts to reduce the risk from price fl uctuations of foreign currency costs associated with the construction of generation assets and the sale of carbon credits. Any resulting differential to be paid or received is recognised as a component of the cost of the project for the construction of generation assets and as a part of revenue for the sale of carbon credits. The Group has elected to apply cash fl ow hedge accounting to these instruments.
The aggregate notional principal amounts of the outstanding forward foreign exchange contracts at 31 March 2009 was $29,950,000 (31 March 2008: $38,014,000).
The hedged anticipated transactions denominated in foreign currency are expected to occur at various dates between one month and four years from balance sheet date. Gains and losses recognised in the cash fl ow hedge reserve in equity on forward foreign exchange contracts as at 31 March 2009 will be recognised in the revenue from the production of carbon credits when the credits are produced.
Sensitivity Analysis
At 31 March 2009, if the New Zealand dollar had weakened/strengthened by 10 per cent against the currencies with which the Group has foreign currency risk with all other variables held constant, post-tax profi t for the year would not have been materially different.
Other components of equity would have been $(3,252,000)/$3,252,000 (lower)/higher (31 March 2008: $3,550,000/$(2,905,000) higher/(lower)), arising from foreign exchange gains/losses on revaluation of foreign exchange contracts in a cash fl ow hedge relationship.
Credit Risk
The Group has no signifi cant concentrations of credit risk (2008: none). It has policies in place to ensure that sales are made to customers with an appropriate credit history. Where a potential customer does not have a suitable credit history a bond is required before the customer is accepted. Derivative counterparties and cash transactions are limited to high credit quality fi nancial institutions and other large electricity market participants. The Group has policies that limit the amount of credit exposure to any counterparty.
The carrying amounts of fi nancial assets recognised in the balance sheet best represents the Group’s maximum exposure to credit risk at the reporting date without taking account of the value of any collateral obtained. As shown in note 20, the reported accounts receivable balance includes a provision for doubtful debts of $1,600,000 (2008: $1,100,000).
The Group has around 227,000 customers (2008: 222,000), only three (2008: four) of which make up more than one per cent of the Group’s total accounts receivable balance. The largest of these customers accounts for 8 per cent (2008: 19 per cent) of the Group’s total accounts receivable.
As of 31 March 2009, trade receivables relating to the Group and the Parent of $4,186,000 (2008: $4,799,000) were past due but not impaired. The ageing analysis of these trade receivables is as follows:
GROUP PARENT
2009 2008 2009 2008
$000 $000 $000 $000
Up to 3 months 3,575 4,380 3,575 4,380
3 to 6 months 611 419 611 419
4,186 4,799 4,186 4,799
Note 5 continued

TrustPower / Annual Report 2009 / 53
Movements on the provision for impairment of trade receivables are as follows:
GROUP PARENT
2009 2008 2009 2008
$000 $000 $000 $000
Opening balance 1,100 1,100 1,100 1,100
Provision for receivables impairment 1,904 1,131 1,904 1,131
Bad debts written off (1,404) (1,131) (1,404) (1,131)
Closing balance 1,600 1,100 1,600 1,100
Liquidity Risk
The Group’s ability to readily attract cost effective funding is largely driven by its credit standing.
Prudent liquidity risk management implies maintaining suffi cient cash and marketable securities, the availability of funding through adequate amount of committed credit facilities and the spreading of debt maturities.
Liquidity risk is monitored by continuously forecasting actual cash fl ows and matching the profi les of fi nancial assets and liabilities.
The tables below analyse the Group’s and the Parent’s fi nancial liabilities excluding gross settled derivative fi nancial liabilities into relevant maturity groupings based on the remaining period to the earliest possible contractual maturity date at the period end date. The amounts in the tables are contractual undiscounted cash fl ows.
GROUP Less than1 month
$000
1-6 months
$000
6-12 months
$000
Over 1 year
$000
At 31 March 2009
Net settled electricity price derivatives 903 406 5,154 654
Net settled interest rate derivatives 556 6,099 5,927 9,334
Accounts payable and accruals 80,861 - - -
Unsecured subordinated debt - 11,293 11,049 357,732
Unsecured bank loans 481 3,002 - 471,473
82,801 20,800 22,130 839,193
At 31 March 2008
Net settled electricity price derivatives 439 2,635 3,138 1,421
Net settled interest rate derivatives - - 22 526
Accounts payable and accruals 217,314 - - -
Unsecured subordinated debt - 9,111 58,440 218,940
Unsecured bank loans 2,190 4,923 - 446,865
219,943 16,669 61,600 667,752
PARENT Less than1 month
$000
1-6 months
$000
6-12 months
$000
Over 1 year
$000
At 31 March 2009
Net settled electricity price derivatives 903 406 5,154 654
Net settled interest rate derivatives 556 2,746 2,574 4,243
Accounts payable and accruals 73,820 - - -
Unsecured subordinated debt - 11,293 11,049 357,732
Unsecured bank loans 481 1,914 - 284,973
75,760 16,359 18,777 647,602
At 31 March 2008
Net settled electricity price derivatives 439 2,635 3,138 1,421
Net settled interest rate derivatives - - 22 526
Accounts payable and accruals 106,599 - - -
Unsecured subordinated debt - 9,111 58,440 218,940
Unsecured bank loans 962 4,923 - 339,948
108,000 16,669 61,600 560,835
Note 5 continued

54
The tables below analyse the Group’s and the Parent’s derivative fi nancial instruments that will be settled on a gross basis into relevant maturity groupings based on the remaining period to the contractual maturity date at the period end date. The amounts disclosed in the tables are the contractual undiscounted cash fl ows.
GROUP Less than1 month
$000
1-6 months
$000
6-12 months
$000
Over 1 year
$000
At 31 March 2009
Foreign currency forward contracts
Infl ows 3,587 - 1,301 25,062
(Outfl ows) (3,865) - (1,382) (25,460)
At 31 March 2008
Foreign currency forward contracts
Infl ows - 31,882 - -
(Outfl ows) - (38,014) - -
PARENT Less than1 month
$000
1-6 months
$000
6-12 months
$000
Over 1 year
$000
At 31 March 2009
Foreign currency forward contracts
Infl ows 3,587 - 1,301 25,062
(Outfl ows) (3,865) - (1,382) (25,460)
At 31 March 2008
Foreign currency forward contracts
Infl ows - - - -
(Outfl ows) - - - -
Fair Values
Except for subordinated bonds (see note 27), the carrying amount of fi nancial assets and fi nancial liabilities recorded in the fi nancial statements approximates their fair values.
Estimation of Fair Values
The fair values and net fair values of fi nancial assets and fi nancial liabilities are determined as follows:
• The fair value of fi nancial assets and liabilities with standard terms and conditions and traded on active liquid markets are determined with reference to quoted market prices.
• The fair value of other fi nancial assets and liabilities are calculated using market-quoted rates based on discounted cash fl ow analysis.• The fair value of derivative fi nancial instruments are calculated using quoted prices. Where such prices are not available, use is made of
discounted cash fl ow analysis using the applicable yield curve or available forward price data for the duration of the instruments.
Where the fair value of a derivative is calculated as the present value of the estimated future cash fl ows of the instrument, the two key types of variables used by the valuation techniques are:
• forward price curve (for the relevant underlying interest rates, foreign exchange rates or commodity prices); and• discount rates.
The selection of variables requires signifi cant judgement and therefore there is a range of reasonably possible assumptions in respect of these variables that could be used in estimating the fair value of these derivatives. Maximum use is made of observable market data when selecting variables and developing assumptions for the valuation techniques.
Capital Risk Management Objectives
The Group’s objectives when managing capital are to safeguard the Group’s ability to continue as a going concern, so that it can continue to provide returns for shareholders and benefi ts for other stakeholders and to maintain an optimal capital structure to reduce the cost of capital.
In order to maintain or adjust the capital structure, the Group may adjust the amount of dividends paid to shareholders, return capital to shareholders, issue new shares or sell assets to reduce debt.
Consistent with others in the industry, the Group monitors capital on the basis of the gearing ratio. This ratio is calculated as net debt divided by total capital.
• Net debt is calculated as total borrowings less short term deposits. Total borrowings are calculated using a value of unsecured bank loans plus unsecured subordinated bonds.
• Total capital funding is calculated as total equity as shown in the balance sheet, adjusted for the fair value of fi nancial instruments, plus net debt.
Note 5 continued

TrustPower / Annual Report 2009 / 55
The gearing ratio is calculated below:
GROUP PARENT
2009 2008 2009 2008
Note $000 $000 $000 $000
Net debt
Unsecured bank debt 26 471,473 443,888 284,973 336,971
Unsecured subordinated bonds 27 260,671 212,039 260,671 212,039
Cash at bank / bank overdraft 19 (27,416) (115,198) (4,467) (6,138)
704,728 540,729 541,177 542,872
Equity
Total equity 1,430,069 1,257,326 1,222,584 1,150,629
Remove net effect of fair value of fi nancial instruments after tax 1,158 (10,269) 1,158 (14,396)
1,431,227 1,247,057 1,223,742 1,136,233
Total capital funding 2,135,955 1,787,786 1,764,919 1,679,105
Gearing ratio 33% 30% 31% 32%
Note 6:Critical Accounting Estimates and Judgements
Estimates and judgements are frequently evaluated and are based on historical experience and other factors, including expectations of future events that are believed to be reasonable under the circumstances. The Group makes estimates and assumptions concerning the future. The resulting accounting estimates will, by defi nition, seldom equal the related actual results. The estimates and assumptions that have a signifi cant risk of causing a material adjustment to the carrying amounts of assets and liabilities within the next fi nancial year are discussed below.
Fair Value of Derivatives and Other Financial Instruments
The fair value of fi nancial instruments that are not traded in an active market (for example, electricity price hedges) is determined by using valuation techniques. The Group uses its judgement to select methods and make assumptions that are mainly based on market conditions existing at each balance date. The Group has used discounted cash fl ow analysis for various electricity price hedges that are not traded in an active market. The forward curve is derived from a combination of market quoted prices and management’s best estimates.
Electricity Gross Margin
Three key estimates are made when determining electricity gross margin. The accrual for all three factors is based on an estimate of unbilled units.
• Revenue recognition An accrual is estimated for units sold but not billed at balance date for non-half hourly metered customers. This estimate is based on units
bought from the wholesale electricity market as well as historic factors. Signifi cant judgement is required in making this determination.• Line cost recognition Some electricity lines companies bill the Group based on the units and days that the Group has billed its customers. An accrual, similar to the
revenue recognition accrual, is estimated for line charges incurred but not billed at balance date.• Energy cost recognition An accrual is estimated for units that the Group believes it has consumed but has not yet been billed for by M-Co Limited, the Energy Clearing
House. Signifi cant judgement is required in making this determination.
Sensitivity Analysis
If the estimated unbilled units had been 10% higher/lower, operating profi t for the year would have increased/(decreased) by $569,000/$(552,0000) (2008: increased/(decreased) by $332,000/$(291,000)).
Generation Property, Plant and Equipment
The Group’s generation property, plant and equipment is stated at fair value as determined by an independent valuation undertaken on an at least three-yearly basis. This valuation is reviewed annually and if it is considered that there has been a material change then a new independent valuation is undertaken. The basis of the valuation is a discounted cash fl ow analysis of the future earnings of the assets. The major inputs that are used in the valuation model that require management judgement include sales volume forecasts, forward price of electricity, projected operational and capital expenditure profi les, capacity and life assumptions for each generation station.
Depreciation Expense
A signifi cant amount of management judgement is used when determining the useful lives of the Group’s generation assets for depreciation purposes. This is especially so for the Group’s longer lived assets.
Sensitivity Analysis
If the estimated useful lives of generation assets was 10% higher/lower, operating profi t for the year would have increased/(decreased) by $3,010,000/$(3,678,000) (2008: $2,079,000/$(2,542,000)).
Amortisation Expense
Management judgement is used when determining the useful lives of the Group’s intangible assets for amortisation purposes.
Sensitivity Analysis
If the estimated useful lives of intangible assets was 10% higher/lower, operating profi t for the year would have increased/(decreased) by $517,000/$(632,000) (2008: $458,000/$(560,000)).
Note 5 continued

56
Income Tax Expense
The Group is subject to income taxes in New Zealand and Australia. Signifi cant judgement is required in determining the provision for income taxes. There are many transactions and calculations for which the ultimate tax determination is uncertain. The Group recognises liabilities for anticipated tax audit issues based on estimates of whether additional taxes will be due. Where the fi nal tax outcome of these matters is different from the amounts that were initially recorded, such differences will impact the current and deferred income tax assets and liabilities in the period in which such determination is made.
Provision Against Advances to Subsidiaries
For subsidiaries involved in generation development the Parent fully provides for advances made until such time as a viable project is identifi ed and construction commences. This provision is the result of signifi cant management judgement.
Changes to Accounting Estimates
There have been no changes to accounting estimates in the year.
Note 7: Earnings Per Share
Basic earnings per share is calculated by dividing the profi t attributable to the shareholders of the Company by the weighted average number of ordinary shares on issue during the year. Diluted earnings per share is calculated by adjusting the weighted average number of shares outstanding to assume conversion of all potential dilutive ordinary shares.
GROUP PARENT
Note 2009 2008 2009 2008
Profi t attributable to the equity holders of the Company ($000) 105,075 98,133 108,818 95,724
Weighted average number of ordinary shares in issue (thousands) 315,444 315,246 315,444 315,246
Basic earnings per share (cents per share) 33.3 31.1 34.5 30.4
Profi t attributable to the equity holders of the Company ($000) 105,075 98,133 108,818 95,724 Weighted average number of ordinary shares in issue plus share options outstanding (thousands)
316,084 315,961 316,084 315,961
Diluted earnings per share (cents per share) 33.2 31.1 34.4 30.3
The share options outstanding referred to in the diluted earnings per share calculation relate to share options issued to certain employees.
Underlying earnings after tax ($000) 3 118,772 92,636 114,895 92,213
Weighted average number of ordinary shares in issue (thousands) 315,444 315,246 315,444 315,246
Underlying earnings per share (cents per share) 37.7 29.4 36.4 29.3
Note 8: GROUP PARENT
Electricity Revenue 2009 2008 2009 2008
$000 $000 $000 $000
Electricity sales 724,488 656,961 721,421 656,961
Electricity lease revenue 20,274 - - -
744,762 656,961 721,421 656,961
Electricity lease revenue is revenue recognised in connection with Snowtown Wind Farm Pty Ltd’s (a subsidiary of the Company) Power Purchase Agreement to sell 90% of all energy generated by the Snowtown Wind Farm to a signifi cant Australian electricity retailer. This agreement has been deemed as an operating lease of the wind farm under NZ IFRS and all revenue under the contract accounted for as lease revenue. Because of the contract terms, in particular that the volume of energy supplied is variable dependent on the actual generation of the Snowtown Wind Farm, the future minimum payments under the term of the contract, that expires on 31 December 2018, are contingent in nature and therefore not able to be quantifi ed.
Note 9: GROUP PARENT
Other Fixed and Investment Asset Charges/(Credits) 2009 2008 2009 2008
$000 $000 $000 $000
Loss/(gain) on sale of property, plant and equipment 93 233 162 (135)
Impairment of property, plant and equipment 1,459 (641) 180 (641)
Provision against advances to subsidiaries - - 1,580 1,094
1,552 (408) 1,922 318
Note 6 continued

TrustPower / Annual Report 2009 / 57
Note 10: GROUP PARENT
Other Operating Expenses 2009 2008 2009 2008
$000 $000 $000 $000
Audit fees and expenses 239 164 210 164
Fees paid for other audit related services provided by the auditors* 21 42 21 42
Fees paid for taxation advice, compliance and planning services provided by the auditors 198 132 198 132
Bad debts written off 1,904 1,131 1,904 1,131
Directors’ fees 539 456 539 456
Donations 639 672 639 672
(Gain)/loss on foreign exchange (227) (140) (1,546) (916)
Generation development expenditure 8,474 9,428 5,868 8,562
Other administration costs 12,780 10,836 14,417 10,958
Rental and operating lease costs 179 212 16,496 13,949
24,746 22,933 38,746 35,150
* Other services provided by the auditors includes reviews of unaudited interim fi nancial statements and assistance with cost of capital determination.
Note 11: GROUP PARENT
Finance Income and Costs 2009 2008 2009 2008
$000 $000 $000 $000
Amortisation of debt issue costs 958 1,183 958 1,183
Interest paid on unsecured bank loans 36,885 25,621 24,289 24,275
Interest paid on unsecured subordinated bonds 19,804 21,321 19,804 21,321
Other interest costs and fees 1,620 - 1,413 -
Interest capitalised in construction of property, plant and equipment (5,901) (6,851) (371) (1,132)
Total Interest Paid 53,366 41,274 46,093 45,647
Interest received on cash at bank 999 1,462 1,675 1,375
Interest received on intercompany advances - - 2,654 4,766
Total Interest Received 999 1,462 4,329 6,141
Note 12: GROUP PARENT
Income Tax Expense 2009 2008 2009 2008
$000 $000 $000 $000
Profi t before income tax 143,667 136,812 155,935 137,694
Tax on profi t @ 30% (33% for 2008) 43,100 45,148 46,781 45,439
Tax effect of permanent differences (4,379) (458) 465 (45)
Tax effect of change in corporate tax rate on current year deferred tax - (1,077) - (254)
Tax effect of change in corporate tax rate on opening deferred tax liability - (4,837) - (3,073)
Income tax over provided in prior year (129) (97) (129) (97)
38,592 38,679 47,117 41,970
Represented by:
Current tax 41,169 32,895 48,351 42,499
Deferred tax (2,577) 5,784 (1,234) (529)
38,592 38,679 47,117 41,970
The 30% tax rate used above is the corporate tax rate payable by New Zealand corporate entities on taxable profi t under New Zealand tax law (the corporate tax rate has changed from 33% to 30% effective from 1 April 2008).

58
Note 13: GROUP & PARENT GROUP & PARENT
Dividends on Ordinary Shares 2009 2008 2009 2008
Cents Per Share $000 $000
Final dividend prior year 15.0 14.0 47,313 44,130
Interim dividend paid current year 16.0 15.0 50,432 47,309
Special dividend paid current year 10.0 - 31,528 -
Supplementary dividend paid - - 4,135 305
Foreign investor tax credit - - (4,135) (305)
41.0 29.0 129,273 91,439
Final partially imputed dividend declared subsequent to balance date payable8 June 2009 to all shareholders on the register at 29 May 2009 17.0 15.0 53,630 47,313
Special unimputed dividend declared subsequent to balance date payable 8 June 2009 to all shareholders on the register at 29 May 2009 10.0 - 31,547 -
Note 14: GROUP & PARENT GROUP & PARENT
Share Capital 2009 2008 2009 2008
000’s of Shares $000 $000
Authorised and issued ordinary shares at beginning of year 315,417 315,075 176,055 174,658
Own shares repurchased (236) - (1,634) -
Issue of shares pursuant to the employee share option scheme 55 342 333 1,397
315,236 315,417 174,754 176,055
All shares rank equally with one vote attached to each share, have no par value and are fully paid.
On 15 May 2008, the Company announced a resolution allowing it to buy back up to 5,000,000 of its own shares. As at 31 March 2009 236,000 shares had been purchased at a total cost of $1,634,000. All shares repurchased were purchased through the NZX stock exchange at market price. As at 31 March 2009 none of these shares had been reissued or cancelled.
Note 15: GROUP PARENT
Revaluation Reserve 2009 2008 2009 2008
$000 $000 $000 $000
Balance at beginning of year 658,575 644,420 586,200 572,698
Revaluation of generation assets 259,684 - 120,537 -
Transfer (to)/from deferred tax liability (55,599) - (11,337) -
Transfer (to)/from retained earnings (290) (14) (290) (7)
Tax effect of change in corporate tax rate on deferred tax liability - 14,169 - 13,509
862,370 658,575 695,110 586,200
There are no restrictions on the distribution of this reserve to the equity holders of the Company.
Note 16: GROUP PARENT
Retained Earnings 2009 2008 2009 2008
$000 $000 $000 $000
Balance at beginning of year 411,574 404,866 373,720 369,428
Profi t for the year 105,075 98,133 108,818 95,724
Transfer (to)/from revaluation reserve 290 14 290 7
Dividends on ordinary shares (129,273) (91,439) (129,273) (91,439)
387,666 411,574 353,555 373,720

TrustPower / Annual Report 2009 / 59
Note 17: GROUP PARENT
Cash Flow Hedge Reserve 2009 2008 2009 2008
$000 $000 $000 $000
Balance at beginning of year 10,269 (6,959) 14,396 (4,083)
Fair value gains/(losses) 13,271 17,141 (55) 29,108
Tax on fair value gains/(losses) (3,993) (4,280) 23 (8,733)
Transfers to energy cost expense (22,175) (2,382) (22,175) (2,382)
Tax on transfers to energy cost expense 6,653 715 6,653 715
Transfers to property, plant and equipment (7,405) 8,914 - (33)
Tax on transfers to property, plant and equipment 2,222 (2,674) - 10
Tax effect of change in corporate tax rate on deferred tax liability - (206) - (206)
(1,158) 10,269 (1,158) 14,396
Note 18: GROUP PARENT
Other Reserves 2009 2008 2009 2008
$000 $000 $000 $000
Foreign Currency Translation Reserve
Balance at beginning of year 595 - - -
Transfer to deferred tax 1,838 - - -
Currency translation differences 3,681 595 - -
6,114 595 - -
Employee Share Option Reserve
Balance at beginning of year 258 279 258 279
Fair value movements 65 (21) 65 (21)
323 258 323 258
Total Other Reserves 6,437 853 323 258
Note 19: GROUP PARENT
Cash, Cash Equivalents and Bank Overdraft 2009 2008 2009 2008
$000 $000 $000 $000
Cash at bank 27,416 115,198 4,467 6,138
Bank overdraft - - - -
27,416 115,198 4,467 6,138
Note 20: GROUP PARENT
Accounts Receivable and Prepayments 2009 2008 2009 2008$000 $000 $000 $000
Billed debtors and unbilled sales 53,632 62,672 53,632 62,672 Provision for doubtful debts (1,600) (1,100) (1,600) (1,100)Electricity market receivables 9,248 32,662 6,294 32,662 Other receivables 10,928 3,572 9,042 2,652 Prepayments 1,542 1,337 1,493 1,289
73,750 99,143 68,861 98,175

60
Note 21: GROUP PARENT
Property, Plant and Equipment 2009 2008 2009 2008$000 $000 $000 $000
Generation AssetsBalance at beginning of year
Fair value 1,639,774 1,641,000 1,352,000 1,352,000 Cost 206,795 - 772 - Capital work in progress 183,479 213,145 32,655 14,042 Accumulated depreciation (23,002) - (9,265) -
2,007,046 1,854,145 1,376,162 1,366,042
Additions at cost 74,157 175,675 8,593 19,345 Depreciation (33,948) (23,002) (9,438) (9,265)Disposals at net book value (353) (1,226) (332) - Revaluations/transfers 266,440 1,454 119,562 40
Balance at end of year
Fair value 2,305,641 1,639,774 1,488,162 1,352,000 Cost - 206,795 - 772 Capital work in progress 7,701 183,479 6,385 32,655 Accumulated depreciation - (23,002) - (9,265)
2,313,342 2,007,046 1,494,547 1,376,162
Metering EquipmentBalance at beginning of year
Cost 60,820 57,009 60,820 57,009 Accumulated depreciation (30,656) (28,246) (30,656) (28,246)
30,164 28,763 30,164 28,763
Additions at cost 4,020 3,812 4,020 3,812 Depreciation (2,621) (2,411) (2,621) (2,411)Disposals at net book value - - - - Transfers - - - -
Balance at end of year
Cost 64,840 60,820 64,840 60,820 Accumulated depreciation (33,277) (30,656) (33,277) (30,656)
31,563 30,164 31,563 30,164
Other Freehold BuildingsBalance at beginning of year
Cost 10,582 10,581 9,986 9,985 Accumulated depreciation (2,681) (2,507) (2,693) (2,507)
7,901 8,074 7,293 7,478
Additions at cost 522 143 522 143 Depreciation (240) (195) (198) (195)Disposals at net book value - (133) - (133)Transfers 130 12 (1) -
Balance at end of year
Cost 11,245 10,582 10,507 9,986 Accumulated depreciation (2,932) (2,681) (2,891) (2,693)
8,313 7,901 7,616 7,293
Other Freehold Land
Balance at beginning of year
Cost 7,597 6,847 6,341 5,591
Additions at cost 5,809 2,469 113 2,469
Disposals at net book value - (1,719) - (1,719)
Transfers 636 - 38 -
Balance at end of year
Cost 14,042 7,597 6,492 6,341

TrustPower / Annual Report 2009 / 61
GROUP PARENT
2009 2008 2009 2008
$000 $000 $000 $000
Other Plant and Equipment
Balance at beginning of year
Cost 13,270 14,315 13,270 11,213
Accumulated depreciation (9,004) (9,648) (8,508) (6,558)
4,266 4,667 4,762 4,655
Additions at cost 2,479 515 2,429 1,861
Depreciation (1,869) (1,641) (1,869) (1,640)
Disposals at net book value (234) (164) (234) (164)
Transfers 994 889 1,161 50
Balance at end of year
Cost 15,366 13,270 15,970 13,270
Accumulated depreciation (9,730) (9,004) (9,721) (8,508)
5,636 4,266 6,249 4,762
Total
Balance at beginning of year
Fair value 1,639,774 1,641,000 1,352,000 1,352,000
Cost 299,064 88,752 91,189 83,798
Capital work in progress 183,479 213,145 32,655 14,042
Accumulated depreciation (65,343) (40,401) (51,122) (37,311)
2,056,974 1,902,496 1,424,722 1,412,529
Additions at cost 86,987 182,614 15,677 27,630
Depreciation (38,678) (27,249) (14,126) (13,511)
Disposals at net book value (587) (3,242) (566) (2,016)
Revaluations/transfers 268,200 2,355 120,760 90
Balance at end of year
Fair value 2,305,641 1,639,774 1,488,162 1,352,000
Cost 105,493 299,064 97,809 91,189
Capital work in progress 7,701 183,479 6,385 32,655
Accumulated depreciation (45,939) (65,343) (45,889) (51,122)
2,372,896 2,056,974 1,546,467 1,424,722
If generation assets were stated on an historical cost basis, the amounts would be as follows:
GROUP PARENT
2009 2008 2009 2008
$000 $000 $000 $000
Generation assets (at cost) 1,347,967 1,086,526 735,200 694,556
Generation assets under construction (at cost) 7,701 183,479 6,385 32,655
Generation assets accumulated depreciation (172,324) (134,383) (108,275) (94,886)
1,183,344 1,135,622 633,310 632,325
Generation assets include freehold land and buildings which are not separately identifi able from other generation assets. Generation assets were independently revalued, using a discounted cash fl ow methodology, as at 31 March 2009 to their estimated market value as determined by Deloitte Corporate Finance.
The key assumptions in this valuation include future wholesale electricity prices, the future output of the assets, the remaining life of the assets, the ongoing operating and maintenance costs for each asset and the Group’s weighted average cost of capital.
Included in the capital work in progress are capitalised borrowing costs of nil (2008:$4,949,000).
Note 21 continued

62
Note 22: GROUP PARENT
Commitments 2009 2008 2009 2008
$000 $000 $000 $000
Capital Commitments - 47,191 - -
The Group has no capital commitments at balance date. $5,437,000 has been accrued for work completed but not paid for in relation to the construction of its Snowtown wind farm in South Australia.
Electricity Purchase Commitments
The Parent has a long term contract with Mighty River Power Limited to purchase the output from the Rotokawa geothermal power station until 31 March 2013. This commitment cannot be quantifi ed.
The Parent has a contract with Pioneer Generation Limited to purchase all of the output from its various generation sites. This commitment cannot be quantifi ed.
The Parent has a contract with Top Energy Limited to purchase all of the output from its Ngawha geothermal station. This commitment cannot be quantifi ed.
Note 23: GROUP PARENT
Investments in Subsidiaries 2009 2008 2009 2008
$000 $000 $000 $000
Shares at cost - - 64,719 64,719
Net advances to subsidiaries - - 315,962 328,080
Provision against advances to subsidiaries - - (12,667) (11,087)
- - 368,014 381,712
Signifi cant Subsidiaries (31 March Balance Dates) Country of incorporation % owned Principal activity
Cobb Power Limited New Zealand 100 Asset holding
TrustPower Oamaru Limited (formerly Pulse Business Solutions Limited) New Zealand 100 Call services operator
Sellicks Hill Wind Farm Pty Ltd Australia 100 Generation development
Snowtown Wind Farm Pty Ltd Australia 100 Electricity generation
Tararua Wind Power Limited New Zealand 100 Asset holding
TrustPower Australia Holdings Pty Ltd Australia 100 Generation development
TrustPower Australia (New Zealand) Limited New Zealand 100 Asset holding
TrustPower Insurance Limited New Zealand 100 Insurance
TrustPower Australia Financing Partnership Australia 100 Financing
Note 24: GROUP PARENT
Intangible Assets 2009 2008 2009 2008
$000 $000 $000 $000
Customer Base Assets
Balance at beginning of year
Cost 64,994 64,994 64,994 64,994
Accumulated amortisation (29,120) (25,312) (29,120) (25,312)
35,874 39,682 35,874 39,682
Additions at cost - - - -
Amortisation (3,808) (3,808) (3,808) (3,808)
Disposals at net book value - - - -
Balance at end of year
Cost 64,994 64,994 64,994 64,994
Accumulated amortisation (32,928) (29,120) (32,928) (29,120)
32,066 35,874 32,066 35,874

TrustPower / Annual Report 2009 / 63
GROUP PARENT
2009 2008 2009 2008
$000 $000 $000 $000
Computer Software
Balance at beginning of year
Cost 17,575 14,713 17,575 14,713
Accumulated amortisation (13,183) (11,846) (13,183) (11,846)
4,392 2,867 4,392 2,867
Additions at cost 5,268 2,866 5,268 2,866
Amortisation (1,882) (1,337) (1,882) (1,337)
Disposals at net book value (13) (42) (13) (42)
Transfers (315) 38 (315) 38
Balance at end of year
Cost 21,122 17,575 21,122 17,575
Accumulated amortisation (13,672) (13,183) (13,672) (13,183)
7,450 4,392 7,450 4,392
Total
Balance at beginning of year
Cost 82,569 79,707 82,569 79,707
Accumulated amortisation (42,303) (37,158) (42,303) (37,158)
40,266 42,549 40,266 42,549
Additions at cost 5,268 2,866 5,268 2,866
Amortisation (5,690) (5,145) (5,690) (5,145)
Disposals at net book value (13) (42) (13) (42)
Transfers (315) 38 (315) 38
Balance at end of year
Cost 86,116 82,569 86,116 82,569
Accumulated amortisation (46,600) (42,303) (46,600) (42,303)
39,516 40,266 39,516 40,266
There are no individually material intangible assets included within the above.
Note 25: GROUP PARENT
Accounts Payable and Accruals 2009 2008 2009 2008
$000 $000 $000 $000
Capital expenditure accruals 11,602 108,917 6,164 6,164
Customer bond deposits 2,423 2,596 2,423 2,596
Electricity market payables 13,477 59,644 13,477 59,644
Line cost accrual 2,617 1,767 2,617 1,767
Employee entitlements 4,757 4,190 4,757 4,190
Interest accruals 3,834 4,747 3,834 3,519
Net GST payable 7,037 2,104 7,036 1,956
Other accounts payable and accruals 8,588 9,502 6,986 1,688
Trade accounts payable 30,360 28,594 30,360 28,594
84,695 222,061 77,654 110,118
Note 24 continued

64
Note 26: GROUP PARENT
Unsecured Bank Loans 2009 2008 2009 2008$000 $000 $000 $000
New Zealand dollar facilitiesRepayment terms:One to two years 100,000 100,000 100,000 100,000 Two to fi ve years 88,500 133,000 88,499 133,000 Over fi ve years 99,026 106,948 99,026 106,948 Facility establishment costs (2,552) (2,977) (2,552) (2,977)
284,974 336,971 284,973 336,971 Weighted average interest:One to two years 3.6% 8.7% 3.6% 8.7%Two to fi ve years 3.5% 8.8% 3.5% 8.8%Over fi ve years 3.9% 9.2% 3.9% 9.2%
3.7% 8.9% 3.7% 8.9%Australian dollar facilitiesRepayment terms:One to two years 186,499 - - - Two to fi ve years - 106,917 - - Over fi ve years - - - - Facility establishment costs - - - -
186,499 106,917 - - Weighted average interest:One to two years 4.6% - - - Two to fi ve years - 7.8% - - Over fi ve years - - - -
4.6% 7.8% - -
Total bank loans 471,473 443,888 284,973 336,971
Interest rates paid during the year ranged from 3.18% to 9.30%.
The Group has the following loan facilities with interest priced at between call and 180 day rates:(i) $100,000,000 revolving loan expiring in under one year (ii) $125,000,000 revolving loan expiring in one to two years (iii) $225,000,000 revolving loan expiring in two to fi ve years(iv) $99,026,000 table loan maturing in twelve years(v) AUD 160,000,000 revolving loan expiring in one to two years
All of the Group’s borrowings are unsecured. The Group borrows under a negative pledge arrangement with its bank loan providers, which with limited exceptions does not permit the Group to grant any security interest over its assets. The negative pledge deed requires the Group to maintain certain levels of shareholders’ funds and operate within defi ned performance and debt gearing ratios. The banking arrangements may also create restrictions over the sale or disposal of certain assets unless the bank loans are repaid or renegotiated, specifi cally:- Facilities (i) to (iii) and (v) require a continuation of the existing business operations. There are no costs to cancel the facilities. - Facility (iv) requires continued ownership by the Group of at least 30% in relation to Tararua Stage III wind generation assets with a book value
of $162,737,000. There are no costs to cancel the facility.
Throughout the period the Group has complied with all debt covenance requirements as imposed by lenders (see above for requirements).
Subsequent to balance date the Group has accepted offers to refi nance the facility expiring in one year and extend it by $20,000,000 to $120,000,000. This facility is currently being documented and will mature in two to fi ve years.
A subsidiary company has entered into a fully defeased cross border lease in relation to generation assets with a book value of $65,500,000. The lease liability is not recognised in these fi nancial statements as all obligations have been prepaid to the respective lessors. This creates restrictions on the disposal of the asset unless the subsidiary company holding the assets is part of the disposal. The lease expires in January 2018 and is subject to a potential termination payment, up to a maximum value of $5,415,000, in the event that the subsidiary wishes to terminate the lease.
Note 27: GROUP PARENT
Unsecured Subordinated Bonds 2009 2008 2009 2008$000 $000 $000 $000
Repayment terms and interest:Maturing in December 2008, 8.3% p.a. fi xed coupon rate - 50,511 - 50,511 Maturing in September 2012, 8.5% p.a. fi xed coupon rate 108,592 108,592 108,592 108,592 Maturing in March 2014, 8.5% p.a. fi xed coupon rate 54,713 54,713 54,713 54,713 Maturing in December 2015, 8.4% p.a. fi xed coupon rate 100,000 - 100,000 - Bond issue costs (2,634) (1,777) (2,634) (1,777)
260,671 212,039 260,671 212,039
Current portion - 50,511 - 50,511 Non current portion 260,671 161,528 260,671 161,528
260,671 212,039 260,671 212,039
At maturity the bonds can be converted at the option of the Company to ordinary shares based on the market price of ordinary shares at the time. The bonds are fully subordinated behind all other creditors.
At 31 March 2009 the bonds had a fair value of $279,080,000 (31 March 2008: $198,523,000).

TrustPower / Annual Report 2009 / 65
Note 28: GROUP PARENT
Deferred Income Tax 2009 2008 2009 2008
$000 $000 $000 $000
Balance at beginning of year 204,835 206,775 174,314 180,138
Current year changes in temporary differences affecting tax expense (2,577) 10,621 (1,234) 2,544
Current year changes in temporary differences affecting reserves 48,879 6,239 4,661 8,008
Effect of announced change in corporate tax rate on:
Income tax expense - (4,837) - (3,073)
Revaluation reserve - (14,169) - (13,509)
Cash fl ow hedge reserve - 206 - 206
251,137 204,835 177,741 174,314
Comprising:
Deferred tax liabilities 251,137 206,654 177,741 174,314
Deferred tax assets - (1,819) - -
251,137 204,835 177,741 174,314
The tables below show the break down of the temporary differences that make up the deferred tax liabilities and their movement for the year.
GROUPOpening Balance
Charged to Income Statement
Charged Directly
to EquityClosing Balance
For the year ended 31 March 2009
Revaluations 140,860 - 55,599 196,459
Other property, plant and equipment movements 50,010 4,486 - 54,496
Employee benefi ts (1,126) (152) - (1,278)
Provisions (343) (137) - (480)
Carbon revenue recognition - 636 - 636
Customer base assets 10,762 (1,142) - 9,620
Financial instruments 6,575 (6,333) (6,651) (6,409)
Unrealised losses on Australian dollar loan - - (1,838) (1,838)
Other (84) 15 - (69)
206,654 (2,739) 47,222 251,137
Opening Balance
Charged to Income Statement
Charged Directly
to EquityClosing Balance
For the year ended 31 March 2008
Revaluations 154,946 - (14,086) 140,860
Other property, plant and equipment movements 42,384 7,626 - 50,010
Employee benefi ts (1,272) 146 - (1,126)
Provisions (496) 153 - (343)
Customer base assets 13,095 (2,333) - 10,762
Financial instruments (1,791) 235 8,131 6,575
Other (91) 7 - (84)
206,775 5,834 (5,955) 206,654
PARENTOpening Balance
Charged to Income Statement
Charged Directly
to EquityClosing Balance
For the year ended 31 March 2009
Revaluations 134,371 - 11,337 145,708
Other property, plant and equipment movements 24,159 2,688 - 26,847
Employee benefi ts (1,126) (152) - (1,278)
Provisions (343) (137) - (480)
Carbon revenue recognition - 636 - 636
Customer base assets 10,762 (1,142) - 9,620
Financial instruments 6,575 (3,142) (6,676) (3,243)
Other (84) 15 - (69)
174,314 (1,234) 4,661 177,741

66
PARENTOpening Balance
Charged to Income Statement
Charged Directly
to EquityClosing Balance
For the year ended 31 March 2008
Revaluations 147,808 - (13,437) 134,371
Other property, plant and equipment movements 22,885 1,274 - 24,159
Employee benefi ts (1,272) 146 - (1,126)
Provisions (496) 153 - (343)
Customer base assets 13,095 (2,333) - 10,762
Financial instruments (1,791) 224 8,142 6,575
Other (91) 7 - (84)
180,138 (529) (5,295) 174,314
The tables below show the break down of the temporary differences that make up the deferred tax assets and their movement for the year.
GROUPOpening Balance
Charged to Income Statement
Charged Directly
to EquityClosing Balance
For the year ended 31 March 2009
Revaluations - - - -
Other property, plant and equipment movements (808) 808 - -
Financial instruments 1,670 99 (1,769) -
Tax losses unlikely to be utilised within one year 957 (957) - -
1,819 (50) (1,769) -
For the year ended 31 March 2008
Revaluations - - - -
Other property, plant and equipment movements - (808) - (808)
Financial instruments - (99) 1,769 1,670
Tax losses unlikely to be utilised within one year - 957 - 957
- 50 1,769 1,819
Note 29: GROUP PARENT
Reconciliation of Net Cash Flow From Operating Activities With Profi t After Tax Attributable to the Shareholders
2009 2008 2009 2008
$000 $000 $000 $000
Profi t after tax attributable to the shareholders of the Company 105,075 98,133 108,818 95,724
Items classifi ed as investing/fi nancing:
Interest paid 53,748 38,538 44,819 44,139
Interest received (1,393) (1,462) (4,328) (6,141)
52,355 37,076 40,491 37,998
Non-cash items:
Amortisation of debt issue costs 958 1,183 958 1,183
Amortisation of intangible assets 5,690 5,145 5,690 5,145
Depreciation 38,678 27,249 14,126 13,511
Other fi xed and investment asset charges/(credits) 1,552 (408) 1,922 318
Share option provision transfer 65 (21) 65 (21)
Movement in derivative fi nancial instruments taken to the income statement 19,567 (985) 8,682 (654)
Intercompany charges - - 26,059 22,797
Increase/(decrease) in deferred tax liability excluding transfers to reserves (2,481) 5,783 (1,234) (529)
63,918 37,946 56,268 41,750
Decrease/(increase) in working capital:
Accounts receivable and prepayments 22,809 (37,585) 26,994 (36,625)
Taxation payable/receivable 10,486 (3,965) 8,144 (3,408)
Accounts payable and accruals excluding capital expenditure accruals (40,537) 29,442 (32,463) 26,715
(7,242) (12,108) 2,675 (13,318)
Net cash fl ow from operating activities 214,217 161,047 208,252 162,154
Note 28 continued

TrustPower / Annual Report 2009 / 67
Note 30: GROUP PARENT
Imputation Credit Account 2009 2008 2009 2008
$000 $000 $000 $000
Balance at beginning of year 2,204 10,704 2,204 10,704
Tax paid 26,052 36,161 26,052 36,161
Allocated to dividends (27,807) (44,680) (27,807) (44,680)
Other movements 13 19 13 19
Balance at end of year 462 2,204 462 2,204
Note 31: GROUP PARENT
Emission Rights 2009 2008 2009 2008
Verifi ed Voluntary Emission Reductions (Tonnes CO 2-e)
Balance at beginning of year 360,000 213,000 360,000 213,000
Rights verifi ed during the year 29,000 202,000 29,000 202,000
Rights sold during the year (23,000) (55,000) (23,000) (55,000)
Rights used internally (45,000) - (45,000) -
Rights unsold at end of year 321,000 360,000 321,000 360,000
The Verifi ed Voluntary Emission Reductions above relate to completed generation production for the period 1 January 2004 to 31 December 2007. As at 31 March 2009 unsold Verifi ed Voluntary Emission Reductions were valued at nil (2008: nil).
Kyoto Carbon Credits
The Group has received 1,476,000 (2008:1,476,000) tonnes of carbon emission rights from the New Zealand Government issued pursuant to the Kyoto protocol in relation to completed generation facilities. This represents the maximum rights based upon specifi ed levels of generation output from the new facilities for the period 1 January 2008 to 31 December 2012 and is reliant on the ongoing support of the Kyoto protocol and emission rights within the international community. The Group believes that it will be able to utilise 1,310,000 tonnes of these carbon emission rights. This potential revenue source is taken into consideration in the evaluation of generation development projects and in the valuation of the generation assets.
A contract has been signed with Electrabel, a European energy company, for the sale of 228,000 tonnes of carbon emission rights over fi ve years from 2008-2012. This sale is dependent on the Group’s Tararua Stage II wind farm producing a minimum level of output. A contract has been signed with The Kansai Electric Power Company, a Japanese energy company, for the sale of 300,000 tonnes of carbon emission rights over fi ve years from 2008-2012. Further contracts have been signed covering emission rights generated over the same period. These sales are dependent on the Group’s Tararua Stage III wind farm producing a minimum level of output.
GROUP PARENT
2009 2008 2009 2008
Kyoto Carbon Credits (Tonnes CO 2-e)
Rights earned during the year 216,000 55,000 216,000 55,000
Rights sold during the year (151,000) (55,000) (151,000) (55,000)
Rights unsold at end of year 65,000 - 65,000 -
Included in other receivables (note 20) is $5,947,000 relating to Kyoto Carbon Credits generated and pre-sold (2008: $1,892,000). In addition $1,619,000 is included relating to Kyoto Carbon Credits generated but unsold at balance date (2008: nil).
Note 32:Contingent Liabilities, Operating Leases, and Subsequent Events
The Group is not aware of any material contingent liabilities at balance date (2008: nil).
The Group is not party to any material operating leases at balance date (2008: nil).
The Group is not aware of any signifi cant events occurring subsequent to balance date that have not been disclosed.
Note 33: Related Party Transactions
The Group is controlled by Infratil Limited (incorporated in New Zealand) which owns 50.5% of the Company’s shares. The Tauranga Energy Consumer Trust owns 33.0% and the residual 16.5% are widely held.
A related entity of H.R.L. Morrison & Co Limited manages Infratil Limited and Mr HRL Morrison, a Director of TrustPower Limited, is the Chief Executive of H.R.L. Morrison & Co Limited and a Director of Infratil Limited. Infratil Limited is a signifi cant shareholder in TrustPower Limited and $112,000 (2008: $53,000) was paid to H.R.L. Morrison & Co Limited and related entities during the year for consultancy services. As at 31 March 2009 none of this amount was outstanding (2008: $1,000).
Mr JG Schultz was a Director of a number of the Australian subsidiaries of the Company until 31 May 2008 and is a partner in the Adelaide based law fi rm of Finlaysons. $56,000 was paid to Finlaysons up to 31 May 2008 (2008 full year: $155,000) for legal services. As at 31 March 2009 none of this amount was outstanding (2008: nil).
Consultancy fees of $9,000 (2008: nil) were paid to Victoria Electricity Pty Ltd which is a subsidiary of the Group’s ultimate parent. As at 31 March 2009 none of this amount was outstanding (2008: nil).
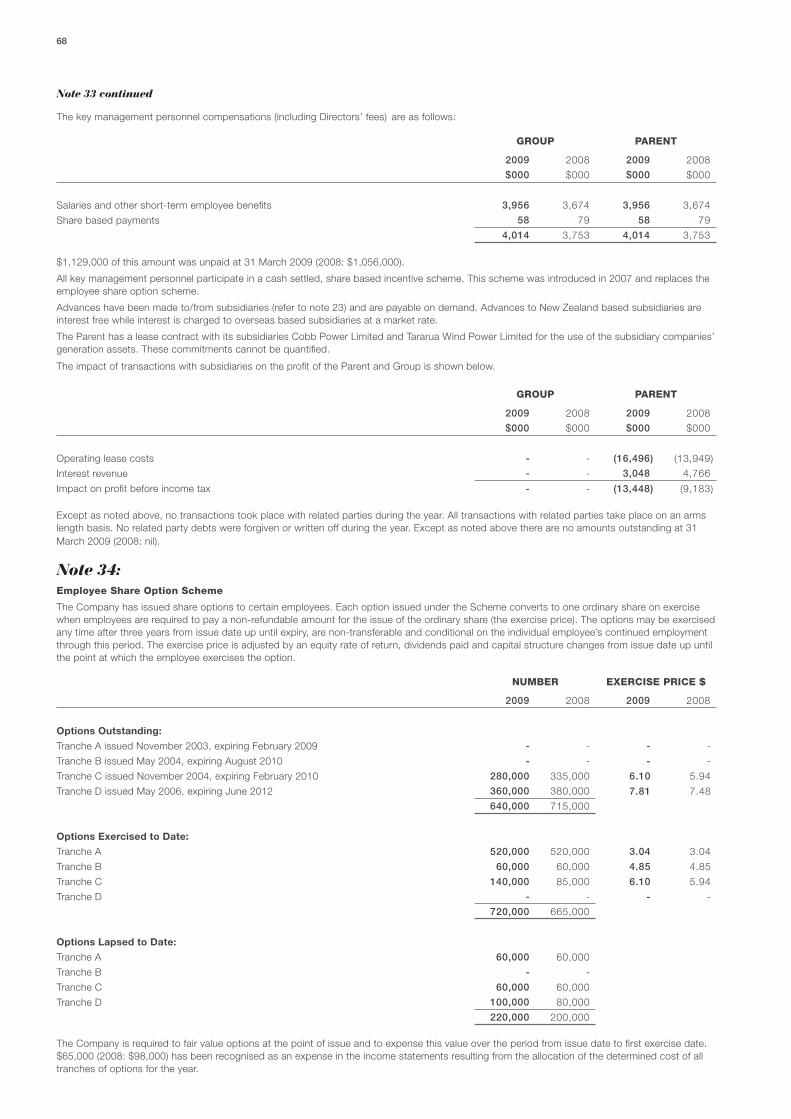
68
The key management personnel compensations (including Directors’ fees) are as follows:
GROUP PARENT
2009 2008 2009 2008
$000 $000 $000 $000
Salaries and other short-term employee benefi ts 3,956 3,674 3,956 3,674
Share based payments 58 79 58 79
4,014 3,753 4,014 3,753
$1,129,000 of this amount was unpaid at 31 March 2009 (2008: $1,056,000).
All key management personnel participate in a cash settled, share based incentive scheme. This scheme was introduced in 2007 and replaces the employee share option scheme.
Advances have been made to/from subsidiaries (refer to note 23) and are payable on demand. Advances to New Zealand based subsidiaries are interest free while interest is charged to overseas based subsidiaries at a market rate.
The Parent has a lease contract with its subsidiaries Cobb Power Limited and Tararua Wind Power Limited for the use of the subsidiary companies’ generation assets. These commitments cannot be quantifi ed.
The impact of transactions with subsidiaries on the profi t of the Parent and Group is shown below.
GROUP PARENT
2009 2008 2009 2008
$000 $000 $000 $000
Operating lease costs - - (16,496) (13,949)
Interest revenue - - 3,048 4,766
Impact on profi t before income tax - - (13,448) (9,183)
Except as noted above, no transactions took place with related parties during the year. All transactions with related parties take place on an arms length basis. No related party debts were forgiven or written off during the year. Except as noted above there are no amounts outstanding at 31 March 2009 (2008: nil).
Note 34: Employee Share Option Scheme
The Company has issued share options to certain employees. Each option issued under the Scheme converts to one ordinary share on exercise when employees are required to pay a non-refundable amount for the issue of the ordinary share (the exercise price). The options may be exercised any time after three years from issue date up until expiry, are non-transferable and conditional on the individual employee’s continued employment through this period. The exercise price is adjusted by an equity rate of return, dividends paid and capital structure changes from issue date up until the point at which the employee exercises the option.
NUMBER EXERCISE PRICE $
2009 2008 2009 2008
Options Outstanding:
Tranche A issued November 2003, expiring February 2009 - - - -
Tranche B issued May 2004, expiring August 2010 - - - -
Tranche C issued November 2004, expiring February 2010 280,000 335,000 6.10 5.94
Tranche D issued May 2006, expiring June 2012 360,000 380,000 7.81 7.48
640,000 715,000
Options Exercised to Date:
Tranche A 520,000 520,000 3.04 3.04
Tranche B 60,000 60,000 4.85 4.85
Tranche C 140,000 85,000 6.10 5.94
Tranche D - - - -
720,000 665,000
Options Lapsed to Date:
Tranche A 60,000 60,000
Tranche B - -
Tranche C 60,000 60,000
Tranche D 100,000 80,000
220,000 200,000
The Company is required to fair value options at the point of issue and to expense this value over the period from issue date to fi rst exercise date. $65,000 (2008: $98,000) has been recognised as an expense in the income statements resulting from the allocation of the determined cost of all tranches of options for the year.
Note 33 continued

TrustPower / Annual Report 2009 / 69
Statutory InformationInterests Register
The Company is required to maintain an Interests Register in which particulars of certain transactions and matters involving the Directors must be recorded.
The matters set out below were recorded in the Interests Register of the Company during the fi nancial year.
General Notice of Interest by Directors
The Directors of the Company have declared interests in the following identifi ed entities as at 31 March 2009.
Director Interest Entity
Bruce James Harker Director TrustPower Metering Limited
Director Morrison Capital Limited
Director Energy Developments Limited
Director Victoria Electricity Pty Ltd
Director Infratil Energy Australia Pty Ltd
Ronald Powell Carter Director Rugby New Zealand 2011 Limited
Director Rural Equities Limited
Director Rural Equities Trust Management Limited
Chairman Committee for Auckland
Michael James Cooney Trustee Tauranga Energy Consumer Trust
Director TECT Holdings Limited
Partner Cooney Lees & Morgan
Director TrustPower Australia (New Zealand) Limited
Director TrustPower Insurance Limited
Director Tararua Wind Power Limited
Director Cobb Power Limited
Ian Samuel Knowles Chief Executive Kiwibank Limited
Director Banking Ombudsman Commission Limited
Director Kiwi Insurance Limited
Director The New Zealand Home Loan Company Limited
Director Kiwibank Nominees Limited
Director New Zealand Home Lending Limited
Director AMP Home Loans Limited
Director St James Theatre Limited
Trustee Te Omanga Hospice
Hugh Richmond Lloyd Morrison Director Auckland International Airport Limited
Director Infratil Limited and certain Infratil Limited Subsidiaries
Director Tullamore Management Limited
Chairman H.R.L. Morrison & Co Group Limited and its Subsidiaries
Geoffrey Jon Campbell Swier Director Farrier Swier Consulting Pty Ltd
Director Snowtown Wind Farm Pty Ltd
Director Sellicks Hill Wind Farm Pty Ltd
Director TrustPower Australia Holdings Pty Ltd
Director TrustPower Renewable Investments Pty Ltd
Marko Bogoievski (Alternate Director) Director Zig Zag Farm Limited
Director NZ Bus Limited
Director NZ Bus Finance Limited
Director Victoria Electricity Pty Ltd
Director Infratil Energy Australia Pty Ltd
Director Fisher Funds Management Limited
Director Infratil Limited
Chief Executive Infratil Limited

70
Information Used by Directors
During the fi nancial year there were no notices from Directors of the Company requesting to disclose or use Company information received in their capacity as Directors which would not otherwise have been available to them.
Directors Holding Offi ce and their Remuneration
The Directors holding offi ce as at 31 March 2009 and during the year to 31 March 2009 are listed below. The total amount of the remuneration and other benefi ts received by each Director, and each former Director during the fi nancial year, and responsibility held, is listed next to their names.
Director Remuneration Responsibility HeldBruce James Harker $130,000 Chairman
Non-executive DirectorMember of Audit CommitteeMember of Remuneration Committee
Ronald Powell Carter $75,000 Independent DirectorMember of Audit Committee
Hugh Richmond Lloyd Morrison $65,000 Non-executive DirectorMichael James Cooney $65,000 Non-executive DirectorGeoffrey Jon Campbell Swier $109,573 Independent Director
Chairman of Audit CommitteeMember of Remuneration Committee
Ian Samuel Knowles $65,000 Independent DirectorAlan Trevor Jackson 1 $34,083 Independent DirectorMarko Bogoievski 2 Nil Alternate Director
1 Appointed as a Director of the Company on 21 August 2008 and resigned 25 February 20092 Alternate Director for HRL Morrison appointed 26 February 2009
Indemnifi cation and Insurance of Directors and Executives
During the fi nancial year the Company paid insurance premiums in respect of Directors’ and certain executive employees’ liability insurance, as permitted by the Company’s Constitution and the Companies Act 1993. The policies do not specify the premium for individuals. This insurance extends to Directors and certain executive employees acting in the capacity of a director or on behalf of a subsidiary or related company.
The Directors’ and executive employees’ liability insurance provides cover against costs and expenses involved in defending legal actions and any resulting payments arising from a liability to persons (other than the Company or a related body corporate) incurred in their capacity as Director or executive employee unless the conduct involves a wilful breach of duty or an improper use of inside information or position to gain advantage.
The Company has entered into deeds of indemnity in respect of each Director, the Chief Executive, Chief Financial Offi cer and Company Secretary, Strategic Business Development Manager, Generation Manager, Energy Sales Manager, Chief Information Offi cer and Trading and Risk Manager whereby each such Director and executive employee is indemnifi ed against the types of liability and costs described above, as permitted by the Company’s Constitution and the Companies Act 1993.
Subsidiary Company Directors
Set out below are details of the Directors of TrustPower’s subsidiaries as at 31 March 2009.
Director as at 31 March 2009 TrustPower Group CompanyBruce James Harker TrustPower Metering LimitedMichael James Cooney Tararua Wind Power Limited
Cobb Power LimitedTrustPower Insurance LimitedTrustPower Australia (New Zealand) Limited
Tamaroa Raymond Nikora Waikaremoana Power LimitedRangi Tumoana Manuel Waikaremoana Power LimitedGeoffrey Jon Campbell Swier TrustPower Australia Holdings Pty Ltd
TrustPower Renewable Investments Pty LtdSnowtown Wind Farm Pty LtdSellicks Hill Wind Farm Pty Ltd
Keith Neville Tempest Tararua Wind Power LimitedCobb Power LimitedTrustPower Metering LimitedTrustPower Australia (New Zealand) LimitedTrustPower Insurance LimitedBay Energy LimitedPaehinahina Mourea Geothermal LimitedTaheke Geothermal LimitedWaikaremoana Power LimitedTrustPower Australia Holdings Pty LtdTrustPower Oamaru LimitedTrustPower Renewable Investments Pty LtdSnowtown Wind Farm Pty LtdSellicks Hill Wind Farm Pty Ltd
No Directors’ fees or other benefi ts were paid in relation to these Directorships during the fi nancial year. The remuneration and other benefi ts received by employees acting as Directors of subsidiaries during the fi nancial year is disclosed in the relevant bandings for employee remuneration.

TrustPower / Annual Report 2009 / 71
General Notice of Interests by Directors of Subsidiary Companies
Director Interest Entity
Bruce James Harker*Michael James Cooney*Geoffrey Jon Campbell Swier*
Keith Neville Tempest Chief Executive TrustPower LimitedDirector GAP Business Solutions LimitedDirector New Zealand Bus LimitedDirector New Zealand Bus Finance Limited
*Refer General Notice of Interests by Directors
Information Used by Directors of Subsidiaries
During the fi nancial year there were no notices from Directors of subsidiary companies requesting to disclose or use subsidiary company information received in their capacity as Directors which would not otherwise have been available to them.
Employee Remuneration
During the fi nancial year the number of employees or former employees (including employees holding offi ce as directors of subsidiaries) who received remuneration and other benefi ts in their capacity as employees of the Company, the value of which was or exceeded $100,000 per annum was as follows:
Remuneration Ranges Number of Employees Remuneration Ranges Number of Employees
$100,000 – 109,999 13 $200,000 – 209,999 2$110,000 – 119,999 4 $210,000 – 219,999 1$120,000 – 129,999 2 $330,000 – 339,999 1$130,000 – 139,999 4 $370,000 – 379,999 1$140,000 – 149,999 1 $380,000 – 389,999 1$150,000 – 159,999 2 $390,000 – 399,999 1$160,000 – 169,999 1 $490,000 – 499,999 1$170,000 – 179,999 4 $500,000 – 509,999 1$180,000 – 189,999 2 $510,000 – 519,999 1$190,000 – 199,999 1 $1,010,000 – 1,019,999 1
Directors’ Transactions and Relevant Interests in Securities of the Company
The relevant interests of Directors in securities of the Company as at 31 March 2009 are listed below together with transactions by Directors in securities of the Company during the fi nancial year.
Director
Number Acquired/
(Disposed)
$ Amount Paid/
(Received) DateClass of Security
Number Held at
31 March 2009
Number Held at
31 March 2008
BJ and JS Harker Family Trust (benefi cial) 150,000 150,000 1 December 2008 Bonds 203,000 53,0003,868 32,336 12 June 2008 Shares4,340 32,338 14 November 2008 Shares 8,208 Nil
RP Carter Family Trusts (non benefi cial) 100,000 100,000 1 December 2008 Bonds 250,000 150,0002,232 18,659 12 June 2008 Shares2,504 18,656 14 November 2008 Shares 4,736 Nil
MJ Cooney (benefi cial) 1,934 16,168 12 June 2008 Shares2,170 16,169 14 November 2008 Shares 5,104 1,000
MJ Cooney (non benefi cial) - - - Bonds 150,000 150,000- - - Shares 103,878,838 103,878,838
AT Jackson 840 6,259 14 November 2009 Shares 840 Nil
IS Knowles 1,934 16,168 12 June 2008 Shares2,170 16,169 14 November 2008 Shares 4,104 Nil
HRL Morrison (non benefi cial) - - - Shares 159,215,388 159,215,388
Hettinger nominees Limited (benefi cial) 1,934 16,168 12 June 2008 Shares2,170 16,169 14 November 2008 Shares 4,104 Nil
Swier Family Trust (benefi cial) 3,287 27,479 12 June 2008 Shares3,467 25,834 14 November 2008 Shares 6,754 Nil
The non benefi cial shares recorded for MJ Cooney are held in his capacity as a Director of TECT Holdings Limited.
The non benefi cial bonds recorded for MJ Cooney are held in his capacity as Trustee for an estate and a private trust.
The shares held benefi cially by MJ Cooney include shares held in his own name and via a family trust.
The non benefi cial shares recorded for HRL Morrison are held in his capacity as a Director of Infratil Limited.
HRL Morrison is a shareholder of Hettinger Nominees Limited.
The interests disclosed for RP Carter relate to non benefi cial interests held through three family trusts.
The Company was not advised of any other security transactions by any Director during the year.

72
Security Holder InformationSubstantial Security Holders
The Company’s register of substantial security holders, prepared in accordance with Section 26 of the Securities Markets Act 1988 recorded the following information at 1 May 2009.
As at 1 May 2009, TrustPower Limited has 315,471,872 ordinary shares on issue.
Security Holder Class of Security Number
Infratil Limited Shares 159,215,388
TECT Holdings Limited Shares 103,878,838
Spread of Holders (as at 1 May 2009)
Shares Holders % Shares %
1 to 999 1,230 9.24% 558,501 0.18%
1,000 to 1,999 1,861 13.99% 2,232,711 0.71%
2,000 to 4,999 9,097 68.36% 21,055,568 6.67%
5,000 to 9,999 726 5.46% 4,602,382 1.46%
10,000 to 49,999 341 2.56% 5,468,966 1.73%
50,000 to 99,999 17 0.13% 1,173,520 0.37%
100,000 to 499,999 21 0.16% 4,981,945 1.58%
500,000 to 999,999 3 0.02% 2,439,399 0.77%
1,000,000 plus 10 0.08% 272,958,880 86.53%
13,306 100.00% 315,471,872 100.00%
Bonds Holders % Bonds %
1 to 999 - 0.00% - 0.00%
1,000 to 1,999 - 0.00% - 0.00%
2,000 to 4,999 2 0.03% 5,000 0.00%
5,000 to 9,999 707 12.00% 3,989,000 1.51%
10,000 to 49,999 3,907 66.29% 80,899,000 30.73%
50,000 to 99,999 866 14.69% 49,448,000 18.78%
100,000 to 499,999 370 6.28% 54,233,000 20.60%
500,000 to 999,999 22 0.37% 12,723,000 4.83%
1,000,000 plus 20 0.34% 62,008,000 23.55%
5,894 100.00% 263,305,000 100.00%
Shares Holders % Shares %
New Zealand 13,062 98.16% 313,445,684 99.35%
Australia 173 1.30% 1,887,726 0.60%
United Kingdom 25 0.19% 48,108 0.02%
United States of America 13 0.10% 28,709 0.01%
Other 33 0.25% 61,645 0.02%
13,306 100.00% 315,471,872 100.00%
Bonds Holders % Bonds %
New Zealand 5,837 99.03% 259,477,000 98.55%
Australia 15 0.25% 1,435,000 0.54%
United States of America 8 0.14% 230,000 0.09%
United Kingdom 7 0.12% 349,000 0.13%
Other 27 0.46% 1,814,000 0.69%
5,894 100.00% 263,305,000 100.00%
Voting Rights
Every shareholder present in person, by proxy or by representative, on a vote by voices or a show of hands has one vote, and on a poll has one vote for each fully paid share held.
Stock Exchange Listing
The Company’s shares and bonds are listed on the NZSX and NZDX, respectively.
Current Credit Rating Status
TrustPower does not currently have an external credit rating.

TrustPower / Annual Report 2009 / 73
Current NZX Waivers
NZX has granted a waiver dated 23 March 2006 from NZSX Listing Rule 8.1.7 (change of option exercise price or number of underlying securities) to enable the Company to issue options under the Company’s Executive Share Option Plan dated 28 February 2006 (as amended on 12 May 2006) in accordance with the exercise price formula contained in the Rules of the Plan. That exercise price formula permits the exercise price to be recalculated on a daily basis which may not be permitted by Listing Rule 8.1.7. The waiver has been granted on the condition that options outstanding issued under the Plan do not exceed 1% of the total shares of the Company. This waiver was varied on 6 July 2006 to permit TrustPower to vary the exercise price of Options issued on 29 May 2006 by amending the formula to permit the dividend with a record date of 26 May 2006 to be included in the calculation of the exercise price, notwithstanding that the record date of such dividends was prior to the issue date of the Options.
NZX Disciplinary Action
There has been no action taken by NZX in relation to the Company under Listing Rule 5.4.2.
Largest Security Holders (as at 1 May 2009)
Rank Holder Name Shares %
1 Infratil Limited 159,215,388 50.47%
2 TECT Holdings Limited 103,878,838 32.93%
3 Custodial Services Limited A/C 3 2,618,236 0.83%
4 Citibank Nominees (New Zealand) Limited* 1,521,981 0.48%
5 NZ Superannuation Fund Nominees Limited* 1,502,106 0.48%
6 National Nominees New Zealand Limited* 1,261,177 0.40%
7 AMP Investments Strategic Equity Growth Fund* 1,210,398 0.38%
8 ANZ Nominees Limited* 1,071,179 0.34%
9 Premier Nominees Ltd - ING Wholesale Australasian Share Fund* 1,025,349 0.33%
10 NZGT Nominees Limited - AIF Equity Fund* 915,206 0.29%
11 Custodial Services Limited A/C 2 872,070 0.28%
12 Accident Compensation Corporation 652,123 0.21%
13 FNZ Custodians Limited 463,036 0.15%
14 Custodial Services Limited A/C 1 381,895 0.12%
15 Brett Anthony Hart 302,000 0.10%
16 HSBC Nominees (New Zealand) Limited* 285,692 0.09%
17 Custodial Services Limited A/C 4 278,966 0.09%
18 ASB Nominees Limited 100652 ML A/C 272,250 0.09%
19 Superlife Trustee limited 271,760 0.09%
20 Custody And Investment Nominees Limited* 259,906 0.08%
278,259,556 88.23%
* These names are registered in the name of New Zealand Central Securities Depository Limited.
Rank Holder Name Bonds %
1 Custodial Services Limited A/C 3 19,218,000 7.30%
2 FNZ Custodians Limited 6,846,000 2.60%
3 Custodial Services Limited A/C 2 6,598,000 2.51%
4 Investment Custodial Services Limited A/C C 3,123,000 1.19%
5 Sterling Holdings Limited 2,861,000 1.09%
6 Eastern Central Community Trust Inc 2,750,000 1.04%
7 TEA Custodians Limited* 2,635,000 1.00%
8 Forsyth Barr Custodians Limited Account 1 M 2,287,000 0.87%
9 NZ Guardian Trust Investment Nominees Limited* 2,165,000 0.82%
10 Custodial Services Limited A/C 1 1,959,000 0.74%
11 Custodial Services Limited A/C 4 1,740,000 0.66%
12 Presbyterian Savings & Development Society Of NZ Inc 1,250,000 0.47%
13 Brycharl Corporation Limited 1,217,000 0.46%
14 Forsyth Barr Custodians Limited Account 1 L 1,184,000 0.45%
15 Private Nominees Limited Resident A/C 1,175,000 0.45%
16 Carter Holt Harvey Retirement Plan 1,000,000 0.38%
17 F S Investments Limited 1,000,000 0.38%
18 New Zealand Methodist Trust Association 1,000,000 0.38%
19 Palmerston North City Council 1,000,000 0.38%
20 Faith Priscilla Taylor & Andrew Thomas Taylor 1,000,000 0.38%
62,008,000 23.55%
* These names are registered in the name of New Zealand Central Securities Depository Limited.
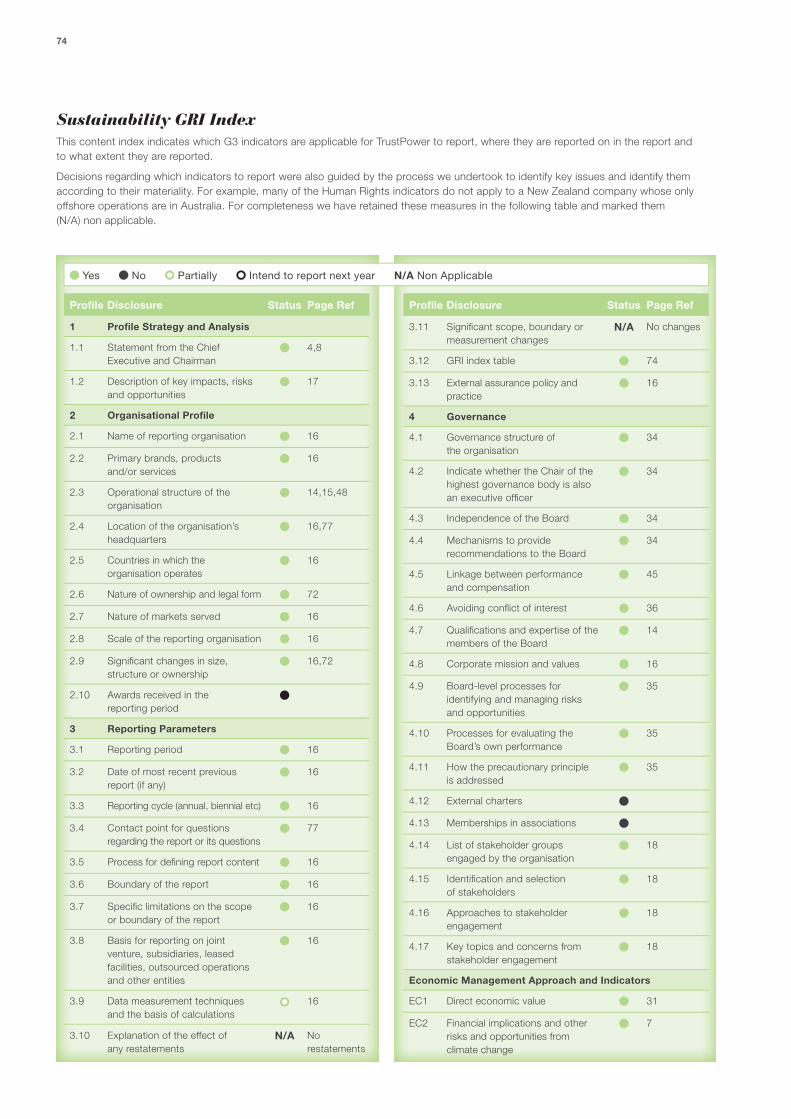
74
Sustainability GRI IndexThis content index indicates which G3 indicators are applicable for TrustPower to report, where they are reported on in the report and to what extent they are reported.
Decisions regarding which indicators to report were also guided by the process we undertook to identify key issues and identify them according to their materiality. For example, many of the Human Rights indicators do not apply to a New Zealand company whose only offshore operations are in Australia. For completeness we have retained these measures in the following table and marked them (N/A) non applicable.
3.11 Signifi cant scope, boundary or measurement changes
N/A No changes
3.12 GRI index table 74
3.13 External assurance policy and practice
16
4 Governance
4.1 Governance structure of the organisation
34
4.2 Indicate whether the Chair of the highest governance body is also an executive offi cer
34
4.3 Independence of the Board 34
4.4 Mechanisms to provide recommendations to the Board
34
4.5 Linkage between performance and compensation
45
4.6 Avoiding confl ict of interest 36
4.7 Qualifi cations and expertise of the members of the Board
14
4.8 Corporate mission and values 16
4.9 Board-level processes for identifying and managing risks and opportunities
35
4.10 Processes for evaluating the Board’s own performance
35
4.11 How the precautionary principle is addressed
35
4.12 External charters
4.13 Memberships in associations
4.14 List of stakeholder groups engaged by the organisation
18
4.15 Identifi cation and selection of stakeholders
18
4.16 Approaches to stakeholder engagement
18
4.17 Key topics and concerns from stakeholder engagement
18
Economic Management Approach and Indicators
EC1 Direct economic value 31
EC2 Financial implications and other risks and opportunities from climate change
7
Yes No Partially Intend to report next year N/A Non Applicable
Profi le Disclosure Status Page Ref Profi le Disclosure Status Page Ref
1 Profi le Strategy and Analysis
1.1 Statement from the Chief Executive and Chairman
4,8
1.2 Description of key impacts, risks and opportunities
17
2 Organisational Profi le
2.1 Name of reporting organisation 16
2.2 Primary brands, products and/or services
16
2.3 Operational structure of the organisation
14,15,48
2.4 Location of the organisation’s headquarters
16,77
2.5 Countries in which the organisation operates
16
2.6 Nature of ownership and legal form 72
2.7 Nature of markets served 16
2.8 Scale of the reporting organisation 16
2.9 Signifi cant changes in size, structure or ownership
16,72
2.10 Awards received in the reporting period
3 Reporting Parameters
3.1 Reporting period 16
3.2 Date of most recent previous report (if any)
16
3.3 Reporting cycle (annual, biennial etc) 16
3.4 Contact point for questions regarding the report or its questions
77
3.5 Process for defi ning report content 16
3.6 Boundary of the report 16
3.7 Specifi c limitations on the scope or boundary of the report
16
3.8 Basis for reporting on joint venture, subsidiaries, leased facilities, outsourced operations and other entities
16
3.9 Data measurement techniques and the basis of calculations
16
3.10 Explanation of the effect of any restatements
N/A Norestatements

TrustPower / Annual Report 2009 / 75
Yes No Partially Intend to report next year N/A Non Applicable
Profi le Disclosure Status Page Ref Profi le Disclosure Status Page Ref
EC3 Defi ned benefi t plan obligations N/A No plan in place
EC4 Signifi cant fi nancial assistance received from government
N/A None received
EC5 Entry level wage compared to minimum wage
EC6 Spending on locally-based suppliers
EC7 Procedures and practice for local hiring
27
EC8 Infrastructure investments and services
6,10
EC9 Signifi cant indirect economic impacts
12
Environmental Management Approach and Indicators
EN1 Materials used by weight or volume 29
EN2 Percentage of recycled input materials used
29
EN3 Direct energy consumption by primary energy source
29
EN4 Indirect energy consumption by primary source (core)
29
EN5 Energy saved: conservation and effi ciency improvements
29
EN6 Renewable energy-based products and services
16
EN7 Initiatives to reduce indirect energy consumption
29
EN8 Water used for processing 29
EN9 Water sources signifi cantly affected by withdrawal of water
29
EN10 Percentage and total volume of water recycled and reused
29
EN11 Land owned, leased, managed in, or adjacent to, protected areas and areas of high biodiversity value outside protected areas
EN12 Impacts on biodiversity 28
EN13 Habitats protected and restored 13
EN14 Strategies for managing impacts on biodiversity
29
EN15 Endangered species with habitats in areas affected by operations
28
EN16 Greenhouse gas emissions 29
EN17 Other relevant indirect greenhouse gas emissions by weight
EN18 Initiatives to reduce greenhouse gas emissions and reductions achieved
17
EN19 Emissions of ozone-depleting substances
EN20 Emissions effl uents and waste 30
EN21 Water discharge by quality and destination
29
EN22 Total weight of waste by type and disposal method
EN23 Total number and volume of signifi cant spills
29
EN24 Transported hazardous waste N/A None transported
EN25 Impact on water bodies 29
EN26 Initiatives to mitigate environmental impacts of products and services
29
EN27 Percentage of products sold and their packaging materials that are reclaimed
N/A No packaging materials used
EN28 Monetary value of signifi cant fi nes and total number of non-monetary sanctions for non-compliance with environmental laws and regulations
29
EN29 Transport impacts 29
EN30 Environmental protection expenditures and investments
Labour Management Approach and Indicators
LA1 Total workforce by employment type, employment contract, and region
16
LA2 Total number and rate of employee turnover
27
LA3 Benefi ts provided to full-time employees that are not provided to temporary or part-time employees
LA4 Percentage of employees covered by collective bargaining agreements
LA5 Minimum notice period(s) regarding signifi cant operational changes
LA6 Health and safety programmes 27
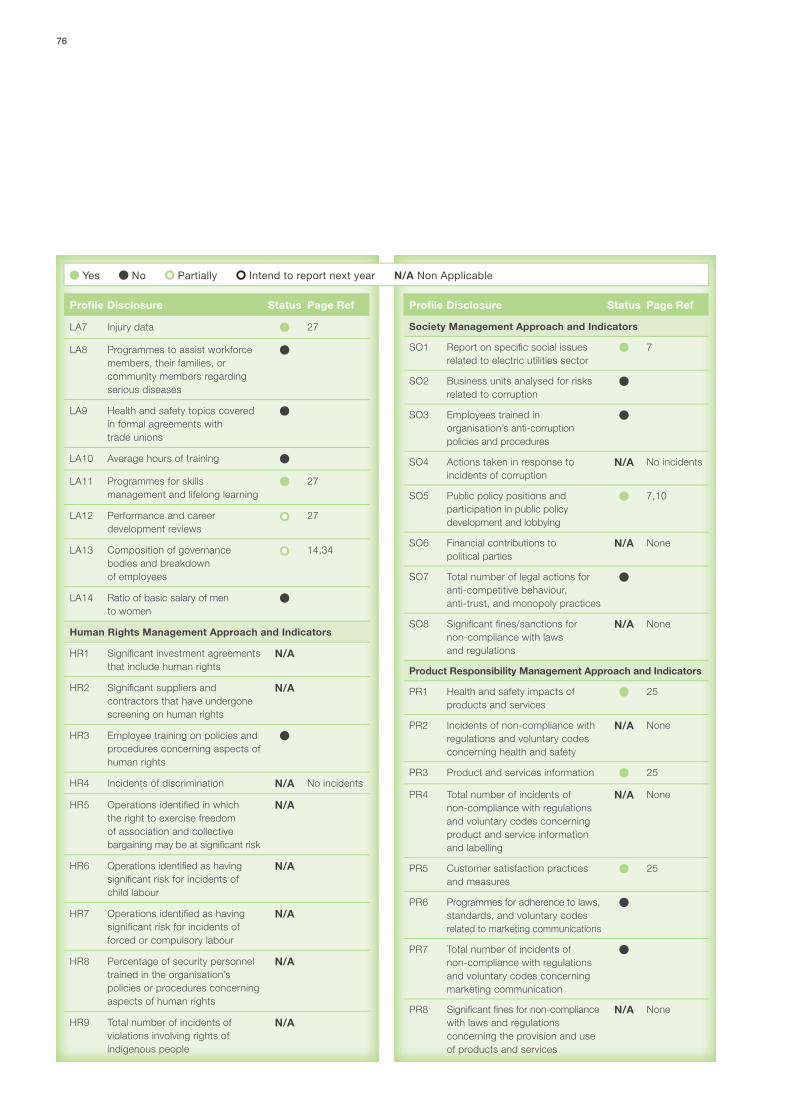
76
Yes No Partially Intend to report next year N/A Non Applicable
Profi le Disclosure Status Page Ref Profi le Disclosure Status Page Ref
LA7 Injury data 27
LA8 Programmes to assist workforce members, their families, or community members regarding serious diseases
LA9 Health and safety topics covered in formal agreements with trade unions
LA10 Average hours of training
LA11 Programmes for skills management and lifelong learning
27
LA12 Performance and career development reviews
27
LA13 Composition of governance bodies and breakdown of employees
14,34
LA14 Ratio of basic salary of men to women
Human Rights Management Approach and Indicators
HR1 Signifi cant investment agreements that include human rights
N/A
HR2 Signifi cant suppliers and contractors that have undergone screening on human rights
N/A
HR3 Employee training on policies and procedures concerning aspects of human rights
HR4 Incidents of discrimination N/A No incidents
HR5 Operations identifi ed in which the right to exercise freedom of association and collective bargaining may be at signifi cant risk
N/A
HR6 Operations identifi ed as having signifi cant risk for incidents of child labour
N/A
HR7 Operations identifi ed as having signifi cant risk for incidents of forced or compulsory labour
N/A
HR8 Percentage of security personnel trained in the organisation’s policies or procedures concerning aspects of human rights
N/A
HR9 Total number of incidents of violations involving rights of indigenous people
N/A
Society Management Approach and Indicators
SO1 Report on specifi c social issues related to electric utilities sector
7
SO2 Business units analysed for risks related to corruption
SO3 Employees trained in organisation’s anti-corruption policies and procedures
SO4 Actions taken in response to incidents of corruption
N/A No incidents
SO5 Public policy positions and participation in public policy development and lobbying
7,10
SO6 Financial contributions to political parties
N/A None
SO7 Total number of legal actions for anti-competitive behaviour, anti-trust, and monopoly practices
SO8 Signifi cant fi nes/sanctions for non-compliance with laws and regulations
N/A None
Product Responsibility Management Approach and Indicators
PR1 Health and safety impacts of products and services
25
PR2 Incidents of non-compliance with regulations and voluntary codes concerning health and safety
N/A None
PR3 Product and services information 25
PR4 Total number of incidents of non-compliance with regulations and voluntary codes concerning product and service information and labelling
N/A None
PR5 Customer satisfaction practices and measures
25
PR6 Programmes for adherence to laws, standards, and voluntary codes related to marketing communications
PR7 Total number of incidents of non-compliance with regulations and voluntary codes concerning marketing communication
PR8 Signifi cant fi nes for non-compliance with laws and regulations concerning the provision and use of products and services
N/A None

TrustPower / Annual Report 2009 / 77
Board of DirectorsBruce J Harker – ChairmanSir Ronald P CarterMichael J CooneyI Sam KnowlesHR Lloyd MorrisonGeoffrey JC SwierMarko Bogoievski (Alternate Director for HRL Morrison)
Registered Offi ceTrustPower BuildingTruman RoadTe MaungaMount Maunganui
Websitewww.trustpower.co.nz
Email [email protected]
Postal AddressPrivate Bag 12023Tauranga Mail CentreTauranga 3143Telephone: 07 574 4800Facsimile: 07 574 4825
AuditorsPricewaterhouseCoopers188 Quay StreetAuckland 1142
Share RegistrarComputershare Investor Services Limited159 Hurstmere RoadTakapunaPrivate Bag 92119Auckland 1142Telephone: 09 488 8700Facsimile: 09 488 8787
Shareholders with enquiries about transactions, change of address or dividend payments should contact the Share Registrar.
Stock Exchange LisitingNew Zealand Exchange LimitedLevel 2 NZX Centre11 Cable StreetWellington 6011
Annual Meeting . . . . . . . . . . . . . . . . . . . . . . . . . . 30 July 2009First quarter operating information . . . . . . . . 30 July 2009Payment September bond interest . . 15 September 2009Half year announcement . . . . . . . . . . . . . 30 October 2009Record date interim dividend . . . . . . 27 November 2009Payment December bond interest . . 15 December 2009Payment interim dividend . . . . . . . . . 15 December 2009
Third quarter operating information . . . . 5 February 2010Payment of March bond interest . . . . . . . 15 March 2010Full year announcement . . . . . . . . . . . . . . . . . . 14 May 2010Record date of fi nal dividend . . . . . . . . . . . . . 28 May 2010Payment of fi nal dividend . . . . . . . . . . . . . . . . 15 June 2010Payment of June bond interest . . . . . . . . . . 15 June 2010Annual report due . . . . . . . . . . . . . . . . . . . . . . 30 June 2010
Directory
Financial Calendar