predicting crowd behavior with big public data
DESCRIPTION
CAN TWITTER PREDICT MAJOR EVENTS? A NEW STUDY SAYS YES http://www.fastcompany.com/3026593/fast-feed/can-twitter-predict-major-events-a-new-study-says-yesTRANSCRIPT
Predicting Crowd Behavior with Big Public Data
Nathan KallusMassachusetts Institute of Technology
77 Massachusetts Ave E40-149Cambridge, MA 02139
ABSTRACTWith public information becoming widely accessible andshared on today’s web, greater insights are possible intocrowd actions by citizens and non-state actors such as largeprotests and cyber activism. We present efforts to predictthe occurrence, specific timeframe, and location of such ac-tions before they occur based on public data collected fromover 300,000 open content web sources in 7 languages, fromall over the world, ranging from mainstream news to gov-ernment publications to blogs and social media. Using natu-ral language processing, event information is extracted fromcontent such as type of event, what entities are involved andin what role, sentiment and tone, and the occurrence timerange of the event discussed. Statements made on Twitterabout a future date from the time of posting prove partic-ularly indicative. We consider in particular the case of the2013 Egyptian coup d’etat. The study validates and quanti-fies the common intuition that data on social media (beyondmainstream news sources) are able to predict major events.
KeywordsWeb and social media mining, Twitter analysis, Crowd be-havior, Forecasting, Event extraction, Temporal analytics,Sentiment analysis, Online activism
1. INTRODUCTIONThe manifestation of crowd actions such as mass demon-
strations often involves collective reinforcement of sharedideas. In today’s online age, much of this public conscious-ness and comings together has a significant presence onlinewhere issues of concern are discussed and calls to arms arepublicized. The Arab Spring is oft cited as an example ofthe new importance of online media in the formation of massprotests [6]. While the issue of whether mobilization occursonline is highly controversial, that nearly all crowd behaviorin the internet-connected world has some presence online isnot. So while it may be infeasible to predict an action de-veloping in secret in a single person’s mind, the ready acces-
Copyright is held by the International World Wide Web Conference Com-mittee (IW3C2). IW3C2 reserves the right to provide a hyperlink to theauthor’s site if the Material is used in electronic media.WWW’14 Companion, April 7–11, 2014, Seoul, Korea.ACM 978-1-4503-2745-9/14/04.http://dx.doi.org/10.1145/2567948.2579233.
sibility to public information on the web that future crowdsmay now be reading and reacting to or members of whichare now posting on social media can offer glimpses into theformation of this crowd and the action it may take.
News from mainstream sources from all over the worldcan now be accessed online and about 500 million tweets areposted on Twitter each day with this rate growing steadily[14]. Blogs and online forums have become a common med-ium for public discourse and many government publicationsare offered for free online. We here investigate the potentialof this publicly available information online for predictingmass actions that are so significant that they garner widemainstream attention from around the world. Because theseare events perpetrated by human actions, they are in a wayendogenous to the system, enabling prediction.
But while all this information is in theory public and ac-cessible and could lead to important insights, gathering it alland making sense of it is a formidable task. We here use datacollected by Recorded Future (www.recordedfuture.com).Scanning over 300,000 different open content web sources in7 different languages and from all over the world, mentionsof events—in the past, current, or said to occur in future—are continually extracted at a rate of approximately 50 ex-tractions per second. Using natural language processing,the type of event, the entities involved and how, and thetimeframe for the event’s occurrence are resolved and madeavailable for analysis. With such a large dataset of what isbeing said online ready to be processed by a computer pro-gram, the possibilities are infinite. For one, as shown herein,the gathering of crowds into a single action can often be seenthrough trends appearing in this data far in advance.
We here study the cases of mass protests and politicallymotivated cyber campaigns involving an entity of interest,such as a country, city, or organization. We use historicaldata of event mentions online, in particular forward-lookingmentions of events yet to take place, to forecast the occur-rence of these in the future. We can make predictions aboutparticular timeframes in the future with high accuracy.
We find that the mass of publicly available informationonline has the power to unveil the future actions of crowds.Measuring the trends in sheer numbers we are here able toaccurately predict protests in countries and in cities andlarge cyber campaigns by target and by perpetrator. Afterassembling our prediction mechanism for significant protests,we investigate the case of the 2013 Egyptian coup d’etat andhow well we were able to foresee the protests surrounding it.
The ability to forecast these things has important ramifi-cations. Countries and cities faced with a high likelihood of
arX
iv:1
402.
2308
v1 [
cs.S
I] 1
0 Fe
b 20
14
significant protest can prepare themselves and their citizensto avoid any unnecessary violence and damages. Companieswith personnel and supply chain operations can ask theiremployees to stay at home and to remain apolitical and canattempt to safeguard their facilities in advance. Countries,companies, and organizations faced with possible cyber cam-paigns against them can beef up their cyber security in an-ticipation of attacks or even preemptively address the causefor the anger directed at them.
Recent work has used online media to glean insight intoconsumer behavior. In [2] the authors mine Twitter for in-sights into consumer demand with an application to fore-casting movie earnings. In [8] the authors use blog chat-ter captured by IBM’s WebFountain [7] to predict Amazonbook sales. These works are similar to this one in that theyemploy very large data sets and observe trends in crowdbehavior by huge volumes. Online web searches have beenused to describe consumer behavior, most notably in [3] and[5], and to predict movements in the stock market in [4].
In [13] the authors study correlations between singularevents with occurrence defined by coverage in the New YorkTimes. By studying when does one target event ensue an-other specified event sometime in the future, the authorsdiscover truly novel correlations between events such as be-tween natural disasters and disease outbreaks. Here we areinterested in the power of much larger, more social, and morevaried datasets in pointing out early trends in endogenousprocesses (actions by people discussed by people) that canhelp predict all occurrences of an event and pinning downwhen they will happen, measuring performance with respectto each time window for prediction. One example of the im-portance of a varied dataset that includes both social mediaand news in Arabic is provided in the next section.
We here seek to study the predictive power of such webintelligence data and not simply the power of standard ma-chine learning algorithms (e.g. random forests vs. SVMs).Therefore we present only the learning machine (random for-est in the case of predicting protests) that performed best onthe training data and compare it to a data-poor maximum-likelihood random-walk predictor that predicts for the fu-ture the situation today. The data used in this study hasbeen made available for download at www.nathankallus.
com/PredictingCrowdBehavior/.We first discuss what predictive signals we expect to find
in order to motivate our constructions. We then review howmentions of events, entities, and times are extracted fromthe wide breadth of sources. Using this data we develop apredictive mechanism to predict significant protests in coun-tries and in cities. We consider the case of the 2013 Egyp-tian coup d’etat and conclude. In an appendix we considerfinding more general patterns in the data, motivating anapplication of the naıve Bayes classifier to high-dimensionalsequence mining in massive datasets, which we use to fore-cast cyber attack campaigns by target or perpetrator.
2. PREDICTIVE SIGNALS IN PUBLIC DATAWe begin by exemplifying anecdotally the precursory sig-
nals that exist in public data for large protests. On SundayJune 9, 2013 a Beirut protest against Hezbollah’s interfer-ence in Syria turned violent when clashes with Hezbollahsupporters left one protester dead [11]. The story was widelyreported on June 9 including in Western media, attractingmore mainstream news attention than any protest event in
Lebanon in over a year marking it as a significant protest.But not only were there signs that the protest would oc-
cur before it did, there were signs it may be large and itmay turn violent. The day before, Algerian news source En-nahar published an article with the headline “Lebanese fac-tion organizes two demonstrations tomorrow rejecting theparticipation of Hezbollah in the fighting in Syria” (trans-lated from Arabic using Google Translate). There was littleother preliminary mainstream coverage and no coverage (toour knowledge) appeared in mainstream media outside ofthe Middle-East-North-Africa (MENA) region or in any lan-guage other than Arabic. Moreover, without further contextthere would be little evidence to believe that this protest, ifit occurs at all, would become large enough or violent enoughto garner mainstream attention from around the world.
However, already by June 5, four days earlier, there weremany Twitter messages calling people to protest on Sunday,saying “Say no to #WarCrimes and demonstrate against#Hezbollah fighting in #Qusayr on June 9 at 12 PM inDowntown #Beirut” and “Protest against Hezbollah beingin #Qusair next Sunday in Beirut.” In addition, discussionaround protests in Lebanon has included particularly vio-lent words in days prior. A June 6 article in TheBlaze.comreported, “Fatwa Calls For Suicide Attacks Against Hezbol-lah,” and a June 4 article in the pan-Arabian news portalAl Bawaba reported that, “Since the revolt in Syria, the se-curity situation in Lebanon has deteriorated.” A May 23article in The Huffington Post mentioned that, “The re-volt in Syria has exacerbated tensions in Lebanon, which... remains deeply divided.” Within this wider context, un-derstood through the lens of web-accessible public informa-tion such as mainstream reporting from around the worldand social media, there was a significant likelihood that theprotest would be large and turn violent. These patternspersist across time; see Figure 1.
It is these predictive signals that we would like to minefrom the web and employ in a learning machine in orderto forecast significant protests and other crowd behavior.In this case, it is critical that we spread a wide net onmany sources so to catch mentions in non-Western mediaand foreign-language Tweets along with mentions in media(such as Reuters) and languages (such as English) with amore global reach.
3. EVENT EXTRACTION AND TEMPORALANALYSIS
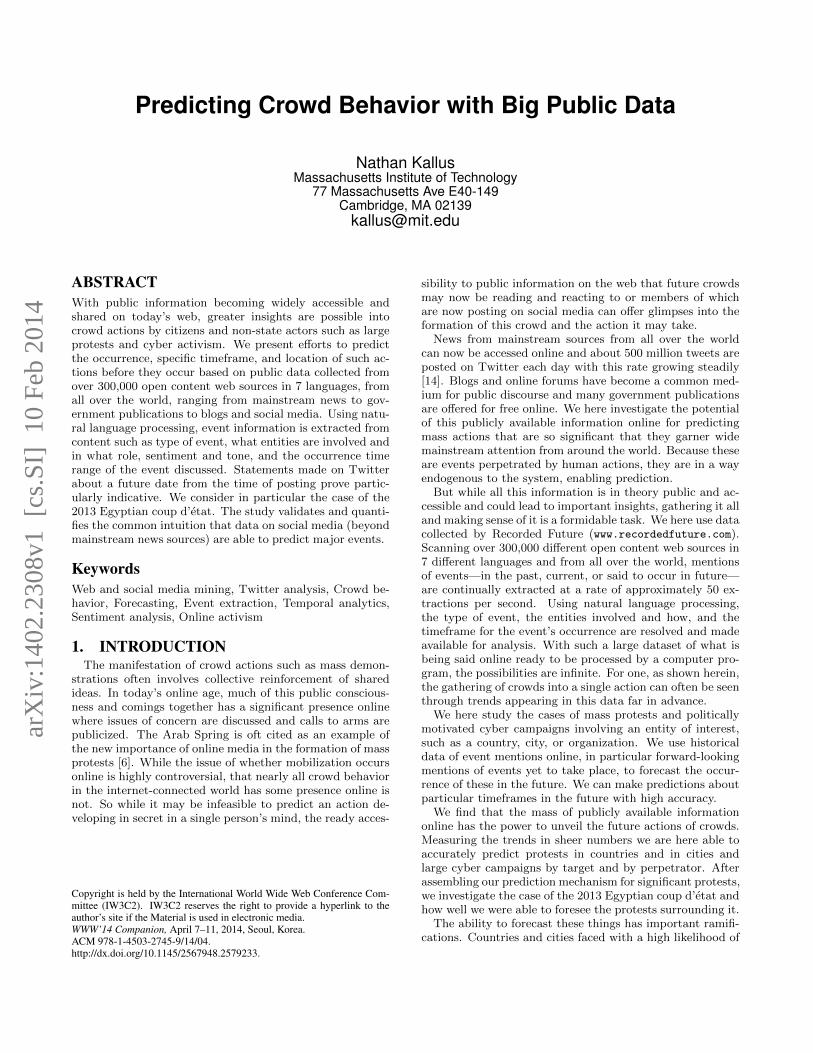
To quantify these signals we will look at time-stampedevent-entity data. The data harvesting process extractsmentions of events from the plethora of documents continu-ally gathered from the over 300,000 sources being monitored.An important aspect is that the event mentions are tagged
Mainstream news
Forward-looking tweets
9�15 10�1 10�15 11�1 11�15Day
50
100
Reports of protest in Lebanon by publish day
Figure 1: Number of same-day news reports of protest inLebanon (red) and tweets mentioning protests said to occurover the next three days (blue). Red spikes often follow bluespikes or otherwise have a recognizable convex ramp-up.

with the time range in which the event is said to occur in themention so that forward-looking statements, such as plansto protest, can be directly tied to a future time and place.Event extractions are done in Arabic, English, Farsi, French,Russian, Spanish, and Simplified and Traditional Chinese.
There are several elements in the event, entity, and timeextraction process. For each document mined from the web,an ensemble of off-the-shelf natural language processing toolsare used to extract tokens (lemma, root, stem, and part ofspeech) and entities. Entities extracted by each tool arethen combined and resolved into a database of canonicalentities for disambiguation. Documents are categorized bytopic. Entities that are not agreed upon by the various toolsand are far-fetched given the topic are rejected. Ontologiesof structured entity relationships constructed from online s-ources (such as DBpedia) are used to guide filtering andprovide a gazetteer for additional entity extraction.
Given the set of filtered entities, a statement extractorlinks these entities to events stated in the document. Eventsare again extracted using an ensemble method of off-the-shelf tools and a custom made tool that relies on the abovetokenization. Each event from the various extraction sourcesis matched up with a particular text fragment from the docu-ment that best represents it. Next, n-grams in the documentare matched against phrase lists organized by sentiment ortone and the fraction of these in the fragment is recorded.
All time statements made in the document are separatelyextracted. The tokenization of the document is parsed bya dependency grammar using the data-driven parser Malt-Parser [10] to construct a dependency graph of the docu-ment. This is used to find time statements, both relative(e.g. “next summer”) and absolute. Comprehending thesein machine time is based on several contextual cues. Cul-tural and regional categorizations are extracted from thedocument to inform such things as relevant hemisphere forseasons, which is the first day of the week, standard dateformats (month first or day first), and timezone. Moreover,contexts such as publishing date are noted. Using these,all time statements made in the document are converted tostandardized time-stamps, with specificity varying from sec-ond to year. Event mentions are then matched up with themost relevant time statement to the event statement basedon sentence dependency.
In all, events are marked by type of event, time rangeof event, entities involved, role of entities involved, entitiesmentioned, sentiment and tone, and origin. Some post-processing is done on the event-entity level to further im-prove quality based on special curated ontologies. For ex-ample, known hacker groups such as Anonymous constituteone such ontology and if mentioned in a cyber event butnot clearly as the perpetrator these are assumed to be sononetheless. Similarly, impossible events are rejected. Forexample, one ontology keeps track of death dates of peoplebased primarily on information harvested from Wikipediaand assists in rejecting the event “Marco Polo will travel toChina in 2015” as impossible because Marco Polo is dead.
The precision of event extraction is measured by work-ers on the Amazon Mechanical Turk (mturkers). To testthe precision of time-stamping, for each language language-specific Human Intelligence Tasks (HITs) are constructed fora random sample. Each HIT consists of the text fragment,the extracted time-stamp, and the question “is extractedtime right or wrong?” and is given to three mturkers. It
Country All Twitter Country All TwitterAfghanistan 60918 27655 Lebanon 44153 23394Bahrain 246136 177310 Libya 162721 69437Egypt 944998 397105 Nigeria 70635 38700Greece 122416 70521 Pakistan 289643 213636India 491475 274027 S. Arabia 39556 13670Indonesia 34007 17120 Sudan 28680 13654Iran 118704 53962 Syria 212815 79577Italy 65569 43803 Tunisia 99000 27233Jordan 35396 19369 Yemen 70583 16712
Table 1: Protest event mentions in the corpus.
is declared successful if at least two answer “right.” For ex-ample, the precision of time-stamping in both English andSpanish is measured at 93%, in Arabic at 90%, and in Simpli-fied Chinese at 82%. The precision of the event extraction ismeasured similarly by type. Protest events in English comein at 84%. Malware threat events in English come in at 96%and in Simplified Chinese at 90%.
4. PREDICTING SIGNIFICANT PROTESTSWe now turn our attention to the use of this event data
to the prediction of significant protests around the world.Our first forecasting question will revolve around predict-ing significant protests on the country level and consideringthat country alone. That is, a significant protest is one thatreceives much more same-day mainstream reporting than isusual for that country. So while most days a business withsupply chain operations in Egypt operate under the usualvolatile circumstances (since 2011) of Egypt—certainly morevolatile than, say, Jordan and receiving much more atten-tion for it—they are interested in receiving advance notice ofprotests that are going to be larger and more dangerous thanthe ordinary for Egypt. The same for another milieu. At thesame time, we will use past patterns from other countries toinform the prediction mechanism when making a predictionabout one country. In fact, the prediction mechanism willnot be knowledgeable of the particular country in questionbut instead just the type of country, quantified by clustermembership. In an appendix we also investigate the ques-tion of predicting protests that are significant relative to acommon baseline and on the city level instead.
We restrict to a selection of 18 countries: Afghanistan,Bahrain, Egypt, Greece, India, Indonesia, Iran, Italy, Jor-dan, Lebanon, Libya, Nigeria, Pakistan, Saudi Arabia, Su-dan, Syria, Tunisia, and Yemen. We will consider all protestevent mentions in any of these countries being publishedany time between January 1, 2011 and July 10, 2013 as theevent mention corpus. January 1, 2011 up to March 5, 2013will serve for supervised training (and validation by cross-validation) and since March 6, 2013 up to July 10, 2013 willserve for test and performance scoring. Let
Mcs(i, j) =
Number of event mentions of protest incountry c taking place on day j extractedfrom documents published on day i fromsources of type s
We tabulate some totals of these numbers over the wholeevent mention corpus in Table 1. For example, nearly onemillion mentions of a protest event in Egypt occur in thedata, over a third of a million on Twitter.
4.1 The Ground SetFor each country, the protests we are interested in fore-
casting are those that are significant enough to garner more-than-usual real-time coverage in mainstream reporting for
11�1�11 12�1�11 1�1�12 2�1�12 3�1�12 4�1�12 5�1�12 6�1�12 7�1�12 8�1�12 9�1�12 10�1�12 11�1�12 12�1�12 1�1�13 2�1�13 3�1�13 4�1�13 5�1�13 6�1�13 7�1�13
"fifth day of fighting thathas posed greatest crisis tothe country since the fallof President Hosni Mubarakin February" –NYTimes 11�23�11
"Crowds of severalhundred thousands... mark the firstanniversary ofuprising" –CBSNews 1�25�12
"The death toll ... rose to 12 ... clashesset off by a deadly soccer riot a fewdays earlier" –NYTimes 2�5�12
"Angry protests erupted insideand outside the court as theformer president..." –CNN 6�2�12
"Protesters ScaleU.S. EmbassyWalls, Tear Do-
wn AmericanFlag" –Time
9�11�12"Mursi defends newpowers amid protests... with tear gas firedat demonstrators andMolotov cocktailsthrown in return"–BBC 11�23�12
"clashed withopposition p-
rotesters out-side the pres-
idential palacein Cairo, withat least 211people injured"–Al Jazeera
12�6�12
"At Least 30 Die inEgyptian Riots Af-
ter Soccer Verdict"–NYTimes
1�26�13"Egypt÷s s-
ecurity po-
lice and pr-
otesters cl-ash: Thou-
sands taketo thestreets"–Boston
Globe2�9�13
"Egypt prot-esters torchpolice stationin Port Said"–Lebanon
Daily Star3�2�13
"Egypt's so-
ccer riot se-
ntence spar-
ks violence,2 killed"–Japan
Herald3�9�13
"4 Die in Egypt as UnrestSpreads Across Country","Army Ousts Egypt's Pr-
esident", "Army Kills 51"–NYTimes
6�28�13, 7�3�13,and 7�8�13
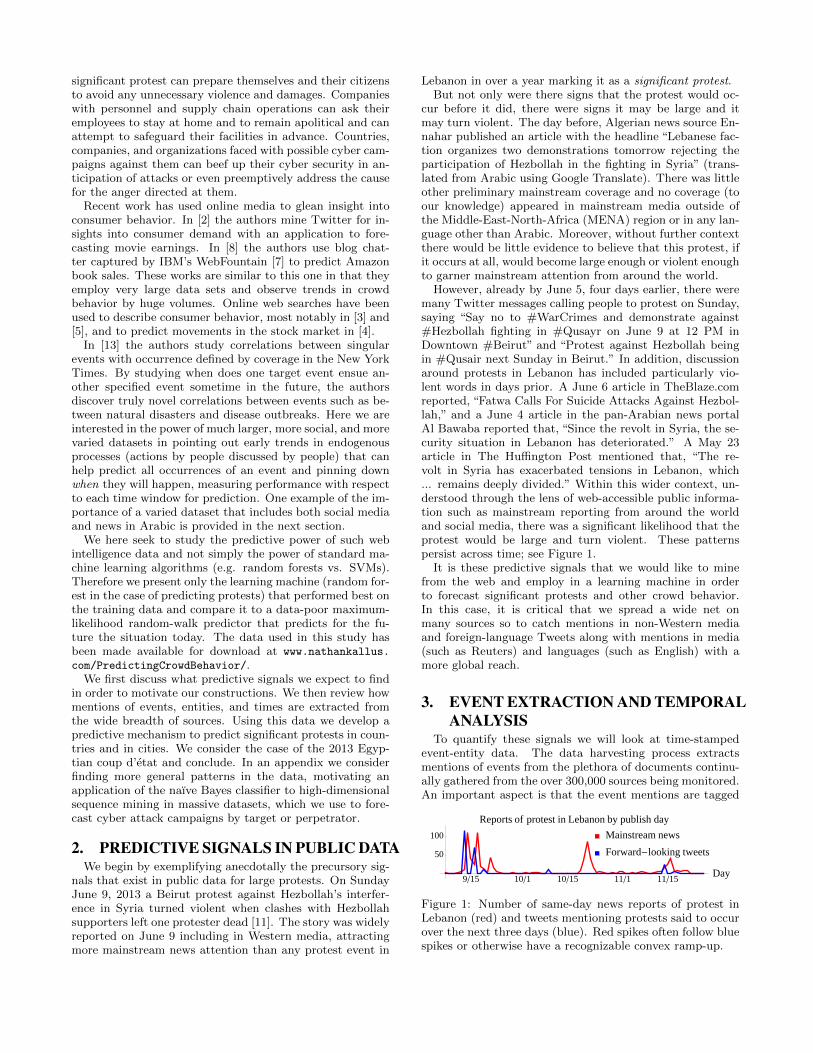
Figure 2: Normalized count of mainstream reports M ′′c (i) in Egypt with annotations for stretches above θ = 2.875 (red line).
the country. That is, there is a significant protest in coun-try c on day i if Mc,Mainstream(i, i) is higher than usual forcountry c (in an appendix we consider an absolute scale forprotest significance which naturally boosts predictability).Since new sources are being added daily by the hundredsor thousands to the Recorded Future source bank, there isa heterogeneous upward trend in the event mention dataand what is more than usual in counts changes. To removethis trend we normalize the mention counts by the averagevolume in the trailing three months. That is, we let
M ′cs(i, i+ k) =Mcs(i, i+ k)
1|Countries|×90
∑c′∈Countries
∑i−1j=i−90Mc′s(j, j + k)
where Countries is the 18 countries. Next we define thetraining-set average of same-day mainstream reporting
M ′c =1
|Train|∑
i∈Train
M ′c,Mainstream(i, i)
where Train denotes the set of days in the training set.Moreover, to smooth the data we consider a three-day
moving average. Then we say, by definition, that a signifi-cant protest in country c (and relative to country c) occursduring the days i− 1, i, i+ 1 if
M ′′c (i) =1
3
i+1∑j=i−1
M ′c,Mainstream(j, j)
M ′c≥ θ
is larger than a threshold θ. The threshold is chosen so toselect only significant protests. By inspecting the data’s cor-respondence to the largest protests, we set θ = 2.875 (whichis also nearly the 94th percentile of the standard exponen-tial distribution). Overall across all countries considered,this resulted in 6% of 3-day stretches to be labeled positive,distributed mostly evenly among the countries.
An example plot of M ′′c (i) for Egypt is shown in Figure2 with annotations of top mainstream news describing theprotests in each stretch of above-threshold days. Notableprotest events provide the reader with anchor points arethe 9/11 anniversary protests in 2012 (concurrent with theBenghazi attacks), the late-June protests leading up to theEgyptian coup d’etat, the riots set off by soccer-fan violencein early 2012, and the riots after 30 of the fans involved weresentenced to death which also coincided with riots connectedto the anniversary of the revolution in early 2013.
4.2 Scoring Protest PredictionsWe are interested in predicting on each day i whether a
significant protest will occur over the next three days i+1, i+2, i+ 3 based on information published on or before i. Thatis, on each day i we wish to predict whether M ′′c (i+ 2) ≥ θ(which depends on days i+ 1, i+ 2, i+ 3).
We quantify the success of a predictive mechanism basedon its balanced accuracy. Let Tci ∈ {0, 1}, Pci ∈ {0, 1}respectively denote whether a significant protest occurs incountry c during the days i+ 1, i+ 2, i+ 3 and whether wepredict there to be one. The true positive rate (TPR) is thefraction of positive instances (Tci = 1) correctly predicted tobe positive (Pci = 1) and the true negative rate (TNR) is thefraction of negative instances predicted negative. The bal-anced accuracy (BAC) is the unweighted average of these:BAC = (TPR + TNR) /2. BAC, unlike the marginal ac-curacy, cannot be artificially inflated. Always predicting“no protest” without using any data will yield a high 94%marginal accuracy but only 50% balanced accuracy. In fact,a prediction without any relevant data will always yield aBAC of 50% on average by statistical independence.
4.3 The FeaturesWe now attempt to quantify the predictive signals we en-
countered anecdotally in Section 2. These features will serveas the data based on which we make predictions.
In Section 2 we exemplified how the violence in languagesurrounding discussion of protest in a country can help setthe context for the danger of a future protest to get outof hand. Each event mention is rated for violent languageby the fraction of n-grams in the corresponding fragment(ignoring common words) that match a phrase list. Let
Vcs(i) =
Total violence rating of fragments asso-ciated with event mentions of protest incountry c extracted from documents pub-lished on day i from sources of type s
Similarly to the normalization of event mentions due to theever-growing source bank, we normalize this quantity as
V ′cs(i) =Vcs(i)
1|Countries|×90
∑c′∈Countries
∑i−1j=i−90 Vc′s(j)
In addition, forward-looking mentions in mainstream newsand Twitter can help indicate whether a protest is planned
and estimate how many might plan to attend. We havealready definedMcs(i, i+k) which counts this data for k ≥ 1.
In order to facilitate trans-country training, we normalizethese features with respect to the series we would like topredict, M ′c,Mainstream(i, i). Similar to the normalization ofM ′′c (i), we normalize these features by a per-country con-
stant coefficient(M ′c)−1
.For the purposes of trans-country training, we hierarchi-
cally cluster the countries using Ward’s method [16] appliedwith the distance between two countries c, c′ equal to theKolmogorov-Smirnov uniform distance between the distri-bution functions of the set of training values of M ′′ ignoringthe time dimension. That is, d(c, c′) =
supz≥0
∣∣∣∣∣ 1
|Train|∑
i∈Train
(I{z ≥M ′′c (i)
}− I{z ≥M ′′c′(i)
})∣∣∣∣∣This distance is also a non-parametric test statistic to testthe the hypothesis that two samples were drawn from thesame distribution. We construct b2
√|Countries|c clusters
using R function hclust [12]. We include as a feature theindicator unit vector of cluster membership of the country cassociated with the instance (c, i). Thus the classifier doesnot know the particular country about which it is making aprediction, just its type as characterized by this clustering.
For each instance (c, i) we also include as features the tenmost recent days of same-day reporting on protest in c,
M ′c,Mainstream(i, i)
M ′c, . . . ,
M ′c,Mainstream(i− 9, i− 9)
M ′calong with the two most recent differences of these values.We also include the violence rating in recent mainstreamreporting as the cumulative partial sums of the values
V ′c,Mainstream(i)
M ′c, . . . ,
V ′c,Mainstream(i− 9)
M ′cNext we include the counts of mentions of protests said oc-
cur over the next three days, published either in mainstreamnews or in Twitter over the ten recent days. We incorporatethis feature as the cumulative partial sums of the values∑3
k=1M′cs(i, i+ k)
M ′c, . . . ,
∑3k=1M
′cs(i− 9, i+ k)
M ′cfor s = Mainstream and s = Twitter.
When predicting farther into the future, about the threedays starting with the kth day from today, we push all in-dexes back by k−1 days, thus excluding any future data andmaintaining the same overall length of the feature vector.
4.4 The ClassifierFor the prediction mechanism we employ a random forest
classifier trained on all data up to March 5, 2013. We usethe R library randomForest [9]. The parameters are left attheir default values as set in the library. For example, the
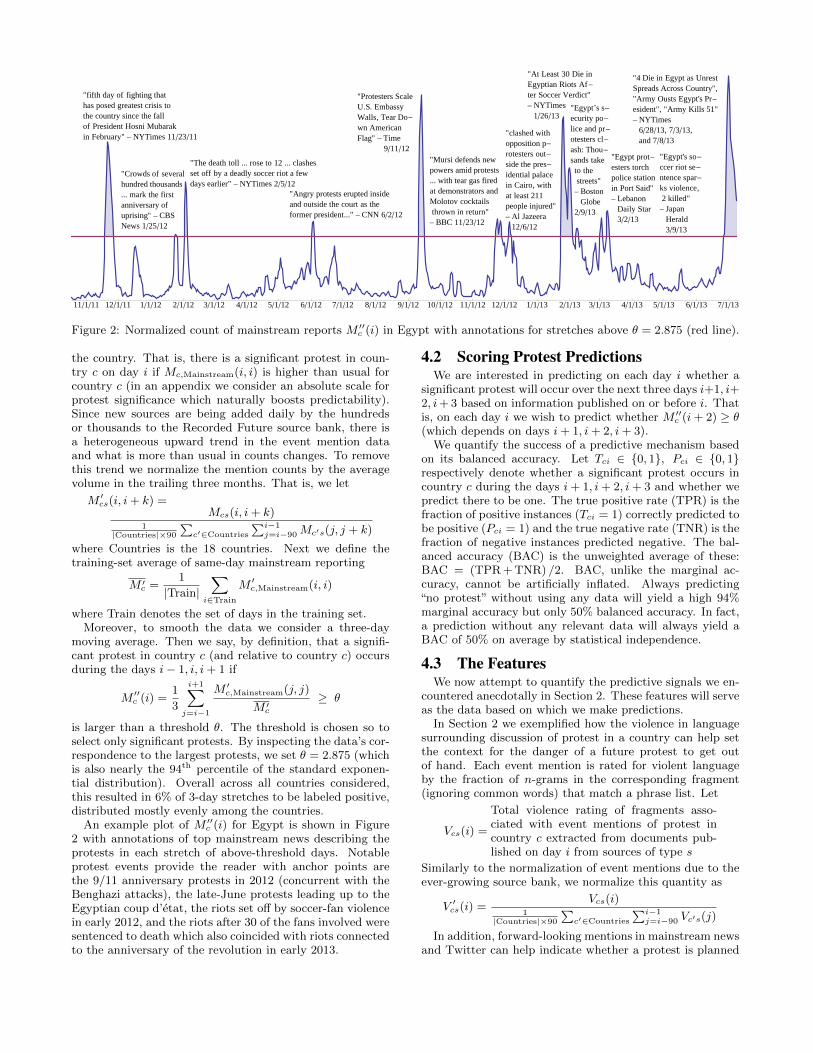
1 2 3 4 6 8 10 12 14 16 18 20 22Days forward
55%
65%
75%
Balanced accuracy
Figure 3: BAC for predicting protests by distance into thefuture using the random forest and the full data-set (blueand trend in dashed black) and the data-poor predict-like-today heuristic (red).
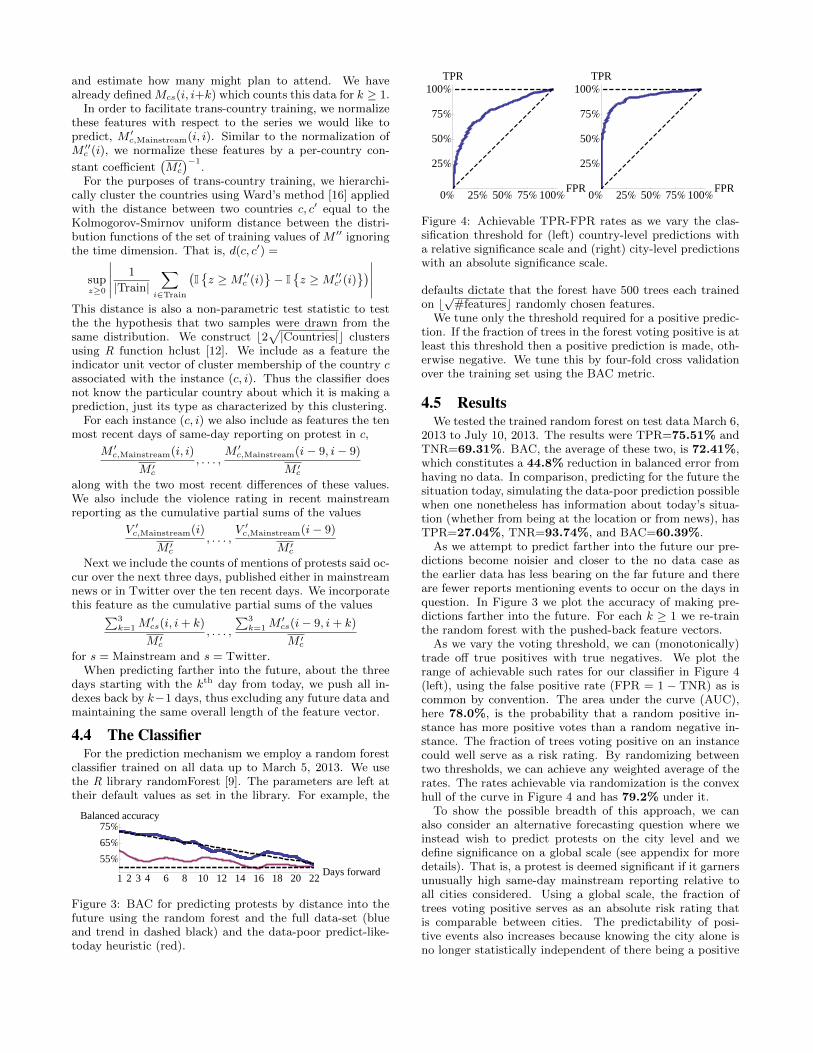
0% 25% 50% 75% 100%FPR
25%
50%
75%
100%
TPR
0% 25% 50% 75% 100%FPR
25%
50%
75%
100%
TPR
Figure 4: Achievable TPR-FPR rates as we vary the clas-sification threshold for (left) country-level predictions witha relative significance scale and (right) city-level predictionswith an absolute significance scale.
defaults dictate that the forest have 500 trees each trainedon b√
#featuresc randomly chosen features.We tune only the threshold required for a positive predic-
tion. If the fraction of trees in the forest voting positive is atleast this threshold then a positive prediction is made, oth-erwise negative. We tune this by four-fold cross validationover the training set using the BAC metric.
4.5 ResultsWe tested the trained random forest on test data March 6,
2013 to July 10, 2013. The results were TPR=75.51% andTNR=69.31%. BAC, the average of these two, is 72.41%,which constitutes a 44.8% reduction in balanced error fromhaving no data. In comparison, predicting for the future thesituation today, simulating the data-poor prediction possiblewhen one nonetheless has information about today’s situa-tion (whether from being at the location or from news), hasTPR=27.04%, TNR=93.74%, and BAC=60.39%.
As we attempt to predict farther into the future our pre-dictions become noisier and closer to the no data case asthe earlier data has less bearing on the far future and thereare fewer reports mentioning events to occur on the days inquestion. In Figure 3 we plot the accuracy of making pre-dictions farther into the future. For each k ≥ 1 we re-trainthe random forest with the pushed-back feature vectors.
As we vary the voting threshold, we can (monotonically)trade off true positives with true negatives. We plot therange of achievable such rates for our classifier in Figure 4(left), using the false positive rate (FPR = 1 − TNR) as iscommon by convention. The area under the curve (AUC),here 78.0%, is the probability that a random positive in-stance has more positive votes than a random negative in-stance. The fraction of trees voting positive on an instancecould well serve as a risk rating. By randomizing betweentwo thresholds, we can achieve any weighted average of therates. The rates achievable via randomization is the convexhull of the curve in Figure 4 and has 79.2% under it.
To show the possible breadth of this approach, we canalso consider an alternative forecasting question where weinstead wish to predict protests on the city level and wedefine significance on a global scale (see appendix for moredetails). That is, a protest is deemed significant if it garnersunusually high same-day mainstream reporting relative toall cities considered. Using a global scale, the fraction oftrees voting positive serves as an absolute risk rating thatis comparable between cities. The predictability of posi-tive events also increases because knowing the city alone isno longer statistically independent of there being a positive
6�17 –6�196�18 –6�206�19 –6�216�20 –6�226�21 –6�236�22 –6�246�23 –6�256�24 –6�266�25 –6�276�26 –6�286�27 –6�296�28 –6�306�29 –7�16�30 –7�27�1 –7�37�2 –7�47�3 –7�57�4 –7�67�5 –7�77�6 –7�87�7 –7�9
7�8 –7�10
765432July
13029282726252423222120191817June16
Dat
esof
prot
ests
inqu
estio
nDate prediction is made
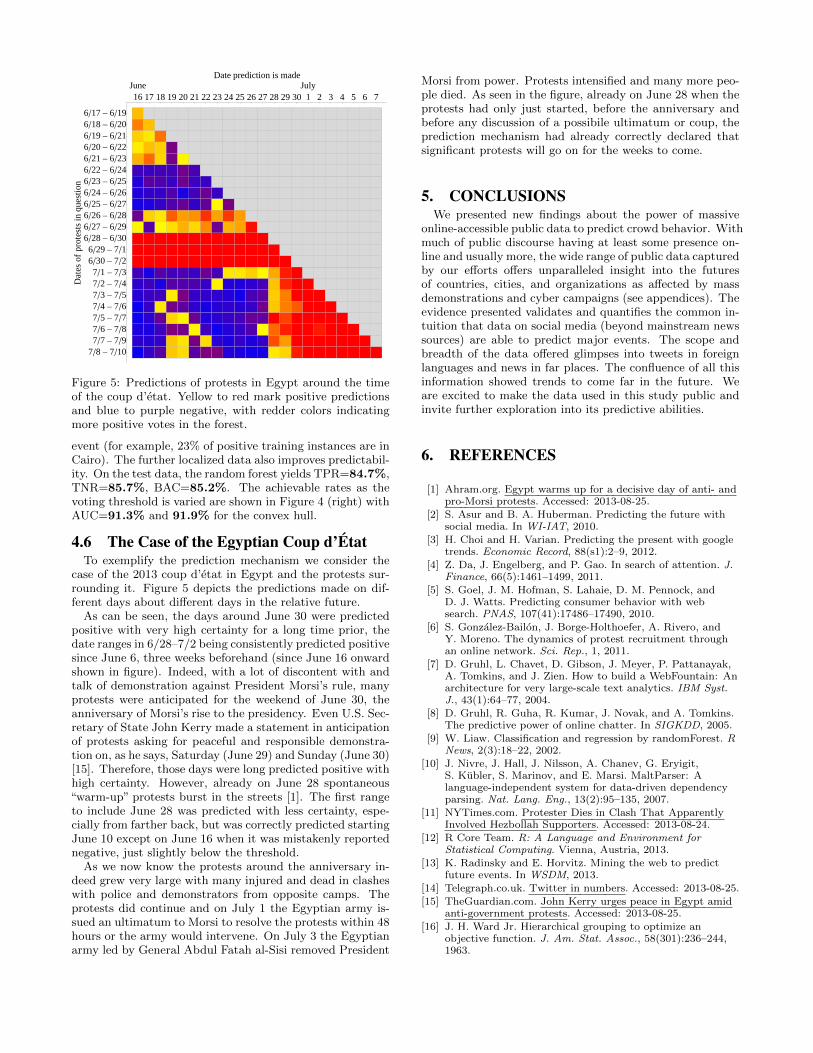
Figure 5: Predictions of protests in Egypt around the timeof the coup d’etat. Yellow to red mark positive predictionsand blue to purple negative, with redder colors indicatingmore positive votes in the forest.
event (for example, 23% of positive training instances are inCairo). The further localized data also improves predictabil-ity. On the test data, the random forest yields TPR=84.7%,TNR=85.7%, BAC=85.2%. The achievable rates as thevoting threshold is varied are shown in Figure 4 (right) withAUC=91.3% and 91.9% for the convex hull.
4.6 The Case of the Egyptian Coup d’ÉtatTo exemplify the prediction mechanism we consider the
case of the 2013 coup d’etat in Egypt and the protests sur-rounding it. Figure 5 depicts the predictions made on dif-ferent days about different days in the relative future.
As can be seen, the days around June 30 were predictedpositive with very high certainty for a long time prior, thedate ranges in 6/28–7/2 being consistently predicted positivesince June 6, three weeks beforehand (since June 16 onwardshown in figure). Indeed, with a lot of discontent with andtalk of demonstration against President Morsi’s rule, manyprotests were anticipated for the weekend of June 30, theanniversary of Morsi’s rise to the presidency. Even U.S. Sec-retary of State John Kerry made a statement in anticipationof protests asking for peaceful and responsible demonstra-tion on, as he says, Saturday (June 29) and Sunday (June 30)[15]. Therefore, those days were long predicted positive withhigh certainty. However, already on June 28 spontaneous“warm-up” protests burst in the streets [1]. The first rangeto include June 28 was predicted with less certainty, espe-cially from farther back, but was correctly predicted startingJune 10 except on June 16 when it was mistakenly reportednegative, just slightly below the threshold.
As we now know the protests around the anniversary in-deed grew very large with many injured and dead in clasheswith police and demonstrators from opposite camps. Theprotests did continue and on July 1 the Egyptian army is-sued an ultimatum to Morsi to resolve the protests within 48hours or the army would intervene. On July 3 the Egyptianarmy led by General Abdul Fatah al-Sisi removed President
Morsi from power. Protests intensified and many more peo-ple died. As seen in the figure, already on June 28 when theprotests had only just started, before the anniversary andbefore any discussion of a possibile ultimatum or coup, theprediction mechanism had already correctly declared thatsignificant protests will go on for the weeks to come.
5. CONCLUSIONSWe presented new findings about the power of massive
online-accessible public data to predict crowd behavior. Withmuch of public discourse having at least some presence on-line and usually more, the wide range of public data capturedby our efforts offers unparalleled insight into the futuresof countries, cities, and organizations as affected by massdemonstrations and cyber campaigns (see appendices). Theevidence presented validates and quantifies the common in-tuition that data on social media (beyond mainstream newssources) are able to predict major events. The scope andbreadth of the data offered glimpses into tweets in foreignlanguages and news in far places. The confluence of all thisinformation showed trends to come far in the future. Weare excited to make the data used in this study public andinvite further exploration into its predictive abilities.
6. REFERENCES
[1] Ahram.org. Egypt warms up for a decisive day of anti- andpro-Morsi protests. Accessed: 2013-08-25.
[2] S. Asur and B. A. Huberman. Predicting the future withsocial media. In WI-IAT, 2010.
[3] H. Choi and H. Varian. Predicting the present with googletrends. Economic Record, 88(s1):2–9, 2012.
[4] Z. Da, J. Engelberg, and P. Gao. In search of attention. J.Finance, 66(5):1461–1499, 2011.
[5] S. Goel, J. M. Hofman, S. Lahaie, D. M. Pennock, andD. J. Watts. Predicting consumer behavior with websearch. PNAS, 107(41):17486–17490, 2010.
[6] S. Gonzalez-Bailon, J. Borge-Holthoefer, A. Rivero, andY. Moreno. The dynamics of protest recruitment throughan online network. Sci. Rep., 1, 2011.
[7] D. Gruhl, L. Chavet, D. Gibson, J. Meyer, P. Pattanayak,A. Tomkins, and J. Zien. How to build a WebFountain: Anarchitecture for very large-scale text analytics. IBM Syst.J., 43(1):64–77, 2004.
[8] D. Gruhl, R. Guha, R. Kumar, J. Novak, and A. Tomkins.The predictive power of online chatter. In SIGKDD, 2005.
[9] W. Liaw. Classification and regression by randomForest. RNews, 2(3):18–22, 2002.
[10] J. Nivre, J. Hall, J. Nilsson, A. Chanev, G. Eryigit,S. Kubler, S. Marinov, and E. Marsi. MaltParser: Alanguage-independent system for data-driven dependencyparsing. Nat. Lang. Eng., 13(2):95–135, 2007.
[11] NYTimes.com. Protester Dies in Clash That ApparentlyInvolved Hezbollah Supporters. Accessed: 2013-08-24.
[12] R Core Team. R: A Language and Environment forStatistical Computing. Vienna, Austria, 2013.
[13] K. Radinsky and E. Horvitz. Mining the web to predictfuture events. In WSDM, 2013.
[14] Telegraph.co.uk. Twitter in numbers. Accessed: 2013-08-25.[15] TheGuardian.com. John Kerry urges peace in Egypt amid
anti-government protests. Accessed: 2013-08-25.[16] J. H. Ward Jr. Hierarchical grouping to optimize an
objective function. J. Am. Stat. Assoc., 58(301):236–244,1963.
7. APPENDIX: PREDICTING PROTESTS ONTHE CITY LEVEL
This appendix provides further detail on the prediction ofprotests on the city level and on a common scale of protestsignificance. From within the countries considered previ-ously, we choose the top cities by number of mentions ofprotest events. These 37 cities are Jalalabad, Kabul, andKandahar in Afghanistan; Manama in Bahrain; Alexandria,Cairo, Port Said, and Tanta in Egypt; Athens in Greece;Hyderabad, Mumbai, and New Delhi in India; Jakarta inIndonesia; Tehran in Iran; Milan and Rome in Italy; Am-man in Jordan; Beirut and Sidon in Lebanon; Benghaziand Tripoli in Libya; Abuja and Lagos in Nigeria; Islam-abad, Karachi, Lahore, Peshawar, and Quetta in Pakistan;Qatif and Riyadh in Saudi Arabia; Khartoum in Sudan;Aleppo, Damascus, Deraa, Hama, and Homs in Syria; Tunisin Tunisia; and Sana’a and Taiz in Yemen. We consider thesame time range and the same train-test split.
We define M ′ and V ′ as before but for these cities. Sincewe are interested in an absolute level of significance we nolonger normalize with respect to the entity, only with re-spect to the cross-entity average trailing volume. Thus,while overall still only 6% of instances are labeled positives,Cairo takes up 23% of positive training instances and 40%of positive test instances, while Khartoum takes up 1% ofpositive train instances and has no positive test instances.
Nonetheless, as before, cities are clustered according totheir set of M ′ training values and the classifier is not knowl-edgeable of the particular city in question, just its clustermembership. We use as features the unnormalized violencerating of past ten days of mainstream reporting about thecity, same-day mainstream reporting level of past ten days,and the forward-looking mainstream reporting and Twitterdiscussion of past ten days. In addition, we include the un-normalized features of the containing country.
A random forest classifier is trained with the voting frac-tion threshold tuned by four-fold cross-validation to maxi-mize balanced accuracy. Any other parameters were set totheir defaults as before. Testing on March 6, 2013 to July 10,2013, we get a true positive rate of 84.7% and a true nega-tive rate of 85.7% yielding a balanced accuracy of 85.2%.The achievable rates as the voting fraction threshold is var-ied are shown in Figure 4 (right). The area under the ROCcurve (AUC) is 91.3% and the area under its convex hull is91.9%.
8. APPENDIX: PREDICTING CYBER AT-TACKS BY SEQUENCE MINING WITHNAÏVE BAYES
In this appendix we expand our scope and consider allevent types recorded. There are 112 distinct event types inthe data ranging from protest to company acquisition to cy-ber attack to music album release to voting result. We wishto be able to predict unusually high numbers of mentions ofa particular type of event involving a particular entity. Herewe focus on cyber attacks. However, there are varying levelsof “clumpiness” for the many classes of events and entitiesin terms of how and for how long a real-world event is dis-cussed online. In addition, it is often hard to hypothesize apriori what predictive signals may exist. Therefore, in orderto tackle this forecasting problem we would need to spread
a wider net and consider all event interactions and at thesame time allow for more smoothing.
We will therefore consider events on the week level for agiven entity n∗ (which could be a country, a person, an or-ganization, a product, among many other things) and useevents mentioning that entity to forecast the level of men-tions of an event type of interest involving that entity nextweek. Let
Mn∗es(i, j) =
Number of event mentions of type e involv-ing entity n∗ taking place on week j ex-tracted from documents published on weeki from sources of type s
Here we will consider source types Any, Mainstream, SocialMedia, and Blog. As before, we normalize this number withrespect to the total event mention volume in the past 12weeks (approximately three months, as before) in order tode-trend it as follows
M ′n∗es(i, i+ k) =Mn∗es(i, i+ k)∑
e′∈EventTypes
∑i−1j=i−12Mn∗e′s(i, i+ k)
This is the data we will feed to our prediction algorithm.We will consider both the mentioning over the past weeks ofevents taking place in that same week as well as any forward-looking mentions on a past week of events to take place nextweek, the week in question. As before, we will also considerthe case where we must predict farther into the future, aboutthe week after next or the one after that etc.
We will consider data starting from the first week of 2011and up to the last week of July 2013. We will test ourmechanism on April 2012 onward, training on the trailingtwo years (as available). Any cross-validation is done on2011 up to March 2012.
8.1 The Ground SetAlong with an entity of interest n∗, let us fix an event
type of interest e∗ and a source type of interest s∗. Becausewe believe our data is particularly useful in predicting crowdbehavior we will choose e∗ accordingly. Here we will be in-terested in predicting politically motivated cyber campaignsso we fix e∗ = CyberAttack. We label as positive weeks thatincluded cyber attack campaigns that were so impactful togenerate wide attention all over with same-week mentionsof cyber attack events. Therefore we fix s∗ = Any. We willconsider n∗ that are both country target entities (such as Is-rael) and hacktivist attacker entities (such as Anonymous).
We also fix a threshold θ and we will wish to predict onweek i whether
M ′n∗e∗s∗(i+, i+) ≥ θ
We fix θ so that 15% of weeks are positive.As before, we will use balanced accuracy to score our pre-
dictive mechanism and to tune parameters by cross-validation.
8.2 High-Dimensional Sequence Mining withNaïve Bayes
Let Ti = 1 denote the positivity of the prediction instanceon week i
Ti = 1 : M ′n∗e∗s∗(i+ 1, i+ 1) ≥ θ
We seek to estimate the conditional probability density con-

ditioned on the past ` weeks
P
Ti = t
∣∣∣∣∣∣∣∣M ′n∗es(i− k, i− k), M ′n∗es(i− k, i+ 1)for e ∈ EventTypes,
s ∈ SourceTypes,k = 0, . . . , `− 1
(1)
for t = 0 or 1. We use ` = 5 here.That estimate this, we seek to find the patterns of ` event
sequences that end with our target event. Sequence min-ing is the discovery of commonly repeating sequences in astring over an alphabet Σ. In bioinformatics, sequence min-ing is applied to DNA sequences (Σ = {A,C,G, T}) and toamino acid sequences constituting a protein (|Σ| = 20) tofind common sequences of some length. For longer stringsthe frequency of appearing in nature is highly concentrated.
We first bin the values of M ′n∗es(i, i + k) into quartilesof their marginal distribution over the training data. Theresulting alphabet Σ is of size 42×`×|SourceTypes|×|EventTypes|,much larger than the training data set so that the proba-bility function is underspecified (high-dimensional setting).At the same time, the amount of information in the train-ing data is also quite massive. So we require a method thatcan smooth the density to avoid overfitting and, at the sametime, tractable over a large data set.
One solution to this problem is to apply what is knownas the naıve assumption to our likelihood function (1). LetF, F ′ ∈ {1, 2, 3, 4} (indicating the binned quartile) be anytwo different features of the past in the conditioning in (1).Then we make the following assumption:
Conditioned on Ti, F and F ′ are statistically independent.
This is of course very different from assuming marginal inde-pendence. For example under the assumption, discussion ofprotests or of military actions in Israel in mainstream newscould very often coincide with a discussion on Twitter of aplanned future cyber attack against Israel because a possi-ble future cyber attack is often a response to the former;but given that a cyber attack against Israel does occur nextweek, we assume the former two must occur independentlyfrom one another.
By Bayes’ theorem we may decompose the probabilityfunction to a product of P (Ti = t) and the conditional prob-abilities of M ′n∗es(i− k, i− k) and M ′n∗es(i− k, i+ 1) givenTi = t. Estimating instead the marginal distribution of Tand the conditional distributions of M ′ by maximum like-lihood (counting co-occurrences in training data) results inthe well known naıve Bayes probability estimator. This re-duces the variance of the density estimator but introducesbias whenever the naıve assumption does not hold exactly.
To further relieve issues of the sparsity of positives in ourdata, instead of estimating the conditional probabilities bymaximum likelihood, we take a Bayesian approach and as-sume a Dirichlet prior with symmetric concentration param-eter α. The prior is our probabilistic belief about the value of
1 2 3 4 5 6 7 8Weeks forward50%
60%
70%
Balanced accuracy
Figure 6: In dark blue, the balanced accuracy of predictingcyber attacks against Israel by distance into the future.
Targets BAC Perpetrators BACIsrael 68.9% Anonymous 70.3%Germany 65.4% AnonGhost 70.8%South Korea 63.1% LulzSec 60.6%United Kingdom 65.5% Guccifer 66.7%
Table 2: Accuracy of predicting cyber attacks against andby a selection of entities.
these conditional probabilities in the absence of data. Beingthe conjugate prior to the categorical distribution, a Dirich-let law will also be the distribution for the posterior distribu-tion. Estimating the parameters by maximum a posteriorilikelihood is then equivalent to estimating the probabilitiesby counting frequencies from the data and padding thesecounts each by α. We estimate the marginal P (Ti = 1) usingmaximum likelihood because that estimation is not plaguedby sparsity.
Estimating the conditional probabilities thus is then donesimply by counting data which can be done exceedingly fast.For each event, source, and look-back k, one simply countsoccurrences in bins of the feature and keeps such tallies sep-arately for when k + 1 weeks forward (only if within thetraining data) has been positive or negative. The computa-tion involved in this procedure scales as the product of thelength of the data and the number of features.
To make a prediction we check whether (1) ≥ p∗ for a cho-sen threshold p∗. Due to the bias introduced by making thenaıve assumption, we select p∗ by four-fold cross-validationon the training data (up to March 2012) to maximize bal-anced accuracy.
8.3 ResultsWe first apply this method to predicting cyber campaigns
against Israel. For reference, most of these are perpetratedby groups AnonGhost and Anonymous under the bannerof #OpIsrael. Testing on April 2012 to July 2013, we geta true positive rate of 70.0% and a true negative rate of67.8% giving a balanced accuracy of 68.9%. Our accuracydiminishes as we try to predict farther into the future, asdepicted in Figure 6.
By inspecting the trained conditional probabilities we cansee which were the most impactful features to sway our beliefone way or the other. In this case, swaying our belief mosttoward predicting positively were if many blog and main-stream mentions of cyber attack appeared in recent weeksand if many social media mentions of protest in Israel ap-peared in recent weeks as well as forward-looking mentionson social media of a protest in the week to come.
We apply the same method to predicting attacks againstthree other country entities and to predicting campaigns per-petrated by a selection of four hacktivist groups. The resultsare reported in Table 2.
Where hacktivism campaigns are often reactions to devel-opments that do not necessarily at first involve the hacktivistorganization, incorporating in some way event mentions in-volving other entities could boost performance. However, itis not immediately clear how to do so without introducingtoo many redundant and obfuscating features that will re-sult in overfitting and poor out-of-sample accuracy. Usingabstractions as in [13] is one possible way to improve thismethod.