predicting defect behavior in b2 intermetallics by merging ab … · predicting defect behavior in...
TRANSCRIPT
ARTICLE OPEN
Predicting defect behavior in B2 intermetallics by mergingab initio modeling and machine learningBharat Medasani1,2, Anthony Gamst3, Hong Ding4,5, Wei Chen6,7, Kristin A Persson4,5, Mark Asta4,8, Andrew Canning1
and Maciej Haranczyk1
We present a combination of machine learning and high throughput calculations to predict the points defects behavior in binaryintermetallic (A–B) compounds, using as an example systems with the cubic B2 crystal structure (with equiatomic AB stoichiometry).To the best of our knowledge, this work is the first application of machine learning-models for point defect properties. Highthroughput first principles density functional calculations have been employed to compute intrinsic point defect energies in 100 B2intermetallic compounds. The systems are classified into two groups: (i) those for which the intrinsic defects are antisites for both Aand B rich compositions, and (ii) those for which vacancies are the dominant defect for either or both composition ranges. The datawas analyzed by machine learning-techniques using decision tree, and full and reduced multiple additive regression tree (MART)models. Among these three schemes, a reduced MART (r-MART) model using six descriptors (formation energy, minimum anddifference of electron densities at the Wigner–Seitz cell boundary, atomic radius difference, maximal atomic number and maximalelectronegativity) presents the highest fit (98 %) and predictive (75 %) accuracy. This model is used to predict the defect behavior ofother B2 compounds, and it is found that 45 % of the compounds considered feature vacancies as dominant defects for either A orB rich compositions (or both). The ability to predict dominant defect types is important for the modeling of thermodynamic andkinetic properties of intermetallic compounds, and the present results illustrate how this information can be derived using moderntools combining high throughput calculations and data analytics.
npj Computational Materials (2016) 2:1 ; doi:10.1038/s41524-016-0001-z
INTRODUCTIONIn crystalline compounds, point defects often play a central role ingoverning a wide variety of physical properties. Whether one isconsidering intrinsic carrier types in semiconductor compounds,optical properties of insulators, or the resistance of an intermetallicphase to high-temperature deformation processes, knowledge ofthe type and concentrations of dominant point defects is essentialfor understanding and controlling materials behavior. Thedifficulties inherent in performing experimental measurementsof equilibrium point defect properties can thus present asignificant barrier to the accelerated development of materialsfor targeted applications. In recent years, this situation hasbenefited significantly from the development of computationaltools based on electronic DFT that provide a framework foraccurate prediction of the equilibrium concentrations, electronicstructure, and kinetic properties of point defects.1–4 While suchtools have advanced significantly, they remain relatively compu-tationally costly, due to the need to employ supercell models,5
particularly when expensive functionals6 are employed. Thus theuse of such computational techniques in high throughput (HT)calculations in the context of materials discovery and design7–9
has remained limited.
In the present work, we demonstrate a strategy for predictingpoint-defect properties over a large composition space, employ-ing machine-learning (ML) methods on a relatively small trainingset. ML approaches have found rapidly increasing use incomputationally-assisted materials discovery and design in recentyears,10–17, but to the best of our knowledge the applicationof such models for point defect properties has not yet beenundertaken. In this work, we present a general frameworkfor applying ML algorithms to the important problem ofpredicting the dominant point-defect type in an inorganiccrystalline compound. This approach is demonstrated specificallyfor equilibrium intrinsic point defects in binary intermetalliccompounds with the B2 crystal structure, but can be readilygeneralized to multicomponent intermetallic systems, as well as tosemiconductors and insulators employing standard schemes forcharged point defect calculations.4 Further, the approachdescribed here provides a basis also for extending ML algorithmsto non-equilibrium defect properties such as those related todiffusion in alloys.18
As mentioned above, we demonstrate the ML strategy fordefect types in this work by focusing on the modeling ofdominant intrinsic point defect types in intermetallic compounds
Received: 12 April 2016 Revised: 17 October 2016 Accepted: 26 October 2016
1Computational Research Division, Lawrence Berkeley National Laboratory, Berkeley, CA 94720, USA; 2Physical and Computational Sciences Directorate, Pacific NationalNorthwest Laboratory, Richland, WA 99354, USA; 3Biostatistics and Bioinformatics, University of California, San Diego, CA 92093, USA; 4Department of Materials Science &Engineering, University of California, Berkeley, CA 94720, USA; 5Energy Technologies Area Division, Lawrence Berkeley National Laboratory, Berkeley, CA 94720, USA; 6EnergyTechnologies Area, Lawrence Berkeley National Laboratory, Berkeley, CA 94720, USA; 7Department of Mechanical, Materials and Aerospace Engineering, Illinois Institute ofTechnology, Chicago, IL 60616, USA and 8Materials Sciences Division, Lawrence Berkeley National Laboratory, Berkeley, CA 94720, USACorrespondence: Bharat Medasani (bharatmedasani@pnnlgov)
www.nature.com/npjcompumats
Published in partnership with the Shanghai Institute of Ceramics of the Chinese Academy of Sciences
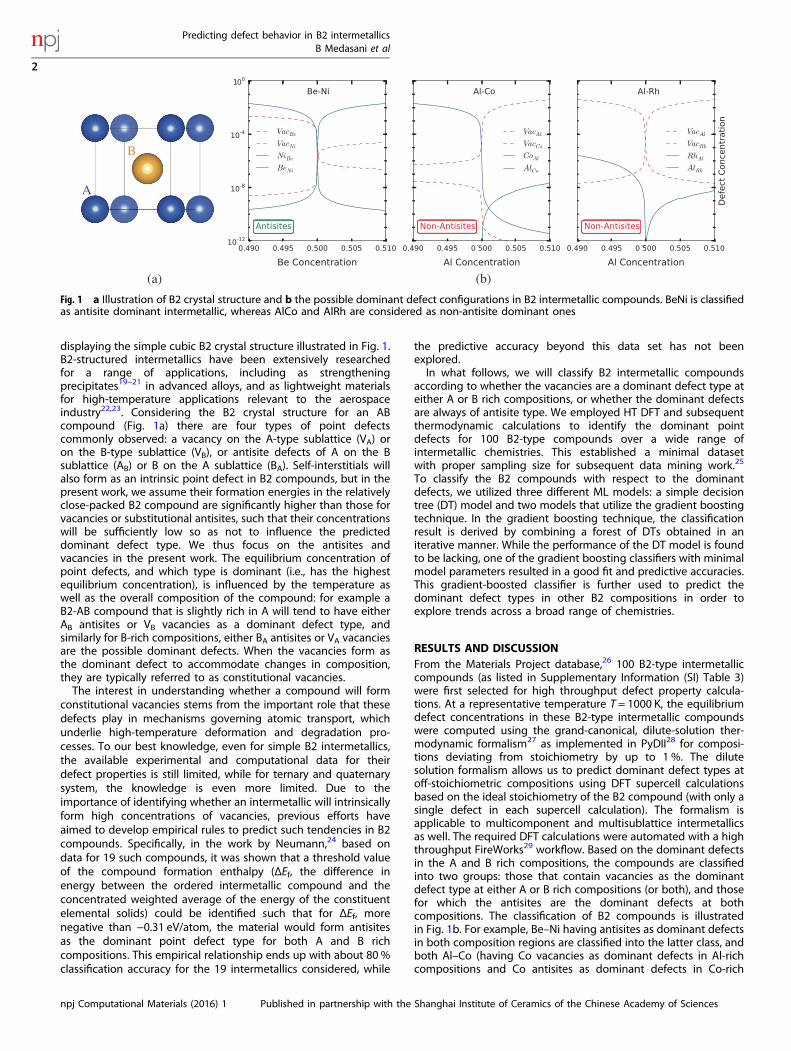
displaying the simple cubic B2 crystal structure illustrated in Fig. 1.B2-structured intermetallics have been extensively researchedfor a range of applications, including as strengtheningprecipitates19–21 in advanced alloys, and as lightweight materialsfor high-temperature applications relevant to the aerospaceindustry22,23. Considering the B2 crystal structure for an ABcompound (Fig. 1a) there are four types of point defectscommonly observed: a vacancy on the A-type sublattice (VA) oron the B-type sublattice (VB), or antisite defects of A on the Bsublattice (AB) or B on the A sublattice (BA). Self-interstitials willalso form as an intrinsic point defect in B2 compounds, but in thepresent work, we assume their formation energies in the relativelyclose-packed B2 compound are significantly higher than those forvacancies or substitutional antisites, such that their concentrationswill be sufficiently low so as not to influence the predicteddominant defect type. We thus focus on the antisites andvacancies in the present work. The equilibrium concentration ofpoint defects, and which type is dominant (i.e., has the highestequilibrium concentration), is influenced by the temperature aswell as the overall composition of the compound: for example aB2-AB compound that is slightly rich in A will tend to have eitherAB antisites or VB vacancies as a dominant defect type, andsimilarly for B-rich compositions, either BA antisites or VA vacanciesare the possible dominant defects. When the vacancies form asthe dominant defect to accommodate changes in composition,they are typically referred to as constitutional vacancies.The interest in understanding whether a compound will form
constitutional vacancies stems from the important role that thesedefects play in mechanisms governing atomic transport, whichunderlie high-temperature deformation and degradation pro-cesses. To our best knowledge, even for simple B2 intermetallics,the available experimental and computational data for theirdefect properties is still limited, while for ternary and quaternarysystem, the knowledge is even more limited. Due to theimportance of identifying whether an intermetallic will intrinsicallyform high concentrations of vacancies, previous efforts haveaimed to develop empirical rules to predict such tendencies in B2compounds. Specifically, in the work by Neumann,24 based ondata for 19 such compounds, it was shown that a threshold valueof the compound formation enthalpy (ΔEf, the difference inenergy between the ordered intermetallic compound and theconcentrated weighted average of the energy of the constituentelemental solids) could be identified such that for ΔEf, morenegative than −0.31 eV/atom, the material would form antisitesas the dominant point defect type for both A and B richcompositions. This empirical relationship ends up with about 80 %classification accuracy for the 19 intermetallics considered, while
the predictive accuracy beyond this data set has not beenexplored.In what follows, we will classify B2 intermetallic compounds
according to whether the vacancies are a dominant defect type ateither A or B rich compositions, or whether the dominant defectsare always of antisite type. We employed HT DFT and subsequentthermodynamic calculations to identify the dominant pointdefects for 100 B2-type compounds over a wide range ofintermetallic chemistries. This established a minimal datasetwith proper sampling size for subsequent data mining work.25
To classify the B2 compounds with respect to the dominantdefects, we utilized three different ML models: a simple decisiontree (DT) model and two models that utilize the gradient boostingtechnique. In the gradient boosting technique, the classificationresult is derived by combining a forest of DTs obtained in aniterative manner. While the performance of the DT model is foundto be lacking, one of the gradient boosting classifiers with minimalmodel parameters resulted in a good fit and predictive accuracies.This gradient-boosted classifier is further used to predict thedominant defect types in other B2 compositions in order toexplore trends across a broad range of chemistries.
RESULTS AND DISCUSSIONFrom the Materials Project database,26 100 B2-type intermetalliccompounds (as listed in Supplementary Information (SI) Table 3)were first selected for high throughput defect property calcula-tions. At a representative temperature T = 1000 K, the equilibriumdefect concentrations in these B2-type intermetallic compoundswere computed using the grand-canonical, dilute-solution ther-modynamic formalism27 as implemented in PyDII28 for composi-tions deviating from stoichiometry by up to 1 %. The dilutesolution formalism allows us to predict dominant defect types atoff-stoichiometric compositions using DFT supercell calculationsbased on the ideal stoichiometry of the B2 compound (with only asingle defect in each supercell calculation). The formalism isapplicable to multicomponent and multisublattice intermetallicsas well. The required DFT calculations were automated with a highthroughput FireWorks29 workflow. Based on the dominant defectsin the A and B rich compositions, the compounds are classifiedinto two groups: those that contain vacancies as the dominantdefect type at either A or B rich compositions (or both), and thosefor which the antisites are the dominant defects at bothcompositions. The classification of B2 compounds is illustratedin Fig. 1b. For example, Be–Ni having antisites as dominant defectsin both composition regions are classified into the latter class, andboth Al–Co (having Co vacancies as dominant defects in Al-richcompositions and Co antisites as dominant defects in Co-rich
A
B
(a) (b)
Fig. 1 a Illustration of B2 crystal structure and b the possible dominant defect configurations in B2 intermetallic compounds. BeNi is classifiedas antisite dominant intermetallic, whereas AlCo and AlRh are considered as non-antisite dominant ones
Predicting defect behavior in B2 intermetallicsB Medasani et al
2
npj Computational Materials (2016) 1 Published in partnership with the Shanghai Institute of Ceramics of the Chinese Academy of Sciences
regions) and Al-Rh (having vacancies as the dominant defects inboth composition regions) are grouped into the former class.Our calculations indicate that among the one hundred
compounds, half of them belong to the antisite dominantcategory (labeled with 0 in the defect-type classification (DTC)column of SI Table 3), in which antisite defects are the dominantones in both off-stoichiometric composition (A-rich and A-poor)regions. The other half belong to non-antisite dominant type(labeled with 1 in the DTC column of SI Table 3), as vacancydefects are dominant in one side of off-stoichiometric composi-tion region (41 compounds) or in both regions (9 compounds).Henceforth, based on these computational results, we establisheda basic B2-type intermetallic defect property database containingthese 100 compounds, which was used to evaluate the empiricaldefect classification model developed by Neumann,24 as well as toconstruct new machine-learning models to explore the underlyingDTC for B2 compounds.25
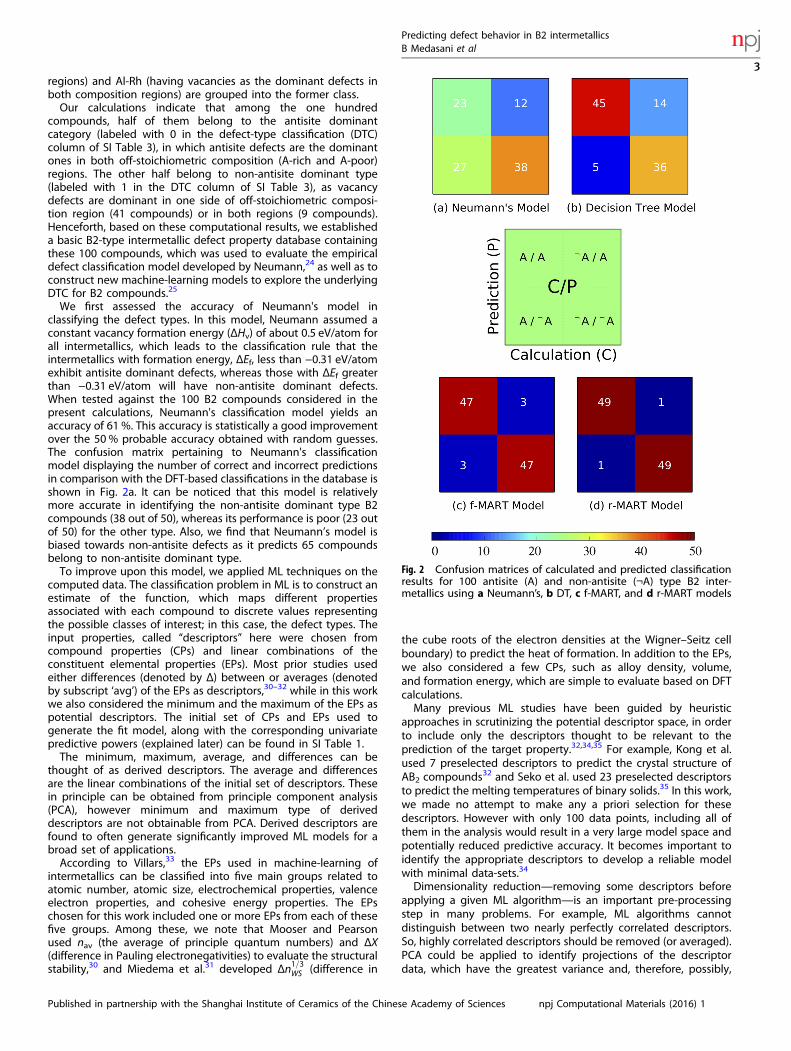
We first assessed the accuracy of Neumann's model inclassifying the defect types. In this model, Neumann assumed aconstant vacancy formation energy (ΔHv) of about 0.5 eV/atom forall intermetallics, which leads to the classification rule that theintermetallics with formation energy, ΔEf, less than −0.31 eV/atomexhibit antisite dominant defects, whereas those with ΔEf greaterthan −0.31 eV/atom will have non-antisite dominant defects.When tested against the 100 B2 compounds considered in thepresent calculations, Neumann's classification model yields anaccuracy of 61 %. This accuracy is statistically a good improvementover the 50 % probable accuracy obtained with random guesses.The confusion matrix pertaining to Neumann's classificationmodel displaying the number of correct and incorrect predictionsin comparison with the DFT-based classifications in the database isshown in Fig. 2a. It can be noticed that this model is relativelymore accurate in identifying the non-antisite dominant type B2compounds (38 out of 50), whereas its performance is poor (23 outof 50) for the other type. Also, we find that Neumann’s model isbiased towards non-antisite defects as it predicts 65 compoundsbelong to non-antisite dominant type.To improve upon this model, we applied ML techniques on the
computed data. The classification problem in ML is to construct anestimate of the function, which maps different propertiesassociated with each compound to discrete values representingthe possible classes of interest; in this case, the defect types. Theinput properties, called “descriptors” here were chosen fromcompound properties (CPs) and linear combinations of theconstituent elemental properties (EPs). Most prior studies usedeither differences (denoted by Δ) between or averages (denotedby subscript ‘avg’) of the EPs as descriptors,30–32 while in this workwe also considered the minimum and the maximum of the EPs aspotential descriptors. The initial set of CPs and EPs used togenerate the fit model, along with the corresponding univariatepredictive powers (explained later) can be found in SI Table 1.The minimum, maximum, average, and differences can be
thought of as derived descriptors. The average and differencesare the linear combinations of the initial set of descriptors. Thesein principle can be obtained from principle component analysis(PCA), however minimum and maximum type of deriveddescriptors are not obtainable from PCA. Derived descriptors arefound to often generate significantly improved ML models for abroad set of applications.According to Villars,33 the EPs used in machine-learning of
intermetallics can be classified into five main groups related toatomic number, atomic size, electrochemical properties, valenceelectron properties, and cohesive energy properties. The EPschosen for this work included one or more EPs from each of thesefive groups. Among these, we note that Mooser and Pearsonused nav (the average of principle quantum numbers) and ΔX(difference in Pauling electronegativities) to evaluate the structuralstability,30 and Miedema et al.31 developed Δn1=3WS (difference in
the cube roots of the electron densities at the Wigner–Seitz cellboundary) to predict the heat of formation. In addition to the EPs,we also considered a few CPs, such as alloy density, volume,and formation energy, which are simple to evaluate based on DFTcalculations.Many previous ML studies have been guided by heuristic
approaches in scrutinizing the potential descriptor space, in orderto include only the descriptors thought to be relevant to theprediction of the target property.32,34,35 For example, Kong et al.used 7 preselected descriptors to predict the crystal structure ofAB2 compounds32 and Seko et al. used 23 preselected descriptorsto predict the melting temperatures of binary solids.35 In this work,we made no attempt to make any a priori selection for thesedescriptors. However with only 100 data points, including all ofthem in the analysis would result in a very large model space andpotentially reduced predictive accuracy. It becomes important toidentify the appropriate descriptors to develop a reliable modelwith minimal data-sets.34
Dimensionality reduction—removing some descriptors beforeapplying a given ML algorithm—is an important pre-processingstep in many problems. For example, ML algorithms cannotdistinguish between two nearly perfectly correlated descriptors.So, highly correlated descriptors should be removed (or averaged).PCA could be applied to identify projections of the descriptordata, which have the greatest variance and, therefore, possibly,
Fig. 2 Confusion matrices of calculated and predicted classificationresults for 100 antisite (A) and non-antisite (¬A) type B2 inter-metallics using a Neumann’s, b DT, c f-MART, and d r-MART models
Predicting defect behavior in B2 intermetallicsB Medasani et al
3
Published in partnership with the Shanghai Institute of Ceramics of the Chinese Academy of Sciences npj Computational Materials (2016) 1
the most information. The problem with this approach is that,because the outcome of interest is not taken into consideration,the projections found by PCA might be (nearly) orthogonal to theprojections which are actually useful in predicting the outcome.Two different techniques were therefore applied to reduce the
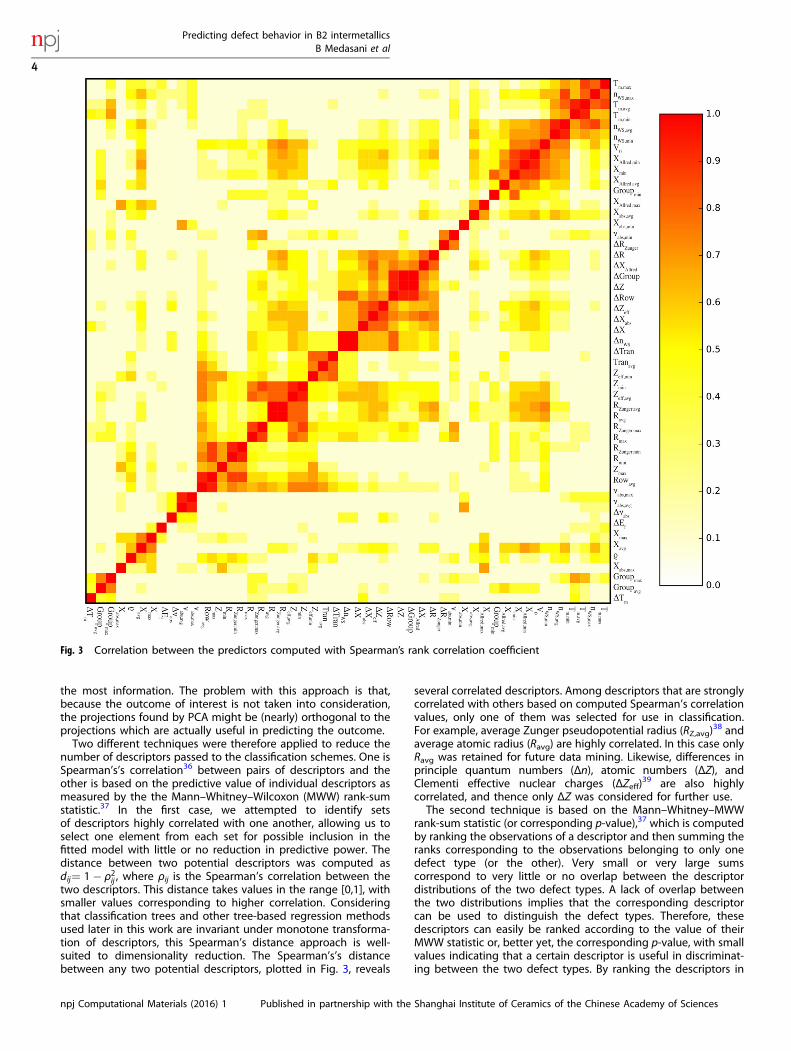
number of descriptors passed to the classification schemes. One isSpearman’s’s correlation36 between pairs of descriptors and theother is based on the predictive value of individual descriptors asmeasured by the the Mann–Whitney–Wilcoxon (MWW) rank-sumstatistic.37 In the first case, we attempted to identify setsof descriptors highly correlated with one another, allowing us toselect one element from each set for possible inclusion in thefitted model with little or no reduction in predictive power. Thedistance between two potential descriptors was computed asdij¼ 1� ρ2ij , where ρij is the Spearman’s correlation between thetwo descriptors. This distance takes values in the range [0,1], withsmaller values corresponding to higher correlation. Consideringthat classification trees and other tree-based regression methodsused later in this work are invariant under monotone transforma-tion of descriptors, this Spearman’s distance approach is well-suited to dimensionality reduction. The Spearman’s’s distancebetween any two potential descriptors, plotted in Fig. 3, reveals
several correlated descriptors. Among descriptors that are stronglycorrelated with others based on computed Spearman’s correlationvalues, only one of them was selected for use in classification.For example, average Zunger pseudopotential radius (RZ,avg)
38 andaverage atomic radius (Ravg) are highly correlated. In this case onlyRavg was retained for future data mining. Likewise, differences inprinciple quantum numbers (Δn), atomic numbers (ΔZ), andClementi effective nuclear charges (ΔZeff)
39 are also highlycorrelated, and thence only ΔZ was considered for further use.The second technique is based on the Mann–Whitney–MWW
rank-sum statistic (or corresponding p-value),37 which is computedby ranking the observations of a descriptor and then summing theranks corresponding to the observations belonging to only onedefect type (or the other). Very small or very large sumscorrespond to very little or no overlap between the descriptordistributions of the two defect types. A lack of overlap betweenthe two distributions implies that the corresponding descriptorcan be used to distinguish the defect types. Therefore, thesedescriptors can easily be ranked according to the value of theirMWW statistic or, better yet, the corresponding p-value, with smallvalues indicating that a certain descriptor is useful in discriminat-ing between the two defect types. By ranking the descriptors in
Fig. 3 Correlation between the predictors computed with Spearman’s rank correlation coefficient
Predicting defect behavior in B2 intermetallicsB Medasani et al
4
npj Computational Materials (2016) 1 Published in partnership with the Shanghai Institute of Ceramics of the Chinese Academy of Sciences
this way, we can eliminate those with the largest p-values;i.e. those descriptors that are less diagnostically useful than theothers. The MWW rank sum values, shown in SI Table 1 for all thedescriptors, suggest that the “minimal” or “maximal” types ofvarious descriptors, together with “difference” types are the mostpredictive. Only in specific cases, “average” type of descriptors,carried along with “minimal” or “maximal” types of descriptors, arepredictive. Therefore, descriptors that are the average of variousEPs were dropped in favor of the maximum and minimum of thedescriptors. The dimensionality reduction based on Spearman’scorrelation and p-value analysis left us with 35 descriptors (listedin SI Table 2) for further data mining studies.Based on the retained descriptors, we fitted a classification
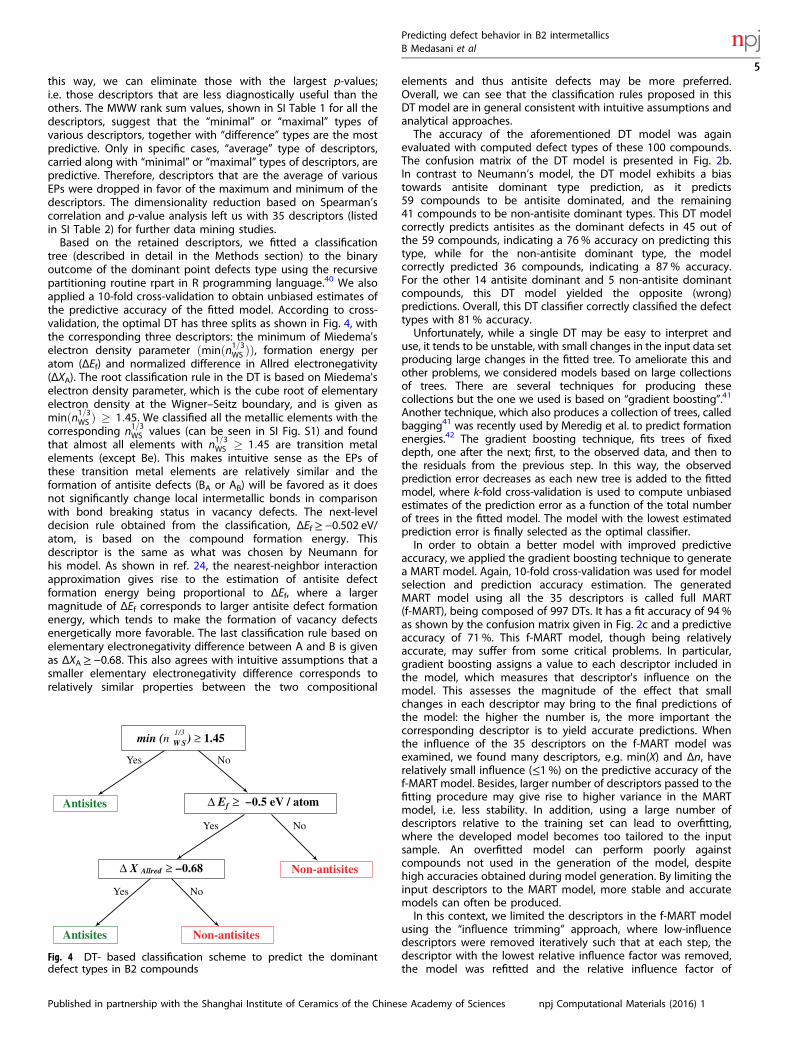
tree (described in detail in the Methods section) to the binaryoutcome of the dominant point defects type using the recursivepartitioning routine rpart in R programming language.40 We alsoapplied a 10-fold cross-validation to obtain unbiased estimates ofthe predictive accuracy of the fitted model. According to cross-validation, the optimal DT has three splits as shown in Fig. 4, withthe corresponding three descriptors: the minimum of Miedema'selectron density parameter ðminðn1=3WS ÞÞ, formation energy peratom (ΔEf) and normalized difference in Allred electronegativity(ΔXA). The root classification rule in the DT is based on Miedema'selectron density parameter, which is the cube root of elementaryelectron density at the Wigner–Seitz boundary, and is given asminðn1=3WS Þ � 1:45. We classified all the metallic elements with thecorresponding n1=3WS values (can be seen in SI Fig. S1) and foundthat almost all elements with n1=3WS � 1:45 are transition metalelements (except Be). This makes intuitive sense as the EPs ofthese transition metal elements are relatively similar and theformation of antisite defects (BA or AB) will be favored as it doesnot significantly change local intermetallic bonds in comparisonwith bond breaking status in vacancy defects. The next-leveldecision rule obtained from the classification, ΔEf≥ −0.502 eV/atom, is based on the compound formation energy. Thisdescriptor is the same as what was chosen by Neumann forhis model. As shown in ref. 24, the nearest-neighbor interactionapproximation gives rise to the estimation of antisite defectformation energy being proportional to ΔEf, where a largermagnitude of ΔEf corresponds to larger antisite defect formationenergy, which tends to make the formation of vacancy defectsenergetically more favorable. The last classification rule based onelementary electronegativity difference between A and B is givenas ΔXA≥ −0.68. This also agrees with intuitive assumptions that asmaller elementary electronegativity difference corresponds torelatively similar properties between the two compositional
elements and thus antisite defects may be more preferred.Overall, we can see that the classification rules proposed in thisDT model are in general consistent with intuitive assumptions andanalytical approaches.The accuracy of the aforementioned DT model was again
evaluated with computed defect types of these 100 compounds.The confusion matrix of the DT model is presented in Fig. 2b.In contrast to Neumann’s model, the DT model exhibits a biastowards antisite dominant type prediction, as it predicts59 compounds to be antisite dominated, and the remaining41 compounds to be non-antisite dominant types. This DT modelcorrectly predicts antisites as the dominant defects in 45 out ofthe 59 compounds, indicating a 76% accuracy on predicting thistype, while for the non-antisite dominant type, the modelcorrectly predicted 36 compounds, indicating a 87 % accuracy.For the other 14 antisite dominant and 5 non-antisite dominantcompounds, this DT model yielded the opposite (wrong)predictions. Overall, this DT classifier correctly classified the defecttypes with 81 % accuracy.Unfortunately, while a single DT may be easy to interpret and
use, it tends to be unstable, with small changes in the input data setproducing large changes in the fitted tree. To ameliorate this andother problems, we considered models based on large collectionsof trees. There are several techniques for producing thesecollections but the one we used is based on “gradient boosting”.41
Another technique, which also produces a collection of trees, calledbagging41 was recently used by Meredig et al. to predict formationenergies.42 The gradient boosting technique, fits trees of fixeddepth, one after the next; first, to the observed data, and then tothe residuals from the previous step. In this way, the observedprediction error decreases as each new tree is added to the fittedmodel, where k-fold cross-validation is used to compute unbiasedestimates of the prediction error as a function of the total numberof trees in the fitted model. The model with the lowest estimatedprediction error is finally selected as the optimal classifier.In order to obtain a better model with improved predictive
accuracy, we applied the gradient boosting technique to generatea MART model. Again, 10-fold cross-validation was used for modelselection and prediction accuracy estimation. The generatedMART model using all the 35 descriptors is called full MART(f-MART), being composed of 997 DTs. It has a fit accuracy of 94 %as shown by the confusion matrix given in Fig. 2c and a predictiveaccuracy of 71 %. This f-MART model, though being relativelyaccurate, may suffer from some critical problems. In particular,gradient boosting assigns a value to each descriptor included inthe model, which measures that descriptor's influence on themodel. This assesses the magnitude of the effect that smallchanges in each descriptor may bring to the final predictions ofthe model: the higher the number is, the more important thecorresponding descriptor is to yield accurate predictions. Whenthe influence of the 35 descriptors on the f-MART model wasexamined, we found many descriptors, e.g. min(X) and Δn, haverelatively small influence (≤1 %) on the predictive accuracy of thef-MART model. Besides, larger number of descriptors passed to thefitting procedure may give rise to higher variance in the MARTmodel, i.e. less stability. In addition, using a large number ofdescriptors relative to the training set can lead to overfitting,where the developed model becomes too tailored to the inputsample. An overfitted model can perform poorly againstcompounds not used in the generation of the model, despitehigh accuracies obtained during model generation. By limiting theinput descriptors to the MART model, more stable and accuratemodels can often be produced.In this context, we limited the descriptors in the f-MART model
using the “influence trimming” approach, where low-influencedescriptors were removed iteratively such that at each step, thedescriptor with the lowest relative influence factor was removed,the model was refitted and the relative influence factor of
min (n ) ≥ 1.451/3W S
Antisites Δ Ef ≥ −0.5 eV / atom
Δ X Allred ≥ −0.68
Antisites Non-antisites
Non-antisites
Yes No
Yes
Yes
No
No
Fig. 4 DT- based classification scheme to predict the dominantdefect types in B2 compounds
Predicting defect behavior in B2 intermetallicsB Medasani et al
5
Published in partnership with the Shanghai Institute of Ceramics of the Chinese Academy of Sciences npj Computational Materials (2016) 1
remaining descriptors was recalculated. We carried out thisprocedure until further iteration would result in a model withless accuracy in comparison with the previous ones. The resultingMART model, called r-MART, is comprised of 2496 trees and retainsonly six descriptors. The confusion matrix for the r-MART model isgiven in Fig. 2d, and it shows that the r-MART model has a fitaccuracy of 98 % and predictive accuracy of 75 %. In comparisonwith the f-MART model, both fit and predictive accuracies areimproved. In particular, the r-MART model correctly classifies 49 B2compounds as antisite dominant and the other 49 ones as non-antisite dominant intermetallics, except the two alloy systems, i.e.RuAl and PdBe. It is also encouraging that the r-MART model doesnot exhibit any bias in classification, in contrast to what has beenobserved in both Neumann's and the simple DT models.The systems for which the predictions of ML models do not
agree with the outcomes from the DFT calculations are given inSI Table 4. It can be noticed that all three models wrongly predictthe dominant defects in BePd. Both the f-MART and DT modelswrongly predict the dominant defects in LiAg, TiFe, and NiZn.To validate that the r-MART model is not biased by the input set
of B2 intermetallic compounds, the accuracy of the r-MART istested against fourteen additional B2 intermetallics (given inSI Table 5) that are not used in the generation of the model. Forthe selected fourteen compounds, DFT calculations wereperformed to determine the dominant defect types and the DFTcomputed dominant defect types are compared with the r-MARTpredictions. For 11 of the 14 compounds, r-MART predictionsmatch with the results from DFT calculations giving a success rateof 78.6 %, which is in agreement with the 75 % predictive accuracyestimated from the 10-fold CV.The six descriptors retained in the r-MART model and
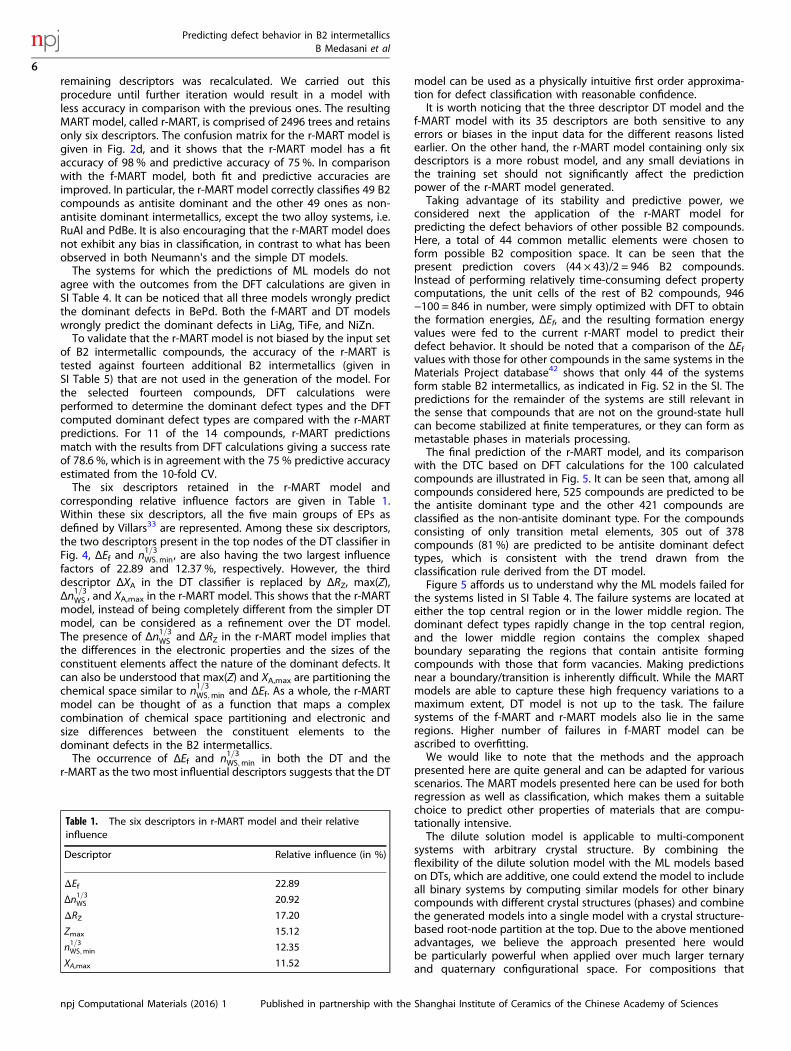
corresponding relative influence factors are given in Table 1.Within these six descriptors, all the five main groups of EPs asdefined by Villars33 are represented. Among these six descriptors,the two descriptors present in the top nodes of the DT classifier inFig. 4, ΔEf and n1=3WS;min, are also having the two largest influencefactors of 22.89 and 12.37 %, respectively. However, the thirddescriptor ΔXA in the DT classifier is replaced by ΔRZ, max(Z),Δn1=3WS , and XA,max in the r-MART model. This shows that the r-MARTmodel, instead of being completely different from the simpler DTmodel, can be considered as a refinement over the DT model.The presence of Δn1=3WS and ΔRZ in the r-MART model implies thatthe differences in the electronic properties and the sizes of theconstituent elements affect the nature of the dominant defects. Itcan also be understood that max(Z) and XA,max are partitioning thechemical space similar to n1=3WS;min and ΔEf. As a whole, the r-MARTmodel can be thought of as a function that maps a complexcombination of chemical space partitioning and electronic andsize differences between the constituent elements to thedominant defects in the B2 intermetallics.The occurrence of ΔEf and n1=3WS;min in both the DT and the
r-MART as the two most influential descriptors suggests that the DT
model can be used as a physically intuitive first order approxima-tion for defect classification with reasonable confidence.It is worth noticing that the three descriptor DT model and the
f-MART model with its 35 descriptors are both sensitive to anyerrors or biases in the input data for the different reasons listedearlier. On the other hand, the r-MART model containing only sixdescriptors is a more robust model, and any small deviations inthe training set should not significantly affect the predictionpower of the r-MART model generated.Taking advantage of its stability and predictive power, we
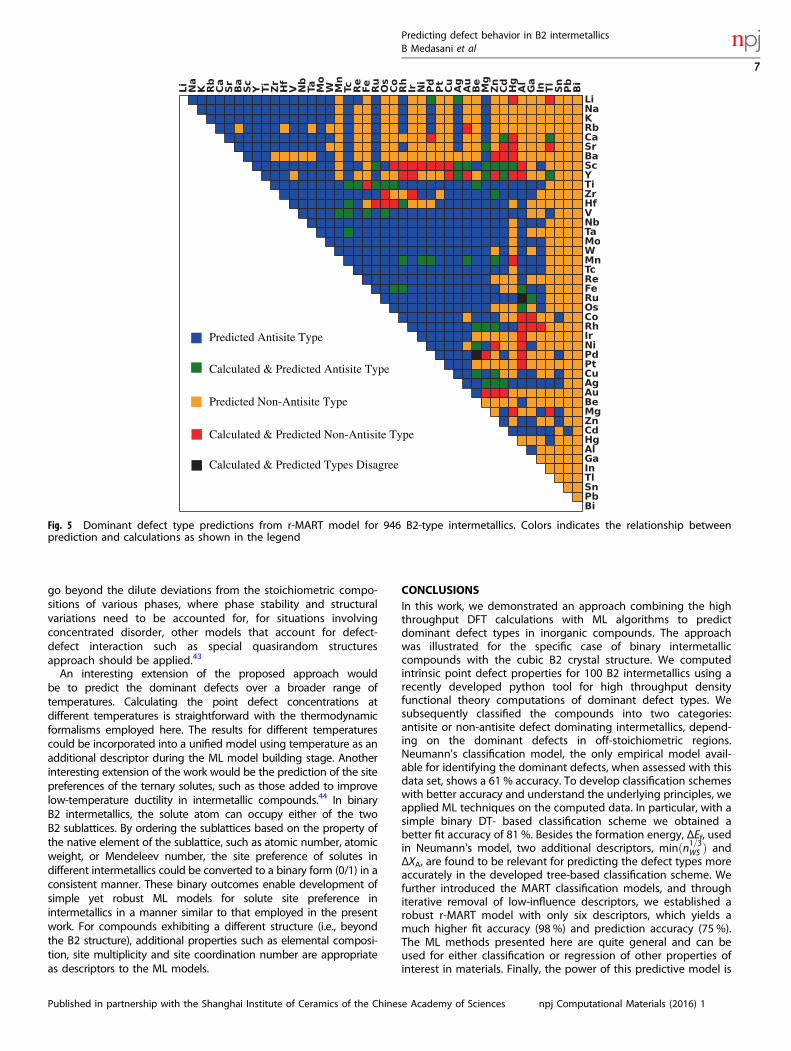
considered next the application of the r-MART model forpredicting the defect behaviors of other possible B2 compounds.Here, a total of 44 common metallic elements were chosen toform possible B2 composition space. It can be seen that thepresent prediction covers (44 × 43)/2 = 946 B2 compounds.Instead of performing relatively time-consuming defect propertycomputations, the unit cells of the rest of B2 compounds, 946−100 = 846 in number, were simply optimized with DFT to obtainthe formation energies, ΔEf, and the resulting formation energyvalues were fed to the current r-MART model to predict theirdefect behavior. It should be noted that a comparison of the ΔEfvalues with those for other compounds in the same systems in theMaterials Project database42 shows that only 44 of the systemsform stable B2 intermetallics, as indicated in Fig. S2 in the SI. Thepredictions for the remainder of the systems are still relevant inthe sense that compounds that are not on the ground-state hullcan become stabilized at finite temperatures, or they can form asmetastable phases in materials processing.The final prediction of the r-MART model, and its comparison
with the DTC based on DFT calculations for the 100 calculatedcompounds are illustrated in Fig. 5. It can be seen that, among allcompounds considered here, 525 compounds are predicted to bethe antisite dominant type and the other 421 compounds areclassified as the non-antisite dominant type. For the compoundsconsisting of only transition metal elements, 305 out of 378compounds (81 %) are predicted to be antisite dominant defecttypes, which is consistent with the trend drawn from theclassification rule derived from the DT model.Figure 5 affords us to understand why the ML models failed for
the systems listed in SI Table 4. The failure systems are located ateither the top central region or in the lower middle region. Thedominant defect types rapidly change in the top central region,and the lower middle region contains the complex shapedboundary separating the regions that contain antisite formingcompounds with those that form vacancies. Making predictionsnear a boundary/transition is inherently difficult. While the MARTmodels are able to capture these high frequency variations to amaximum extent, DT model is not up to the task. The failuresystems of the f-MART and r-MART models also lie in the sameregions. Higher number of failures in f-MART model can beascribed to overfitting.We would like to note that the methods and the approach
presented here are quite general and can be adapted for variousscenarios. The MART models presented here can be used for bothregression as well as classification, which makes them a suitablechoice to predict other properties of materials that are compu-tationally intensive.The dilute solution model is applicable to multi-component
systems with arbitrary crystal structure. By combining theflexibility of the dilute solution model with the ML models basedon DTs, which are additive, one could extend the model to includeall binary systems by computing similar models for other binarycompounds with different crystal structures (phases) and combinethe generated models into a single model with a crystal structure-based root-node partition at the top. Due to the above mentionedadvantages, we believe the approach presented here wouldbe particularly powerful when applied over much larger ternaryand quaternary configurational space. For compositions that
Table 1. The six descriptors in r-MART model and their relativeinfluence
Descriptor Relative influence (in %)
ΔEf 22.89
Δn1=3WS 20.92
ΔRZ 17.20
Zmax 15.12
n1=3WS;min 12.35
XA,max 11.52
Predicting defect behavior in B2 intermetallicsB Medasani et al
6
npj Computational Materials (2016) 1 Published in partnership with the Shanghai Institute of Ceramics of the Chinese Academy of Sciences
go beyond the dilute deviations from the stoichiometric compo-sitions of various phases, where phase stability and structuralvariations need to be accounted for, for situations involvingconcentrated disorder, other models that account for defect-defect interaction such as special quasirandom structuresapproach should be applied.43
An interesting extension of the proposed approach wouldbe to predict the dominant defects over a broader range oftemperatures. Calculating the point defect concentrations atdifferent temperatures is straightforward with the thermodynamicformalisms employed here. The results for different temperaturescould be incorporated into a unified model using temperature as anadditional descriptor during the ML model building stage. Anotherinteresting extension of the work would be the prediction of the sitepreferences of the ternary solutes, such as those added to improvelow-temperature ductility in intermetallic compounds.44 In binaryB2 intermetallics, the solute atom can occupy either of the twoB2 sublattices. By ordering the sublattices based on the property ofthe native element of the sublattice, such as atomic number, atomicweight, or Mendeleev number, the site preference of solutes indifferent intermetallics could be converted to a binary form (0/1) in aconsistent manner. These binary outcomes enable development ofsimple yet robust ML models for solute site preference inintermetallics in a manner similar to that employed in the presentwork. For compounds exhibiting a different structure (i.e., beyondthe B2 structure), additional properties such as elemental composi-tion, site multiplicity and site coordination number are appropriateas descriptors to the ML models.
CONCLUSIONSIn this work, we demonstrated an approach combining the highthroughput DFT calculations with ML algorithms to predictdominant defect types in inorganic compounds. The approachwas illustrated for the specific case of binary intermetalliccompounds with the cubic B2 crystal structure. We computedintrinsic point defect properties for 100 B2 intermetallics using arecently developed python tool for high throughput densityfunctional theory computations of dominant defect types. Wesubsequently classified the compounds into two categories:antisite or non-antisite defect dominating intermetallics, depend-ing on the dominant defects in off-stoichiometric regions.Neumann's classification model, the only empirical model avail-able for identifying the dominant defects, when assessed with thisdata set, shows a 61 % accuracy. To develop classification schemeswith better accuracy and understand the underlying principles, weapplied ML techniques on the computed data. In particular, with asimple binary DT- based classification scheme we obtained abetter fit accuracy of 81 %. Besides the formation energy, ΔEf, usedin Neumann's model, two additional descriptors, minðn1=3WS Þ andΔXA, are found to be relevant for predicting the defect types moreaccurately in the developed tree-based classification scheme. Wefurther introduced the MART classification models, and throughiterative removal of low-influence descriptors, we established arobust r-MART model with only six descriptors, which yields amuch higher fit accuracy (98 %) and prediction accuracy (75 %).The ML methods presented here are quite general and can beused for either classification or regression of other properties ofinterest in materials. Finally, the power of this predictive model is
Predicted Antisite Type
Calculated & Predicted Antisite Type
Predicted Non-Antisite Type
Calculated & Predicted Non-Antisite Type
Calculated & Predicted Types Disagree
Fig. 5 Dominant defect type predictions from r-MART model for 946 B2-type intermetallics. Colors indicates the relationship betweenprediction and calculations as shown in the legend
Predicting defect behavior in B2 intermetallicsB Medasani et al
7
Published in partnership with the Shanghai Institute of Ceramics of the Chinese Academy of Sciences npj Computational Materials (2016) 1
applied to classify the defect type of the other 846 possible B2compounds as shown in Fig. 5. The approach presented here canbe extended to multicomponent and multisublattice intermetal-lics, where the configuration space is much larger than thatconsidered here, as well as to charged point defects insemiconducting and insulating compounds.
METHODSDefect concentrations in a grand-canonical dilute-solutionformalismThe intrinsic point defect properties in B2 intermetallic compounds wereevaluated using the computational framework recently implemented inthe python code PyDI.I28 This framework uses the grand-canonical, dilute-solution thermodynamic formalism described in Ref. 27 to predict intrinsicpoint defect concentrations in ordered intermetallic compounds as afunction of temperature and composition deviating slightly fromstoichiometry. In this formalism, defect concentrations and thereforedominant defect types can be computed at off-stoichiometric composi-tions using DFT calculations for supercells based on the ideal stoichio-metric compound, with only a single defect present. In the present work,we computed the point-defect concentrations at the temperature of 1000K, and limited the composition ranges to +\−1 % around the stoichiometric50/50 composition. The resulting defect concentrations are much lowerthan those required for the B2 intermetallic compounds to form a solid-solution phase. For both concentration regions, i.e. A-poor (B-rich) andA-rich (B-poor), the dominant defect type, which can be either vacancy orantisite, are identified. In the remainder of this section, we briefly reviewthe computational formalism.For binary B2-type intermetallic compounds, with the crystal structure
shown in Fig. 1a, each site p in the structure can be occupied by oneof two atom types (A or B) or a vacancy. The occupation at each site isdenoted by a local concentration variable ci(p) which takes a value of 1 ifatom type i is at site p and zero otherwise. In the current application, i = 1or 2 denotes atom of type A or B, respectively. For a stoichiometric,perfectly ordered B2 structure, c1ðpÞ � c0i ðpÞ ¼ 1 for all sites p on theA-type sublattice, and zero otherwise, and c2ðpÞ � c02ðpÞ ¼ 1 for all sitesp on the B-type sublattice, and zero otherwise. More generally, for acompound at finite temperature of off stoichiometry, the values of ci(p) willdiffer from the values c0i ðpÞ due to the presence of nonzero equilibriumpoint defect concentrations, and the total number of atoms of type i, Ni, isgiven by the following sum: Ni ¼
Pp¼1;2ciðpÞ. The overall mole fraction of
atoms of type B is then defined as x2 = N2/(N1 + N2), and similarly for themole fraction of species 1 (x1 = 1−x2).In the dilute-solution model, a first-order low-temperature expansion
of the grand potential, Ω, yields
Ω ¼ E0 �X
i
μiX
p
c0i ðpÞ � kBTX
p
X
ϵ
expf�½δEϵðpÞ �X
i
μiδcϵi ðpÞ�=kBTg:
ð1ÞHere, E0 denotes the ground-state energy for a perfectly ordered
stoichiometric B2 compound, μi is the chemical potential of element i, kB isBoltzmann's constant and T is temperature. The variable ε in the secondsum for the third term on the right hand side of Eq. (1) denotes a possiblepoint defect (i.e., an antisite or vacancy) leading to an energy change δEϵ(p)and change in the site occupation variables δcεi . Following the terminologyused in ref. 27, hereafter, δEϵ(p) and δEϵðpÞ �P
iμiδcϵi ðpÞ will be referred to
as defect “excitation energy” and defect formation energy, respectively.From Eq. (1), the following relation can also be derived:
hciðpÞi ¼ c0i ðpÞ þX
ϵ
δcϵi ðpÞ � expf�½δEϵðpÞ �X
j
μjδcϵj ðpÞ�=kBTg; ð2Þ
where ⟨ci(p)⟩ denotes the ensemble averaged concentration of element i atsite p; note that by symmetry ⟨ci(p)⟩ will be equal for all sites p belongingto a given sublattice. For any composition, by specifying the mole fractionsbetween the two constituent elements and by setting the grand-potentialΩ in Eq. (1) equal to zero (corresponding to thermodynamic equilibriumrelative to the number of lattice sites under zero stress conditions), weobtain the two equations needed for determining the chemical potentialsof the two elements in a B2 compound. Substituting the resulting chemicalpotentials into Eq. (2) yields the equilibrium defect concentrations for agiven temperature and input values of chemical potentials (whichdetermine the overall composition of the alloy).
Density functional theory (DFT) calculationsPeriodic supercells were used to compute the defect energies arising inEqs. (1) and (2). In this approach, the defect excitation energy, δEϵ(p), foreither an antisite or a vacancy defect is given by
δEϵðpÞ ¼ EϵdefðpÞ � E0; ð3Þwhere EϵdefðpÞ is the energy of the supercell with defect ϵ at site p, and E0 isthe energy of the non-defected bulk supercell. Bulk and defect supercellswere generated with PyDII28 from the optimized structures in the MaterialsProject database.26
The energies of supercells were computed within the framework of DFTusing the Vienna ab initio simulation package.45–47 We used the projectoraugmented wave method48,49 and the Perdew, Burke and Ernzerhof50
generalized-gradient approximation (GGA) for the exchange-correlationfunctional. For all the calculations, a cut-off value of 520 eV was used forplane-wave basis set. Spin polarization with ferromagnetic spin orderingwas considered as the starting point for all calculations. Based on our tests(the details are presented in SI Table 6), accounting for anti-ferromagneticordering for those systems where it was energetically favorable, did notlead to changes in the predictions for the dominant DTC.The defect supercells were optimized by relaxing the atomic positions at
constant volume until the individual forces on each atom were minimizedto be less than 0.01 eV/Å. Based on convergence tests of defect energieswith respect to supercell size and k-point sampling mesh, we used 4 × 4 ×4 B2 supercells (128 atoms) with 4 × 4 × 4 Monkhorst-Pack k-point grid forall calculations. We tested the influence of the supercell size on dominantDTC by computing the defect energetics of five B2 systems for differentsupercell sizes given in SI Table 7. The selected five systems are on groundstate hull, and have large size differences between the host atoms whichhelps us to check the effect of strain-induced interactions. In thecompounds considered, the difference in the excitation energiesof a defect in 4 × 4 × 4 supercell and the corresponding defect in larger6 × 6 × 6 supercell was found to be much less than the differences in theexcitation energies of the defects. As an example, composition-dependentdefect concentrations in ScPt for the different supercell sizes listed in SITable 7 are plotted in SI Fig. S3. In all the systems considered, the dominantdefect types have been found to remain unaffected by increasing thesupercell size beyond the 4 × 4 × 4 setting used in this study. The first-order Methfessel Paxton method51 with a smearing width of 0.2 eV wasused for electronic smearing.
Machine learning: Decision treesTo predict the defect types of B2 intermetallics, we developed threeclassifiers, each of which uses binary DTs41 as base learners. A binary DT isa function which maps descriptors X ≡ {xi} to classes {c}, which, in our case,take only two values (c = 0 or 1): antisite or non-antisite types. The keyadvantage of tree-based classification schemes is their interpretability,because each non-leaf node in the tree corresponds to answering a simplequestion of the form “is xi≤ s?”, where s is some value in the domain of xi. Ifthe answer to this question is yes, then one looks at the question posed bythe left-hand child node, assuming it is not a leaf, and if the answer to thequestion is no, then one looks at the question posed by the right-handchild node. Final predictions are simply read from the leaf nodes, whereeach one specifies either c = 0 or c = 1.Mathematically, each node m of the classification tree represents a
subset of the descriptor space Xm which contains Nm data points and thecorresponding outcomes, fym1; ¼ ; ymNm
g. Taking I(yi = c) = 1 if ith observa-tion, yi, is of class c and 0 otherwise, we can define
p̂m;c ¼1Nm
X
i¼1;Nm
Iðyi ¼ cÞ ð4Þ
to be the proportion of class c observations in node m. The data pointsin node m are then assigned to the majority class c� ¼ argmaxc p̂m;c .Recursive partitioning is used to construct DTs. Starting with the root node,which contains the entire data set, the data at each node is split bysplitting descriptor xj at a split point sj such that the resulting partitiondefines two child nodes, m1 and m2, whose descriptor data is given by
Xm;m1 ðxj ; sjÞ ¼ fX 2 mjxj � sjg and Xm;m2 ðxj ; sjÞ ¼ fX 2 mjxj>sjg: ð5ÞThe objective at each node is to engineer the split such that the child
nodes are as homogeneous as possible. This homogeneity can bemeasured in various ways, including entropy, the so-called Gini index(which is another measure of entropy), and (raw) classification error. The
Predicting defect behavior in B2 intermetallicsB Medasani et al
8
npj Computational Materials (2016) 1 Published in partnership with the Shanghai Institute of Ceramics of the Chinese Academy of Sciences
splitting is stopped when any one of the following criteria is met: (a) nodescriptor can be found which produces a useful split of the data, inwhich case splitting really cannot continue; (b) there are fewer thansome number of observations in the current node—here, we use thenumber of 6; (c) the tree has reached a pre-specified depth so as tominimize overfitting. To avoid overfitting, k-fold cross-validation is used toidentify the tree with the lowest estimated prediction error.
ACKNOWLEDGEMENTSThis work was intellectually led by the Department of Energy (DOE) Basic EnergySciences (BES) program—the Materials Project—under Grant No. EDCBEE. Thisresearch used resources of the National Energy Research Scientific ComputingCenter, which is supported by the Office of Science of the U.S. Department of Energyunder Contract No. DEAC02-05CH11231.
AUTHOR CONTRIBUTIONSM.A., M.H., A.C., and K.A.P. conceived the research and provided guidance. B.M., H.D.,and W.C. performed simulations of material properties. A.G. and B.M. performed MLanalysis. B.M., H.D., A.G., and M.A. wrote the paper. All authors analyzed the resultsand revised the paper.
COMPETING INTERESTSThe authors declare that they have no conflict of interest.
REFERENCES1 Carling, K. et al. Vacancies in metals: from first-principles calculations to experi-
mental data. Phys. Rev. Lett. 85, 3862–3865 (2000).2 Nguyen-Manh, D., Horsfield, A. P. & Dudarev, S. L. Self-interstitial atom defects in
bcc transition metals: Group-specific trends. Phys. Rev. B 73, 020101 (2006).3 Ding, H., Razumovskiy, V. I. & Asta, M. Self diffusion anomaly in ferromagnetic
metals: a density-functional-theory investigation of magnetically ordered anddisordered Fe and Co. Acta Mater. 70, 130–136 (2014).
4 Freysoldt, C. et al. First-principles calculations for point defects in solids. Rev. Mod.Phys. 86, 253–305 (2014).
5 Angsten, T., Mayeshiba, T., Wu, H. & Morgan, D. Elemental vacancy diffusiondatabase from high throughput first-principles calculations for fcc and hcpstructures. New J. Phys. 16, 015018 (2014).
6 Medasani, B., Haranczyk, M., Canning, A. & Asta, M. Vacancy formation energies inmetals: a comparison of MetaGGA with LDA and GGA exchangecorrelationfunctionals. Comput. Mater. Sci. 101, 96–107 (2015).
7 Morgan, D., Ceder, G. & Curtarolo, S. High throughput and data mining with abinitio methods. Meas. Sci. Technol. 16, 296–391 (2004).
8 Jain, A. et al. A high throughput infrastructure for density functional theory cal-culations. Comput. Mater. Sci. 50, 2295–2310 (2011).
9 Jain, A., Shin, Y. & Persson, K. A. Computational predictions of energy materialsusing density functional theory. Nat. Rev. Mater 1, 15004 (2016).
10 Mueller, T., Kusne, A. & Ramprasad, R. In Reviews in Computational Chemistry,Vol 29 (eds Parrill, A. L. & Lipkowitz, K. B.) Ch. 4 (John Wiley & Sons, Inc, 2015).
11 Hautier, G., Fischer, C. C., Jain, A., Mueller, T. & Ceder, G. Finding natures missingternary oxide compounds using machine learning and density functional theory.Chem. Mater. 22, 3762–3767 (2010).
12 Rupp, M., Tkatchenko, A., Müller, K. R. & Von Lilienfeld, O. A. Fast and accuratemodeling of molecular atomization energies with machine learning. Phys. Rev.Lett. 108, 058301 (2012).
13 Meredig, B. & Wolverton, C. A hybrid computational-experimental approach forautomated crystal structure solution. Nat. Mater. 12, 123–127 (2013).
14 Isayev, O. et al. Materials cartography: representing and mining materialsspace using structural and electronic fingerprints. Chem. Mater. 27, 735–743(2015).
15 Simon, C. M., Mercado, R., Schnell, S. K., Smit, B. & Haranczyk, M. What are the bestmaterials to separate a xenon/krypton mixture?. Chem. Mater. 27, 4459–4475(2015).
16 Pilania, G., Gubernatis, J. E. & Lookman, T. Classification of octet AB-type binarycompounds using dynamical charges: a materials informatics perspective. Sci.Rep. 5, 17504 (2015).
17 Ward, L. et al. A general-purpose machine learning framework for predictingproperties of inorganic materials. npj Comput. Mater. 2, 16028 (2016).
18 Choudhury, S. et al. Ab-initio based modeling of diffusion in dilute bcc FeNi andFeCr alloys and implications for radiation induced segregation. J. Nucl. Mater. 411,1–14 (2011).
19 Choe, H. & Dunand, D. C. Synthesis, structure, and mechanical properties of Ni--Aland Ni-Cr-Al superalloy foams. Acta Mater. 52, 1283–1295 (2004).
20 Teng, Z. et al. Characterization of nanoscale nial-type precipitates in a ferriticsteel by electron microscopy and atom probe tomography. Scr. Mater 63, 61–64(2010).
21 Song, G. et al. Ferritic alloys with extreme creep resistance via coherent hier-archical precipitates. Sci. Rep. 5, 16327 (2015).
22 Subramanian, P., Mendiratta, M. & Dimiduk, D. The development of Nb-basedadvanced intermetallic alloys for structural applications. JOM 48, 33–38 (1996).
23 Clemens, H. & Smarsly, W. Light-weight intermetallic titanium aluminides-status ofresearch and development. Adv. Mat. Res. 278, 551–556 (2011).
24 Neumann, J. On the occurrence of substitutional and triple defects in intermetallicphases with the B2 structure. Acta Metall. 28, 1165–1170 (1980).
25 Steinberg, D. Rules of thumb when working with small data samples. https://www.salford-systems.com/blog/dan-steinberg/rules-of-thumb-when-working-with-small-data-samples. Accessed: 29 June 2016.
26 Jain, A. et al. Commentary: the materials project: a materials genome approach toaccelerating materials innovation. APL Mater 1, 011002 (2013).
27 Woodward, C., Asta, M., Kresse, G. & Hafner, J. Density of constitutional andthermal point defects in L12 Al3Sc. Phys. Rev. B 63, 094103 (2001).
28 Ding, H. et al. PyDII: a python framework for computing equilibrium intrinsic pointdefect concentrations and extrinsic solute site preferences in intermetallic com-pounds. Comput. Phys. Commun. 193, 118–123 (2015).
29 Jain, A. et al. Fireworks: a dynamic workflow system designed for high throughputapplications. Concurr. Comput. 27, 5037–5059 (2015).
30 Mooser, E. & Pearson, W. B. On the crystal chemistry of normal valence com-pounds. Acta Crystallogr. 12, 1015–1022 (1959).
31 Miedema, A. R., Boom, R. & Boer, F. R. D. On the heat of formation of solid alloys.J. Less-Common Met 41, 283–298 (1975).
32 Kong, C. S. et al. Information-theoretic approach for the discovery of design rulesfor crystal chemistry. J. Chem. Inf. Model. 52, 1812–1820 (2012).
33 Villars, P. In Intermetallic Compounds, Vol. 1, Crystal Structures of (eds Westbrook,J. C. & Fleischer, R. L.) Ch. 1 (Wiley, 2000).
34 Pilania, G., Gubernatis, J. E. & Lookman, T. Structure classification and meltingtemperature prediction in octet ab solids via machine learning. Phys. Rev. B 91,214302 (2015).
35 Seko, A., Maekawa, T., Tsuda, K. & Tanaka, I. Machine learning with systematicdensity-functional theory calculations: application to melting temperatures ofsingle- and binary-component solids. Phys. Rev. B 89, 054303 (2014).
36 Spearman, C. The proof and measurement of association between two things.Am. J. Psychol. 15, 72–101 (1904).
37 Mann, H. B. & Whitney, D. R. On a test of whether one of two random variables isstochastically larger than the other. Ann. Math. Statist 18, 50–60 (1947).
38 Zunger, A. Systematization of the stable crystal structure of all AB-typebinary compounds: a pseudopotential orbital-radii approach. Phys. Rev. B 22,5839–5872 (1980).
39 Clementi, E. & Raimondi, D. L. Atomic screening constants from scf functions.J. Chem. Phys. 38, 2686–2689 (1963).
40 R Development Core Team. R: A Language and Environment for StatisticalComputing. R Foundation for Statistical Computing: Vienna, Austria, 2008. ISBN3-900051-07-0, http://www.R-project.org/.
41 Hastie, T., Tibshirani, R. & Friedman, J. The Elements of Statistical Learning, 2nd edn(Springer, 2013).
42 Meredig, B. et al. Combinatorial screening for new materials in unconstrainedcomposition space with machine learning. Phys. Rev. B 89, 094104 (2014).
43 Jiang, C., Chen, L.-Q. & Liu, Z.-K. First-principles study of constitutional pointdefects in B2 NiAl using special quasirandom structures. Acta Mater. 53,2643–2652 (2005).
44 Jiang, C. Site preference of transition-metal elements in B2 NiAl: A comprehensivestudy. Acta Mater. 55, 4799–4806 (2007).
45 Kresse, G. & Hafner, J. Ab initio molecular dynamics for liquid metals. Phys. Rev. B47, 558–561 (1993).
46 Kresse, G. & Hafner, J. Ab initio molecular-dynamics simulation of the liquid-metal21amorphous-semiconductor transition in germanium. Phys. Rev. B 49,14251–14269 (1994).
47 Kresse, G. & Furthmüller, J. Efficient iterative schemes for ab initiototal-energy calculations using a plane-wave basis set. Phys. Rev. B 54,11169–11186 (1996).
48 Blöchl, P. E. Projector augmented-wave method. Phys. Rev. B 50, 17953–17979 (1994).49 Kresse, G. & Joubert, D. From ultrasoft pseudopotentials to the projector
augmented-wave method. Phys. Rev. B 59, 1758–1775 (1999).
Predicting defect behavior in B2 intermetallicsB Medasani et al
9
Published in partnership with the Shanghai Institute of Ceramics of the Chinese Academy of Sciences npj Computational Materials (2016) 1

50 Perdew, J. P., Burke, K. & Ernzerhof, M. Generalized gradient approximation madesimple. Phys. Rev. Lett. 77, 3865–3868 (1996).
51 Methfessel, M. & Paxton, A. T. High-precision sampling for brillouin-zone inte-gration in metals. Phys. Rev. B 40, 3616–3621 (1989).
This work is licensed under a Creative Commons Attribution 4.0International License. The images or other third party material in this
article are included in the article’s Creative Commons license, unless indicatedotherwise in the credit line; if the material is not included under the Creative Commonslicense, users will need to obtain permission from the license holder to reproduce thematerial. To view a copy of this license, visit http://creativecommons.org/licenses/by/4.0/
© The Author(s) 2016
Supplementary Information accompanies the paper on the npj Computational Materials website (doi:10.1038/s41524-016-0001-z).
Predicting defect behavior in B2 intermetallicsB Medasani et al
10
npj Computational Materials (2016) 1 Published in partnership with the Shanghai Institute of Ceramics of the Chinese Academy of Sciences