predictors of depression - university of...
TRANSCRIPT
2 | P a g e
PREDICTORS OF DEPRESSION
A study submitted in partial fulfilment
of the requirements for the degree of
MSc Data Science
at
THE UNIVERSITY OF SHEFFIELD
by
PRANSHU BHASIN
September 2016
3 | P a g e
Abstract
Background. A great deal of previous research has highlighted the prevalence of depression
among older adults and its further complications associated with elderly population.
Increasing ageing population has made it even more important to explore predictors of
depression as questions related to the main causes and treatment of depression in older
adults are not completely determined.
Aim. To find predictors of depression within the English Longitudinal Study of Ageing (ELSA)
from the ten factors considered in this study which are as follows. Demographic factors
(age; gender; marital status; children), health factors (insomnia; self-rated health; long
standing illness), other factors (loneliness; financial strain; alcohol consumption).
Design and Methods. By using data from all 6 waves of the English Longitudinal Study of
Ageing, a longitudinal analysis was performed to find predictors of depression by using
descriptive statistics, bivariate and multi variate analysis using SPSS. The predictive ability of
these factors related to depression were further explored by data mining algorithms in
Weka. Different visualisations were produced using SPSS, Excel and Tableau to have a
better understanding about what predicts depression in older adults.
Results. The four predictors out of ten considered factors in this study were: Self-rated
health, loneliness, insomnia and financial strain. Both of the datamining algorithms used in
this study were able to produce good accuracy rates for predicting depression using these
ten factors. Tree visualisation showed that 53 depressed respondents and 2953 non
depressed respondents were present throughout all waves of ELSA. The status of each of
the factor associated with the respondents that were depressed throughout all waves of
ELSA was found to be same at the beginning and at the end of the longitudinal study for all
factors except factors related to alcohol consumption and financial strain.
Conclusion. Among demographic factors, age and gender were insignificant for most of the
waves, whereas marital status was insignificant throughout all waves of ELSA. The factor
related to children was not found to be associated with depression even at bivariate
analysis. Among health factors, insomnia and self-rated health were significantly associated
with depression whereas long standing illness was insignificant throughout all waves. And
among other factors, loneliness and financial strain were significantly associated with
depression whereas alcohol consumption was found to be not significant for each of the
wave of ELSA.
4 | P a g e
Acknowledgements
I would like to thank my supervisor - Professor Peter Bath, as without his help it
would have been very difficult to write this dissertation. He clarified all my doubts
very patiently. I genuinely appreciate his help and support.
Also, no acknowledgement made by me can be complete without mentioning my
heartiest thanks to God and my family for their constant love, support and blessings.
5 | P a g e
Contents Chapter One: Introduction and Context ........................................................................... 8
1.1. Ageing Population ......................................................................................................... 8
1.2. Depression ...................................................................................................................... 8
1.3. Depression in older adults ............................................................................................ 9
1.4. Importance of the study topic .................................................................................... 10
1.5. Research Aims and Objectives ................................................................................... 10
1.6. Structure of the Dissertation Chapters ..................................................................... 11
Chapter Two: Literature Review ..................................................................................... 12
2.1. Considered Risk factors.............................................................................................. 12
a) Gender .............................................................................................................................. 12
b) Age .................................................................................................................................. 13
c) Marital Status ................................................................................................................... 14
d) Children ........................................................................................................................... 15
e) Insomnia........................................................................................................................... 16
f) Self-rated health ............................................................................................................... 16
g) Long standing health problem (Long standing illness/disability/infirmity) .................... 17
h) Loneliness ........................................................................................................................ 18
i) Financial Strain ................................................................................................................. 19
j) Alcohol Consumption ....................................................................................................... 19
Chapter Three: Methodology ........................................................................................... 21
3.1. Quantitative Research Approach .............................................................................. 21
3.2. ELSA Background ...................................................................................................... 21
3.3. Considered Variables .................................................................................................. 21
3.4. Statistical Techniques ................................................................................................. 22
a). Descriptive Statistics ....................................................................................................... 22
b). Bivariate Analysis ........................................................................................................... 23
c). Multivariate Analysis ...................................................................................................... 23
3.5. Data Mining Techniques ............................................................................................ 24
a). Support vector machines ................................................................................................. 25
b). Decision trees ................................................................................................................. 25
3.6. Data for depressed or not depressed throughout all waves (Subset data) ............. 25
3.7. Tree diagram and the status of each factor .............................................................. 26
Chapter Four: Data analysis and results ......................................................................... 27
4.1. Statistical Analysis of ELSA....................................................................................... 27
6 | P a g e
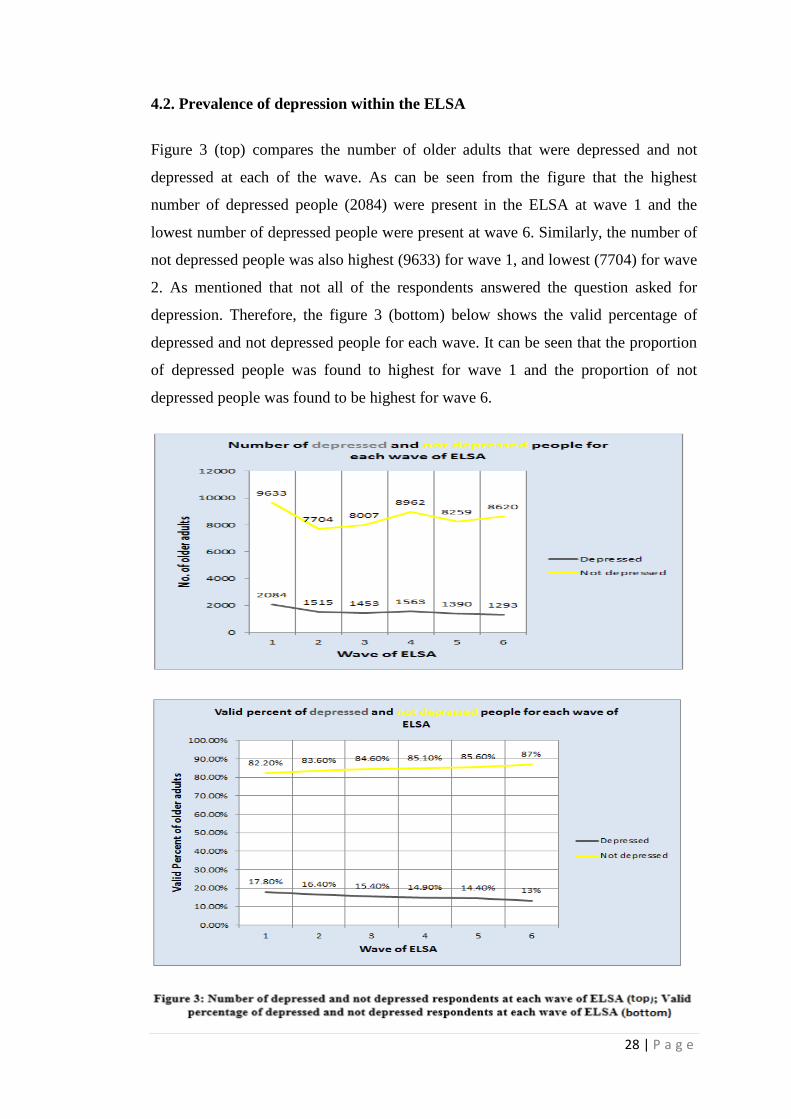
4.2. Prevalence of depression within the ELSA ............................................................... 28
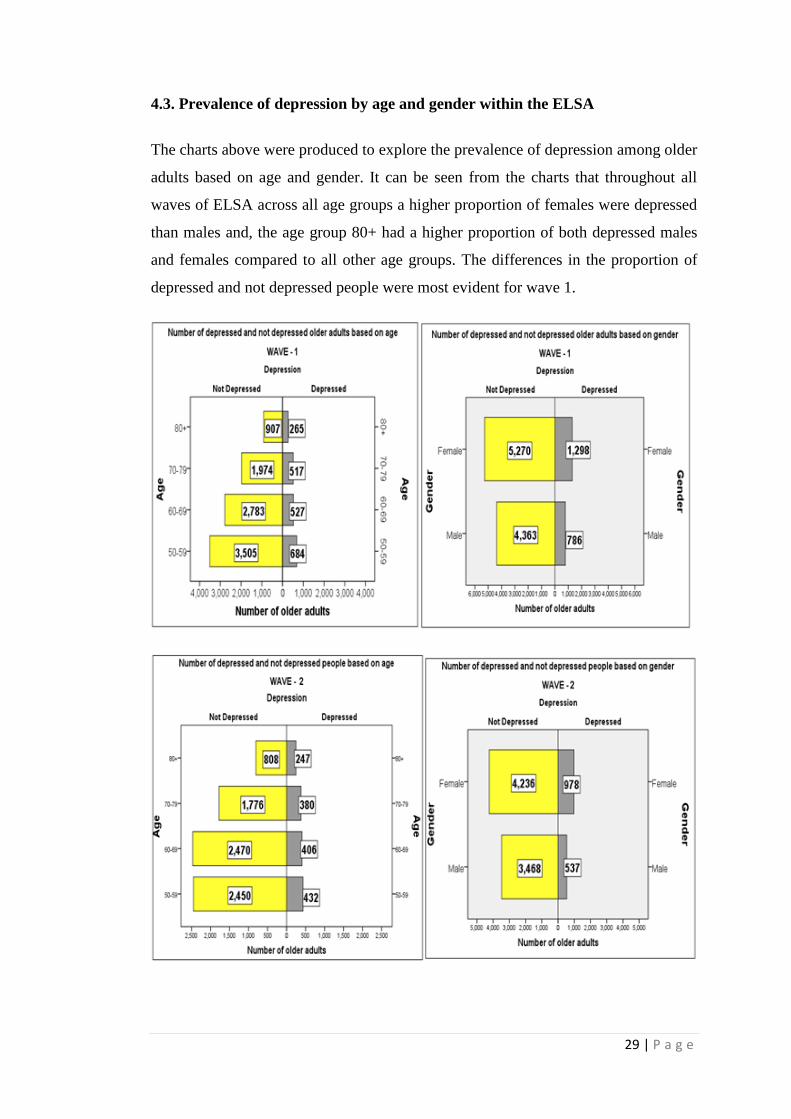
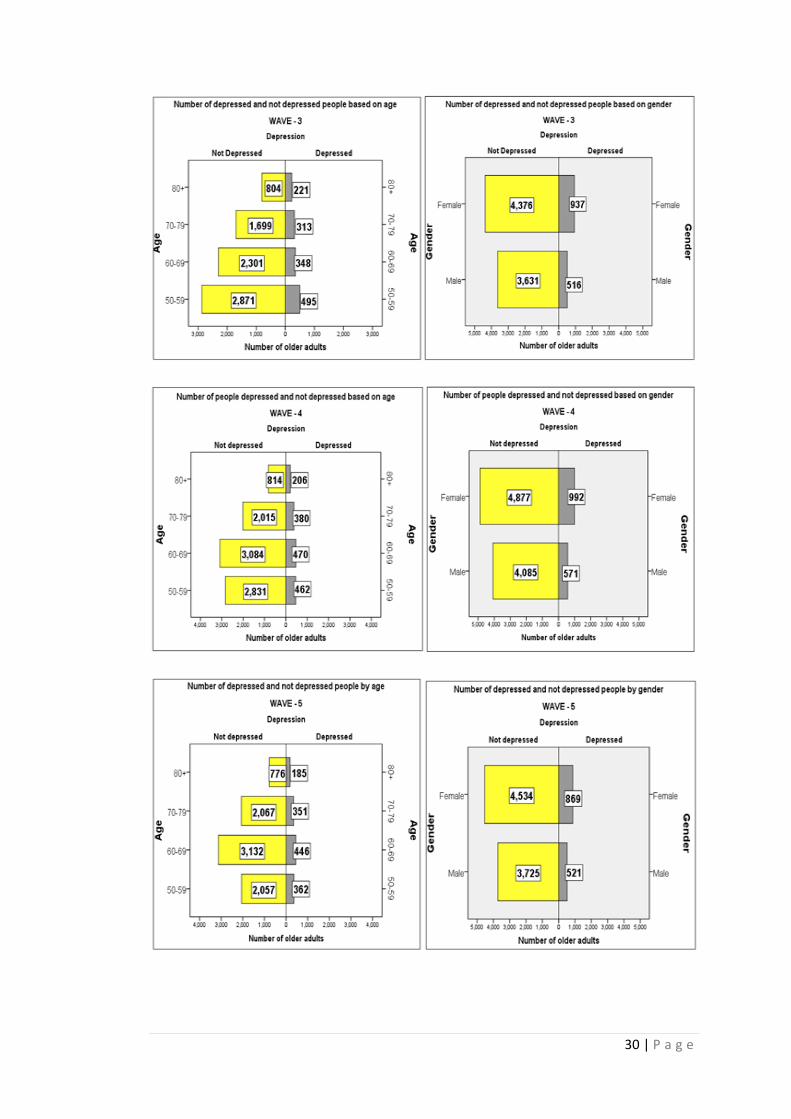
4.3. Prevalence of depression by age and gender within the ELSA ............................... 29
4.4. Univariate Analysis ..................................................................................................... 31
4.5. Prevalence of depression by factors .......................................................................... 34
4.6. Distribution of depression variable by factors broken down by age and gender .. 45
a). Depression by marital status broken down by age and gender ....................................... 45
b). Depression by children broken down by age and gender ............................................... 46
c). Depression by Insomnia broken down by age and gender .............................................. 47
d). Depression by self-rated health broken down by age and gender .................................. 48
e). Depression by Long standing illness broken down by age and gender .......................... 49
f). Depression by Loneliness broken down by age and gender ............................................ 49
g). Depression by Financial strain broken down by age and gender.................................... 50
h). Depression by Alcohol broken down by age and gender ............................................... 51
4.5. Logistic Regression ..................................................................................................... 58
4.6. Comparison of the predictors of depression ............................................................. 67
4.7. Data mining techniques .............................................................................................. 67
4.8. Tree diagram ............................................................................................................... 70
Chapter 5: Discussion ........................................................................................................ 76
5.1. Predictors (The most significant risk factors) .......................................................... 76
a) Self-rated health ............................................................................................................... 76
b) Loneliness ........................................................................................................................ 76
c)Insomnia............................................................................................................................ 77
d)Financial Strain ................................................................................................................. 77
5.2. Insignificant factors - Not at all significant .............................................................. 78
a). Long standing illness/disability/infirmity ....................................................................... 78
b). Marital status .................................................................................................................. 79
5.3. Mostly insignificant factors ........................................................................................ 79
a) Gender .............................................................................................................................. 79
b) Age .................................................................................................................................. 80
c). Alcohol............................................................................................................................ 80
5.4. Not associated factor ................................................................................................... 81
a) Children ........................................................................................................................... 81
Chapter Six: Conclusion and Recommendations ............................................................ 82
6.1. Conclusion .................................................................................................................... 82
6.2. Limitations of this study ............................................................................................. 82

7 | P a g e
a). From the data perspective ............................................................................................... 82
b). From the methods perspective ........................................................................................ 83
c)From the results perspective ............................................................................................. 83
6.3. Strengths of this study ................................................................................................ 84
6.4. Recommendations for Future Research ................................................................... 84
References ........................................................................................................................... 85
Appendix ........................................................................................................................... 105
Forms ................................................................................................................................ 115
8 | P a g e
Chapter One: Introduction and Context
1.1. Ageing Population
In the 20th century, the world has witnessed a remarkable increase in the population
due to several factors such as decreased mortality rates, increased life expectancy,
lower fertility rates, and lesser immigration (Lunenfeld & Stratton, 2013). If the rate
at which the world population is increasing continues through this century, sooner
the 21st century would be called as the ageing century (Christensen, Doblhammer,
Rau, & Vaupel, 2009). In the United Kingdom only, the number of older adults aged
65 and over is now more than the number of children of age less than 15. It is also
estimated that the population of older adults in England only is expected to rise by 39
percent over the coming twenty years (Banerjee, 2014). Progressive ageing
population in the recent decades have given rise to some new challenges in the field
of global public health (Hill, Pérez-stable, Anderson, & Bernard, 2015). It has also
been noted that the prevalence of health problems in the older population has
remarkably increased over the past century which leads to increased healthcare costs
for the society (Jokela, Batty, & Kivimäki, 2013). Among different physical and
mental health problems faced by elderly, depression in older adults, which is
associated with additional ageing problems is considered to be one of the primary
contributors to increased healthcare expenditures and is expected to be one of the
most prominent cause of additional healthcare cost in the developed countries by the
end of 2030 (Maideen, Sidik, Rampal, & Mukhtar, 2015).
1.2. Depression
When a person stops looking out for the meaning and purpose of his/her life and
creates a situation where everything seems meaningless for him/her gives rise to
depressive symptoms (Hodges, 2002). Depression is primarily a psychiatric
condition which significantly affects the mental and physical health of the patient
(Blazer, Hughes, & George, 1987). Depressive symptoms are also the most frequent
psychiatric symptoms and major cause of decreased quality of life (Blazer, 2003). A
combination of different factors of personality and frame of mind can cause
depression in people which can be identified based upon clinical or psychosocial
approach. In the area of mental health, questions related to depression such as how it

9 | P a g e
is classified, what are the root causes and treatment are not fully resolved yet
(Goldstein, & Rosselli, 2016). Although, depression has been explained as an
individual understanding problem which differentiates it from physical healthcare
(Reitzes, Mutran, & Fernandez, 1996) however, it is not only a personal health
failure but a failure in the way health care field and society have understood and
responded to the problems related to this field (Lewis, 1995). The prevalence of
depression across cultures is further evident from various studies and surveys of
different countries performed by WHO (Offici, 2001).
1.3. Depression in older adults
From the classical times depression has been one of the most common mental
disorder in later life, affecting up to 15% older adults of age 65 and above
(Livingston, Hawkins, Graham, &Blizard, 1990). All over the world depression in
elderly has become a more serious health problem due to three main reasons: first,
the ageing population and eventually increased number of older adults with
depression, second, its consequences are recognised by WHO on the “global burden
of disease”(Lopez & Murray, 1998), and third, achievements in the field of
neuroscience have further increased knowledge and understanding about serious
consequences and sufferings that accompany depression in old age (Blazer, Hughes,
& George, 1987). Depression in old age is considered to be more harmful because
neither the patient nor the clinician in most of the cases is able to identify its
symptoms in presence of other health problems (Loder, 2009). Depression when co-
exists with other health problem in elderly leads to several other complications and
further deteriorate the condition of existing health problems, for instance, it can lead
to functional disability when it co-exists with physical health illness (Gureje,
Ademola, & Olley, 2008). It has also been noted that the response of elderly to the
medical treatment is less and depression happens to be more severe if the first onset
of depression is in old age in comparison to older adults that suffers from recurrent
depression in old age (Blazer, Hughes, & George, 1987). Depression in older adults
is also identified as an independent predictive factor for suicide and in the suicide
cases of older adults aged 75 and over, 80% of them had depressive symptoms
(Alexopoulos, 2005).

10 | P a g e
1.4. Importance of the study topic
Depression is not a part of normal ageing but a condition that can be prevented (Scott,
1989). Depression is considered to be one of those mental health problems that can
be treated effectively and efficiently if diagnosed and treated on time without a much
delay (Bower, 1986). There is a need to fill the gap that exists between depression
recognition and its intervention in older adults as the diagnosis of depression in older
people is difficult (Murray et al., 2006). Depression in older adults is further
complicated by the fact that majority of older people do not report their depressive
symptoms by considering them as a part of ageing instead of considering them as
sign of a mental health problem that needs to be considered and treated (Vanessa et
al., 2006) due to which depression in older adults for most of the cases are under-
diagnosed and under-treated (Rosenvinge, 1988). Apart from this, few studies have
suggested that older people intentionally do not report or admit these symptoms due
to the stigma attached with the mental disorders (Blazer, 2003) which again results in
often under-recognised and under-treated disorder (Anderson, 2001) even when the
fact is that major cases of depression are found in older adults. Also, for clinicians, to
predict prognosis of depression is poor when it comes to old age (Subramaniam &
Mitchell, 2005). Therefore, deep understanding and knowledge about predictors of
depression will help both clinicians and patients to have a better understanding about
this mental disorder and to be aware about its predictors for recognising depression at
early stages and where possible trying to work out on the factors that can prevent
depression.
1.5. Research Aims and Objectives
The main aim of this dissertation is to find predictors of depression in older adults.
The aim of the dissertation is met by achieving a number of objectives as follows.
First, to review the previous literature related to depression and its association with
different factors in order to select the most relevant factors discussed with depression
and could be the potential predictors of depression. Second, to explore the prevalence
of overall depression for all waves of ELSA and with each factor considered in this
study. Third, analysing ELSA dataset for all six waves to find relationship between
depression and chosen interested variables using bivariate analysis and then to
11 | P a g e
identify the major correlates of depression and classifying predictors based on
multivariate analysis using SPSS. Fourth, to identify the individuals who were either
depressed or not depressed throughout all six waves of ELSA to identify predictors
of depression for these individuals to allow a comparison of these results obtained
with predictors of depression identified from the analysis of general population
sample for all 6 waves of ELSA. Fifth, to follow the individuals that were depressed
throughout all waves to determine whether the status of each factor for most of the
individuals were same or have changed through these 12 years of depression. Sixth,
to investigate how accurate results were produced by these factors in predicting
depression using data mining techniques and then to compare it with the accuracy
rates produced by the statistical technique used in this study to identify predictive
ability of these factors. Seventh, to compare the results obtained from this study with
previously published literature. And finally, to identify strengths and limitations of
the present study and to offer recommendations for future research in identifying
predictors of depression.
1.6. Structure of the Dissertation Chapters
This dissertation is structured into six chapters. Chapter One aims to place the
context and significance of the research topic. Chapter two examines different earlier
contributions in this area of research and presents the key points obtained from the
literature for the factors related to depression considered in this study. Chapter Three
offers a description about the data and variables used in the analysis and provides
detailed description of different methods used in this study. Chapter Four presents
various results obtained from the longitudinal analysis of ELSA data. Chapter Five
discusses the key findings obtained from analysing the ELSA data and relate them
with available published research. Finally, Chapter Six offers the conclusion drawn
from this research and identifies the strengths and limitations of the present study to
offer recommendations for future research in this study topic.

12 | P a g e
Chapter Two: Literature Review
There is a large volume of published studies describing the factors related to
depression in older adults. In this section, the key points are highlighted from the
most relevant published literature that relates depression with various risk factors
included in this study.
The literature added in this study has been synthesized from the searches made on
Medline, PubMed, Web of Science and Google Scholar. However, a lot of relevant
literature was also obtained from the “Starplus”: The University’s digital library,
which further provided links to several other resources. The key terms used were
“depression”, “predictors of depression”, “elderly”, “depression in older adults” to
identify the factors which were most widely discussed with depression in previous
published studies. After that, different combinations of search terms were used to
synthesize the most relevant literature for specific ten factors that were identified.
For example, “gender AND depression”; “gender differences in depression”; “gender
AND (old* OR elderly OR aged) AND depression”. Similarly, different
combinations were used for each of the factor.
A number of other factors related to depression were also identified after a review of
great deal of previous research that has focussed on depression and its associated
factors. However, given the aims of the study where depression was to be compared
with each of the factor in statistical as well further analysis, considering more than
ten factors was out of scope for this study. The main other factors identified were:
“having diabetes” (Jacobson, 1993; Williams, 2006); “early retirement” (Karpansalo,
2005; Schofield et al., 2011); “less social participation” (Holtfreter, Reisig, &
Turanovic, 2015; Bourassa, Memel, Woolverton, & Sbarra, 2015), “Lower life
satisfaction” (Lee, 2014; Farakhan, Lubin, & O’connor, 1984); and “no friends”
(Potts, 1997; Seeman, 2000).
2.1. Considered Risk factors
a) Gender
Women are found to be more depressed than men and major cases of depression are
higher in women (Weissman & Klerman, 1985). The number of cases reported for

13 | P a g e
depression in females is almost double than males (Culbertson, 1997). A great deal
of previous research has focused on female gender as a key risk factor linked to
depression in old age (Blazer, Burchett, Service, & George, 1999; Kessler, 2003). A
number of authors have reported that severe cases of depression in women over 65
years of age were higher compared to men of the same age group (Katsumata et al.,
2005; Regan, Kearney, Savva, Cronin, & Kenny, 2013; Maguen, Luxton, Skopp, &
Madden, 2012). A good example of this is the cross country analysis performed by
Velde, Bracken, and Levecque (2010. However, Faravelli, Scarpato, Castellini, and
Sauro (2013) claimed that it was only prior to menopause when women were more
depressed than men. Conversely, Cairney and Wade (2002) argued that prevalence of
depression in females even after the menopause is high compared to males. In their
detailed study of association of depression with gender, Ochoa et al. (1992), reported
that female gender was a significant risk factor only when depression and anxiety
were considered together, and was not a significant factor for depression alone. This
view is supported by Joiner and Blalock (1995) who argued that prevalence of
clinically significant depression is almost same in males and females but symptoms
related to depression and anxiety were found to be more in females. There are, in
contrast, few studies that have reported that gender is not a significant risk factor for
depression; it is just that women with depression suffer more with feelings related to
worthlessness (Dessoki, Moussa, & Nasr, 2011).
b) Age
Numerous studies have attempted to explain how depression is associated with age.
Research performed by Stordal, Mykletun and Dahl (2003) reported that even after
controlling different variables in their study, increase in age was significantly
associated with increased depression. However, an opposite view was provided by
Jorm (2000) where he claims that with ageing the risk of depression decreases as the
person develops more control over his/her emotions in addition to decrease in
emotional response accompanied with normal ageing. This view is supported by
Henderson, Jorm, Korten, Jacomb, and Christensen (1998) in their study where they
concluded that with age depression decreased for each older adult for both males and
females. However, there is an inconsistency in the published results related to age
and depression, for instance, study by Zarit, Gatz and Johansson (1999) claimed that

14 | P a g e
in older adults the tendency to experience depressive symptoms are more common
than actually having clinically diagnosed depression. This inconsistency in the results
is further evident from a study performed by Kim, Shin, Yoon and Stewart (2002),
where they compared the associated factors of depression in rural and urban areas of
Korea, and concluded that age was a significantly associated with depression for
older adults living in urban areas but was not significant for older adults that were
depressed in rural areas. Another good example for this is a research presented by
Danesh and Landeen (2007) on lifetime and one-year depression for all age groups,
where the authors found that both lifetime and one-year depression had the highest
rates for age group (20-24) and (75+) but the lowest rates of depression were found
in the age group (75+) when both types of depression were together taken into
account, although, the highest rates were still for the age group (20-24).
c) Marital Status
The protective effects of marriage play a significant role in preventing depression
irrespective of the gender (Kim & Mckenry, 2002) which is evident from the
literature that has emphasized on the “married” marital status to be inversely
associated with depression (Koenig, 1988; Comstock & Helsing, 1977). However,
existing research also identifies the effects of the same marital status to be different
for both males and females (Harlow, 1991). One the one hand, it is published that
married as the marital status was associated with less depression for both men and
women equally (Stack & Eshleman, 1998). On the other hand, few studies have
reported that married women were less depressed than married men (Glenn, 1975).
And in old age, marital status as “divorced” was most associated with depression for
men, whereas for women it was “widowed” marital status that was most associated
with depression (Kamiya, Doyle, Henretta, & Timonen, 2013). Conversely, Etaugh
and Malstrom (1981) concluded that “widowed” marital status was less associated
with depression compared to “divorced” marital status for women. The effect of
marital disruption was also studied by Bruce and Kim (2002) where they reported
that men were at higher risk of depression than women after a divorce. In addition, it
has also been published that positive interaction and a good quality relationship
being shared in a marriage is equally important (Santini, Koyanagi, Tyrovolas, &
Haro, 2015). In this regard, a study performed by Kronmuller et al. (2011) concluded
15 | P a g e
that marital quality and depression were significantly associated with each other
(Kronmüller et al., 2011). However, Kim and Mckenry (2002) suggested that among
marital quality and marital status, marital status is more significantly associated with
depression.
d) Children
Sociologists have always stressed about the support which older parents can receive
from their children and how having them in the social network may prevent mental
health problem such as depression (Evenson et al., 2005). In this regard, study
performed by Chou and Chi (2004) demonstrated that childlessness was significantly
associated with depression (Chou & Chi, 2004). This theory has been verified by
several other studies, for instance, Sener (2011) demonstrated that depression and
children were associated negatively with each other such that older adults having
children were found to be less depressed and vice versa. Similarly, a study by Guo
(2014) also provides evidence that having more than one child was associated with
lower depression among elderly. In the same vein, Oxman, Berkman, Kasl, Freeman,
and Barrett (1992) from their study suggested that depression was even associated
with the number of children that visited their older parents. Moreover, the attitude
towards childlessness is also associated with depression, COX (2002) illustrates this
point very clearly that negative attitude had more impact on depression for females
than for males. Differences in the gender towards childlessness and its association
with depression was further demonstrated by Connidis and McMullin (1993) where
they showed that females not having children due to circumstances were more
depressed compared to females that have children whereas for males, it was just that
they were less happy compared to males that have children and were not found to be
depressed. Another different viewpoint was offered by Sener (2011) where he
reported that emotional support that older adults receive from their children is
associated with less depression only till the point where exchange of emotional
support is same from both sides of the relationship that is shared among children and
parents.

16 | P a g e
e) Insomnia
A large and growing body of literature has investigated how insomnia and tendency
to be depressed are related to each other (All et al., 2000; Orhan et al,.2012). A very
complex relation exists between depression and insomnia (Gambhir, Chakrabarti,
Sharma, & Saran, 2014). On the one hand, it has been published that insomnia is a
significant risk factor for development of depression and, therefore, treatment of
insomnia at early stages reduces the risk of development of depression (Roberts,
Shema, Kaplan, & Strawbridge, 2000). On the other hand, it has also been reported
that insomnia is a secondary symptom associated with depression, thus, treatment of
insomnia doesn’t have impact on the risk of the development of depression (Ford,
1989). A number of authors have found a significant association between insomnia
and depression (Taylor, Lichstein, Durrence, Reidel, & Bush, 2005; Morin &
Gramling, 1989). A Recent study by Chang et al. (2014) provided evidence that even
“perceived sleep quality” is also associated with depression in elderly, as older adults
with poor perceived sleep quality had higher levels of depression and perceived sleep
quality was an independent predictor of depression in elderly. A study by Pallesen et
al. (2002) compared different measures of physical and mental health among older
adults based on sleep quality and they found that older adults with sleep problems
had much higher number psychological problems and depressive symptoms
compared to those who had normal sleep. In contrary, the study performed by
Neckelmann, Mykletunand & Dahl (2007) reported results from two different health
surveys which demonstrated insomnia to be significantly associated with depression
in only one of the health survey, not in both of them.
f) Self-rated health
Based on self-rated health clinicians have been able to make prognosis of depression,
and in identifying patients who are at the maximum risk of facing long-term
depression (Livingston et al., 1990). Poor self-rated health has been identified as a
key risk factor for depression by different authors (Dendukuri & Cole, 2001; Jae &
Sook, 2006). Moreover, from the results of the study performed by Murrell,
Himmelfarb and Wright (1983), self-rated health variable had the strongest
association with depression in comparison to any other variable used in their study.
Other than self-rated health as a predictor of depression, few studies have even
17 | P a g e
published about depression as a predictor of poor self-rated health by older adults, a
good example of this is the study carried out by Wagner and Short (2014), where
they showed depression as an independent key risk factor for poor self-perceived
health. Additionally, it has been noted that with treatment of depression, the self-
rated health of many patients also improve simultaneously even in the absence of any
physical health improvement (Han, 2002b). Very interesting results were reported by
Ambresin, Chondros, Dowrick, Herrman, and Gunn (2014) that even in the presence
of the current depression variable in multivariate analysis along with demographic
factors, poor self-rated health remained as an independent predictor for future major
depression, and elderly people who indicated fair or poor self-rated health had almost
double risk of major depressive syndrome up to next five years (Badawi et al., 2013).
Current literature has also identified a bi-directional relationship between self-rated
health and depression, such that depression at baseline wave was an independent
predictor of poor self-rated health at follow up waves and poor self-rated health at
baseline was a predictor of depression in follow up waves (Han, 2002).
g) Long standing health problem (Long standing illness/disability/infirmity)
More than one third of disabilities arise from mental health disorders (Druss et al.,
2008). In this regard, research performed by Kivela and Pahkala (2001) to
understand effect of depression on disability, they concluded that depression at wave
1 was not associated with disability in the follow-up waves, however, a new episode
of depression at follow-up wave for someone who was not depressed at wave1 was
associated with disability. The course of depression is found to be more long-term
when it co-exists with a long standing illness (van den Brink et al., 2002). However,
it has also been published that long standing illness causes depression among people
from all age groups (Aneshensel, Frerichs, & Huba, 1984). Existing research
recognizes the prevalence of depression more among people with long standing
illness or which in medical terms is known as chronic illness (Benton, Staab, &
Evans, 2007; Nikolic, 2015). This is evident from the study by Haseen & Prasartkul
(2011) where they reported that people with infirmity and disability had the highest
risk of depression. Individuals with long standing health problems have significantly
greater risk of depression but a complication arises from the fact that in presence of
these physical health problems, depression often remains undetected, and when
18 | P a g e
detected the care and support required from both physical as well as mental health
care is often not coordinated (Hawkes, 2012). Rifel, ävab, Pavlič,, King, and
Nazareth (2010) concluded that over period of 6 months patients suffering from long
standing illness had four times higher risk of depression compared to other
patients. Similarly, a longitudinal study of major depression by Patten (2001) reports
that long standing illness was significantly associated with major depression and risk
of major depression is almost double in the patients with long standing illness.
h) Loneliness
Depression and various other mental health problems can arise from experiencing
loneliness (Adams, Sanders, & Auth, 2004). For instance, a recent study by Bekhet
Zauszniewski (2012) compared the results of overall health of the patients that felt
lonely and not lonely, in which it was found that not much differences existed in the
physical health but significant differences existed in terms of mental health of lonely
and not lonely patients. There is a large volume of published studies describing the
relation between depression and loneliness perceived among older adults (Alpass &
Neville, 2016; Green et al., 1992; Jongenelis, Pot, Eisses, & Beekman, 2004).
Depressive symptoms are more prominent in older adults who are lonely and they
suffer more than adults who are depressed but not lonely (Liu, Gou & Zuo, 2016).
This is further supported by Jaremka et al. (2013) who claimed that lonelier patients
were more depressed. In the presence of loneliness, prognosis for depression
becomes much more difficult (Holvast et al., 2015). Further, depression has also
been noted to be an independent contributor for both emotional as well as social
loneliness (Drageset, Espehaug, & Kirkevold, 2012). Also, Stek et al. (2015) claimed
that chances of depression to be fatal were comparatively more among the elderly
who felt lonely. One the one hand, a longitudinal study by Houtjes et al (2014)
demonstrates that people who had minor level of depression or experienced recent
symptoms of depression eventually became lonely over time. On the other hand,
comparison of two longitudinal studies by Povoski et al. (2013) reports that lonely
people eventually became depressed over time. Similar findings were replicated by
Aylaz et al. (2012) who confirmed loneliness to be an independent key risk factor for
depression. Likewise, the study by Aylaz, Aktürk, Erci, Öztürk, and Aslan (2012)
confirmed that elderly people who felt lonely were eventually more depressed.

19 | P a g e
i) Financial Strain
A great deal of previous research has investigated how financial hardship is
associated with mental health problems and psychological disorders that arise due to
constant stress, hopelessness, and feeling of uncertainty caused by shortage of money
(Pudrovska, 2005; (Mirowsky & Ross, 1999). Old people having financial strain are
found to be more depressed (Lue, Chen, & Wu, 2010). This view is supported by
Chou and Chi (2005) who reported that financial strain was significantly associated
with depression for all older age groups. In an analysis of stressful life events
experienced by elderly, Fiske, Gatz, and Pedersen (2003) found that financial stress
was among the most validated one. Similarly, in a longitudinal study, Lue, Chen and
Wu (2010) found that perceived financial stress was a key risk factor for depression.
In the same vein, a recent study by Hsieh (2015) reported that high economic status
was consistently associated with lower level of depression among older adults. Based
on gender, different studies have published different results, for instance, a
longitudinal study performed by Mandes De Leon, Rapp and Kasl (1994) reported
that financial strain was significantly associated with depression for men only and
found that men with financial strain became depressed over 3 years. However, in
another study by Lue, Chen, and Wu (2010), females were found to be more
depressed who had higher financial strain
j) Alcohol Consumption
Risk of appearance of depressive symptoms is five times higher in older adults who
indulge in heavy amount of alcohol consumption (Saunders et al., 1991). Moreover,
problems related to drinking make older adults more susceptible to other psychiatric
problems such as depression (Johnson, 2000). A study by Bekaroglu,
Uluutku ,Tanriover and Kirpinar (1991) reported that for older adults in Turkey, high
alcohol consumption was significantly associated with higher levels of depression.
Similarly, Graham and Schmidt (1997) reported that alcohol consumption was a
significant risk factor for depression. However, Graham and Schmidt revealed that
only higher volume of alcohol consumption was associated with depression whereas
frequency of alcohol consumption was not associated with depression in older adults.
In contrast to Graham and Schmidt, the authors Bulloch, Lavorato, Williams, and
Patten (2012) argued that any drinking more than moderate level drinking as per

20 | P a g e
standard guidelines were not associated with higher depression, whereas, higher
levels of depression were found among people who were dependent on alcohol
within moderate levels. Conversely, Lang1, Wallace, Huppert, and Melzer (2007)
published that less depression was found for older adults that drink moderate levels
of alcohol. Few researchers have confirmed a significant association between alcohol
consumption and depression to be true only for women (Aihara, Minai, Aoyama, &
Shimanouchi, 2010), however, few researchers have claimed it to be only associated
with men (Bulloch, Lavorato, Williams, & Patten, 2012). Another research carried
by Damian et al. (2012) reported that alcohol consumption and depression were
negatively associated with each other, such that people who drank more were less
depressed. However, few studies have also demonstrated that no significant
association exist between alcohol consumption and depression (Fishleder, Schonfeld,
Corvin, Tyler, & VandeWeerd, 2015)
21 | P a g e
Chapter Three: Methodology
This section provides an overview and justification of the methods adopted in this
study to serve the purpose of the study to find the predictors of depression.
3.1. Quantitative Research Approach
As aim of this study was to find relationship of different factors with depression and
predictors of depression, which involved statistical analysis of ELSA data which was
numeric in nature, therefore a quantitative approach was suitable to achieve the aims
and objectives of this study (D.Scott, 2007).
3.2. ELSA Background
In this study, data from the English Longitudinal Study of Ageing (ELSA) survey
were analysed (Broudeur, Hurrell, Stepinska, Fluffy, & Houxou, 2014). Six waves
of data are available in ELSA – data were collected from the interviews that were
held every two years. The data for the six waves were collected over eleven years -
2002, 2004, 2006, 2008, 2010, and 2012. It is a study of older adults aged 50 and
over, designed to get an insight of older population of England and is an on-going
study related to ageing (Hamer, Batty, & Kivimaki, 2012; Lang et al., 2009). To
collect objective as well as subjective data, questions were grouped into thirteen
modules and a self-completion questionnaires form. Efforts were made to ensure that
data of each wave consistently reflects all age group people in it and data were
refreshed at Wave 3, 4 and 6, therefore not all respondents were present from the first
wave of ELSA. Although, at certain waves new additional modules were added,
however the main purpose of the ELSA survey was to identify changes that occur
over time for the measured variables to better understand ageing in older people of
England (Marmot, 2003). However, it was also designed in such a way that it could
be compared with other longitudinal studies related to ageing in older adults across
the globe (Steptoe, Breeze, Banks, & Nazroo, 2013).
3.3. Considered Variables
Based upon literature discussed, variables related to each of the factor were identified
such that they were present throughout all waves of ELSA. The actual names of the
22 | P a g e
variables considered were, “INDSEX” for (Gender), “INDAGER” for (Age),
“DIMAR” for (Marital Status), “SCCHD” for (Children) “PSCEDC” for (Insomnia),
“HEHELF” for (Self-rated health), “HEILL” for (Long standing
illness/disability/infirmity), “PSCEDE” for (Loneliness), “SCQOLI” for (Financial
Strain), and “HEALA” (Wave 1) and “SCAKO” (Wave 2 to 6) for (Alcohol) and
“PSCEDA” for (Depression). The question asked and the response options
(categories) for each of the variable at the time of interview can be seen in Appendix
A
3.4. Statistical Techniques
Throughout this thesis, data analysis step was first performed for wave 1 and then for
all other waves and subset data (obtained for people who were depressed or not
depressed throughout all waves). Due to word limit consideration, detailed
description and interpretation for the results of wave 1 has been described and only
summarised comparative results were stated for all remaining waves and for subset
data. Also throughout this thesis yellow colour has been used to represent non
depressed respondents and grey colour has been used to represent depressed people
in all visualisations as it has been published in the literature that depressed people are
most attracted to grey colour and yellow is most associated with not depressed
people (Carruthers, Morris, Tarrier, & Whorwell, 2010)
a). Descriptive Statistics
Descriptive statistics is used to understand the characteristics of data in a much better
way from which many ideas and assumptions can be made by just having a glimpse
at these statistics. Descriptive statistics make use of various graphical techniques
(Kadane, 2016)
In this study, as all variables used were categorical, frequency statistics was used a
lot to summarize data about each variable. Descriptive statistics for all of the
variables was undertaken and prevalence of depression throughout all waves of
ELSA was explored. The data was split by depression variable to further explore the
prevalence of depression based on each of the factor considered in this study. For
wave 1 only, an additional analysis was performed where data were split by age and
23 | P a g e
gender to explore the influences age and gender have on depression associated with
each of the factor considered. Different forms of graphical representations such as
clustered bar charts, simple bar charts and line charts were used to describe data as
well as to visualize the results obtained.
b). Bivariate Analysis
To achieve the aims and objectives of this study it was very important to know
whether any association exists between depression and other factors considered. As
all of the variables in this study were categorical, hence chi-squared test was used to
perform bi-variate analysis.
“Chi-squared test is used to examine independence across two categorical variables
or to assess how well a sample fits the distribution of a known population” (Franke,
Ho, & Christie, 2012, p.449)
The basis of the Chi-squared test is to either accept or reject the null hypothesis. The
Null hypothesis is formulated in such a way that it states that no significant
association exists between categorical variables, and, the aim of the researcher is to
reject this null hypothesis based on the results of the test applied (Vitral, Campos, &
Fraga, 2013).
Chi-squared test was used to identify which of the ten variables had significant
association with depression. In case of each variable with which bi-variable
comparison was made, a null hypothesis was stated as: No association exists between
that variable and depression
c). Multivariate Analysis
Different techniques are available to perform multivariate analysis based upon the
type of data stored in interested variables. In this study, dependent variable
(depression) was categorical; hence logistic regression could be performed (Foster et
al., 2016). Logistic regression will help to identify predictors of depression as values
of dependent variable can be predicted from other independent variables by using
this technique. Also, as depression variable divides all the respondents into two
24 | P a g e
cases- depressed or not depressed, hence logistic regression was applied to identify
which associated variables predict depression in older adults.
Three models were used for logistic regression at each wave of ELSA. The first
model included only demographic factors (Gender, Age, Marital Status and
Children). The second model introduced health related factors (Insomnia, Self-rated
health and Long standing illness) into model 1 to look for whether these could
explain the identified associations at model1. Finally, the third model introduced
other factors (Loneliness, Financial Strain and Alcohol) into model 2 to further
establish which of the factors independently predict depression.
3.5. Data Mining Techniques
Two data mining algorithms namely Support Vector Machines and Decision Trees
were considered in this study. Although any one of the algorithm could have served
the purpose to identify how predictive the factors considered in this study were,
however, to achieve the aims and objectives of this study as precisely and clearly as
possible, two algorithms were used as both of them could produce different accuracy
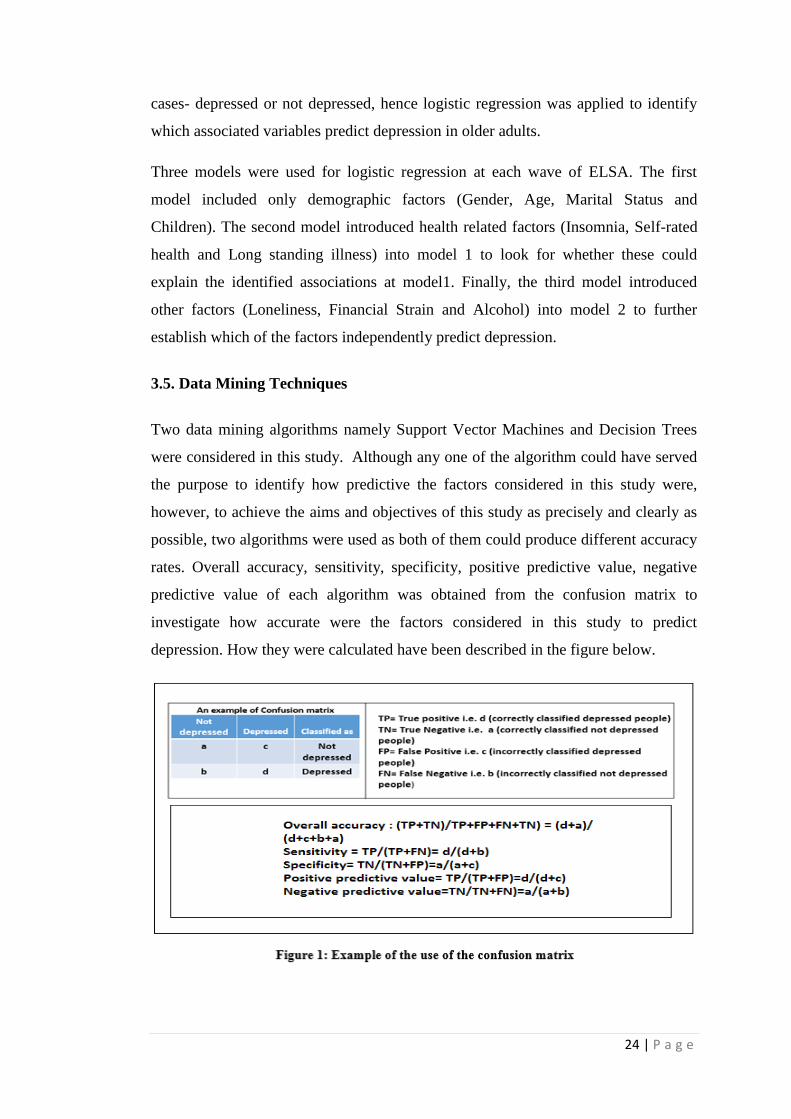
rates. Overall accuracy, sensitivity, specificity, positive predictive value, negative
predictive value of each algorithm was obtained from the confusion matrix to
investigate how accurate were the factors considered in this study to predict
depression. How they were calculated have been described in the figure below.
25 | P a g e
a). Support vector machines
This algorithm of classification constructs a hyperplane which acts as a boundary to
separate two classes. The distance between this boundary and the data points on each
side of this boundary are called support vectors, from which this algorithm got its
name as Support Vector machine (Yu, Liu, Valdez, Gwinn, & Khoury, 2010).
This study has included SVM algorithm for finding predictors of depression, because,
it is now widely used in disease detection and is a high performance classification
algorithm especially in the field of bioinformatics (Son, Kim, Kim, Choi, & Lee,
2010). In addition, its approach for prediction is very different from logistic
regression. As SVM is not based on probability of classes within the data set as it
manages to find a separation boundary between variables which is opposite to
logistic regression which constructs a regression line and tries to minimize the error
and have a more probabilistic approach (Verplancke et al., 2008)
b). Decision trees
Decision trees divide the dataset into nodes and branches (Coussement, Bossche, &
Bock, 2014). Due to their hierarchal structure, they make the data set more
interpretable and visually more understandable when compared to other data mining
algorithms. Another reason for including this classification algorithm for this study is
because much has been written about the decision trees efficiency to model partitions
of the datasets which is difficult to achieve through logistic regression and other
prediction algorithm such as SVM (Kingsford & Salzberg, 2008). Decision trees
have a further option of pruning. With help of pruning the size of decision trees is
reduced to only the most relevant section of the tree which has got the maximum
predictive value and is easy to visualise (Quinlan, 1999). In this study, both pruned
and un-pruned decision trees would be considered.
3.6. Data for depressed or not depressed throughout all waves (Subset data)
Data for respondents who were either depressed or not depressed throughout all 6
waves of ELSA were obtained and the same analysis as done for all other 6 waves
was performed on this data and predictors of depression were identified and were
compared with the results obtained for predictors of depression from all other 6
26 | P a g e
waves to check whether the predictors from general sample and for those who were
in same state of depression throughout all waves were same or different, to have a
better understanding about predictors of depression. Data for this purpose were
obtained by merging data files for all remaining waves to wave 1 based on the
variable “idauniq” which was unique individual serial number to uniquely identify
respondents throughout all waves. After this, another variable was computed that
stored value 0 or 1 for the respondents who were either depressed or not depressed
throughout. IF statement was further used to decide the value 0 or 1 for this variable
based on the condition such that if depression variable was 0 for all the waves then it
was given a value of 0 i.e. not depressed throughout and was given a value of 1 when
depression variable was 1 for all waves of ELSA. This data is further referred as
“subset data” throughout the thesis.
3.7. Tree diagram and the status of each factor
From data obtained for the respondents who were depressed or not depressed
throughout, a further analysis was conducted by splitting the data by depression
variable from the first wave and calculating the frequency of depression for second
wave and this was repeated for all other waves till all the observations were made
and based on this tree diagrams were obtained for the respondents who were
depressed or not depressed throughout all waves of ELSA and how respondents
changed their depression status throughout all waves of ELSA.
Further, data were filtered for those respondents who were depressed throughout all
waves of ELSA and status of each of the factor considered in this study was obtained
based on the mode value i.e. the category for each of the factor which had the highest
number of these identified depressed people. This was done to explore and have
better understanding about status of each variable found for those people who were
depressed throughout these 11 years and further to identify if there was any change
in the status of each factor at the beginning nd at the end of this longitudinal analysis
which would further throw light on the predictors of depression.

27 | P a g e
Chapter Four: Data analysis and results
4.1. Statistical Analysis of ELSA
Before beginning with the analysis of depression and other variables, it was
important to know how many respondents were present at each wave of ELSA.
Figure 2 (left) above shows the number of respondents that participated in each of
the wave. Wave 1 had the maximum number of respondents (12099) whereas the
wave 2 had the minimum number of respondents (9432). After this, it was important
to explore how many among these respondents at each wave answered the question
asked for measuring depression. The question asked was “much of the time during
the past week, you felt depressed”. Line chart in the figure 2 (right) above shows the
total number of respondents that answered the question. Again the number (11717)
was found to be the maximum at wave 1. From both of the charts, it can be seen that
the response rate for depression was higher for wave 1 compared to all other waves.
Therefore, in this study wave 1 was used as a base for all the analysis performed.
28 | P a g e
4.2. Prevalence of depression within the ELSA
Figure 3 (top) compares the number of older adults that were depressed and not
depressed at each of the wave. As can be seen from the figure that the highest
number of depressed people (2084) were present in the ELSA at wave 1 and the
lowest number of depressed people were present at wave 6. Similarly, the number of
not depressed people was also highest (9633) for wave 1, and lowest (7704) for wave
2. As mentioned that not all of the respondents answered the question asked for
depression. Therefore, the figure 3 (bottom) below shows the valid percentage of
depressed and not depressed people for each wave. It can be seen that the proportion
of depressed people was found to highest for wave 1 and the proportion of not
depressed people was found to be highest for wave 6.
29 | P a g e
4.3. Prevalence of depression by age and gender within the ELSA
The charts above were produced to explore the prevalence of depression among older
adults based on age and gender. It can be seen from the charts that throughout all
waves of ELSA across all age groups a higher proportion of females were depressed
than males and, the age group 80+ had a higher proportion of both depressed males
and females compared to all other age groups. The differences in the proportion of
depressed and not depressed people were most evident for wave 1.
30 | P a g e

31 | P a g e
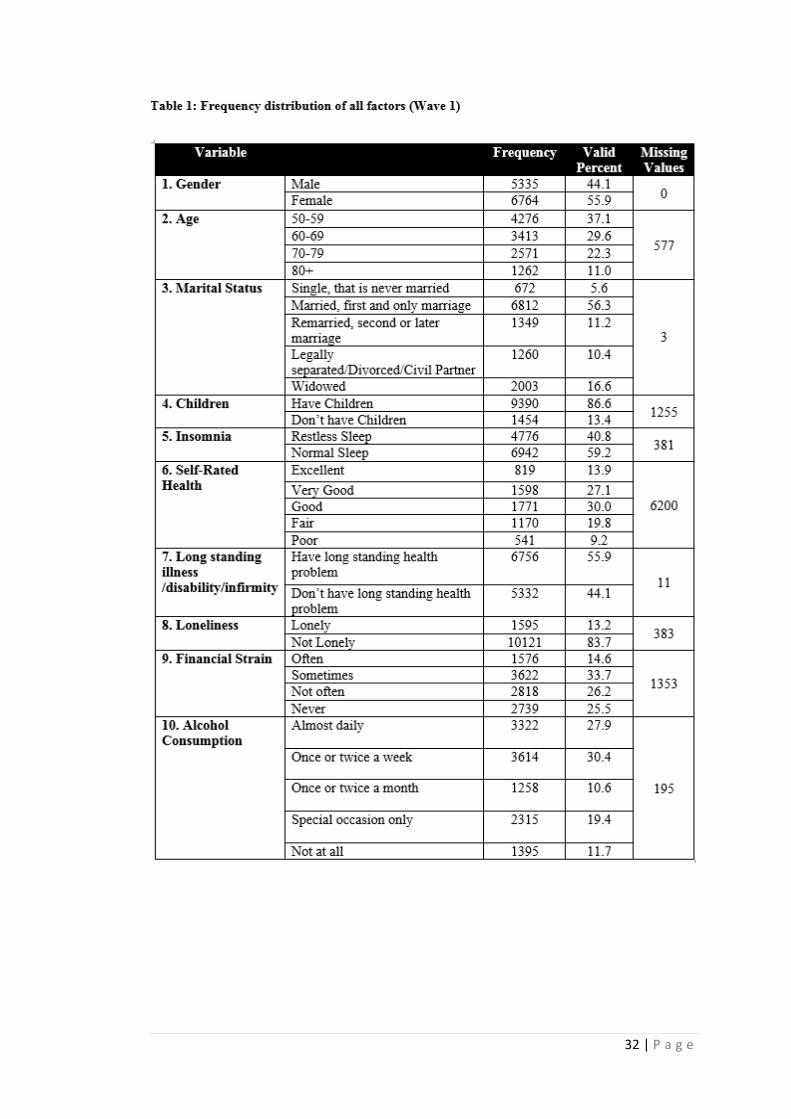
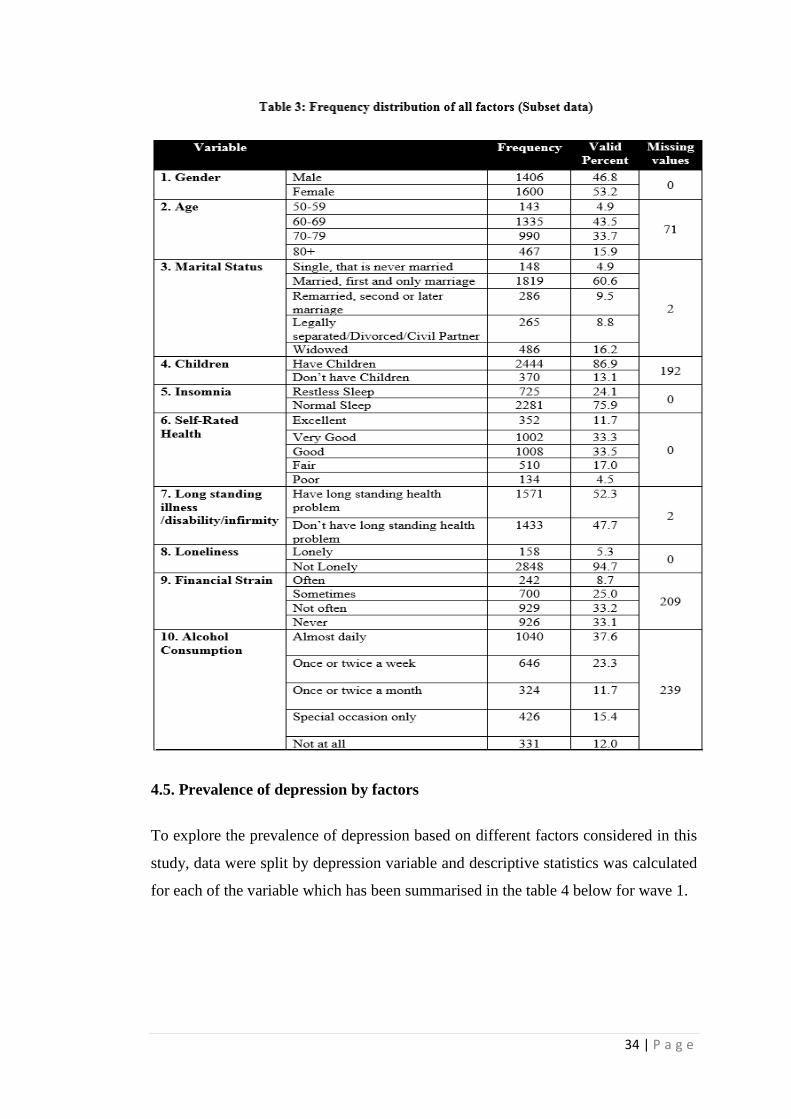
4.4. Univariate Analysis
Frequency tables were produced to explore the distribution of the ELSA data for
each of the variable considered in this study. The table 1 below shows the summary
of descriptive statistics carried out for wave 1. It can be seen that more number of
“females” (6764) were present compared to “males” (5335). A higher proportion of
respondents (37.1%) were from age group “50-59” compared to only 11 % of the
respondents from the age group “80+”. Over half of the respondents (56.3%) marital
status was “married”, whereas the category “single” accounts for only 5.6 % of the
respondents. Most of the respondents (86.6%) indicated that “they have children”.
Just over half of the respondents (59.2%) reported their sleep as “normal”. A higher
proportion of respondents (30%) reported their self-rated health as “good” compared
to only 9.2 % of the respondents who indicated their health as “poor”. 55.9 % of the
respondents indicated the presence of “long standing illness”. Just 13.2% of the
respondents felt “lonely”. The proportion of respondents (14.6%) “often” having
financial strain was lower than all other categories of financial strain, and
“sometimes” having financial strain was reported by higher proportion of the
respondents (33.7%). The proportion of the respondents (27.9%) that had alcohol on
daily basis and those (30.4%) who had once or twice a week was not much different.
And the respondents (10.6%) who had alcohol once or twice a month were even less
than the respondents (11.7%) who never had alcohol.
32 | P a g e

33 | P a g e
Similarly, univariate analysis was also calculated for each of the factor for the
remaining waves and for subset data to identify which categories had higher
proportion of respondents which has been summarised in the tables 2 and 3. Similar
pattern of data distribution (“females” (gender); “married”(marital status); “have
children”(children); “good” (self-rated health); “normal”(insomnia); “have long
standing illness”(long standing illness) ; “not lonely”(loneliness)) was found for all
of the remaining waves and subset data for each of the variable other than for the
factors financial strain and alcohol consumption where no consistent category was
identified that had more number of individuals across all waves and subset data.
Hence, the categories with a higher proportion of individuals throughout all waves
and subset data were similar to wave 1.
f m f m f m f m f m
Gender Male 4125 4295 4925 4569 4744
Female 5307 5476 6125 5705 5857
Age 50-59 2925 3434 3428 2560 2937
60-69 2920 2706 3696 3766 3847
70-79 2203 2069 2478 2533 2547
80+ 1123 1134 1147 1060 1063
Marital Status Single 496 574 675 596 670
Married 5233 5345 6077 5704 5862
Remarried 1036 1196 1433 1224 1276
Separated 997 1083 1231 1158 1242
Widowed 1669 1572 1632 1586 1548
Children Have Children 7137 7060 7954 7698 7704
Don't have Children 1034 1091 1258 1224 1259
Insomnia Restless Sleep 3885 3891 3697 3980 3428
Normal Sleep 5328 5569 6833 5668 6491
Self-Rated Health Excellent 1179 2465 1353 1180 1212
Very Good 2598 4072 3091 2902 2892
Good 2934 2331 3375 3094 3156
Fair 1877 529 1994 1792 1919
Poor 706 137 781 757 800
Long standing health Yes 5323 5291 5984 5615 5780
No 4103 4473 5057 4645 4814
Loneliness Lonely 1275 1252 1340 1253 1146
Not Lonely 7941 8207 9188 8397 8768
Financial Strain Often 955 1038 1255 1137 1284
Sometimes 2295 2356 2751 2668 2698
Not often 2187 2420 2836 2664 2592
Never 2665 2315 2336 2447 2292
Alcohol consumption Almost daily 2888 2818 3346 3137 3127
Once or twice a week 2094 2019 2259 2095 2058
Once or twice a month 983 946 1031 1032 1018
Special occasion only 1296 1255 1433 1493 1450
Not at all 883 879 1034 1105 1177
7
687
1735
1771
311
237 549
14
624
1358
0
207
3
1638
682
622
9
522
1872
1947
0
355
6
1352
626
1412
7
312
1642
1854
0
301
2
1838
520
456138
6
216
1330
1288
0
428
1
1620
Variable
0
261
1
1261
219
Each Variable Statistics - Wave 2 to 6 (Frequency - f and total missing values -m)
Wave 2 Wave 3 Wave 4 Wave 5 Wave 6
34 | P a g e
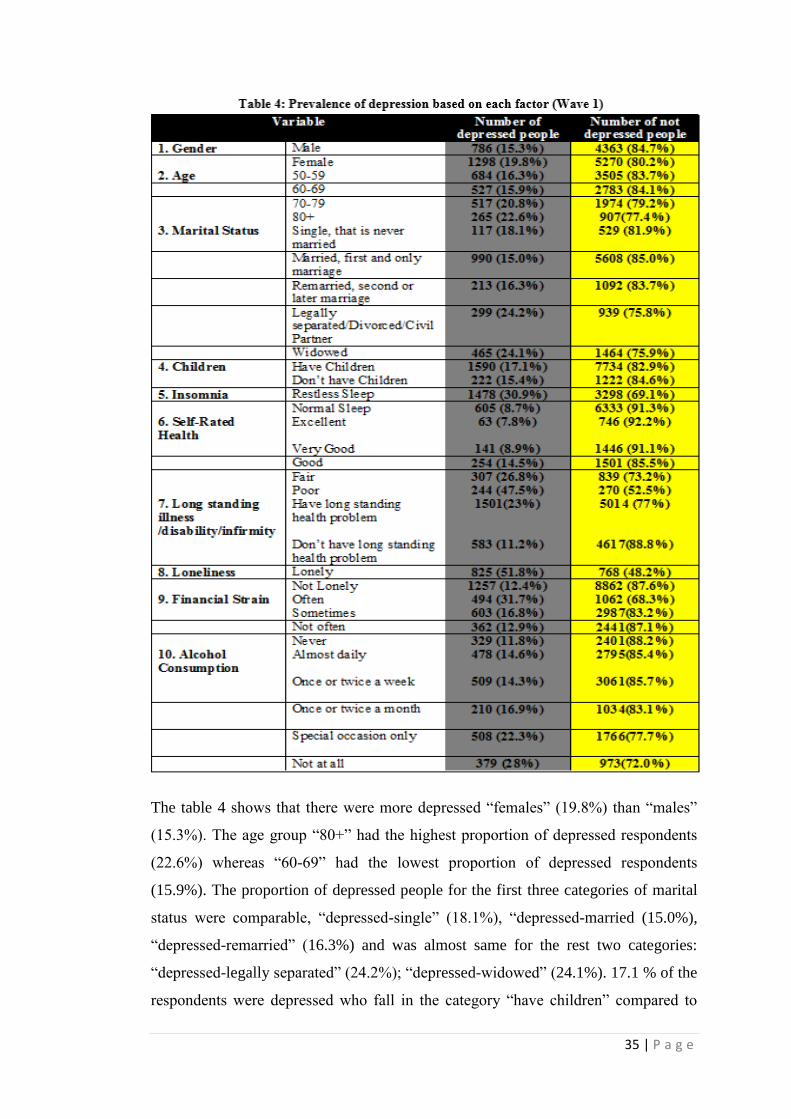
4.5. Prevalence of depression by factors
To explore the prevalence of depression based on different factors considered in this
study, data were split by depression variable and descriptive statistics was calculated
for each of the variable which has been summarised in the table 4 below for wave 1.
35 | P a g e
The table 4 shows that there were more depressed “females” (19.8%) than “males”
(15.3%). The age group “80+” had the highest proportion of depressed respondents
(22.6%) whereas “60-69” had the lowest proportion of depressed respondents
(15.9%). The proportion of depressed people for the first three categories of marital
status were comparable, “depressed-single” (18.1%), “depressed-married (15.0%),
“depressed-remarried” (16.3%) and was almost same for the rest two categories:
“depressed-legally separated” (24.2%); “depressed-widowed” (24.1%). 17.1 % of the
respondents were depressed who fall in the category “have children” compared to

36 | P a g e
15.4 % depressed respondents who don’t have children. 30.9 % of the respondents
were depressed who suffered from “restless sleep” than just 8.7 % of depressed
people with normal sleep. The highest proportion of depressed people (47.5%) was
for the respondents who indicated “poor” self-rated health after “fair” (26.8%). Only
7.8 % of the respondents were depressed who indicated ‘excellent” self-rated health.
Respondents that indicated the presence of long standing illness were more depressed
(23%) compared to depressed respondents (11.2%) without long standing illness. For
loneliness, a much higher proportion of lonely depressed respondents (51.8%) were
there compared to depressed not lonely respondents (12. 4%).The proportion of
depressed people (31.7%) was maximum for the “often” financial strain category
after “sometimes” (16.8%). The proportion of depressed people for alcohol
consumption was higher for respondents who never had alcohol (28.0%) compared
to 14.6 % of depressed respondents who had alcohol “almost daily”.
Additionally, clustered bar charts added below were also produced to better
understand depression with each of the factor and to look for any association that
may depict by looking at them before the chi-square tests were performed to actually
identify any association.

37 | P a g e

38 | P a g e
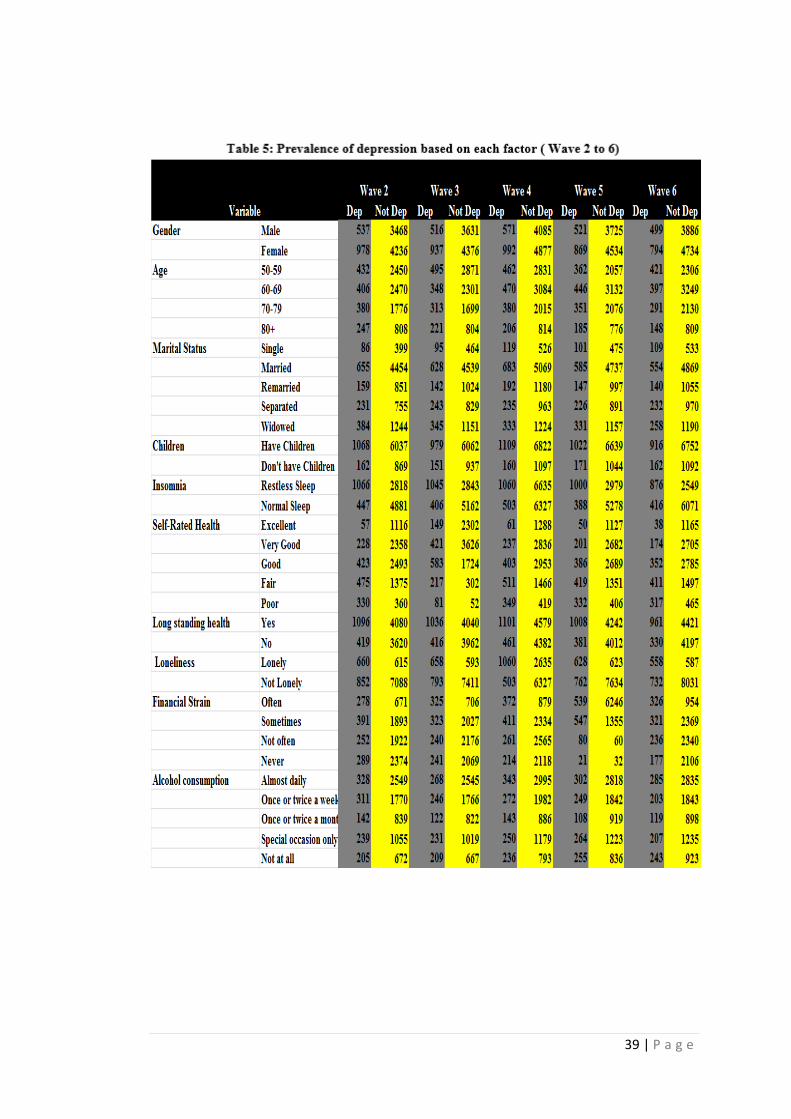
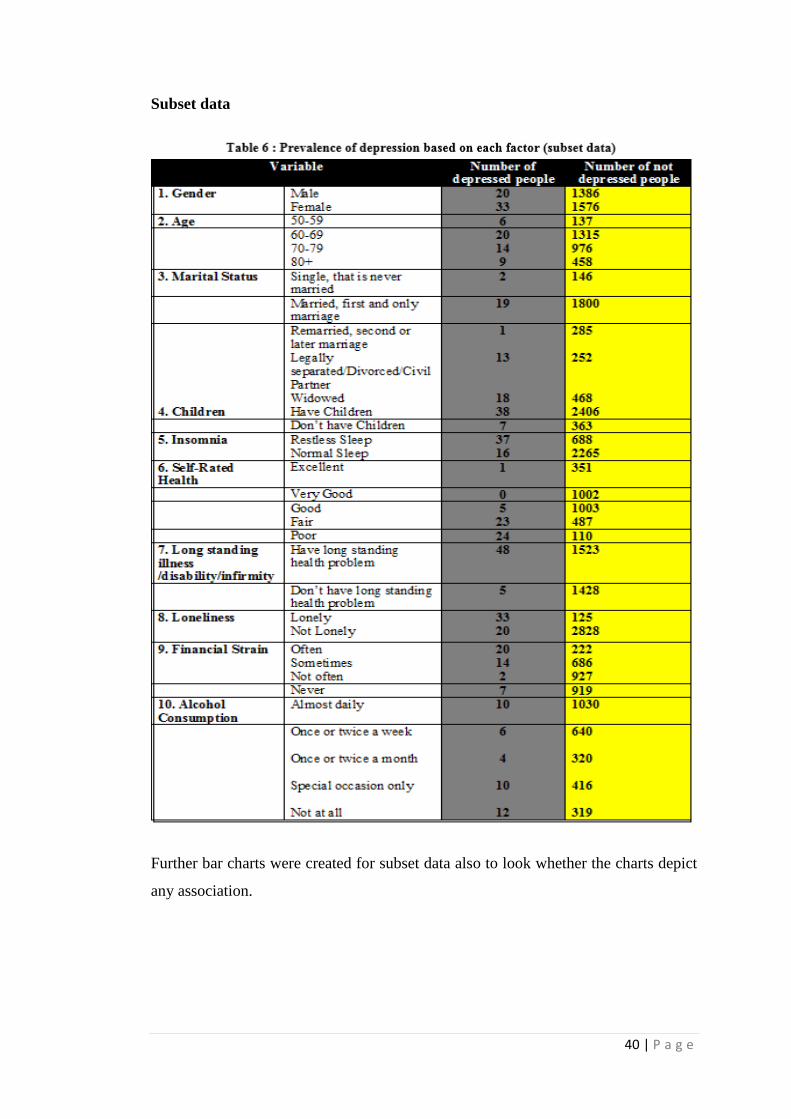
Similarly, for rest of the waves and for subset data, the prevalence of depression
based on the factors was calculated. The tables 5 and 6 below summarise the results
obtained for remaining waves and subset data. It was observed that the prevalence of
depression based on each factor for all of the remaining waves and subset data was
similar to wave 1 - the proportion of depressed people was higher for “females”
(gender), “80+” (age), “married” (marital status), “have children” (children),
“restless sleep” (insomnia), “poor” or “fair” (self-rated health), “have long standing
illness” (long standing illness), “lonely” (loneliness), “often” or “sometimes”
(financial strain), “not at all” (alcohol consumption).
39 | P a g e
40 | P a g e
Subset data
Further bar charts were created for subset data also to look whether the charts depict
any association.

41 | P a g e

42 | P a g e

43 | P a g e
The bar chart below was produced to look for how depression variable was present in
all different waves to have clear picture about number of depressed people present
throughout all waves in each factor and its category.

44 | P a g e
45 | P a g e
Additional analysis just for wave 1 was carried out further to explore the distribution
of depressed respondents present in ELSA by each factor broken down by age and
gender to look for how depression variable was distributed among each factor based
on age and gender. These charts were created to just to explore the number of
respondents present for each category in the ELSA, they don’t deal with prevalence
or the proportion of depressed people as prevalence of depression has already been
discussed.
4.6. Distribution of depression variable by factors broken down by age and
gender
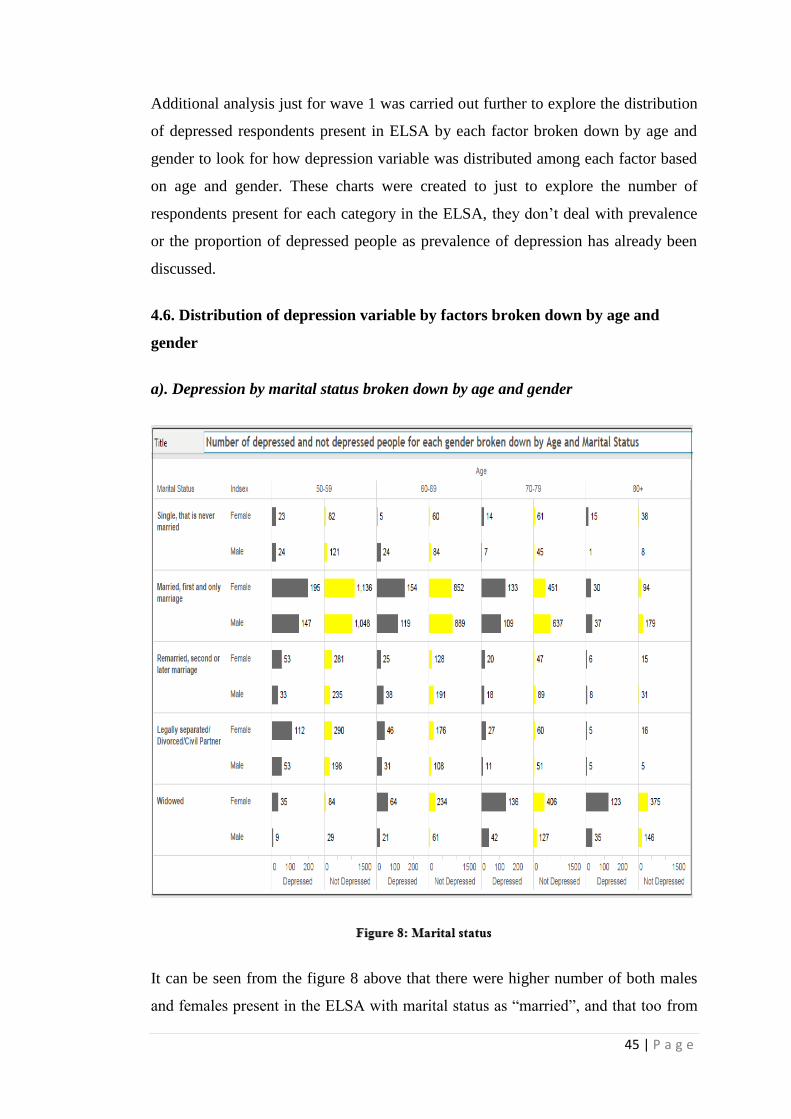
a). Depression by marital status broken down by age and gender
It can be seen from the figure 8 above that there were higher number of both males
and females present in the ELSA with marital status as “married”, and that too from

46 | P a g e
the same age group “50-59”, less number of depressed people with age group 80+
were present (although the total number of respondents present in the 80+ group
were also lower, that is the reason it has been mentioned above that these charts
doesn’t deal with proportion or prevalence of depression, on the other hand these
were created to have an understanding that how many depressed people were
available for each category based on age and gender in ELSA). Depressed females
were more than depressed males for each age group category other than 80+. It can
also be seen that for legally separated respondents, number of not depressed females
were also higher than males for each age group category.
b). Depression by children broken down by age and gender
It is apparent from the figure 9 that for both gender and for each age group depressed
respondents with children were higher in ELSA population. Only for age group “50-
59” and “60-69” the number of depressed males that “don’t have children” were
47 | P a g e
higher than females. For all other categories more depressed females were present in
the ELSA.
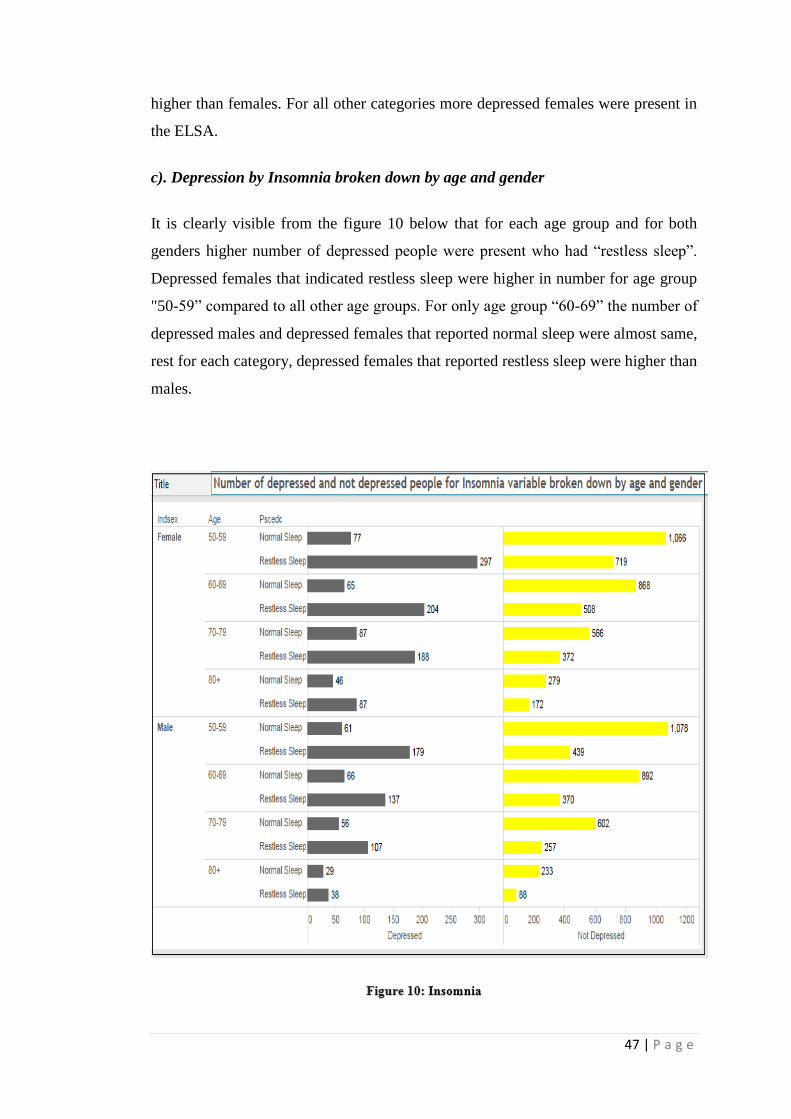
c). Depression by Insomnia broken down by age and gender
It is clearly visible from the figure 10 below that for each age group and for both
genders higher number of depressed people were present who had “restless sleep”.
Depressed females that indicated restless sleep were higher in number for age group
"50-59” compared to all other age groups. For only age group “60-69” the number of
depressed males and depressed females that reported normal sleep were almost same,
rest for each category, depressed females that reported restless sleep were higher than
males.
48 | P a g e
It is clearly visible from the figure that for each age group and for both genders
higher number of depressed people were present who had “restless sleep”. Depressed
females that indicated restless sleep were higher in number for age group "50-59”
compared to all other age groups. For only age group “60-69” the number of
depressed males and depressed females that reported normal sleep were almost same,
rest for each category, depressed females that reported restless sleep were higher than
males.
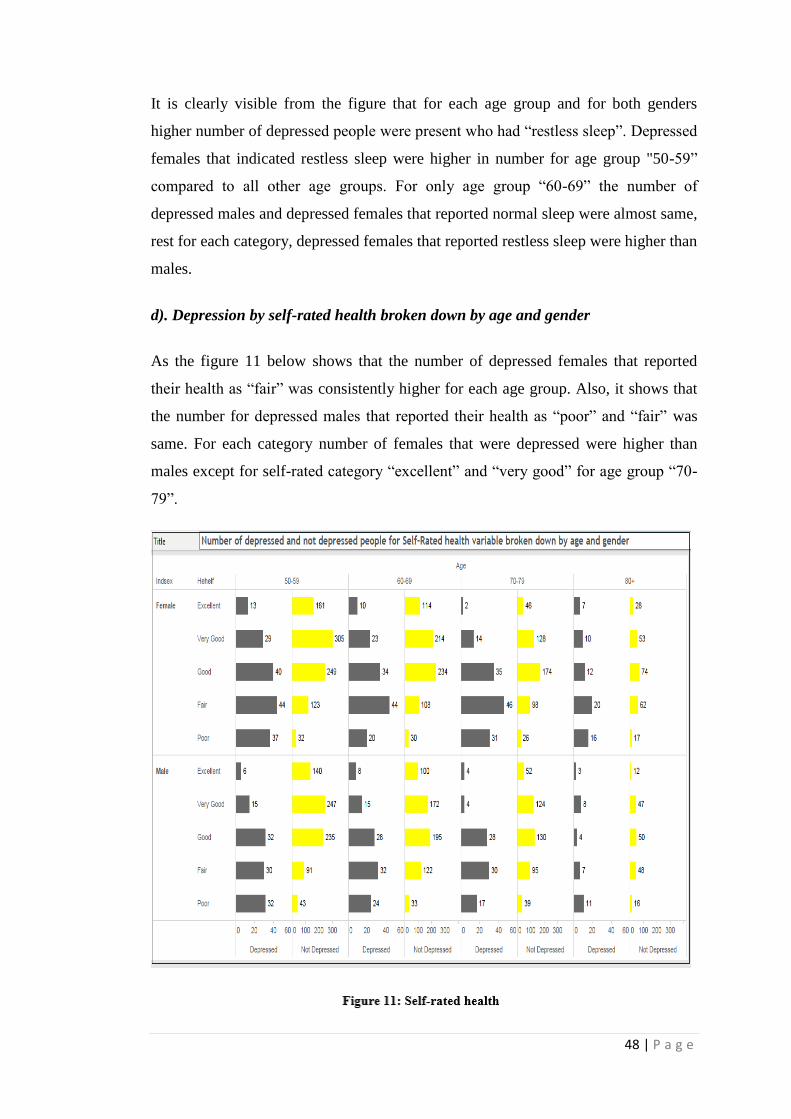
d). Depression by self-rated health broken down by age and gender
As the figure 11 below shows that the number of depressed females that reported
their health as “fair” was consistently higher for each age group. Also, it shows that
the number for depressed males that reported their health as “poor” and “fair” was
same. For each category number of females that were depressed were higher than
males except for self-rated category “excellent” and “very good” for age group “70-
79”.
49 | P a g e
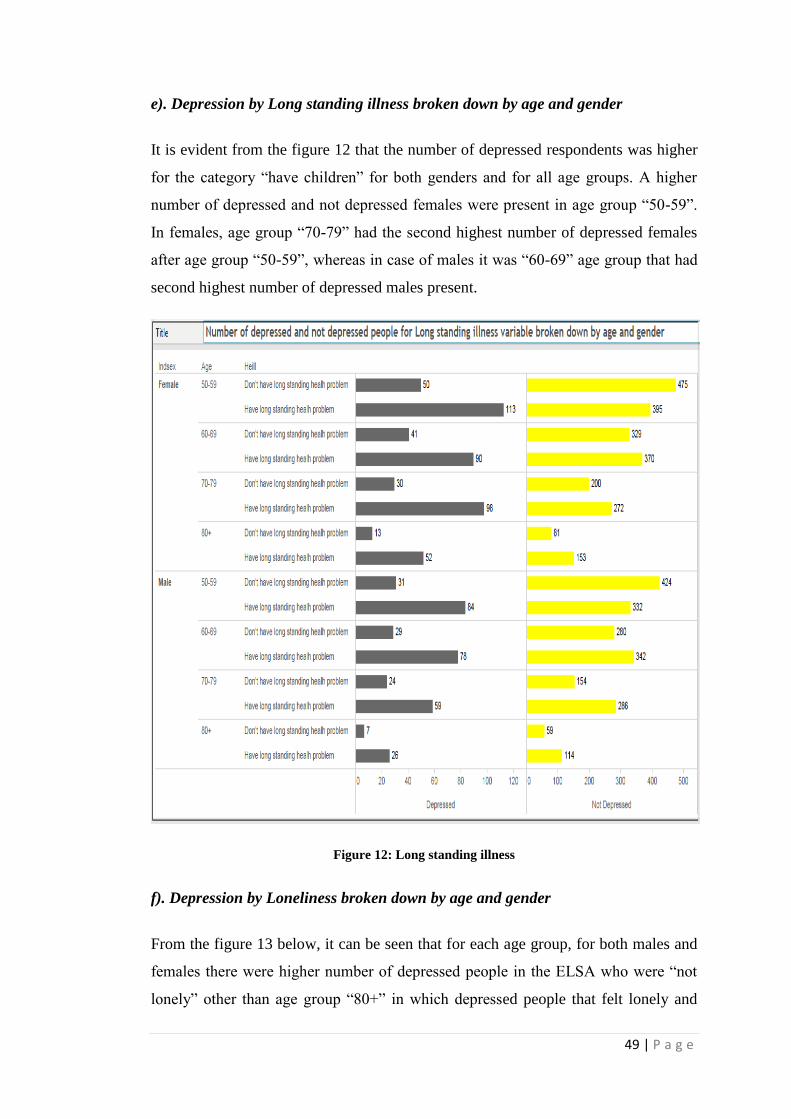
e). Depression by Long standing illness broken down by age and gender
It is evident from the figure 12 that the number of depressed respondents was higher
for the category “have children” for both genders and for all age groups. A higher
number of depressed and not depressed females were present in age group “50-59”.
In females, age group “70-79” had the second highest number of depressed females
after age group “50-59”, whereas in case of males it was “60-69” age group that had
second highest number of depressed males present.
Figure 12: Long standing illness
f). Depression by Loneliness broken down by age and gender
From the figure 13 below, it can be seen that for each age group, for both males and
females there were higher number of depressed people in the ELSA who were “not
lonely” other than age group “80+” in which depressed people that felt lonely and

50 | P a g e
not lonely were comparable. The highest number of depressed females that were “not
lonely” was from age group “50-59” whereas for males it was “60-69”. Depressed
females that felt lonely were higher in age group “70-79” than all other age groups
whereas depressed males that felt lonely were higher in age group “50-59”.
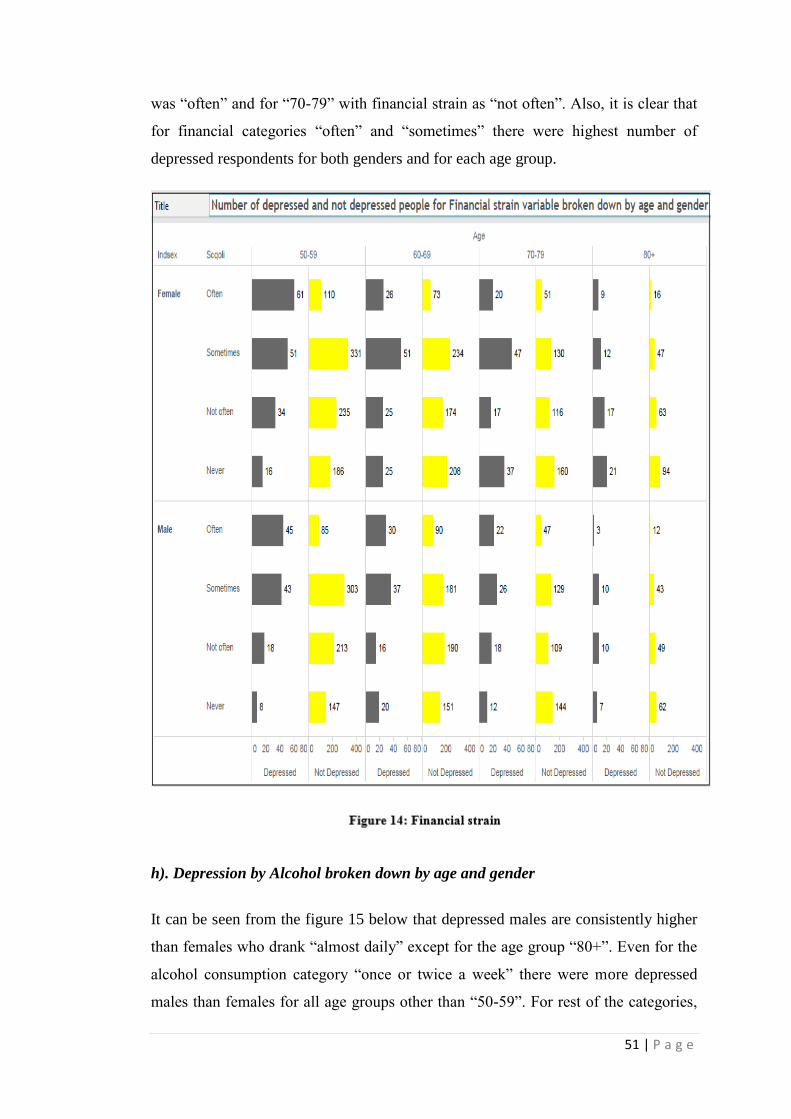
g). Depression by Financial strain broken down by age and gender
As can be seen from the figure 14 below that the number of depressed respondents
with financial strain as “often” was higher in number for both males and females. For
each financial strain category and age groups, the number of depressed females was
higher than males, except for age group “60-69”and “70-79” where financial strain
51 | P a g e
was “often” and for “70-79” with financial strain as “not often”. Also, it is clear that
for financial categories “often” and “sometimes” there were highest number of
depressed respondents for both genders and for each age group.
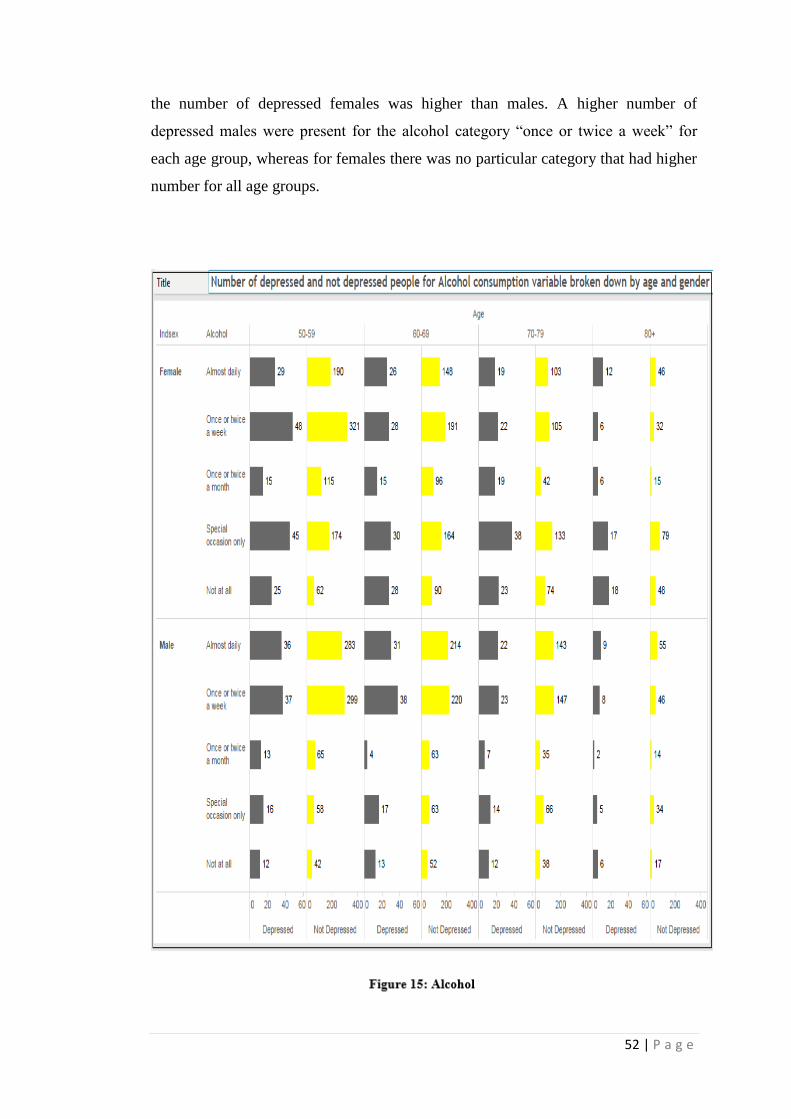
h). Depression by Alcohol broken down by age and gender
It can be seen from the figure 15 below that depressed males are consistently higher
than females who drank “almost daily” except for the age group “80+”. Even for the
alcohol consumption category “once or twice a week” there were more depressed
males than females for all age groups other than “50-59”. For rest of the categories,
52 | P a g e
the number of depressed females was higher than males. A higher number of
depressed males were present for the alcohol category “once or twice a week” for
each age group, whereas for females there was no particular category that had higher
number for all age groups.

53 | P a g e
4.4. Chi- squared test: To further identify whether any association exists between
these factors and depression, the chi-squared test was performed between each of the
factor and depression, results of which have been summarised in the table 7 below.
Variable
χ2
df
p
1. Gender 39.617 1 0.000
2. Age 36.903 1 0.000
3. Marital Status 123.856 4 0.000
4. Children 2.518 1 0.121
5. Insomnia 954.304 1 0.000
6. Self-Rated Health 475.957 4 0.000
7. Long standing
illness/disability/infirmity
275.812 1 0.000
8. Loneliness 1456.592 1 0.000
9. Financial Strain 239.152 1 0.000
10. Alcohol Consumption 158.282 1 0.000
54 | P a g e
From the results summarised in the table 7 above it can be seen that there was a
significant association between gender and depression, of the 5149 males, 786
reported having depression (15.3%) compared with 1298 depressed women out of
the 6568 (19.8%) in the study (χ2= 39.617; df=1; p<0.001). A significant association
was also found between age and depression, the depression rate was 16.3% for age
group “50-59”, compared to 15.9% for age group “60-69”, 20.8 % for age group “70-
79” and 22.6 % for age group “80+” in this study (χ2= 36.903; df=1; p= p<0.001).
Similarly, a significant association existed between marital status and depression, the
depression rate was 18.1 % for “single” compared to 15.0 % for “married”, 16.3%
for “remarried”, 24.2 % for “separated” and 24.1 % for “widowed” in the study
(χ2=123.856; df= 4 p<0.001). No significant association was found between children
and depression, of the 9324 adults who had children, 1590 were depressed (17.1%)
compared with 222 out of 1444 adults who don’t have children (15.4%) in the study
(χ2=2.518; df=1; p=0.121). Another significant association was found between
insomnia and depression, of the 4776 respondents who reported restless sleep, 1478
were depressed (30.9%) compared with 605 out of 6938 respondents who reported
normal sleep (8.7%) in this study (χ2=954.304; df= 1; p<0.001).Likewise, a
significant association existed between self-rated health and depression, depression
rate was 7.8 % for the category “excellent”, 8.9 % for “very good”, 14.5 % for
“good”, 26.8 % for “fair”, and 47.5 % for “poor” in the present study (χ2=475.957;
df= 1; p<0.001). Long standing illness also had a significant association with
depression, of the 6515 respondents who indicated that they have long standing
illness, 1501 were depressed (23%) compared with 583 depressed respondents out of
the 5200 who reported they don’t have long standing illness (11.2%) in this study
(χ2=954.304; df= 1; p<0.001). Similarly, loneliness was also found to be
significantly associated with depression, of the 1593 lonely people, 825 were
depressed (51.8%) compared with 1257 depressed respondents out of 10119
respondents who were not lonely (12.4%) in this study (χ2=1456.592; df= 1;
p<0.001). Another significant association was found between financial strain and
depression, depression rate was found to be 31.7% for the category “often”, 16.8 %
for “sometimes”, 12.9 % for “not often”, 11.8 % for “never” in the present study
(χ2=239.152; df= 1; p<0.001). And, a significant association was also found between
alcohol consumption and depression, depression rate was found to be 14.6% for the
category “almost daily”, 14.3% for “once or twice a week”, 22.3 % for “special
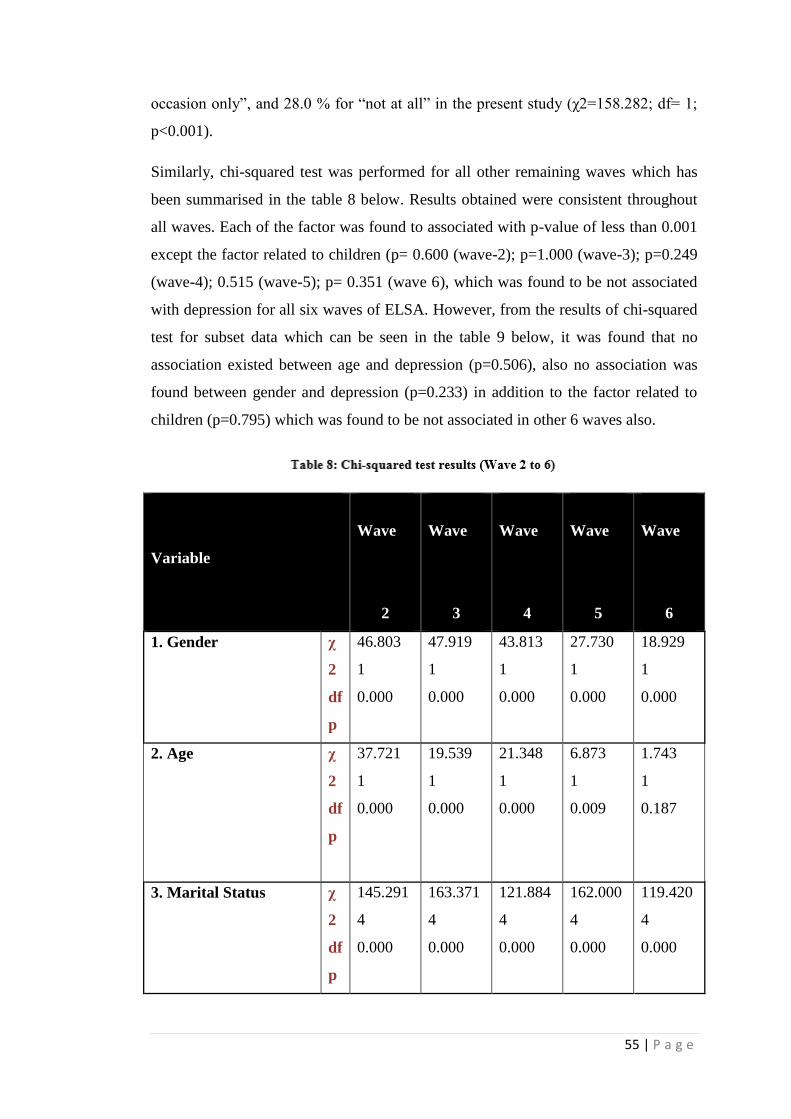
55 | P a g e
occasion only”, and 28.0 % for “not at all” in the present study (χ2=158.282; df= 1;
p<0.001).
Similarly, chi-squared test was performed for all other remaining waves which has
been summarised in the table 8 below. Results obtained were consistent throughout
all waves. Each of the factor was found to associated with p-value of less than 0.001
except the factor related to children (p= 0.600 (wave-2); p=1.000 (wave-3); p=0.249
(wave-4); 0.515 (wave-5); p= 0.351 (wave 6), which was found to be not associated
with depression for all six waves of ELSA. However, from the results of chi-squared
test for subset data which can be seen in the table 9 below, it was found that no
association existed between age and depression (p=0.506), also no association was
found between gender and depression (p=0.233) in addition to the factor related to
children (p=0.795) which was found to be not associated in other 6 waves also.
Variable
Wave
2
Wave
3
Wave
4
Wave
5
Wave
6
1. Gender χ
2
df
p
46.803
1
0.000
47.919
1
0.000
43.813
1
0.000
27.730
1
0.000
18.929
1
0.000
2. Age χ
2
df
p
37.721
1
0.000
19.539
1
0.000
21.348
1
0.000
6.873
1
0.009
1.743
1
0.187
3. Marital Status χ
2
df
p
145.291
4
0.000
163.371
4
0.000
121.884
4
0.000
162.000
4
0.000
119.420
4
0.000
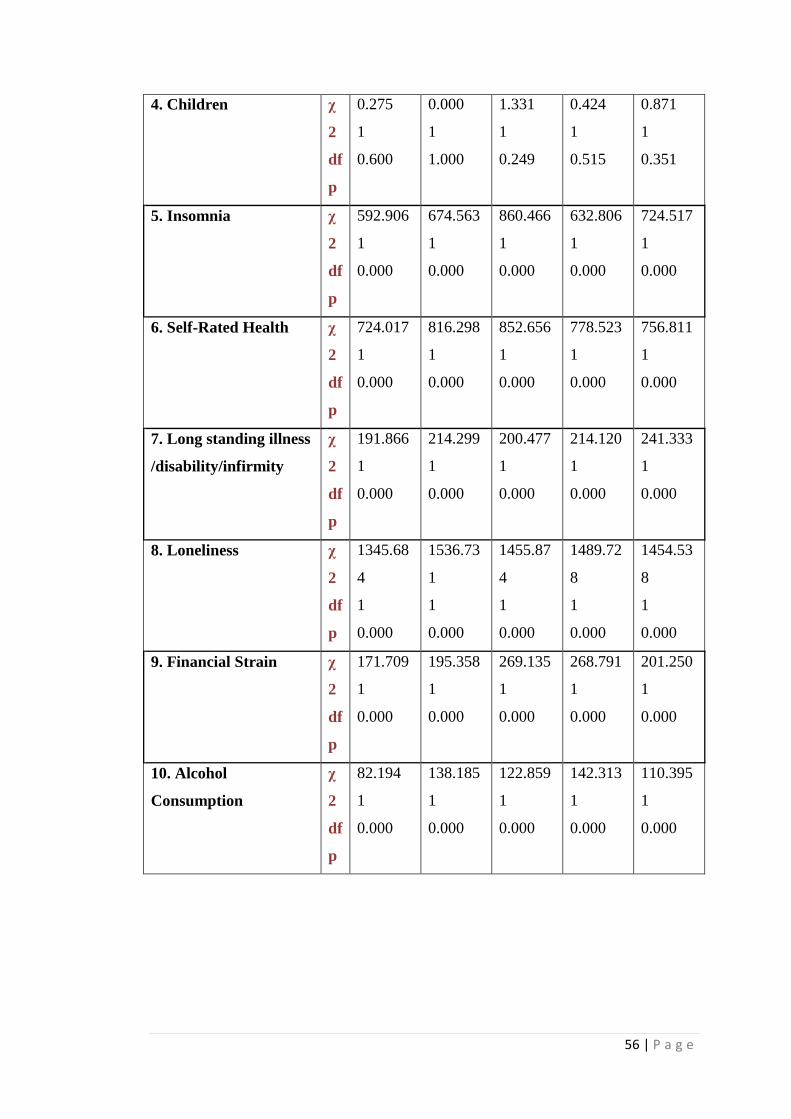
56 | P a g e
4. Children χ
2
df
p
0.275
1
0.600
0.000
1
1.000
1.331
1
0.249
0.424
1
0.515
0.871
1
0.351
5. Insomnia χ
2
df
p
592.906
1
0.000
674.563
1
0.000
860.466
1
0.000
632.806
1
0.000
724.517
1
0.000
6. Self-Rated Health χ
2
df
p
724.017
1
0.000
816.298
1
0.000
852.656
1
0.000
778.523
1
0.000
756.811
1
0.000
7. Long standing illness
/disability/infirmity
χ
2
df
p
191.866
1
0.000
214.299
1
0.000
200.477
1
0.000
214.120
1
0.000
241.333
1
0.000
8. Loneliness χ
2
df
p
1345.68
4
1
0.000
1536.73
1
1
0.000
1455.87
4
1
0.000
1489.72
8
1
0.000
1454.53
8
1
0.000
9. Financial Strain χ
2
df
p
171.709
1
0.000
195.358
1
0.000
269.135
1
0.000
268.791
1
0.000
201.250
1
0.000
10. Alcohol
Consumption
χ
2
df
p
82.194
1
0.000
138.185
1
0.000
122.859
1
0.000
142.313
1
0.000
110.395
1
0.000

57 | P a g e
Variable
χ2
df
p
1. Gender 1.420 1 0.233
2. Age 0.442 1 0.506
3. Marital Status 22.756 1 0.000
4. Children 0.067 1 0.795
5. Insomnia 84.485 1 0.000
6. Self-Rated Health 132.688 1 0.000
7. Long standing
illness/disability/infirmity
30.130 1 0.000
8. Loneliness Fisher exact test
was used
Fisher exact test
was used
0.000
9. Financial Strain 47.582 1 0.000
10. Alcohol Consumption 12.928 1 0.000

58 | P a g e
4.5. Logistic Regression
To determine which of the associated factors obtained from the chi-squared test were
most significant and independently predict depression, Binary logistic regression was
carried out to identify predictors of depression. The variable “children” was not
associated with depression from the results of chi-squared test and but here in table it
was added just to have an overall view of each variable although it has to be ignored
for multi-variate analysis.
59 | P a g e
Table above shows that only 2 % of the variation in depression could be explained by
model 1(R²=.020).
In model 1(only demographic factors), each of the demographic factor was
significant: gender (p< 0.001); age (p< 0.001) and marital status (p< 0.001). It
showed that males had 79.3 % of the risk of depression compared to females
(p<0.001; OR=.793; 95% Cl=.712 to .885). For marital status, the only category
which was found to be associated was “married” (p<0.001) with 68.4 % of the risk of
depression compared to “widowed” category (p<0.001; OR=.684; 95% Cl=.586
to .798).
Age group categories “50-59” and “60-69” were significant with (p=.029) and
(p=.012). Age group “50-59” had 80.2 % of the risk of depression compared to “80+”
age group (p<0.029; OR=.802; 95% Cl=.658 to .978) whereas age group “60-69” had
77.7% of the risk of depression compared to “80+” age group (p<0.012; OR=.777;
95% Cl=.637 to .946).
Model 2 (demographic plus health factors) was able to explain 20.8% of the variation
in depression (R²=.208). After adding health factors, only marital status remained
significant (p=.003) whereas both age and gender became insignificant.
Among health factors self-rated health (p<0.001) and insomnia (p<0.001) were found
to be highly significant. Longstanding illness was found to be not significant
(p=.272). Insomniac individuals had 39.06 % higher risk of depression compared to
individuals who indicated normal sleep (p<0.001; OR=3.906; 95% Cl=3.285 to
4.644). Each category of self-rated health was highly significant with depression
p<0.001 and had a lower risk of depression compared to individuals that reported
self-rated health as poor as OR value for each of them was less than 1.
Model 3 (demographic plus health plus other factors) was able to explain 27.4 % of
the variation in depression (R²=.208). Variables that were significant in the presence
of all factors considered were insomnia (p<0.001), self-rated health (p<0.001),
loneliness (p<0.001), and financial strain (p<0.001). This model showed that the
individuals with “restless sleep” had 34.8% higher risk of depression compared to the
individuals with “normal sleep”. Self-rated health was significantly associated with
60 | P a g e
depression (p<0.001). Even, all the categories of self-rated health were also
significant with p<0.001 for each of the category (p<0.001; OR=3.489; 95%
Cl=2.909 to 4.185). Lonely people were 4.44 times more likely to be depressed than
not lonely people (p<0.001; OR=4.449; 95% Cl=3.562 to 5.555). For individuals
with financial strain as “often” (p<0.001) and “sometimes” (p=0.016) there was 21.3 %
(p<0.001; OR=2.133; 95% Cl=1.625 to 2.799) and 13.4% of higher risk of
depression (p<0.016; OR=1.340; 95% Cl=1.055 to 1.701) compared to individuals
who never had financial strain.
For self-rated health each of the category was significantly associated with
depression: ‘excellent” (p<0.001) with 23.3 % of depression risk (OR=.233; 95%
Cl=.154 to .353), “very good” (p<0.001) with 23.9% of depression risk (OR=.239;
95% Cl=.172 to .332), “good” (p<0.001) with 32.2 % of depression risk (OR=.322;
95% Cl=.243 to .427), “fair” (p<0.001) with 51.65 of depression risk (OR=.516; 95%
Cl=.393 to .679) compared to individuals with poor self-rated health.
Similarly, binary logistic regression was carried out for all other remaining waves
and for the subset data, the results were consistent for most the variables. Overall,
from the final model, self-rated health, loneliness, insomnia and financial strain were
significantly associated with depression throughout all 6 waves and in subset data.
Whereas, gender and age had inconsistent results as gender came out to be
significant for wave 3 (p=0.052) and wave 4 (p=0.014) whereas age came out to be
significant only at wave 4 (p=0.016). Long standing illness and marital status were
insignificant throughout all waves of ELSA and in subset data. Alcohol consumption
was also insignificant for each wave of ELSA and in subset data except at wave 6
(p=0.033).
Results obtained for each remaining wave can be seen in the tables below. Results
were summarised in the tables below.

61 | P a g e

62 | P a g e

63 | P a g e

64 | P a g e
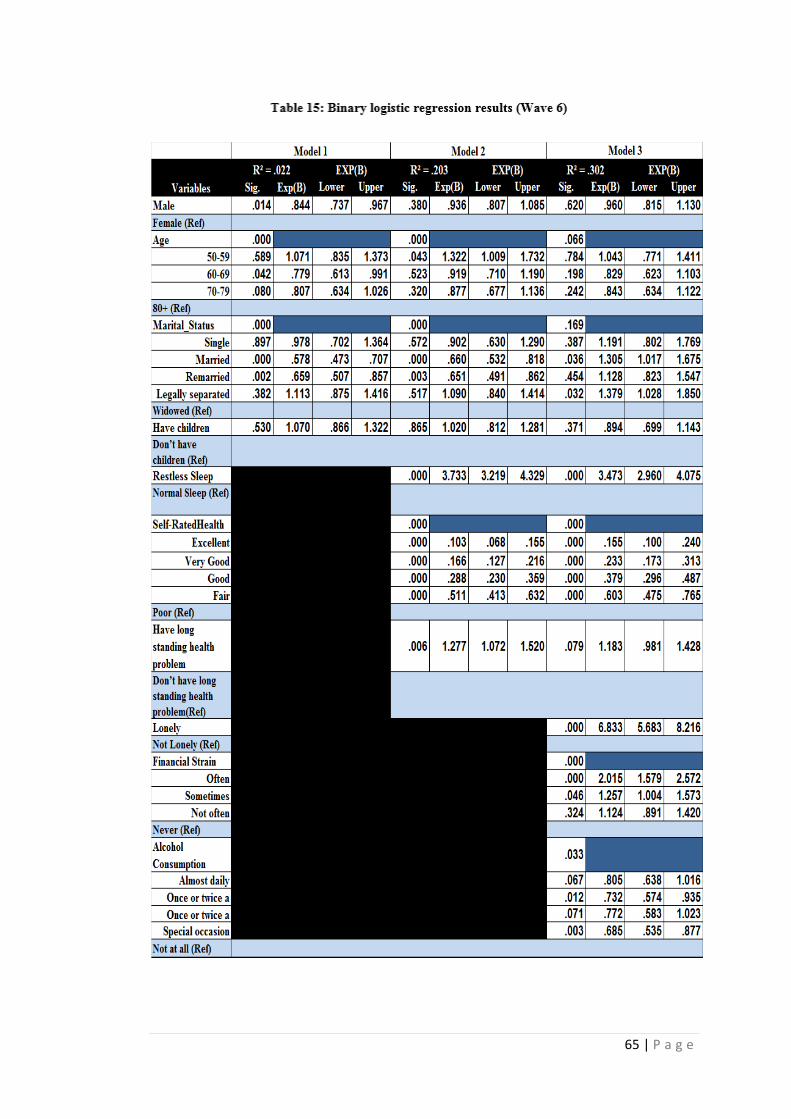
65 | P a g e
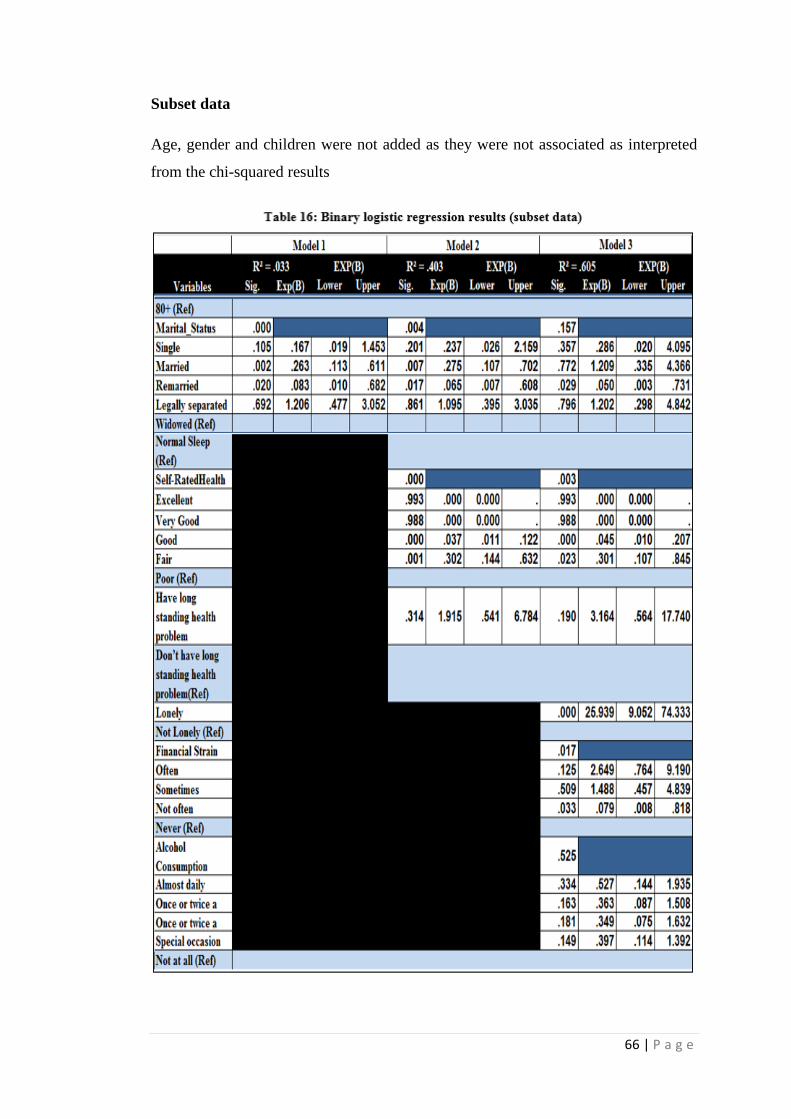
66 | P a g e
Subset data
Age, gender and children were not added as they were not associated as interpreted
from the chi-squared results
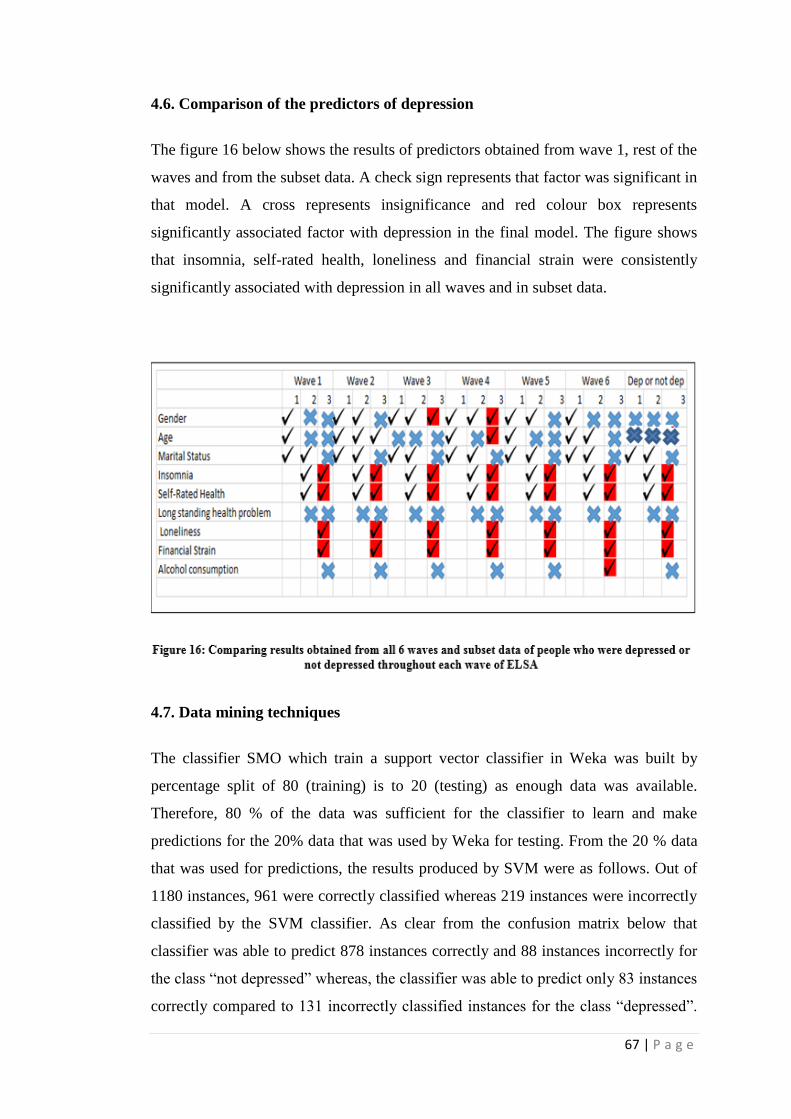
67 | P a g e
4.6. Comparison of the predictors of depression
The figure 16 below shows the results of predictors obtained from wave 1, rest of the
waves and from the subset data. A check sign represents that factor was significant in
that model. A cross represents insignificance and red colour box represents
significantly associated factor with depression in the final model. The figure shows
that insomnia, self-rated health, loneliness and financial strain were consistently
significantly associated with depression in all waves and in subset data.
4.7. Data mining techniques
The classifier SMO which train a support vector classifier in Weka was built by
percentage split of 80 (training) is to 20 (testing) as enough data was available.
Therefore, 80 % of the data was sufficient for the classifier to learn and make
predictions for the 20% data that was used by Weka for testing. From the 20 % data
that was used for predictions, the results produced by SVM were as follows. Out of
1180 instances, 961 were correctly classified whereas 219 instances were incorrectly
classified by the SVM classifier. As clear from the confusion matrix below that
classifier was able to predict 878 instances correctly and 88 instances incorrectly for
the class “not depressed” whereas, the classifier was able to predict only 83 instances
correctly compared to 131 incorrectly classified instances for the class “depressed”.

68 | P a g e
Overall accuracy rate produced by SVM was 81.44 %, the outputs from Weka for
each of the algorithm can be seen in appendix B.
Similarly, the decision tree algorithm J48 available in Weka was used to further
check what accuracy rate could be produced by it using the factors considered in this
study. With pruning, the classifier was able to produce an accuracy rate of 84.661 %.
Out of 1180 instances, the decision tree classifier (with pruning) was able to classify
999 instances correctly and 181 instances incorrectly. The classifier was able to
predict 929 instances correctly and only 37 instances incorrectly for the class “not
depressed” whereas 144 instances correctly and 70 instances incorrectly for the class
“depressed”.
From the figure 17 below, it can be seen that J48 pruned tree showed that loneliness
was one of the most important predictive factor among all other variables as it was
shown as the root node. Another key predictor that can be interpreted from the tree
obtained is insomnia. The tree shows that considering only “not lonely” reached leaf
node of predicting depression as not depressed for approximately 10123 instances
out of which around 1258 instances were misclassified by the classifier. There were
999 instances that could be reached with just considering “lonely” and “restless sleep”
to predict depression, for which 371 were incorrectly classified using this classifier.
Similarly, 594 instances could reach to not depressed class only by considering “not
lonely and “normal sleep”.
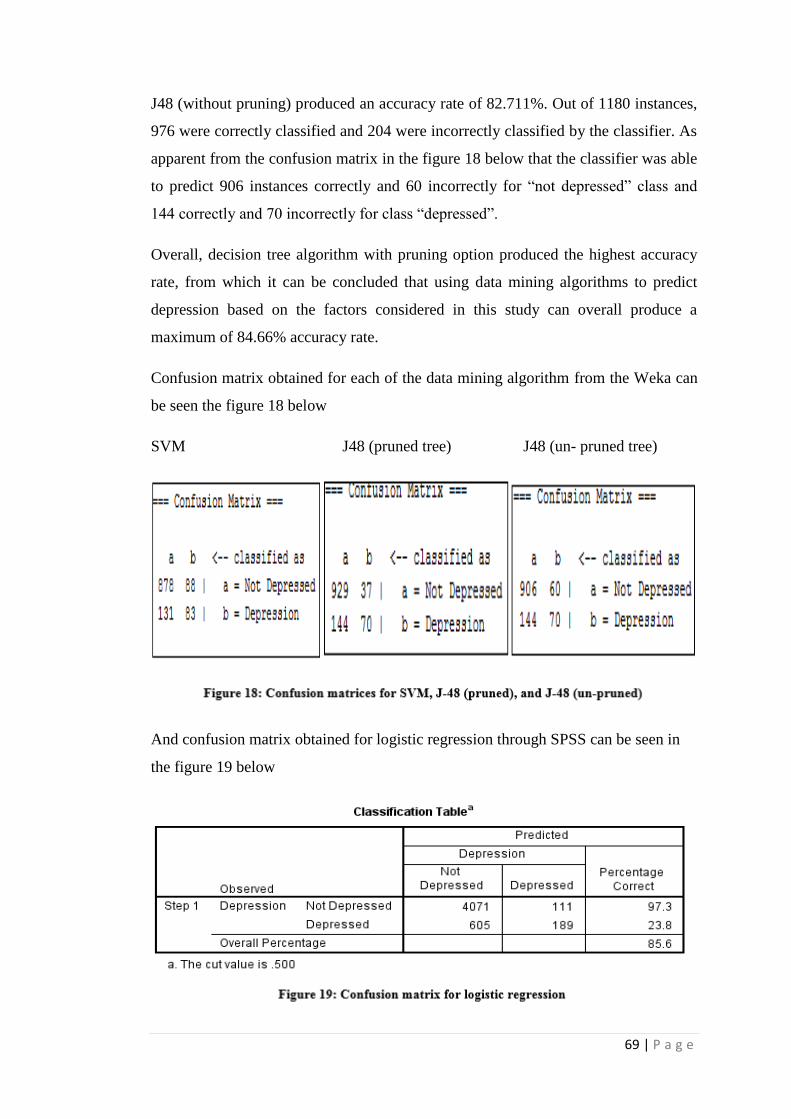
69 | P a g e
J48 (without pruning) produced an accuracy rate of 82.711%. Out of 1180 instances,
976 were correctly classified and 204 were incorrectly classified by the classifier. As
apparent from the confusion matrix in the figure 18 below that the classifier was able
to predict 906 instances correctly and 60 incorrectly for “not depressed” class and
144 correctly and 70 incorrectly for class “depressed”.
Overall, decision tree algorithm with pruning option produced the highest accuracy
rate, from which it can be concluded that using data mining algorithms to predict
depression based on the factors considered in this study can overall produce a
maximum of 84.66% accuracy rate.
Confusion matrix obtained for each of the data mining algorithm from the Weka can
be seen the figure 18 below
SVM J48 (pruned tree) J48 (un- pruned tree)
And confusion matrix obtained for logistic regression through SPSS can be seen in
the figure 19 below

70 | P a g e
Further, a comparison was made between the results obtained by data mining
algorithms and statistical technique (which in this study was logistic regression) to
identify which of the techniques have produced better model for predicting
depression based on the factors considered in this study.
On comparison, it was found that the best accuracy rate (85.61%) was produced by
logistic regression. However, its specificity (the ability of the test to correctly predict
people who were depressed) was worse than all other data mining algorithms (just
23.8%) Although, its ability to classify not depressed people was better than all other
algorithms (specificity= 0.973 i.e. 97. 3%). The positive predictive value (correct
prediction of depressed people) was found to best for decision tree -unpruned.
Whereas, negative predictive value (correct prediction of not depressed people) was
found to be best for logistic regression.
4.8. Tree diagram
Tree diagrams in the figure 21 and 22 below shows that 53 respondents (2.54 %) out
of 2084 depressed respondents at wave 1 were depressed throughout all waves of
ELSA and 2593 respondents (26.91%) out of 9633 were not depressed from wave 1
to wave 6.
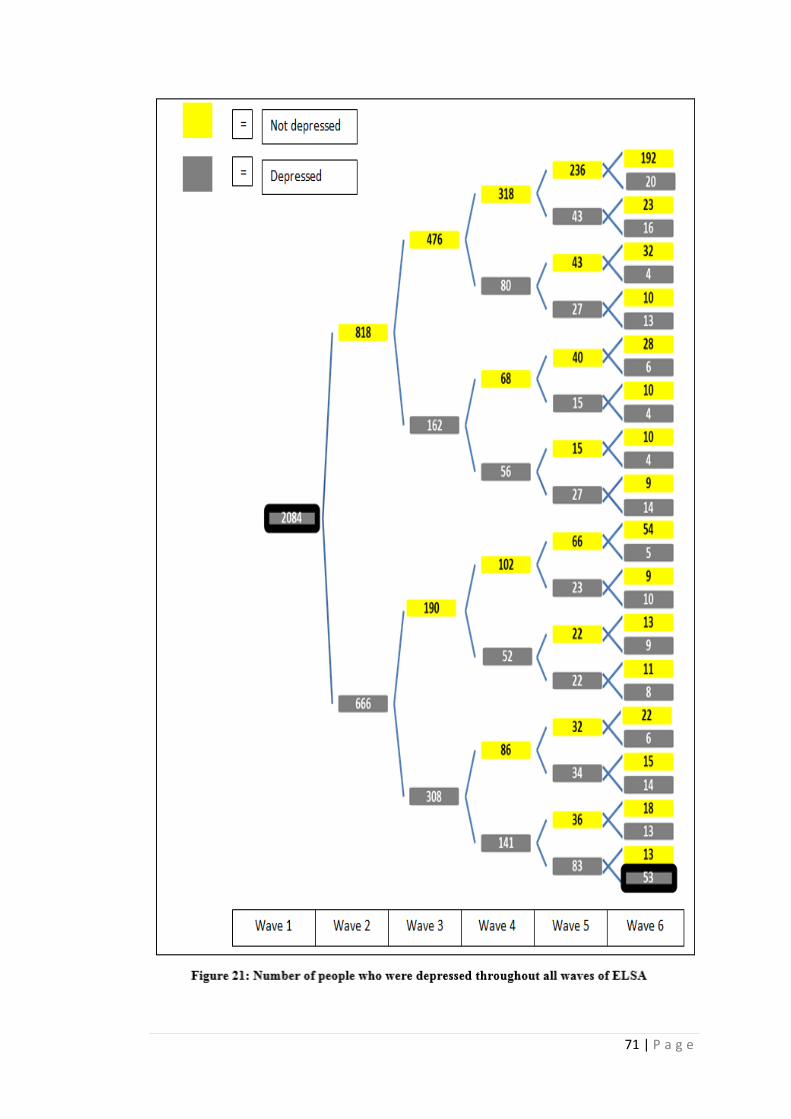
71 | P a g e
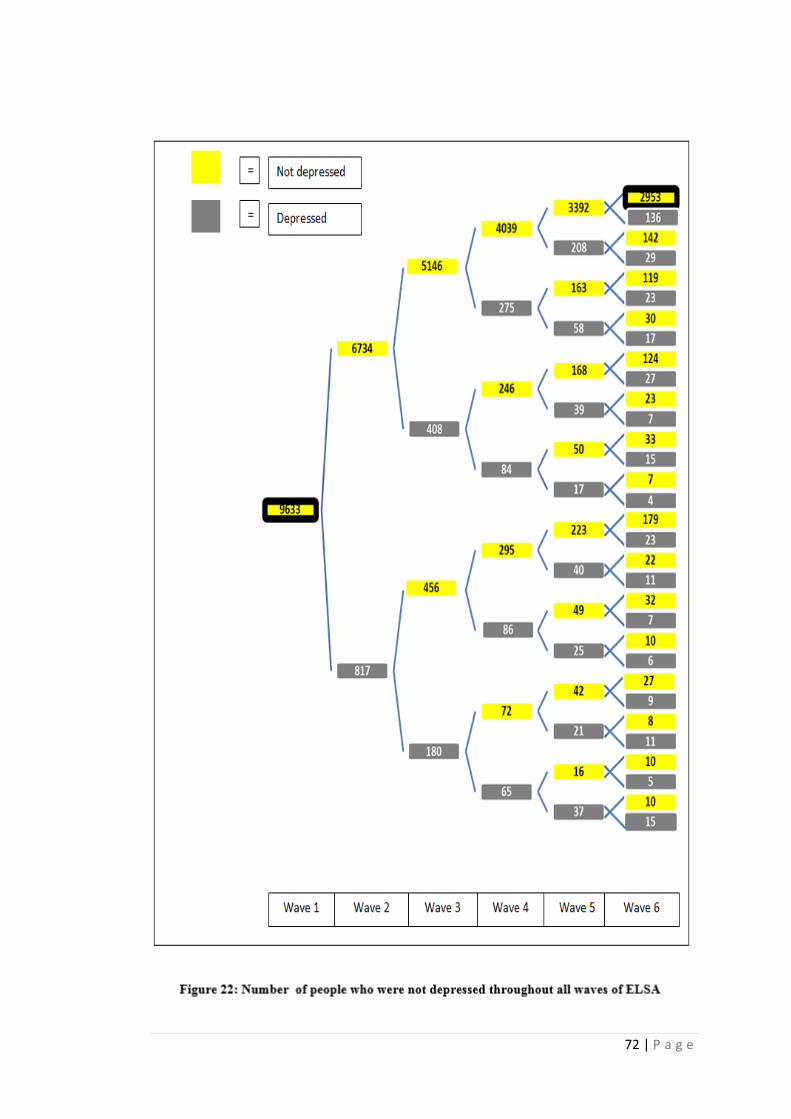
72 | P a g e

73 | P a g e
Status of each factor
Further, the status of each of the variable was identified based on mode value for
wave 1 and wave 6. It can be seen from the bar charts in the figure 23 below that
status for financial strain was changed from “sometimes” to “often”. Another change
in status was for alcohol consumption that changed from “once or twice a week” to
“not at all”. Rest for each of the variable the status was found to be same at wave 1
and wave 6. The associated status for these 53 depressed respondents for all other
variables were: “female” (gender); “married” (marital status); “have children”
(children); “restless sleep” (insomnia); “poor” (self-rated health); “have long
standing illness” (long standing illness); and “lonely” (loneliness). It was not
calculated for the age variable as data were for people who were depressed
throughout all 6 waves and hence increase in age was expected so the status.
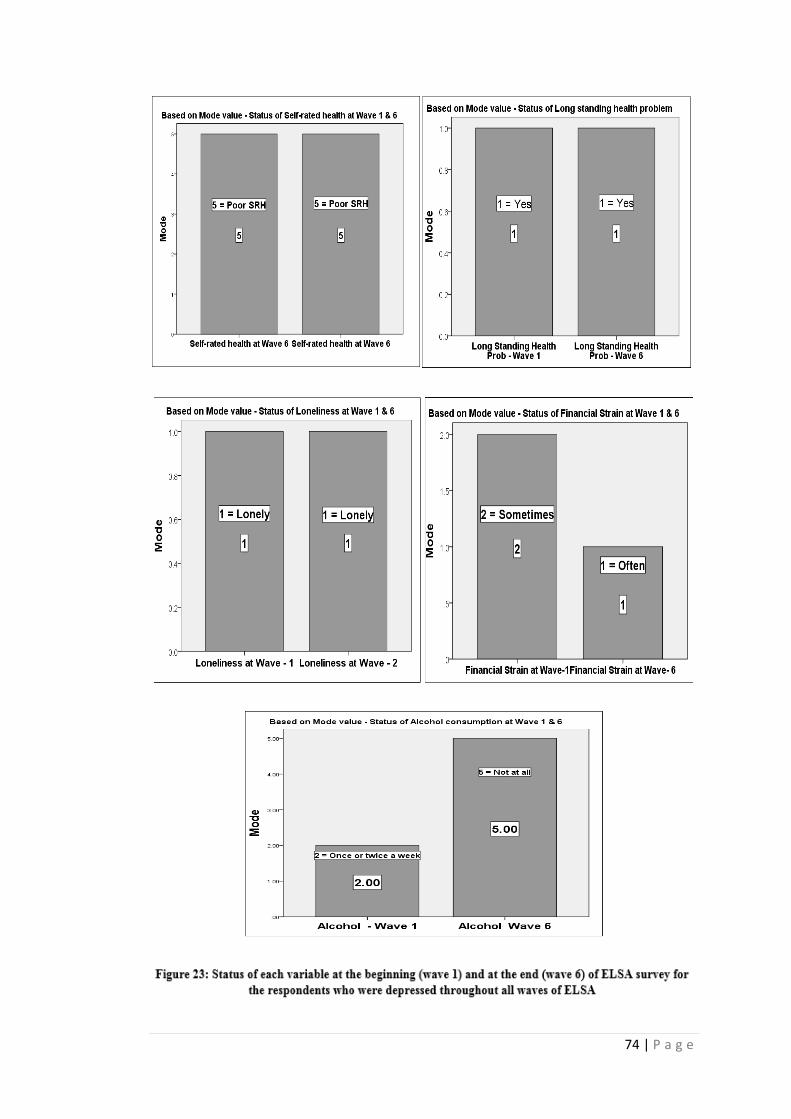
74 | P a g e
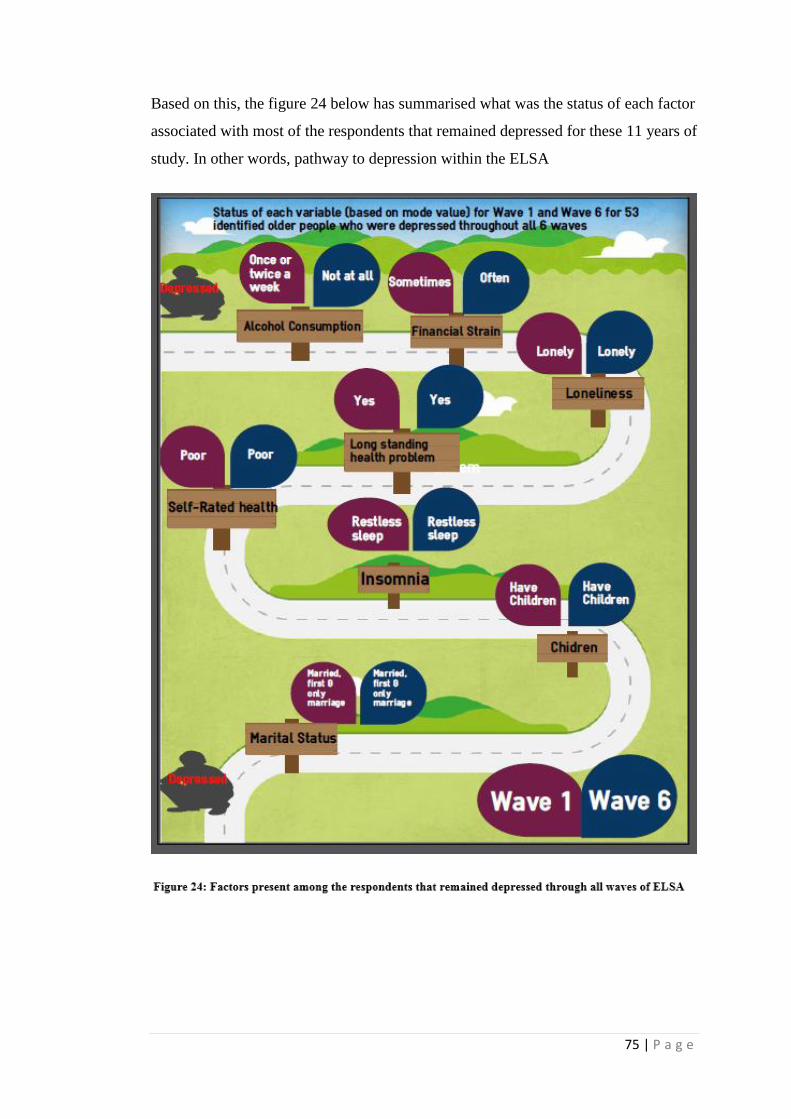
75 | P a g e
Based on this, the figure 24 below has summarised what was the status of each factor
associated with most of the respondents that remained depressed for these 11 years of
study. In other words, pathway to depression within the ELSA
76 | P a g e
Chapter 5: Discussion
In this chapter the findings about predictors of depression from the longitudinal
analysis of ELSA are discussed and compared with previous published literature.
5.1. Predictors (The most significant risk factors)
a) Self-rated health
One of the most significantly associated factor in this study was self-rated health.
Each of the category of self-rated health was also significantly associated almost
across all waves of ELSA with (p<0.001). This finding was very much expected as
considerable amount of literature has been published on how self-rated health is
associated with depression (Lochen & Rasmussen, 1996; Chow & Chan, 2010). This
finding of self-rated health evidently support the results published by Badawi et al.,
(2013) that reported poor self-rated health at baseline wave was an independent
predictor of major depression at follow up. Similarly, Damián, Barriuso, and Gama
(2008) reported that poor or fair self-rated health was a significant risk factor for
depression in older people. Likewise, Ruo et al. (2006) reported from their study
based on older women, that majority of women facing depression rated their health
as poor or fair. Relationship between self-rated health and depression analysed by
Han (2012), identified a bidirectional relationship between self-rated health and
depression, such that depression at baseline wave was an independent predictor of
poor self-rated health at follow up waves and poor self-rated health at baseline was a
predictor of depression in follow up waves.
b) Loneliness
Another predictor of depression and highly significant factor (p<0.001 for each wave)
associated with depression throughout all waves of ELSA was loneliness. This was
an obvious finding as a large and growing body of literature research has highlighted
the strong association between depression and loneliness (Wong et al., 2016). The
finding of this study are in line with those of previous studies. For instance, a study
by Beljouw et al. (2014) concluded that depression was a consequence of loneliness
for community-dwelling elderly people and severe cases of depression were found

77 | P a g e
among older adults who felt lonely. Further evidence comes from a study by Barg et
al. (2006) regarding perception of loneliness among both depressed and not
depressed older adults which reported that most of the older adults perceived
loneliness as a precursor to a subsequent depression. Similar results were reported by
Singh and Mishra (2009) that loneliness was significantly associated with depression.
Gan, Xie, Duan, Deng, and Yu (2015) in their six-month longitudinal study for
Chinese older adults also showed that loneliness at baseline was a predictor of
depression at the follow up wave.
c)Insomnia
Insomnia was found to be another predictor of depression in this study, it was highly
significant throughout all 6 waves of ELSA (p<0.001). The finding that insomnia
was significantly associated with depression was not surprising as literature have
demonstrated that insomnia is one of the most common feature observed in
depressed people, thus, often it is looked as a symptom of depression (Benca &
Peterson, 2008). Moreover, studies have also highlighted that how insomnia is of
central importance for the onset of new depressive episodes (Mcnamara, 2006). The
finding of this study is in agreement with the results obtained by Livingston, Blizarda
and Mann (1993) where the authors found that insomnia was the best predictor of
depression for older adults living in London. They also reported that in the presence
of insomnia in their multivariate model, the traditional significant risk factors
including demographic factors and long standing illness became insignificant.
Similar results were replicated by (Nolan, 2009) who confirmed that insomnia was
an independent predictor not only for the development of depression but also for
recurrent depression among elderly people. Likewise, a research conducted by
Riemann and Voderholzer (2003) identified that insomniac patients became
depressed in the follow-up interviews, which showed insomnia as a predictor of
depression.
d)Financial Strain
Financial strain came out to be another predictor of depression in this study as it was
significantly associated with depression throughout all 6 waves of ELSA. A
significant association of economic hardship with depression in older adults was also

78 | P a g e
found by Pudrovska, Schieman, Pearlin, and Nguyen (2005). This view is supported
by Sharma, Satija, and Nathawat (1985) in their study about various life events that
relates to depression in older adults, in which they concluded that life event related to
financial hardship was the most associated event with depression. Similar results
were replicated by Aranda and Lincoln (2011) where they demonstrated that
financial strain was an independent predictor of depression. In the same vein, various
other studies have provided convincing evidence to suggest financial strain to be
significantly associated with depression (Krause, 1987; Zimmerman & Katon, 2005;
Price, Choi, & Vinokur, 2002). Researchers have emphasized that among different
socio-economic factors that relate to depression, financial strain is the strongest
among all of them and financial strain can even mediate the significant association of
other socio-economic factors with depression (Kessler, Turner, & House, 1987;
Whelan, 1993). A longitudinal study to measure impact of economic crisis on older
adults by Sargent-Cox, Butterworth, & Anstey (2011) also suggested that older
adults who indicated an impact due to economic crisis were more associated with
depressive symptoms.
5.2. Insignificant factors - Not at all significant
a). Long standing illness/disability/infirmity
Contrary to expectations, this study did not find a significant association between
long standing illness and depression. Much of the literature has focussed on existence
of a strong significant association between long standing illness/disability/infirmity
with depression (Dickens et al., 2011; Rifel, Švab, Pavlič, King, & Nazareth, 2010)
but not all, for instance, H. Lee, Hahn, Shim, Kwon, & Jeong, 2013 showed that long
standing illness was not associated with depression in older adults, and the number of
physical illness present was also not associated with depression, similar to the
findings of this study. Similarly, of particular relevance to the findings of present
study is the work of Alpass & Neville (2003) where they concluded that physical
disability and presence of long standing illness was not associated with depression.
Using similar methods, where they considered self-rated health, physical illness and
long term health problems in a multivariate model, the authors discovered that
depression was associated with only self-rated health as individuals who reported
poor self-rated health had experience more depression compared to other individuals.
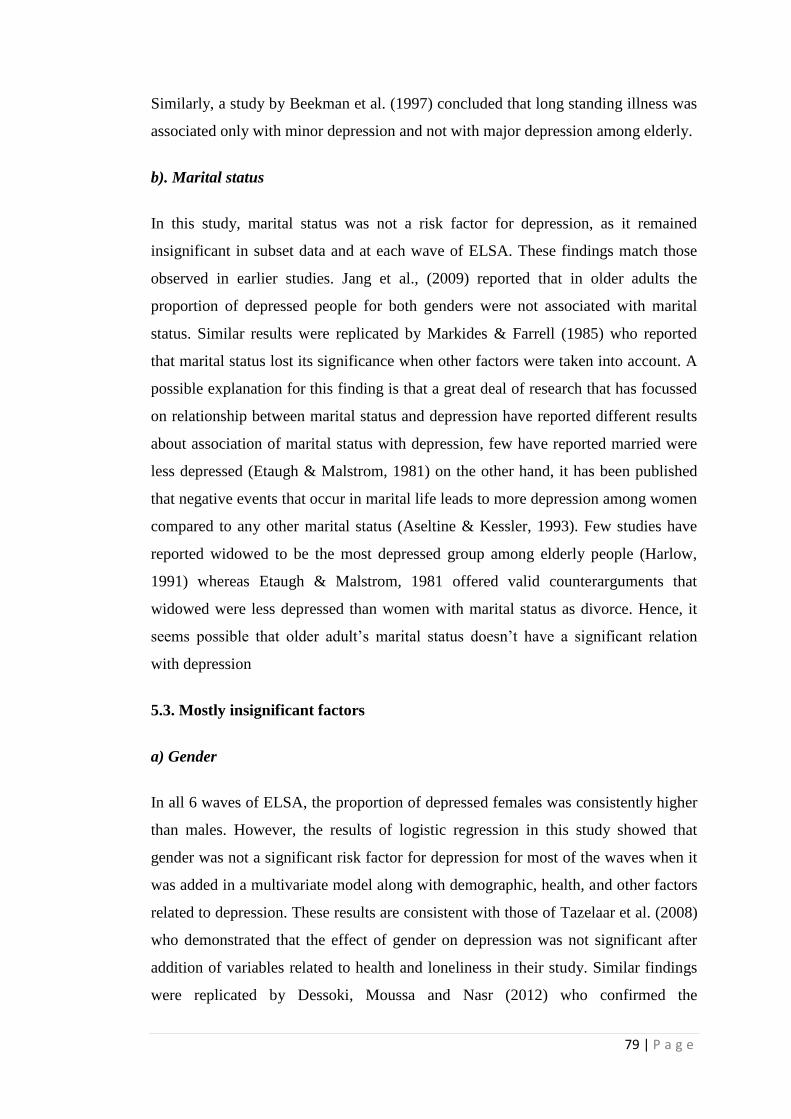
79 | P a g e
Similarly, a study by Beekman et al. (1997) concluded that long standing illness was
associated only with minor depression and not with major depression among elderly.
b). Marital status
In this study, marital status was not a risk factor for depression, as it remained
insignificant in subset data and at each wave of ELSA. These findings match those
observed in earlier studies. Jang et al., (2009) reported that in older adults the
proportion of depressed people for both genders were not associated with marital
status. Similar results were replicated by Markides & Farrell (1985) who reported
that marital status lost its significance when other factors were taken into account. A
possible explanation for this finding is that a great deal of research that has focussed
on relationship between marital status and depression have reported different results
about association of marital status with depression, few have reported married were
less depressed (Etaugh & Malstrom, 1981) on the other hand, it has been published
that negative events that occur in marital life leads to more depression among women
compared to any other marital status (Aseltine & Kessler, 1993). Few studies have
reported widowed to be the most depressed group among elderly people (Harlow,
1991) whereas Etaugh & Malstrom, 1981 offered valid counterarguments that
widowed were less depressed than women with marital status as divorce. Hence, it
seems possible that older adult’s marital status doesn’t have a significant relation
with depression
5.3. Mostly insignificant factors
a) Gender
In all 6 waves of ELSA, the proportion of depressed females was consistently higher
than males. However, the results of logistic regression in this study showed that
gender was not a significant risk factor for depression for most of the waves when it
was added in a multivariate model along with demographic, health, and other factors
related to depression. These results are consistent with those of Tazelaar et al. (2008)
who demonstrated that the effect of gender on depression was not significant after
addition of variables related to health and loneliness in their study. Similar findings
were replicated by Dessoki, Moussa and Nasr (2012) who confirmed the
80 | P a g e
insignificant association between gender and depression in their study, although, they
found that depression in females was more associated with the feeling of
worthlessness and suffering. In this study, however, gender was significant at wave 3
and wave 4 which may be explained by the fact that females have a higher tendency
to report symptoms of anxiety, stress and depression (Weissman, 1977). Another
possible explanation for this if considered from a biological point of view is, it is
more mood changes in women due to reproductive cycles that make them more
vulnerable to depression (Hoeksema, 1987) and when considered from a
psychosocial point of view, the higher risk of depression in females is due to both
low social status attached with female gender and a greater concern for relationships
(Weissman, 1977). There are, yet, several other possible explanations for this result.
b) Age
The results obtained for age were similar as obtained for gender in sense that it was
significant at only one of the wave and remained insignificant for all other waves.
This finding of age not being significant for most of the waves is consistent with that
of Blazer, Burchett, Service, and George (1991) who reported that increased age was
significantly associated with depression but lost its significance when other factors
related to health, social support and financial were considered. Similarly, study by
Beekman (1995) also showed that both gender and age were not risk factors for
depression in elderly. A possible explanation for this inconsistency of age as risk
factor supports the idea of Jorm (2000) who concluded that there is a disagreement
between whether depression decreases in older adults due to decreased need of
emotional support and increased control over emotions, or whether it increases due to
greater vulnerability of getting alone, and decreased health status. However, its
significance at two of the waves support the ideas of Yang (2007) that with age,
depression symptoms are obvious, due to presence of different factors in old age
which are independently associated with depression. Similarly, Stordal, Mykletun,
and Dahl (2003) also found age to be significantly associated with depression.
c). Alcohol
Alcohol consumption was not a risk factor for depression as it remained insignificant
in subset data as well as in all 6 waves of ELSA other than in wave 6. This finding is

81 | P a g e
consistent with results obtained by van Gool (2003) that alcohol consumption was
not significantly associated with older adults. Similarly, Weyerer et al., (2013) also
emphasised that depression was not associated with alcohol consumption for elderly
people. In the same vein, Barry, Fleming, Manwell, Copeland, and Appel (1998) also
reported that neither the volume nor the frequency of alcohol consumption was
associated with depression among elderly. Alcohol consumption as insignificant for
each of the wave except at wave 6 was not a very expected finding because a great
deal of literature has also highlighted a strong association between alcohol
consumption and depression (Bekaroğlu, Uluutku, Tanriöver, & Kirpinar, 1991;
Rodgers et al., 2000; Perreira & Sloan, 2002; Aihara, Minai, Aoyama, &
Shimanouchi, 2010). A possible explanation for this finding is may be the lack of a
strong evidence from the literature about whether this association exists or not, a
number of studies differ in their interpretation of relationship between alcohol
consumption and depression in older adults. It is difficult to guess about whether this
association is based on the data that authors use for their research or whether it
actually exists.
5.4. Not associated factor
a) Children
A very strange finding was that the factor - children was not significant even at
bivariate analysis (from the results of chi-square test). This study, hence, suggest that
in the UK, depression in older adults is not significantly associated with the “children”
factor. Our finding evidently support the results published from the research
performed by Vikström et al. (2011) that no difference was found in depression
among older adults based upon whether they have children or not. The relationship
between childlessness in later life with depression was also analysed by Cox (1998)
where he demonstrates that childlessness was not associated with depression among
the elderly even after controlling all other factors. A possible explanation for children
factor not having associated with depression might be that older adults having
children and not getting the required support is also associated with higher levels of
depression (Djundeva, Mills, Wittek, & Steverink, 2015). This idea is further
supported by research performed by COX (2002) where he identified that the highest
levels of depression were present among older adults that shared a poor quality
relationship with their children.

82 | P a g e
Chapter Six: Conclusion and Recommendations
6.1. Conclusion
The identified predictors from this study were self-rated health, loneliness, insomnia
and financial strain. Insignificance of demographic factors (age and gender for most
of the waves and marital status for all 6 waves and no association altogether at bi-
variate analysis for the factor children) showed that depression cannot be attributed
to only traditional significant risk factors that have been discussed in the published
literature. The finding, self-rated health to be significantly associated with depression
whereas insignificance of long term illness with depression need further investigation
whether depression is associated with how the respondents think their health is or is
it based on actual presence of some illness/disability/infirmity. Also, alcohol
consumption in older adults was found not be associated with depression. Although,
this study identified predictors of depression within the ELSA, it cannot ensure these
are the factors that cause depression in older adults, it can only be considered that
these factors are strongly associated with depression.
6.2. Limitations of this study
a). From the data perspective
Depression variable was measured based on the response to the question “Much of
the time during the past week, you felt depressed?”. This way of measurement has its
own limitations as follows. First, not all older adults can remember and recall how
they felt last week, and thus it includes a possibility of memory bias. Second, it is not
necessary that a respondent who felt depressed last week actually had a clinically
recognised depression. Third, a person may have experienced sad mood due to a
stressful event or other difficult circumstances which may seems to them as
depression. Third, as discussed in the literature review that many older adults are not
able to detect depression due to different other health problems, stigma attached with
depression, and few considering it as a part of normal ageing. The use of CES-D
scale (Center for Epidemiologic Studies Depression Scale) to measure depression
would have been more useful to obtain accurate results.

83 | P a g e
Another limitation of this study is that a single question was asked to measure long
term illness, disability and infirmity. Whereas in current and past published literature
each of the factor has been considered independently by the researchers where they
have found different associations of these three factors with depression. So the
finding of this study doesn’t actually clear whether it is disability, long term illness
or infirmity that was not at all significant.
Another limitation of this study is that it has analysed data of a longitudinal survey,
and longitudinal surveys have their own drawbacks as comparison is made on the
same basis for each wave even though respondents at each wave are dropped out or
new ones are added, the problem of attrition that is accompanied with every
longitudinal study.
b). From the methods perspective
In logistic regression, three models were used to look for which factors predicts
depression. Although, the models were divided into demographic, health and other
factors. It has its own limitation as it has not considered adding self-rated health and
presence of long standing health problem in different models to check whether long
standing illness was a predictor for depression when self-rated health was not taken
into account and what correlation exists between self-rated health and long standing
illness. Similarly, for other variables.
In this study only two of the data mining techniques have been used to identify the
predictive nature of the factors. But, may be different algorithms such as Baseline
classifier (ZeroR), Artificial neural networks, Naive Bayes may have produced
different results, better or worse than these obtained results.
c)From the results perspective
The results obtained for predictors of depression should be interpreted as predictors
of depression amongst the ten factors that were considered in this present study. As
there were various other factors that were identified to be risk factors of depression
from the published literature but were not included in this study considering the
scope of the present study.

84 | P a g e
6.3. Strengths of this study
This study has tried to find predictors of depression by considering each of the wave
to ensure that it reports the right results about predictors of depression in terms of the
most significant ones i.e. the factors that came out to be the predictors for each wave
of ELSA.
Additionally, data filtered for people who were either depressed or not depressed
throughout all waves of ELSA provides further evidence about what predicts
depression in older adults of England based on these ten factors.
A good accuracy rate produced by data mining techniques have further shown the
predictive abilities of these factors to predict depression.
Status of each factor based on mode value for the respondents who were depressed
throughout all waves of ELSA further provide better understanding about these ten
factors and in what state were they present for the respondents who were depressed
through these 11 years of ELSA survey.
6.4. Recommendations for Future Research
Various areas that could further be explored while finding the predictors of
depression within the ELSA that were currently outside the scope of this study are as
follows. First, in this study the variables that were added were present throughout
each of the wave but the ELSA contains some additional variables and sub modules
at different waves such as “effort and reward module” at wave 2; “risk module”
related questions that were asked only at wave 5; life history questions at wave 3;
variables related to sexual activity present only at wave 6. It would be interesting to
assess the effects of these variables from different waves along with traditional risk
factors such as demographic factors to identify which of the variables relate more to
depression in older adults.
It is recommended that further research be undertaken using only data mining
techniques to predict depression in older adults. As much more variables could be
added in the data mining software to first select which one of them are the most
relevant using the select attributes functionality and by selecting appropriate attribute
evaluator and a search method; for ELSA the best would be :cfsSubsetEval”

85 | P a g e
(attribute evaluator) and “Best First”(method) and then these factors could be further
used to look at the accuracy rates being produced by different data mining algorithms
(mainly SVM, artificial neural networks, Random Forests, J48, Random tree, Naive
bayes, and ZeroR).
The way tree diagram was produced in this study to look for how people changed
their status of depression from one wave to another, it would be very interesting if a
longitudinal analysis is carried out to assess what factors were changed from one
wave to another when a change in depression status was observed.
References
All, M. A. H., Uysse, D. A. J. B., Owell, P. E. D. N., Ofzinger, E. R. I. C. A. N.,
Ouck, P. A. H., Eynolds, C. H. F. R., & Upfer, D. A. J. K. (2000). Symptoms of
Stress and Depression as Correlates of Sleep in Primary Insomnia, 230, 227–
230.
Alpass, F. M., & Neville, S. (2016). Loneliness , health and depression in older
males, 7863(April). http://doi.org/10.1080/1360786031000101193
Anderson, D. N. (2001). Treating depression in old age : the reasons to be positive,
13–17.
Aihara, Y., Minai, J., Aoyama, A., & Shimanouchi, S. (2010). Depressive symptoms
and past lifestyle among Japanese elderly people. Community Mental Health
Journal, 47(2), 186–193. doi:10.1007/s10597-010-9317-1
Akhtar-Danesh, N., & Landeen, J. (2007). Relation between depression and
sociodemographic factors. International Journal of Mental Health Systems, 1(1),
4. doi:10.1186/1752-4458-1-4
Alexopoulos, G. S. (2005). Depression in the elderly. The Lancet, 365(9475), 1961–
1970. doi:10.1016/s0140-6736(05)66665-2
Alpass, F. M., & Neville, S. (2003). Loneliness, health and depression in older males.
Aging & Mental Health, 7(3), 212–216. doi:10.1080/1360786031000101193

86 | P a g e
Ambresin, G., Chondros, P., Dowrick, C., Herrman, H., & Gunn, J. M. (2014). Self-
rated health and long-term prognosis of depression. The Annals of Family
Medicine, 12(1), 57–65. doi:10.1370/afm.1562
Aneshensel, C. S., Frerichs, R. R., & Huba, G. J. (1984). Depression and physical
illness: A Multiwave, Nonrecursive causal model. Journal of Health and Social
Behavior, 25(4), 350. doi:10.2307/2136376
Aranda, M. P., & Lincoln, K. D. (2011). Financial strain, negative interaction, coping
styles, and mental health among low-income Latinos. Race and Social Problems,
3(4), 280–297. doi:10.1007/s12552-011-9060-4
Aseltine, R. H., & Kessler, R. C. (1993). Marital disruption and depression in a
community sample. Journal of Health and Social Behavior, 34(3), 237.
doi:10.2307/2137205
Aylaz, R., Aktürk, Ü., Erci, B., Öztürk, H., & Aslan, H. (2012). Relationship between
depression and loneliness in elderly and examination of influential factors.
Archives of Gerontology and Geriatrics, 55(3), 548–554. doi:
10.1016/j.archger.2012.03.006
Banerjee, S. (2014). Multimorbidity — older adults need health care that can count,
6736(14), 587–589. http://doi.org/10.1016/S0140-6736(14)61596-8
Blazer, D., Burchett, B., Service, C., & George, L. K. (1991). The Association of
Age and Depression Among the Elderly : An Epidemiologic Exploration, 46(6).
Blazer, D. G. (2003). Depression in Late Life : Review and Commentary, 58(3),
249–265.
Blazer, D., Hughes, D. C., & George, L. K. (1987). The Epidemiology of Depression
in an Elderly Community Population 1, 27(3), 281–287.
Badawi, G., Pagé, V., Smith, K. J., Gariépy, G., Malla, A., Wang, J., … Schmitz, N.
(2013). Self-rated health: A predictor for the three-year incidence of major
depression in individuals with type II diabetes. Journal of Affective Disorders, 145(1),
100–105. doi: 10.1016/j.jad.2012.07.018
Barg, F. K., Huss-Ashmore, R., Wittink, M. N., Murray, G. F., Bogner, H. R., & Gallo, J.
J. (2006). A mixed-methods approach to understanding loneliness and

87 | P a g e
depression in older adults. The Journals of Gerontology Series B: Psychological
Sciences and Social Sciences, 61(6), S329–S339. doi:10.1093/geronb/61.6. s329
Beekman, A. T. F., Deeg, D. J. H., van Tilburg, T., Smit, J. H., Hooijer, C., & van Tilburg,
W. (1995). Major and minor depression in later life: A study of prevalence and
risk factors. Journal of Affective Disorders, 36(1-2), 65–75. doi:10.1016/0165-
0327(95)00061-5
Bekaroğlu, M., Uluutku, N., Tanriöver, S., & Kirpinar, I. (1991). Depression in an
elderly population in turkey. Acta Psychiatrica Scandinavica, 84(2), 174–178.
doi:10.1111/j.1600-0447. 1991.tb03124.x
Bekhet, A. K., & Zauszniewski, J. A. (2012). Mental health of elders in retirement
communities: Is loneliness a key factor? Archives of Psychiatric Nursing, 26(3),
214–224. doi: 10.1016/j.apnu.2011.09.007
Benca, R. M., & Peterson, M. J. (2008). Insomnia and depression. Sleep Medicine, 9,
S3–S9. doi:10.1016/s1389-9457(08)70010-8
Benton, T., Staab, J., & Evans, D. L. (2007). Medical Co-Morbidity in Depressive
disorders. Annals of Clinical Psychiatry, 19(4), 289–303.
doi:10.1080/10401230701653542
Berger, B. D., & Adesso, V. J. (1991). Gender differences in using alcohol to cope
with depression. Addictive Behaviors, 16(5), 315–327. doi:10.1016/0306-
4603(91)90024-c
Blazer, D., Burchett, B., Service, C., & George, L. K. (1991). The association of age
and depression among the elderly: An epidemiologic exploration. Journal of
Gerontology, 46(6), M210–M215. doi:10.1093/geronj/46.6.m210
Blazer, D., Hughes, D. C., & George, L. K. (1987). The Epidemiology of depression in
an elderly community population. The Gerontologist, 27(3), 281–287.
doi:10.1093/geront/27.3.281
Borawski, E. A., Kinney, J. M., & Kahana, E. (1996). The meaning of older adults’
health appraisals: Congruence with health status and determinant of mortality.
The Journals of Gerontology Series B: Psychological Sciences and Social Sciences,
51B(3), S157–S170. doi:10.1093/geronb/51b.3.s157
Bourassa, K. J., Memel, M., Woolverton, C., & Sbarra, D. A. (2015). Social
participation predicts cognitive functioning in aging adults over time:

88 | P a g e
Comparisons with physical health, depression, and physical activity. Aging &
Mental Health. doi:10.1080/13607863.2015.1081152
Bower, B. (1986). Treating depression: Can we talk? Science News, 129(21), 324.
doi:10.2307/3970683
Broudeur, H., Hurrell, D., Stepinska, M., Fluffy, P. A., & Houxou. (2014, October).
ELSA - English longitudinal study of Ageing. Retrieved August 25, 2016, from
http://www.elsa-project.ac.uk/
Bruce, M. L., & Kim, K. M. (1992). Differences in the effects of divorce on major
depression in men and women. American Journal of Psychiatry, 149(7), 914–917.
doi:10.1176/ajp.149.7.914
Bulloch, A., Lavorato, D., Williams, J., & Patten, S. (2012). ALCOHOL CONSUMPTION
AND MAJOR DEPRESSION IN THE GENERAL POPULATION: THE CRITICAL
IMPORTANCE OF DEPENDENCE. Depression and Anxiety, 29(12), 1058–1064.
doi:10.1002/da.22001
Butterworth, P., Rodgers, B., & Windsor, T. D. (2009). Financial hardship, socio-
economic position and depression: Results from the PATH through life survey.
Social Science & Medicine, 69(2), 229–237. doi:
10.1016/j.socscimed.2009.05.008
Byrne, E. J. (1994). Diagnosis and treatment of depression in late life. Edited by Lon
S. Schneider, Charles F. Reynolds 111, Barry D. Lebowitz and Arnold Friedhoff.
American psychiatric press, 1994. No. Of pages: 416. Price: £41.95. International
Journal of Geriatric Psychiatry, 9(7), 592–592. doi:10.1002/gps.930090716
Cairney, J., & Wade, T. J. (2002). The influence of age on gender differences in
depression. Social Psychiatry and Psychiatric Epidemiology, 37(9), 401–408.
doi:10.1007/s00127-002-0569-0
Carruthers, H. R., Morris, J., Tarrier, N., & Whorwell, P. J. (2010). The Manchester
color wheel: Development of a novel way of identifying color choice and its
validation in healthy, anxious and depressed individuals. BMC Medical Research
Methodology, 10(1), . doi:10.1186/1471-2288-10-12
Chang, K. J., Son, S. J., Lee, Y., Back, J. H., Lee, K. S., Lee, S. J., … Hong, C. H. (2014).
Perceived sleep quality is associated with depression in a Korean elderly

89 | P a g e
population. Archives of Gerontology and Geriatrics, 59(2), 468–473. doi:
10.1016/j.archger.2014.04.007
Chou, K.-L., & Chi, I. (2004). Prevalence and correlates of depression in Chinese
oldest-old. International Journal of Geriatric Psychiatry, 20(1), 41–50.
doi:10.1002/gps.1246
Chow, S. K. Y., & Chan, W. C. (2010). Research article: Depression: Problem-solving
appraisal and self-rated health among Hong Kong Chinese migrant women.
Nursing & Health Sciences, 12(3), 352–359. doi:10.1111/j.1442-2018.2010.
00537.x
Christensen, K., Doblhammer, G., Rau, R., & Vaupel, J. W. (2009). Ageing
populations: The challenges ahead. The Lancet, 374(9696), 1196–1208.
doi:10.1016/s0140-6736(09)61460-4
Comstock, G. W., & Helsing, K. J. (1977). Symptoms of depression in two
communities. Psychological Medicine, 6(04), 551.
doi:10.1017/s0033291700018171
Connidis, I. A., & McMullin, J. A. (1993). To have or have not: Parent status and the
subjective well-being of older men and women. The Gerontologist, 33(5), 630–
636. doi:10.1093/geront/33.5.630
Conwell, Y., Duberstein, P. R., & Caine, E. D. (2002). Risk factors for suicide in later
life. Biological Psychiatry, 52(3), 193–204. doi:10.1016/s0006-3223(02)01347-1
Craft, B. J., Johnson, D. R., & Ortega, S. T. (1998). Rural-urban women’s experience
of symptoms of depression related to economic hardship. Journal of Women &
Aging, 10(3), 3–18. doi:10.1300/j074v10n03_02
Crome, I., & Crome, P. (2007). Moderate alcohol consumption in older adults is
associated with better cognition and well-being than abstinence. Age and
Ageing, 37(1), 120–121. doi:10.1093/ageing/afm150
Culbertson, F. M. (1997). Depression and gender: An international review. American
Psychologist, 52(1), 25–31. doi:10.1037/0003-066x.52.1.25
Campayo, A., & Gómez-biel, C. H. (2011). Diabetes and Depression, 26–30.
http://doi.org/10.1007/s11920-010-0165-z
Coussement, K., Bossche, F. A. M. Van Den, & Bock, K. W. De. (2014). Data
90 | P a g e
accuracy ’ s impact on segmentation performance : Benchmarking RFM
analysis , logistic regression , and decision trees. Journal of Business Research,
67(1), 2751–2758. http://doi.org/10.1016/j.jbusres.2012.09.024
Damián, J., Pastor-Barriuso, R., & Valderrama-Gama, E. (2008). Factors associated
with self-rated health in older people living in institutions. BMC Geriatrics, 8(1),
5. doi:10.1186/1471-2318-8-5
Dessoki, H., Moussa, F., & Nasr, M. (2011). P02-236 - gender differences in elderly
patientswith depression. European Psychiatry, 26, 832. doi:10.1016/s0924-
9338(11)72537-8
Dickens, C., Coventry, P., Khara, A., Bower, P., Mansell, W., & Bakerly, N. D. (2011).
Perseverative negative cognitive processes are associated with depression in
people with long-term conditions. Chronic Illness, 8(2), 102–111.
doi:10.1177/1742395311433058
Drageset, J., Espehaug, B., & Kirkevold, M. (2012). The impact of depression and
sense of coherence on emotional and social loneliness among nursing home
residents without cognitive impairment - a questionnaire survey. Journal of
Clinical Nursing, 21(7-8), 965–974. doi:10.1111/j.1365-2702.2011. 03932.x
Druss, B. G., Hwang, I., Petukhova, M., Sampson, N. A., Wang, P. S., & Kessler, R. C.
(2008). Impairment in role functioning in mental and chronic medical disorders
in the United States: Results from the national Comorbidity survey replication.
Molecular Psychiatry, 14(7), 728–737. doi:10.1038/mp.2008.13
Dendukuri, N., & Cole, M. G. (2001). Risk Factors for Depression Among Elderly
Community subjects : A Systematic Review and Meta-Analysis, (12), 1147–
1156.
Djundeva, M., Mills, M., Wittek, R., & Steverink, N. (2015). Receiving Instrumental
Support in Late Parent–Child Relationships and Parental Depression. The
Journals of Gerontology Series B: Psychological Sciences and Social Sciences,
70(6), 981–994. http://doi.org/10.1093/geronb/gbu136
Etaugh, C., & Malstrom, J. (1981). The effect of marital status on person perception.
Journal of Marriage and the Family, 43(4), 801. doi:10.2307/351337
91 | P a g e
Evenson, R. J., Simon, R. W., Beth, S., Glass, J., Thoits, P., & Hughes, M. (2005).
Clarifying the Relationship Between Parenthood and Depression *
FARAKHAN, A., LUBIN, B., & O’CONNOR, W. A. (1984). LIFE SATISFACTION AND
DEPRESSION AMONG RETIRED BLACK PERSONS. Psychological Reports, 55(2),
452–454. doi:10.2466/pr0.1984.55.2.452
Faravelli, C., Alessandra Scarpato, M., Castellini, G., & Lo Sauro, C. (2013). Gender
differences in depression and anxiety: The role of age. Psychiatry Research,
210(3), 1301–1303. doi: 10.1016/j.psychres.2013.09.027
Fishleder, S., Schonfeld, L., Corvin, J., Tyler, S., & VandeWeerd, C. (2015). Drinking
behavior among older adults in a planned retirement community: Results from
the villages survey. International Journal of Geriatric Psychiatry, 31(5), 536–543.
doi:10.1002/gps.4359
Ford, D. E. (1989). Epidemiologic study of sleep disturbances and psychiatric
disorders. JAMA, 262(11), 1479. doi:10.1001/jama.1989.03430110069030
Foster, C. J., Barkus, E., Yavorsky, C., Foster, E. J., Barkus, E., & Yavorsky, C.
(2016). Understanding and Using Advanced Statistics Logistic Regression, 57–
70.
Franke, T. M., Ho, T., & Christie, C. A. (2012). The Chi-Square Test : Often Used
and More Often Misinterpreted. http://doi.org/10.1177/1098214011426594
Gambhir, I. S., Chakrabarti, S. S., Sharma, A. R., & Saran, D. P. (2014). Insomnia in
the elderly—A hospital-based study from north India. Journal of Clinical
Gerontology and Geriatrics, 5(4), 117–121. doi: 10.1016/j.jcgg.2014.05.005
Gan, P., Xie, Y., Duan, W., Deng, Q., & Yu, X. (2015). Rumination and loneliness
independently predict Six-Month later depression symptoms among Chinese
elderly in nursing homes. PLOS ONE, 10(9), e0137176. doi:
10.1371/journal.pone.0137176
Glenn, N. D. (1975). The contribution of marriage to the psychological well-being of
males and females. Journal of Marriage and the Family, 37(3), 594.
doi:10.2307/350523
92 | P a g e
Graham, K., & Schmidt, G. (1999). Alcohol use and psychosocial well-being among
older adults. Journal of Studies on Alcohol, 60(3), 345–351.
doi:10.15288/jsa.1999.60.345
Gureje, O., Ademola, A., & Olley, B. O. (2008). Depression and disability:
Comparisons with common physical conditions in the Ibadan study of aging.
Journal of the American Geriatrics Society, 56(11), 2033–2038.
doi:10.1111/j.1532-5415.2008. 01956.x
Goldstein, B., Rosselli, F., Goldstein, B., & Rosselli, F. (2016). Etiological
paradigms of depression : The relationship between perceived causes ,
empowerment , treatment preferences , and stigma Etiological paradigms of
depression : The relationship between perceived causes , empowerment ,
treatment, 8237(April). http://doi.org/10.1080/09638230310001627919
Han, B. (2002). Depressive symptoms and self-rated health in community-dwelling
older adults: A longitudinal study. Journal of the American Geriatrics Society,
50(9), 1549–1556. doi:10.1046/j.1532-5415.2002. 50411.x
Harlow, S. D. (1991). A longitudinal study of the prevalence of Depressive
Symptomatology in elderly widowed and married women. Archives of General
Psychiatry, 48(12), 1065. doi:10.1001/archpsyc.1991.01810360029004
Haseen, F., & Prasartkul, P. (2011). Predictors of depression among older people
living in rural areas of Thailand. Bangladesh Medical Research Council Bulletin,
37(2), doi:10.3329/bmrcb. v37i2.8434
Hawkes, N. (2012). Susceptibility of people with long term illness to depression and
anxiety is not recognised, report says. BMJ, 344(feb08 2), e950–e950.
doi:10.1136/bmj. e950
Holtfreter, K., Reisig, M. D., & Turanovic, J. J. (2015). Depression and infrequent
participation in social activities among older adults: The moderating role of high-
quality familial ties. Aging & Mental Health.
doi:10.1080/13607863.2015.1099036
Holvast, F., Burger, H., de Waal, M. M. W., van Marwijk, H. W. J., Comijs, H. C., &
Verhaak, P. F. M. (2015). Loneliness is associated with poor prognosis in late-life
depression: Longitudinal analysis of the Netherlands study of depression in
93 | P a g e
older persons. Journal of Affective Disorders, 185, 1–7. doi:
10.1016/j.jad.2015.06.036
Hosseini, H. (2014). Aging and the rising costs of healthcare in the United States:
Can there be a solution? Ageing International, 40(3), 229–247.
doi:10.1007/s12126-014-9209-8
Hamer, M., Batty, G. D., & Kivimaki, M. (2012). Risk of future depression in people
who are obese but metabolically healthy : the English longitudinal study of
ageing. Molecular Psychiatry, 17(9), 940–945.
http://doi.org/10.1038/mp.2012.30
Hill, C. V, Pérez-stable, E. J., Anderson, N. A., & Bernard, M. A. (2015). T he N
ational I nstitute on A ging H ealth D isparities R esearch F ramework, 25(3),
245–254.
Hodges, S. (2002). Mental Health , Depression , and Dimensions of Spirituality and
Religion, 9(2).
Jacobson, A. M. (1993). Depression and diabetes. Diabetes Care, 16(12), 1621–1623.
doi:10.2337/diacare.16.12.1621
Jang, S.-N., Kawachi, I., Chang, J., Boo, K., Shin, H.-G., Lee, H., & Cho, S. (2009).
Marital status, gender, and depression: Analysis of the baseline survey of the
Korean longitudinal study of Ageing (KLoSA). Social Science & Medicine, 69(11),
1608–1615. doi: 10.1016/j.socscimed.2009.09.007
Jang, Y., Park, N. S., Kang, S.-Y., & Chiriboga, D. A. (2013). Racial/ethnic differences
in the association between symptoms of depression and self-rated mental
health among older adults. Community Mental Health Journal, 50(3), 325–330.
doi:10.1007/s10597-013-9642-2
Jaremka, L. M., Andridge, R. R., Fagundes, C. P., Alfano, C. M., Povoski, S. P., Lipari, A.
M., … Kiecolt-Glaser, J. K. (2014). Pain, depression, and fatigue: Loneliness as a
longitudinal risk factor. Health Psychology, 33(9), 948–957.
doi:10.1037/a0034012
Johnson, I. (2000). Alcohol problems in old age: A review of recent epidemiological
research. International Journal of Geriatric Psychiatry, 15(7), 575–581.
doi:10.1002/1099-1166(200007)15:7<575: aid-gps151>3.0.co;2-0
94 | P a g e
Joiner, T. E., & Blalock, J. A. (1995). Gender differences in depression: The role of
anxiety and generalized negative affect. Sex Roles, 33(1-2), 91–108.
doi:10.1007/bf01547937
Jokela, M., Batty, G. D., & Kivimäki, M. (2013). Ageing and the prevalence and
treatment of mental health problems. Psychological Medicine, 43(10), 2037–
2045. doi:10.1017/s0033291712003042
JORM, A. F. (2000). Does old age reduce the risk of anxiety and depression? A
review of epidemiological studies across the adult life span. Psychological
Medicine, 30(1), 11–22. doi:10.1017/s0033291799001452
Jorm, A. F. (2000). Does old age reduce the risk of anxiety and depression ? A
review of epidemiological studies across the adult life span, 11–22.
Kader Maideen, S. F., Mohd Sidik, S., Rampal, L., & Mukhtar, F. (2015). Prevalence,
associated factors and predictors of anxiety: A community survey in Selangor,
Malaysia. BMC Psychiatry, 15(1), . doi:10.1186/s12888-015-0648-x
Kamiya, Y., Doyle, M., Henretta, J. C., & Timonen, V. (2013). Depressive symptoms
among older adults: The impact of early and later life circumstances and marital
status. Aging & Mental Health, 17(3), 349–357.
doi:10.1080/13607863.2012.747078
Karpansalo, M. (2005). Depression and early retirement: Prospective population
based study in middle aged men. Journal of Epidemiology & Community Health,
59(1), 70–74. doi:10.1136/jech.2003.010702
Katsumata, Y., Arai, A., Ishida, K., Tomimori, M., Denda, K., & Tamashiro, H. (2005).
Gender differences in the contributions of risk factors to depressive symptoms
among the elderly persons dwelling in a community, Japan. International Journal
of Geriatric Psychiatry, 20(11), 1084–1089. doi:10.1002/gps.1403
Kessler, R. C., Turner, J. B., & House, J. S. (1987). Intervening processes in the
relationship between unemployment and health. Psychological Medicine, 17(04),
949. doi:10.1017/s0033291700000763
Kim, J.-M., Shin, I.-S., Yoon, J.-S., & Stewart, R. (2002). Prevalence and correlates of
late-life depression compared between urban and rural populations in Korea.
95 | P a g e
International Journal of Geriatric Psychiatry, 17(5), 409–415.
doi:10.1002/gps.622
Kivelá, S.-L., & Pahkala, K. (2001). Depressive disorder as a predictor of physical
disability in old age. Journal of the American Geriatrics Society, 49(3), 290–296.
doi:10.1046/j.1532-5415.2001. 4930290.x
Koenig, H. G. (1988). Depression in elderly hospitalized patients with medical illness.
Archives of Internal Medicine, 148(9), 1929–1936.
doi:10.1001/archinte.148.9.1929
Koropeckyj-Cox, T. (1998). Loneliness and depression in middle and old age: Are the
childless more vulnerable? The Journals of Gerontology Series B: Psychological
Sciences and Social Sciences, 53B (6), S303–S312.
doi:10.1093/geronb/53b.6.s303
Koropeckyj-Cox, T. (2002). Beyond parental status: Psychological well-being in
middle and old age. Journal of Marriage and Family, 64(4), 957–971.
doi:10.1111/j.1741-3737.2002. 00957.x
Krause, N. (1987). Chronic financial strain, social support, and depressive symptoms
among older adults. Psychology and Aging, 2(2), 185–192. doi:10.1037/0882-
7974.2.2.185
Kronmüller, K.-T., Backenstrass, M., Victor, D., Postelnicu, I., Schenkenbach, C., Joest,
K., … Mundt, C. (2011). Quality of marital relationship and depression: Results of
a 10-year prospective follow-up study. Journal of Affective Disorders, 128(1-2),
64–71. doi: 10.1016/j.jad.2010.06.026
Lebowitz, B. D. (1997). Diagnosis and treatment of depression in late life. JAMA,
278(14), 1186. doi:10.1001/jama.1997.03550140078045
Kadane, J. B. (2016). Review : Descriptive Statistics Authors ( s ): Joseph B .
Kadane Review by : Joseph B . Kadane Source : Science , New Series , Vol .
200 , No . 4338 ( Apr . 14 , 1978 ), p . 195 Published by : American Association
for the Advancement of Science Stable URL, 200(4338).
Kim H. K., & McKenry, P. C. (2002). The Relationship Between Marriage and
Psychological Well-being: A Longitudinal Analysis. Journal of Family Issues,
23(8), 885–911. http://doi.org/10.1177/019251302237296

96 | P a g e
Kingsford, C., & Salzberg, S. L. (2008). What are decision trees ? a, 26(9), 1011–
1013.
Lee, H. (2014). The impact of social activity on life satisfaction and depression of
community-dwelling elderly:comparing living arrangement. Journal of
community welfare, 48(1), doi:10.15300/jcw.2014.48.1.269
Lee, H., Hahn, S., Shim, S., Kwon, Y., & Jeong, H. (2013). P.2.b.057 prevalence of
depression in elderly patients with chronic physical illness. European
Neuropsychopharmacology, 23, S353. doi:10.1016/s0924-977x (13)70556-x
Lochen, M.., & Rasmussen, K. (1996). Palpitations and lifestyle: Impact of
depression and self-rated health. The Nordland health study. Scandinavian
Journal of Public Health, 24(2), 140–144. doi:10.1177/140349489602400209
Loder, B. (2009). Depression in later life: A personal account. Quality in Ageing and
Older Adults, 10(1), 47–48. doi:10.1108/14717794200900008
Lopez, A. D., & Murray, C. C. J. L. (1998). The global burden of disease, 1990–2020.
Nature Medicine, 4(11), 1241–1243. doi:10.1038/3218
Lue, B.-H., Chen, L.-J., & Wu, S.-C. (2010). Health, financial stresses, and life
satisfaction affecting late-life depression among older adults: A nationwide,
longitudinal survey in Taiwan. Archives of Gerontology and Geriatrics, 50, S34–
S38. doi:10.1016/s0167-4943(10)70010-8
Lunenfeld, B., & Stratton, P. (2013). The clinical consequences of an ageing world
and preventive strategies. Best Practice & Research Clinical Obstetrics &
Gynaecology, 27(5), 643–659. doi: 10.1016/j.bpobgyn.2013.02.005
Lewis, S. E. (1995). The Social Construction of Depression : Experience , Discourse
and Subjectivity . VOLUME 1, 1(July).
Livingston, G., Hawkins, A., Graham, N., & Blizard, B. O. B. (1990). The Gospel
Oak Study : prevalence rates of dementia , depression and activity limitation
among elderly residents in Inner London, 137–146.
Lue, B., Chen, L., & Wu, S. (2010). Health , financial stresses , and life satisfaction
affecting late-life depression among older adults : a nationwide , longitudinal
survey in Taiwan. DART***, 50, S34–S38. http://doi.org/10.1016/S0167-
4943(10)70010-8

97 | P a g e
Maguen, S., Luxton, D. D., Skopp, N. A., & Madden, E. (2012). Gender differences in
traumatic experiences and mental health in active duty soldiers redeployed
from Iraq and Afghanistan. Journal of Psychiatric Research, 46(3), 311–316. doi:
10.1016/j.jpsychires.2011.11.007
Mallon, L., Broman, J.-E., & Hetta, J. (2000). Relationship between insomnia,
depression, and mortality: A 12-Year follow-up of older adults in the community.
International Psychogeriatrics, 12(3), 295–306.
doi:10.1017/s1041610200006414
Manber, R., & Chambers, A. S. (2009). Insomnia and depression: A multifaceted
interplay. Current Psychiatry Reports, 11(6), 437–442. doi:10.1007/s11920-009-
0066-1
Markides, K. S., & Farrell, J. (1985). Marital status and depression among Mexican
Americans. Social Psychiatry, 20(2), 86–91. doi:10.1007/bf00594985
Marmot, M. (2003). Health, wealth and lifestyles of the older population in England:
The 2002 English longitudinal study of ageing. London: IFS.
Mayer, S. E., & Jencks, C. (1989). Poverty and the distribution of material hardship.
The Journal of Human Resources, 24(1), 88. doi:10.2307/145934
MCNAMARA, D. (2006). Anxiety and sleep problems predict depression in elderly.
Internal Medicine News, 39(19), 27. doi:10.1016/s1097-8690(06)74282-2
Mendes De Leon, C. F., Rapp, S. S., & Kasl, S. V. (1994). Financial strain and
symptoms of depression in a community sample of elderly men and women: A
longitudinal study. Journal of Aging and Health, 6(4), 448–468.
doi:10.1177/089826439400600402
Mendenhall, E., Narayanan, G., & Prabhakaran, D. (2012). Short Report :
Complications Depression and diabetes in India : perspectives and
recommendations, (Ccdc), 308–311. http://doi.org/10.1111/j.1464-
5491.2012.03708.x
Millard, P. H. (1983). BRITISH, 287(6389), 375–376.
Millán-Calenti, J. C., Sánchez, A., Lorenzo, T., & Maseda, A. (2011). Depressive
symptoms and other factors associated with poor self-rated health in the elderly:

98 | P a g e
Gender differences. Geriatrics & Gerontology International, 12(2), 198–206.
doi:10.1111/j.1447-0594.2011. 00745.x
Mirowsky, J., & Ross, C. E. (1999). Economic hardship across the life course.
American Sociological Review, 64(4), 548. doi:10.2307/2657255
Mirowsky, J., & Ross, C. E. (2001). Age and the effect of economic hardship on
depression. Journal of Health and Social Behavior, 42(2), 132.
doi:10.2307/3090174
Murphy, J. G., Yurasek, A. M., Dennhardt, A. A., Skidmore, J. R., McDevitt-Murphy,
M. E., MacKillop, J., & Martens, M. P. (2013). Symptoms of depression and PTSD
are associated with elevated alcohol demand. Drug and Alcohol Dependence,
127(1-3), 129–136. doi: 10.1016/j.drugalcdep.2012.06.022
Murray, J., Banerjee, S., Byng, R., Tylee, A., Bhugra, D., & Macdonald, A. (2006).
Primary care professionals’ perceptions of depression in older people: A
qualitative study. Social Science & Medicine, 63(5), 1363–1373. doi:
10.1016/j.socscimed.2006.03.037
Nikolic, M. (2015). Prevalence of comorbid depression and obesity in general
practice. British Journal of General Practice, 65(638), 451–451.
doi:10.3399/bjgp15x686449
Nolan, B. (2009). Sleep disturbance and depression recurrence in community-
dwelling older adults: A prospective study. Yearbook of Neurology and
Neurosurgery, 2009, 171–172. doi:10.1016/s0513-5117(09)79014-3
Nolen-Hoeksema, S. (1987). Sex differences in unipolar depression: Evidence and
theory. Psychological Bulletin, 101(2), 259–282. doi:10.1037/0033-
2909.101.2.259
Orhan, F. Ö., Tuncel, D., Taş, F., Demirci, N., Özer, A., & Karaaslan, M. F. (2011).
Relationship between sleep quality and depression among elderly nursing home
residents in turkey. Sleep and Breathing, 16(4), 1059–1067. doi:10.1007/s11325-
011-0601-2
Offici, R. (2001). WORLD HEALTH REPORT 200t-MENTAL HEALTH, 4(July).
99 | P a g e
Pallesen, S., Nordhus, I. H., Kvale, G., Havik, O. E., Nielsen, G. H., Johnsen, B. H., …
Hjeltnes, L. (2002). Psychological characteristics of elderly insomniacs. Scandinavian
Journal of Psychology, 43(5), 425–432. doi:10.1111/1467-9450.00311
Patten, S. B. (2001). Long-term medical conditions and major depression in a
Canadian population study at waves 1 and 2. Journal of Affective Disorders,
63(1-3), 35–41. doi:10.1016/s0165-0327(00)00186-5
Perreira, K. M., & Sloan, F. A. (2002). Excess alcohol consumption and health
outcomes: A 6-year follow-up of men over age 50 from the health and
retirement study. Addiction, 97(3), 301–310. doi:10.1046/j.1360-0443.2002.
00067.x
Potts, M. K. (1997). Social support and depression among older adults living alone:
The importance of friends within and outside of a retirement community. Social
Work, 42(4), 348–362. doi:10.1093/sw/42.4.348
Price, R. H., Choi, J. N., & Vinokur, A. D. (2002). Links in the chain of adversity
following job loss: How financial strain and loss of personal control lead to
depression, impaired functioning, and poor health. Journal of Occupational
Health Psychology, 7(4), 302–312. doi:10.1037/1076-8998.7.4.302
Pudrovska, T. (2005). The sense of mastery as a mediator and moderator in the
association between economic hardship and health in late life. Journal of Aging
and Health, 17(5), 634–660. doi:10.1177/0898264305279874
QUINLAN, J. R. (1999). Simplifying decision trees. International Journal of Human-
Computer Studies, 51(2), 497–510. doi:10.1006/ijhc.1987.0321
Regan, C. O., Kearney, P. M., Savva, G. M., Cronin, H., & Kenny, R. A. (2013). Age and
sex differences in prevalence and clinical correlates of depression: First results
from the Irish longitudinal study on Ageing. International Journal of Geriatric
Psychiatry, 28(12), 1280–1287. doi:10.1002/gps.3955
Rice, N. E., Lang, I. A., Henley, W., & Melzer, D. (2010). Common health predictors of
early retirement: Findings from the English longitudinal study of Ageing. Age
and Ageing, 40(1), 54–61. doi:10.1093/ageing/afq153
Rifel, J., Švab, I., Rotar Pavlič, D., King, M., & Nazareth, I. (2010). Longstanding
disease, disability or infirmity and depression in primary care. Wiener klinische
Wochenschrift, 122(19-20), 567–571. doi:10.1007/s00508-010-1463-5

100 | P a g e
Roberts, R. E., Shema, S. J., Kaplan, G. A., & Strawbridge, W. J. (2000). Sleep
complaints and depression in an aging cohort: A prospective perspective.
American Journal of Psychiatry, 157(1), 81–88. doi:10.1176/ajp.157.1.81
Rodgers, B., Korten, A. E., Jorm, A. F., Jacomb, P. A., Christensen, H., & Henderson, A.
S. (2000). Non-linear relationships in associations of depression and anxiety with
alcohol use. Psychological Medicine, 30(2), 421–432.
doi:10.1017/s0033291799001865
Rosenvinge, H. P. (1988). Points: Late life depression: Undertreated? BMJ,
296(6631), 1263–1263. doi:10.1136/bmj.296.6631.1263-c
Russell, D. W., & Cutrona, C. E. (1991). Social support, stress, and depressive
symptoms among the elderly: Test of a process model. Psychology and Aging,
6(2), 190–201. doi:10.1037/0882-7974.6.2.190
Ross, C. E. (2016). Age and Depression Author ( s ): John Mirowsky and Catherine
E . Ross Source : Journal of Health and Social Behavior , Vol . 33 , No . 3
( Sep ., 1992 ), pp . 187-205 Published by : American Sociological Association
Stable URL : http://www.jstor.org/stable/2137349 Accessed : 01-04-2016 12 :
35 UTC Your use of the JSTOR archive indicates your acceptance of the Terms
& Conditions of Use , available at, 33(3), 187–205.
Sadler, W. A., & Weiss, R. S. (1975). Loneliness: The experience of emotional and
social isolation. Contemporary Sociology, 4(2), 171. doi:10.2307/2062224
Santini, Z. I., Koyanagi, A., Tyrovolas, S., & Haro, J. M. (2015). The association of
relationship quality and social networks with depression, anxiety, and suicidal
ideation among older married adults: Findings from a cross-sectional analysis
of the Irish longitudinal study on Ageing (TILDA). Journal of Affective Disorders,
179, 134–141. doi: 10.1016/j.jad.2015.03.015
Sargent-Cox, K., Butterworth, P., & Anstey, K. J. (2011). The global financial crisis
and psychological health in a sample of Australian older adults: A longitudinal
study. Social Science & Medicine, 73(7), 1105–1112. doi:
10.1016/j.socscimed.2011.06.063
Saunders, P. A., Copeland, J. R., Dewey, M. E., Davidson, I. A., McWilliam, C., Sharma,
V., & Sullivan, C. (1991). Heavy drinking as a risk factor for depression and
101 | P a g e
dementia in elderly men. Findings from the Liverpool longitudinal community
study. The British Journal of Psychiatry, 159(2), 213–216.
doi:10.1192/bjp.159.2.213
Schofield, D. J., Shrestha, R. N., Percival, R., Kelly, S. J., Passey, M. E., & Callander, E.
J. (2011). Quantifying the effect of early retirement on the wealth of individuals
with depression or other mental illness. The British Journal of Psychiatry, 198(2),
123–128. doi:10.1192/bjp.bp.110.081679
Scott, J. (1989). Can depression be prevented? Psychiatric Bulletin, 13(10), 583–583.
doi:10.1192/pb.13.10.583
Scott, D. (2007). Resolving the quantitative–qualitative dilemma: A critical realist
approach. International Journal of Research & Method in Education, 30(1), 3–17.
doi:10.1080/17437270701207694
Seeman, T. E. (2000). Health promoting effects of friends and family on health
outcomes in older adults. American Journal of Health Promotion, 14(6), 362–370.
doi:10.4278/0890-1171-14.6.362
Singh, A., & Misra, N. (2009). Loneliness, depression and sociability in old age.
Industrial Psychiatry Journal, 18(1), 51. doi:10.4103/0972-6748.57861
Stack, S., & Eshleman, J. R. (1998). Marital status and happiness: A 17-Nation study.
Journal of Marriage and the Family, 60(2), 527. doi:10.2307/353867
Sukegawa, T., Itoga, M., Seno, H., Miura, S., Inagaki, T., Saito, W., … Horiguchi, J.
(2003). Sleep disturbances and depression in the elderly in Japan. Psychiatry and
Clinical Neurosciences, 57(3), 265–270. doi:10.1046/j.1440-1819.2003. 01115.x
Sun, W., Watanabe, M., Tanimoto, Y., Shibutani, T., Kono, R., Saito, M., … Kono, K.
(2007). Factors associated with good self-rated health of non-disabled elderly
living alone in Japan: A cross-sectional study. BMC Public Health, 7(1), .
doi:10.1186/1471-2458-7-297
Supplemental material for pain, depression, and fatigue: Loneliness as a longitudinal
risk factor (2013). Health Psychology. doi: 10.1037/a0034012.supp
Son, Y., Kim, H., Kim, E., Choi, S., & Candidate, D. (2010). Application of Support
Vector Machine for Predic- tion of Medication Adherence in Heart Failure Pa-
tients, 16(4), 253–259. http://doi.org/10.4258/hir.2010.16.4.253
102 | P a g e
Steptoe, A., Breeze, E., Banks, J., & Nazroo, J. (2013). Cohort Profile : The English
Longitudinal Study of Ageing, (November 2012), 1640–1648.
http://doi.org/10.1093/ije/dys168
Subramaniam, H., & Mitchell, A. J. (2005). Reviews and Overviews Prognosis of
Depression in Old Age Compared to Middle Age : A Systematic Review of
Comparative Studies, (September), 1588–1601.
Taylor, D. J., Lichstein, K. L., Durrence, H. H., Reidel, B. W., & Bush, A. J. (n.d.).
Epidemiology of Insomnia , Depression , and Anxiety.
Trief, P. M. (2007). Depression in elderly diabetes patients. Diabetes Spectrum,
20(2), 71–75. doi:10.2337/diaspect.20.2.71
Van Beljouw, I. M. J., van Exel, E., de Jong Gierveld, J., Comijs, H. C., Heerings, M.,
Stek, M. L., & van Marwijk, H. W. J. (2014). “Being all alone makes me sad”:
Loneliness in older adults with depressive symptoms. International
Psychogeriatrics. doi:10.1017/s1041610214000581
Van de Velde, S., Bracke, P., & Levecque, K. (2010). Gender differences in
depression in 23 European countries. Cross-national variation in the gender gap
in depression. Social Science & Medicine, 71(2), 305–313. doi:
10.1016/j.socscimed.2010.03.035
Van den Brink, R. H. S., Ormel, J., Tiemens, B. G., Smit, A., Jenner, J. A., van der Meer,
K., & van Os, T. W. D. P. (2002). Predictability of the one-year course of
depression and generalized anxiety in primary care. General Hospital Psychiatry,
24(3), 156–163. doi:10.1016/s0163-8343(02)00183-4
Van Gool, C. H. (2003). Relationship between changes in depressive symptoms and
unhealthy lifestyles in late middle aged and older persons: Results from the
longitudinal aging study Amsterdam. Age and Ageing, 32(1), 81–87.
doi:10.1093/ageing/32.1.81
Van’t Veer-Tazelaar, P. J. (n., van Marwijk, H. W. J., Jansen, A. P. D. (d., Rijmen, F.,
Kostense, P. J., van Oppen, P., … Beekman, A. T. F. (2008). Depression in old age
(75+), the PIKO study. Journal of Affective Disorders, 106(3), 295–299. doi:
10.1016/j.jad.2007.07.004

103 | P a g e
Vikström, J., Bladh, M., Hammar, M., Marcusson, J., Wressle, E., & Sydsjö, G. (2011).
The influences of childlessness on the psychological well-being and social
network of the oldest old. BMC Geriatrics, 11(1),. doi:10.1186/1471-2318-11-78
Vafaei, A., Ahmed, T., Falc, N., & Zunzunegui, M. V. (2016). Depression , Sex and
Gender Roles in Older Adult Populations : The International Mobility in Aging
Study ( IMIAS ), 72, 1–15. http://doi.org/10.1371/journal.pone.0146867
Vanessa, L., Banerjee, S., Bhugra, D., Kuljeet, S., Turner, S., & Joanna, M. (2006).
Coping with depression in later life : a qualitative study of help-seeking in three
ethnic groups, (July), 1375–1383. http://doi.org/10.1017/S0033291706008117
Verplancke, T., Looy, S. Van, Benoit, D., Vansteelandt, S., Depuydt, P., &
Decruyenaere, J. (2008). BMC Medical Informatics and Support vector machine
versus logistic regression modeling for prediction of hospital mortality in
critically ill patients with haematological malignancies, 8, 1–8.
http://doi.org/10.1186/1472-6947-8-56
Vitral, R. W. F., Campos, M. J. S., & Fraga, M. R. (2013). The null hypothesis.
American Journal of Orthodontics and Dentofacial Orthopedics, 144(4), 498–
499. http://doi.org/10.1016/j.ajodo.2013.08.010
Wagner, D. C., & Short, J. L. (2014). Longitudinal predictors of self-rated health and
mortality in older adults. Preventing Chronic Disease, 11, doi:10.5888/pcd11.130241
Weeks, D. G., Michela, J. L., Peplau, L. A., & Bragg, M. E. (1980). Relation between
loneliness and depression: A structural equation analysis. Journal of Personality
and Social Psychology, 39(6), 1238–1244. doi:10.1037/h0077709
Weissman, M. M. (1977). Sex differences and the Epidemiology of depression.
Archives of General Psychiatry, 34(1), 98.
doi:10.1001/archpsyc.1977.01770130100011
Weissman, M. M., & Klerman, G. L. (1985). Gender and depression, 416–420
Weyerer, S., Eifflaender-Gorfer, S., Wiese, B., Luppa, M., Pentzek, M., Bickel, H., …
Riedel-Heller, S. G. (2013). Incidence and predictors of depression in non-
demented primary care attenders aged 75 years and older: Results from a 3-
year follow-up study. Age and Ageing, 42(2), 173–180.
doi:10.1093/ageing/afs184

104 | P a g e
Whelan, C. T. (1993). The role of social support in mediating the psychological
consequences of economic stress. Sociology of Health and Illness, 15(1), 86–101.
doi:10.1111/1467-9566.ep11343797
Wild, B., Herzog, W., Schellberg, D., Lechner, S., Niehoff, D., Brenner, H., … Raum, E.
(2011). Association between the prevalence of depression and age in a large
representative German sample of people aged 53 to 80 years. International
Journal of Geriatric Psychiatry. doi:10.1002/gps.2728
Williams, M. M. (2006). Treating depression to prevent diabetes and its
complications: Understanding depression as a medical risk factor. Clinical
Diabetes, 24(2), 79–86. doi:10.2337/diaclin.24.2.79
Wong, N. M. L., Liu, H.., Lin, C., Huang, C.., Wai, Y.., Lee, S.., & Lee, T. M. C. (2016).
Loneliness in late-life depression: Structural and functional connectivity during
affective processing. Psychological Medicine, 46(12), 2485–2499.
doi:10.1017/s0033291716001033
Yang, Y. (2007). Is old age depressing? Growth Trajectories and cohort variations in
late-life depression. Journal of Health and Social Behavior, 48(1), 16–32.
doi:10.1177/002214650704800102
Zarit, S. H., Femia, E. E., Gatz, M., & Johansson, B. (1999). Prevalence, incidence and
correlates of depression in the oldest old: The OCTO study. Aging & Mental Health,
3(2), 119–128. doi:10.1080/13607869956271
Zimmerman, F. J., & Katon, W. (2005). Socioeconomic status, depression disparities,
and financial strain: What lies behind the income-depression relationship?
Health Economics, 14(12), 1197–1215. doi:10.1002/hec.1011

105 | P a g e
Appendix
Appendix A (Questions/measures/responses/re-coded variables)
Questions asked in the ELSA survey for the factors considered in this study,
with their response options.
The name and question related to each of the ten risk factors considered in this study
and their recoded name (if it was required) are summarised as below: -
1. Variable Name: IndSex -> Recoded -> Age
Question asked at the time of interview: Respondent’s Sex
1. Male
2. Female
Risk factor considered from this variable: Gender
2. Variable Name: IndAgeR
Question asked at the time of interview: IndAgeR is derived from variable -
INDOB and variable - INTDAT. The current age of the respondent was
computed from the date of birth of the respondent (INDOB) to the date of
interview (INTDAT).
Risk factor considered from this variable: Age
3. Variable Name: DiMar -> Recoded -> Marital Status
Question asked at the time of interview: What is your current legal marital
status?
1. Single that is never married
2.Married, first and only marriage
3. Remarried, second or later marriage
4.Legally separated
5.Divorced
6.Widowed
Risk factor considered from this variable: Marital Status

106 | P a g e
4. Variable Name: SCCHD
Question asked at the time of interview: Do you have any children?
1. Yes
2. No
Risk factor considered from this variable: Children Availability
5. Variable Name: PScedC
Question asked at the time of interview: Much of the time during the past
week, your sleep was restless?
1 Yes
2 No
Risk factor considered from this variable: Insomnia
6. Variable Name:Hehelf
Question asked at the time of interview: Would you say your health is...
1 Excellent,
2 very good,
3 good,
4 fair,
5 poor
Risk factor considered from this variable: Self rated health
7. Variable Name: Heill
Question asked at the time of interview: Do you have any long-standing
illness, disability or infirmity? By longstanding I mean anything that has
troubled you over a period of time, or
that is likely to affect you over a period of time?
1 Yes
2 No

107 | P a g e
Risk factor considered from this variable: Long standing
illness/disability/infirmity
8. Variable Name: PScedE
Question asked at the time of interview: Much of the time during the past
week, you felt lonely?
1 Yes
2 No
Risk factor considered from this variable: Loneliness
9. Variable Name: SCQOLI
Question asked at the time of interview: Shortage of money stops me from
doing things I want to do
1 Often
2 Sometimes
3 Not often
4 Never
Risk factor considered from this variable: Financial Strain
10. Variable Name: Heala
Question asked at the time of interview: In the past 12 months have you taken
an alcoholic drink ...
1 twice a day or more,
2 daily or almost daily,
3 once or twice a week,
4 once or twice a month,
5 special occasions only,
6 or, not at all?
Risk factor considered from this variable: Alcohol consumption

108 | P a g e
11. Dependent Variable Name : PScedA
Question asked at the time of interview: Much of the time during the past
week, you felt depressed?
1 Yes
2 No
Risk factor considered from this variable: Depression
Variables that were recoded
The variable for age was recoded to make it as a categorical variable with age group
categories as: “50-59”; “60-69”; “70-79”; and “80+”. Few values less than 50 were
present which were changed to missing values. The variable for marital status was
also recoded to include categories that were more meaningful and consistent
throughout all waves as first two waves of data didn’t have civil partner categories
that were present from wave 3, but they had very few numbers of respondents in that,
therefore civil partner categories were combined with legally separated and divorced
categories. Also, legally separated and divorced categories were also combined
together to form one category as one of the category had very low frequency
throughout all waves. Therefore, the final categories of marital status were: “Single,
that is never married”; “Married, first and only marriage”; “Remarried, second or
later marriage”; and “Legally separated/divorced/civil partner” and “Widowed”.
Alcohol variable was present as “HEALA” for (Wave 1) and “SCAKO” for (Wave 2
to 6). Wave 1 had 5 response categories. And Wave 2 to 6 had 8 categories, which
were finally combined to form five categories in the same order as present in wave 1
as: “Almost daily”; “Once or twice a week”; “Once or twice a month”; “Special
occasion only”; “Not at all”. The variable for depression was recoded from the
categories “1: Depressed” and “2: Not depressed” to “0: Not depressed” and “1:
Depressed” for the purposes of this research.

109 | P a g e
Missing values
For each of the variable the response categories as “Not applicable” (-1), “Don’t
know” (-8), “Refusal” (-9), and “Schedule not applicable” (-2) were changed to
missing values in SPSS before carrying out any analysis. Further few variables were
re-coded for the purpose of this study which is detailed in appendix A.
Appendix B (Weka outputs)
SVM
J48- Pruned

110 | P a g e
The most relevant and predictive section selected by unpruned J48-decision tree

111 | P a g e
J48- Unpruned
Appendix C (Additional useful information)
Quantitative research method
s
Figure 1.1 The research process (Bryman & Cramer, 2001, p.3)
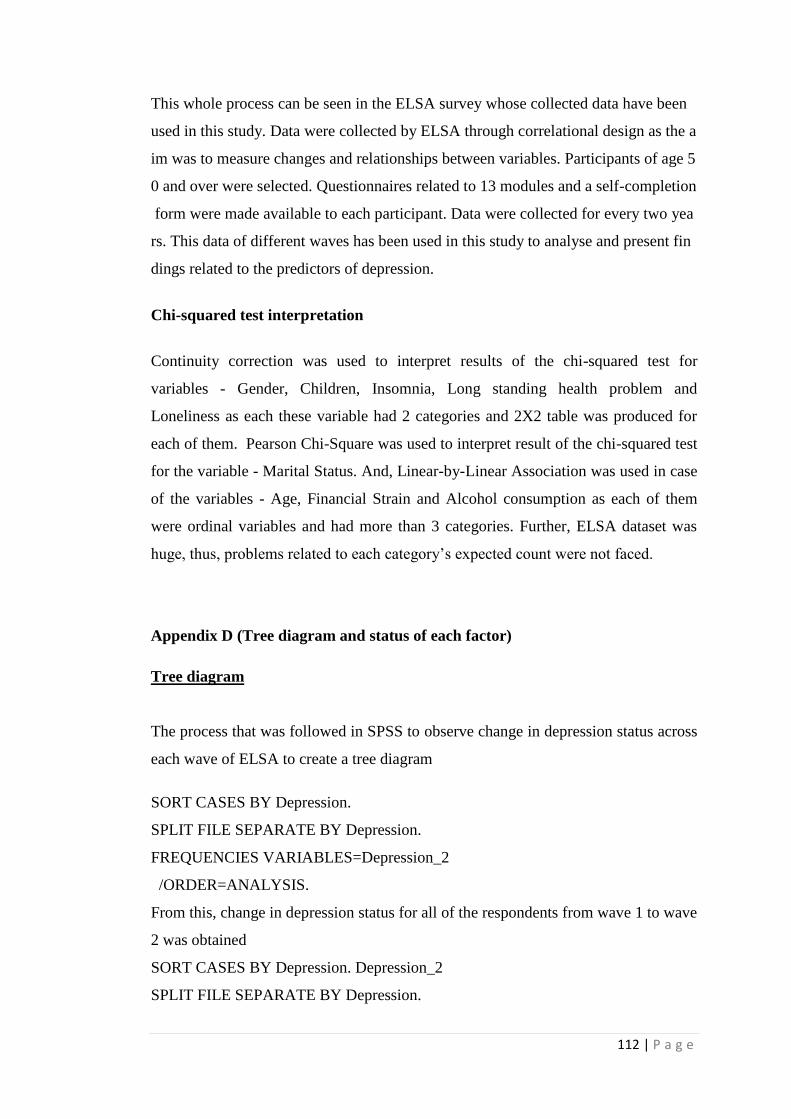
112 | P a g e
This whole process can be seen in the ELSA survey whose collected data have been
used in this study. Data were collected by ELSA through correlational design as the a
im was to measure changes and relationships between variables. Participants of age 5
0 and over were selected. Questionnaires related to 13 modules and a self-completion
form were made available to each participant. Data were collected for every two yea
rs. This data of different waves has been used in this study to analyse and present fin
dings related to the predictors of depression.
Chi-squared test interpretation
Continuity correction was used to interpret results of the chi-squared test for
variables - Gender, Children, Insomnia, Long standing health problem and
Loneliness as each these variable had 2 categories and 2X2 table was produced for
each of them. Pearson Chi-Square was used to interpret result of the chi-squared test
for the variable - Marital Status. And, Linear-by-Linear Association was used in case
of the variables - Age, Financial Strain and Alcohol consumption as each of them
were ordinal variables and had more than 3 categories. Further, ELSA dataset was
huge, thus, problems related to each category’s expected count were not faced.
Appendix D (Tree diagram and status of each factor)
Tree diagram
The process that was followed in SPSS to observe change in depression status across
each wave of ELSA to create a tree diagram
SORT CASES BY Depression.
SPLIT FILE SEPARATE BY Depression.
FREQUENCIES VARIABLES=Depression_2
/ORDER=ANALYSIS.
From this, change in depression status for all of the respondents from wave 1 to wave
2 was obtained
SORT CASES BY Depression. Depression_2
SPLIT FILE SEPARATE BY Depression.

113 | P a g e
FREQUENCIES VARIABLES=Depression_3
/ORDER=ANALYSIS.
Similarly, from wave 2 to wave 3
SORT CASES BY Depression Depression_2 Depression_3.
SPLIT FILE SEPARATE BY Depression Depression_2 Depression_3.
FREQUENCIES VARIABLES=Depression_4
/ORDER=ANALYSIS.
SORT CASES BY Depression Depression_2 Depression_3 Depression_4.
SPLIT FILE SEPARATE BY Depression Depression_2 Depression_3 Depression_4.
FREQUENCIES VARIABLES=Depression_5
/ORDER=ANALYSIS.
From wave 3 to wave 4
SORT CASES BY Depression Depression_2 Depression_3 Depression_4.
SPLIT FILE SEPARATE BY Depression Depression_2 Depression_3 Depression_4.
FREQUENCIES VARIABLES=Depression_5
/ORDER=ANALYSIS.
From wave 4 to wave 5
SORT CASES BY Depression Depression_2 Depression_3 Depression_4
Depression_5
SPLIT FILE SEPARATE BY Depression Depression_2 Depression_3 Depression_4
Depression_5
FREQUENCIES VARIABLES=Depression_6
/ORDER=ANALYSIS.
Finally, from wave 5 to 6, which identified the respondents who were depressed or
not depressed throughout all 6 waves.
How data of depressed and not depressed older adults was obtained
New variable depression_all was created
1) It was given a value 0 if (depression_wave1=0 & depression_wave1=0 &
depression_wave1=0 & depression_wave1=0 & depression_wave1=0 &
depression_wave1=0) -> this gave data for the respondents who were not depressed
throughout all 6 waves of ELSA.
114 | P a g e
2) It was given a value 1 if (depression_wave1=1 & depression_wave1=1 &
depression_wave1=1 & depression_wave1=1 & depression_wave1=1 &
depression_wave1=1) -> this gave data for the respondents who were depressed
throughout all 6 waves of ELSA.
Status for each of the factor
Data obtained for the respondents who were depressed or not depressed throughout
were further filter to obtain data only for depressed respondents. From which status
of each factor at the beginning and at the end of the ELSA survey was determined.

118 | P a g e
Access to Dissertation
A Dissertation submitted to the University may be held by the Department (or School) within
which the Dissertation was undertaken and made available for borrowing or consultation in
accordance with University Regulations.
Requests for the loan of dissertations may be received from libraries in the UK and overseas.
The Department may also receive requests from other organisations, as well as individuals.
The conservation of the original dissertation is better assured if the Department and/or
Library can fulfill such requests by sending a copy. The Department may also make your
dissertation available via its web pages.
In certain cases where confidentiality of information is concerned, if either the author or the
supervisor so requests, the Department will withhold the dissertation from loan or
consultation for the period specified below. Where no such restriction is in force, the
Department may also deposit the Dissertation in the University of Sheffield Library.
To be completed by the Author – Select (a) or (b) by placing a tick in the
appropriate box
If you are willing to give permission for the Information School to make your dissertation
available in these ways, please complete the following:
\
/
(a) Subject to the General Regulation on Intellectual Property, I, the author, agree to
this dissertation being made immediately available through the Department and/or
University Library for consultation, and for the Department and/or Library to
reproduce this dissertation in whole or part in order to supply single copies for the
purpose of research or private study
(b) Subject to the General Regulation on Intellectual Property, I, the author, request
that this dissertation be withheld from loan, consultation or reproduction for a
period of [ ] years from the date of its submission. Subsequent to this period, I
agree to this dissertation being made available through the Department and/or
University Library for consultation, and for the Department and/or Library to
reproduce this dissertation in whole or part in order to supply single copies for the
purpose of research or private study
Name Pranshu Bhasin
Departme Information School Date: 30/08/2016
119 | P a g e
Signed Pranshu Bhasin
To be completed by the Supervisor – Select (a) or (b) by placing a tick in the
appropriate box
(a) I, the supervisor, agree to this dissertation being made immediately available through
the Department and/or University Library for loan or consultation, subject to any
special restrictions (*) agreed with external organisations as part of a collaborative
project.
*Special
restrictio
ns
(b) I, the supervisor, request that this dissertation be withheld from loan, consultation or
reproduction for a period of [ ] years from the date of its submission. Subsequent
to this period, I, agree to this dissertation being made available through the
Department and/or University Library for loan or consultation, subject to any special
restrictions (*) agreed with external organisations as part of a collaborative project
Name
Departme
nt
Signed Date
THIS SHEET MUST BE SUBMITTED WITH DISSERTATIONS BY DEPARTMENTAL
REQUIREMENTS