predictors of success in high school advanced math and
TRANSCRIPT

Predictors of Success in High School Advanced Math and Science Coursework
Ryan Flurry
B.S., Missouri Western State University, 2000
M.S., Cardinal Stritch University, 2005
Submitted to the Graduate Department and Faculty of the School of Education of
Baker University in partial fulfillment of the requirements for the degree of
Doctor of Education in Educational Leadership
________________________________
Harold Frye, EdD, Major Advisor
________________________________
Jim Robins, EdD
________________________________
Christy Ziegler, PhD
Date defended: November 30, 2015
Copyright 2015 by Ryan Flurry
ii
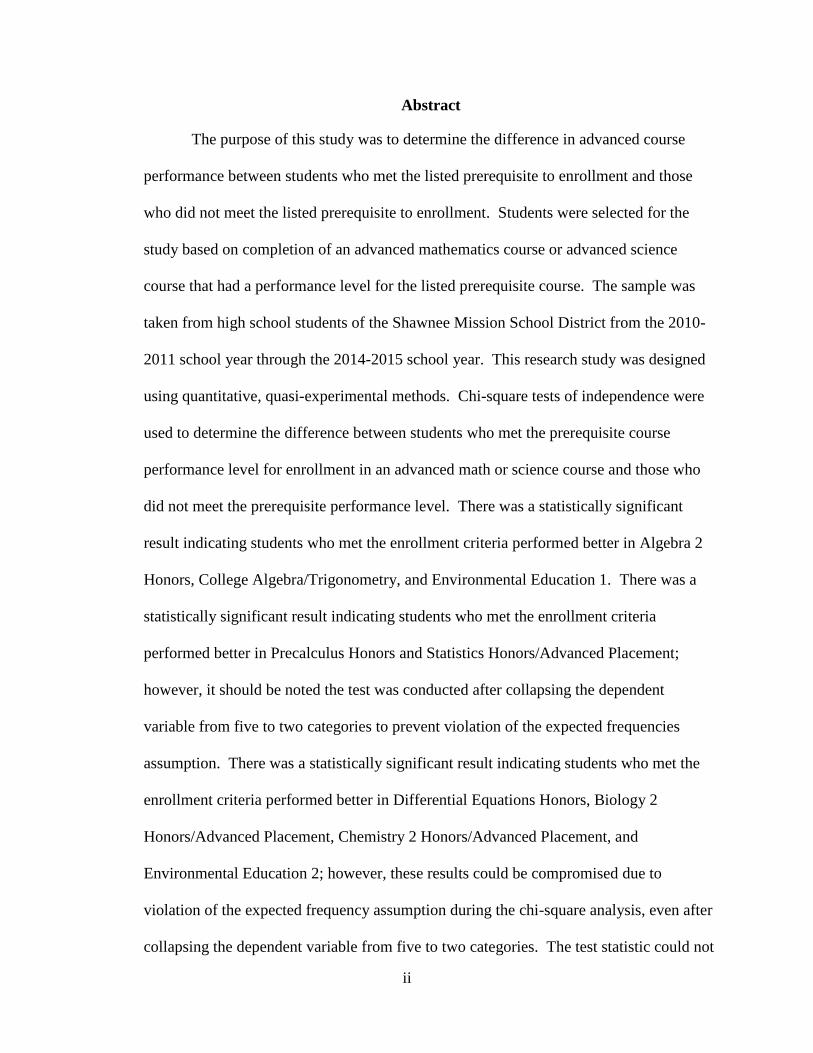
Abstract
The purpose of this study was to determine the difference in advanced course
performance between students who met the listed prerequisite to enrollment and those
who did not meet the listed prerequisite to enrollment. Students were selected for the
study based on completion of an advanced mathematics course or advanced science
course that had a performance level for the listed prerequisite course. The sample was
taken from high school students of the Shawnee Mission School District from the 2010-
2011 school year through the 2014-2015 school year. This research study was designed
using quantitative, quasi-experimental methods. Chi-square tests of independence were
used to determine the difference between students who met the prerequisite course
performance level for enrollment in an advanced math or science course and those who
did not meet the prerequisite performance level. There was a statistically significant
result indicating students who met the enrollment criteria performed better in Algebra 2
Honors, College Algebra/Trigonometry, and Environmental Education 1. There was a
statistically significant result indicating students who met the enrollment criteria
performed better in Precalculus Honors and Statistics Honors/Advanced Placement;
however, it should be noted the test was conducted after collapsing the dependent
variable from five to two categories to prevent violation of the expected frequencies
assumption. There was a statistically significant result indicating students who met the
enrollment criteria performed better in Differential Equations Honors, Biology 2
Honors/Advanced Placement, Chemistry 2 Honors/Advanced Placement, and
Environmental Education 2; however, these results could be compromised due to
violation of the expected frequency assumption during the chi-square analysis, even after
collapsing the dependent variable from five to two categories. The test statistic could not

iii
be calculated for students in Geometry Honors due to the extremely low observed
frequencies. All of the courses reviewed, except Geometry Honors, revealed students
who did not meet the enrollment criteria yet still earned a grade of A in the advanced
course. The implications of this study show it is critical for parents, students, teachers,
and school leaders to work together to provide students opportunities in advanced
coursework, whether they have met the enrollment criteria or not. Recommendations for
further research include qualitative studies related to the students not meeting criteria for
enrollment yet still being successful in the advanced courses and study of grading
practice differences between teachers and schools.

iv
Dedication
This study is dedicated to my wonderful and amazing family, Annie, Liam, and
Lily, and all those family members I have lost during my dissertation journey, including
my father, Dolph Flurry, and my grandparents, Walter and Geneva Stuber and Ruth
Flurry. Completion of this study would not have been possible without their continued
support and inspiration.

v
Acknowledgements
This study could not have been accomplished without the assistance of Dr. Daniel
Gruman, and his near magical ability to extract data from the multiple and extensive
databases of the Shawnee Mission School District.
The support and guidance of the administrative team at Shawnee Mission West
High School during the 2006-2007 school year was invaluable. Dr. Charles McLean, Dr.
Julia Crain, Richard Kramer, Keith Burgat, and Nip Sheppard shaped me, for better (or
worse), during my formative years as an educational leader. They always made time for
my questions and ponderings, no matter how busy their schedule.
I must take time to acknowledge my colleagues from Cohort 3. You have all been
amazing to work with and I learned immensely from our time together. I also must thank
the staff and faculty at Baker, especially Peg Waterman, who assisted in clarifying the
research questions and methodology.
Lastly, I would like to acknowledge Dr. Harold Frye. His continued faith in me
as his prodigal advisee allowed me to complete this program and this study. I am forever
in his debt.
vi
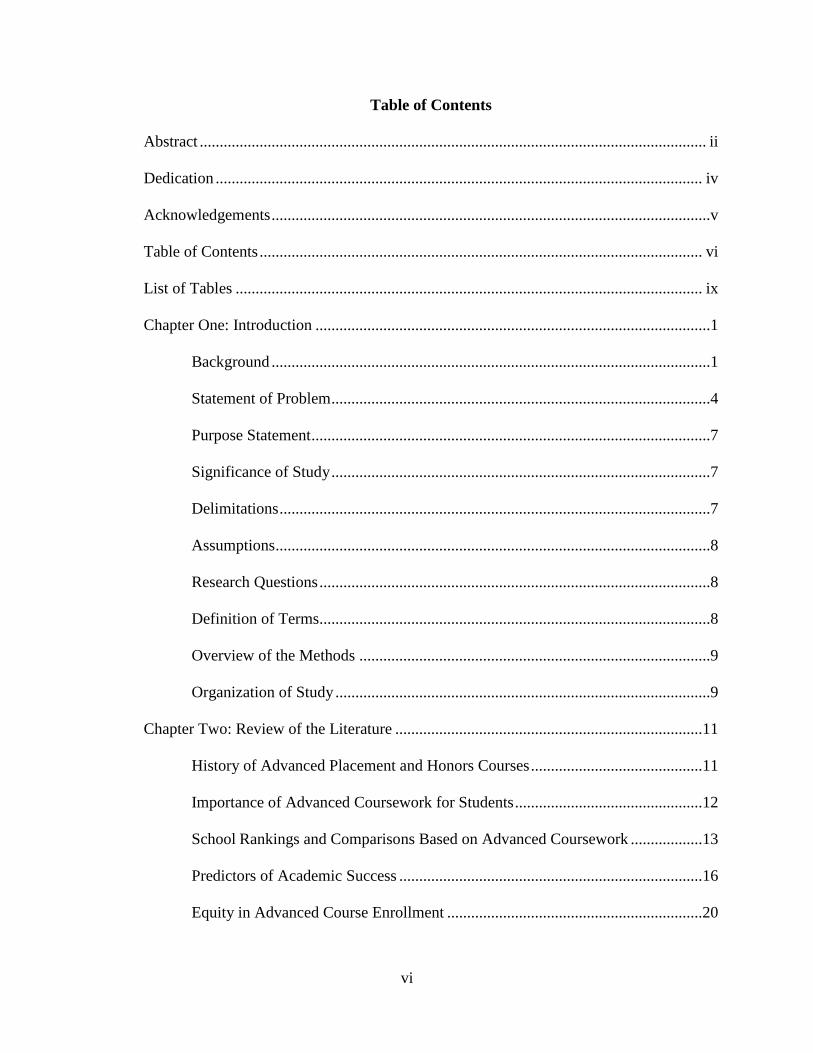
Table of Contents
Abstract ............................................................................................................................... ii
Dedication .......................................................................................................................... iv
Acknowledgements ..............................................................................................................v
Table of Contents ............................................................................................................... vi
List of Tables ..................................................................................................................... ix
Chapter One: Introduction ...................................................................................................1
Background ..............................................................................................................1
Statement of Problem ...............................................................................................4
Purpose Statement ....................................................................................................7
Significance of Study ...............................................................................................7
Delimitations ............................................................................................................7
Assumptions .............................................................................................................8
Research Questions ..................................................................................................8
Definition of Terms..................................................................................................8
Overview of the Methods ........................................................................................9
Organization of Study ..............................................................................................9
Chapter Two: Review of the Literature .............................................................................11
History of Advanced Placement and Honors Courses ...........................................11
Importance of Advanced Coursework for Students ...............................................12
School Rankings and Comparisons Based on Advanced Coursework ..................13
Predictors of Academic Success ............................................................................16
Equity in Advanced Course Enrollment ................................................................20

vii
Curriculum Tracking of Students...........................................................................23
Enrollment Guidelines Used by Schools ...............................................................24
Summary ................................................................................................................27
Chapter Three: Methods ....................................................................................................29
Research Design.....................................................................................................29
Population and Sample ..........................................................................................30
Sampling Procedures .............................................................................................30
Instrumentation ......................................................................................................30
Measurement ..............................................................................................31
Validity ......................................................................................................32
Reliability ...................................................................................................33
Data Collection Procedures ....................................................................................33
Data Analysis and Hypothesis Tests ......................................................................33
Limitations .............................................................................................................36
Summary ................................................................................................................36
Chapter Four: Results ........................................................................................................37
Descriptive Statistics ..............................................................................................37
Hypothesis Testing.................................................................................................38
Summary ................................................................................................................52
Chapter Five: Interpretation and Recommendations .........................................................53
Study Summary ......................................................................................................53
Overview of the Problem ...........................................................................53
Purpose Statement and Research Questions ..............................................54

viii
Review of the Methodology.......................................................................54
Major Findings ...........................................................................................55
Findings Related to the Literature..........................................................................57
Conclusions ............................................................................................................58
Implications for Action ..............................................................................58
Recommendations for Future Research .....................................................59
Concluding Remarks ..................................................................................60
References ..........................................................................................................................62
Appendices .........................................................................................................................68
Appendix A. Shawnee Mission School District Research Approval .....................69
Appendix B. Baker University IRB Form .............................................................71
Appendix C. Baker University IRB Approval .......................................................76
Appendix D. Additional Data Tables .....................................................................78

ix
List of Tables
Table 1. Shawnee Mission School District Demographic Makeup ....................................2
Table 2. Study Target Courses and Prerequisites ...............................................................6
Table 3. Newsweek College Readiness Index ...................................................................14
Table 4. Observed and Expected Frequencies for H1 .......................................................40
Table 5. Observed and Expected Frequencies for H2 .......................................................41
Table 6. Observed and Expected Frequencies for H3 (Collapsed Categories) .................43
Table 7. Observed and Expected Frequencies for H4 .......................................................44
Table 8. Observed and Expected Frequencies for H5 (Collapsed Categories) .................45
Table 9. Observed and Expected Frequencies for H6 (Collapsed Categories) .................46
Table 10. Observed and Expected Frequencies for H7 (Collapsed Categories) ...............48
Table 11. Observed and Expected Frequencies for H8 (Collapsed Categories) ...............49
Table 12. Observed and Expected Frequencies for H9 .....................................................50
Table 13. Observed and Expected Frequencies for H10 (Collapsed Categories) .............52
Table 14. Observed and Expected Frequencies for H3 .....................................................79
Table 15. Observed and Expected Frequencies for H5 .....................................................80
Table 16. Observed and Expected Frequencies for H6 .....................................................81
Table 17. Observed and Expected Frequencies for H7 .....................................................82
Table 18. Observed and Expected Frequencies for H8 .....................................................83
Table 19. Observed and Expected Frequencies for H10 ...................................................84
1
Chapter One
Introduction
Advanced coursework in high school is often used as admissions selection criteria
for colleges, and many students seek to enroll in advanced courses to better prepare
themselves for the rigors of college coursework. School districts across the country use
Advanced Placement enrollment numbers, the number of courses offered, and test scores
as indicators of the quality of the educational experiences offered in their schools. Media
outlets, including Newsweek, US News and World Report, and The Washington Post
utilize Advanced Placement participation to develop lists of the United States’ best
schools. Access to advanced courses, Advanced Placement or otherwise, is desirable, but
schools often limit enrollment based on a variety of criteria students must meet to enroll
in a course. Many times these limitations begin before high school, as students are
placed into ability tracks while still in middle school (Goldschmidt & Wang, 2003).
Background
The Shawnee Mission School District is located in northeast Johnson County,
Kansas, serving a 72 square mile community encompassing the communities of Fairway,
Lake Quivira, Leawood, Lenexa, Merriam, Mission, Mission Hills, Mission Woods,
Overland Park, Prairie Village, Roeland Park, Shawnee, Westwood, and Westwood Hills.
Shawnee Mission is a well-established community and has become more ethnically
diverse as expansion continues to the south and west of the Kansas City metropolitan
area. The district consists of 33 elementary schools, five middle schools, five high
schools, an alternative high school, and one technical education center. The district is
governed by a seven-member school board, five of whom are selected from each of the

2
five high school attendance areas and two selected at-large. The various municipalities
have no fiscal control over the district. The cities of Leawood, Shawnee, Overland Park,
and Lenexa are served by three other school districts, with Shawnee Mission serving the
central area of these cities and other districts serving the far southern and far western
sections of the cities.
Shawnee Mission has a predominately white student body (63.7%), with 8.9%
reporting as African American, 17.5% reporting as Hispanic, and 9.9% reporting as
Asian, American Indian or Alaskan native, native Hawaiian or other Pacific Islander, or
multiple ethnicities (KSDE, 2015).
Table 1
Shawnee Mission School District Demographic Makeup By Percent
Ethnicity/Race 2010-11 2011-12 2012-13 2013-14 2014-15
Hispanic/Latino 15.2 16.0 16.8 17.2 17.5
White 67.8 66.6 66.0 65.5 63.7
African-American 8.1 8.6 8.6 8.8 8.9
Other 9.0 8.8 8.5 8.5 9.9
Note. Compiled from KSDE district report cards, KSDE, 2015
Approximately 37.8% of the students receive federal lunch support, and over 80%
of seniors report attending a two- or four-year post-secondary education institution. The
average composite ACT score for the class of 2014 school year was 24.0. Nearly 95% of
the approximately 27,500 students attend school daily. Students have a wide array of
sports and extra-curricular activities from which to choose, with nearly 70% of students
participating in at least one after-school activity. Shawnee Mission School District
teachers are a well-educated group of professionals, with 75% having at least one post-
graduate degree.

3
Enrollment in advanced coursework is often limited to students who have
received superior grades in lower-level courses. The Shawnee Mission School District
High School Program of Studies lists 98 courses receiving honors-level credit. Twenty-
nine of these courses are in the content areas of math and science. Ten of the math and
science courses have perquisites listed with a required grade in the prerequisite course
(SMSD, 2014). The instructors of the advanced courses set the level of achievement
necessary for enrollment. Some advanced courses include a prerequisite performance
level which can be bypassed with a teacher recommendation or administrator approval.
Instructors and guidance counselors vary in the application of these pre-requisites,
leading to confusion at times.
The College Board, which administers the Advanced Placement program, has
recommended open admission policies. The Advanced Placement Equity Policy
Statement relates the importance of open enrollment policies for schools:
The College Board and the Advanced Placement Program encourage teachers,
Advanced Placement Coordinators, and school administrators to make equitable
access a guiding principle for their Advanced Placement programs. The College
Board is committed to the principle that all students deserve an opportunity to
participate in rigorous and academically challenging courses and programs. All
students who are willing to accept the challenge of a rigorous academic
curriculum should be given consideration for admission to Advanced Placement
courses. The Board encourages the elimination of barriers that restrict access to
Advanced Placement courses for students from ethnic, racial, and socioeconomic
groups that have been traditionally underrepresented in the Advanced Placement

4
Program. Schools should make every effort to ensure that their Advanced
Placement classes reflect the diversity of their student population. (College Board,
2002, p. i)
Attewell (2001) claimed schools limit advanced courses to students sure to
succeed. The reason behind these policies was reported as “school staff are convinced
their school’s reputation affects the ability of their strongest students to gain admission to
the most sought-after colleges” (p. 291). Students also “avoid courses that may lower
their GPAs” (p. 291), with math and science courses typically being the avoided courses.
Statement of the Problem
Klopfenstein (2003) found schools must “inevitably decide which students are
allowed into rigorous and fast-paced classes” (p. 42). Requiring all students to take
advanced coursework caused frustration for students and watering down of the content.
Klopfenstein reported recommendations of the College Board, which included
considering “enrollment criteria for Advanced Placement students and ensure it includes
multiple measures of achievement and motivation. Goal-oriented, motivated students
with relatively low test scores are likely to gain more from the program than unmotivated
students with high test scores” (p. 47). The use of Advanced Placement test scores as a
method to evaluate schools and teachers has caused instructors to seek out participation
from students they believe will perform well on the test. Organizations such as U.S.
News and World Report, The Washington Post, and Newsweek use Advanced Placement
participation and scores along with demographic information to rate high schools
nationally (Matthews, 2015; Morse, 2015; Newsweek, 2015).
Schools emphasize advanced coursework as a route to a college preparatory
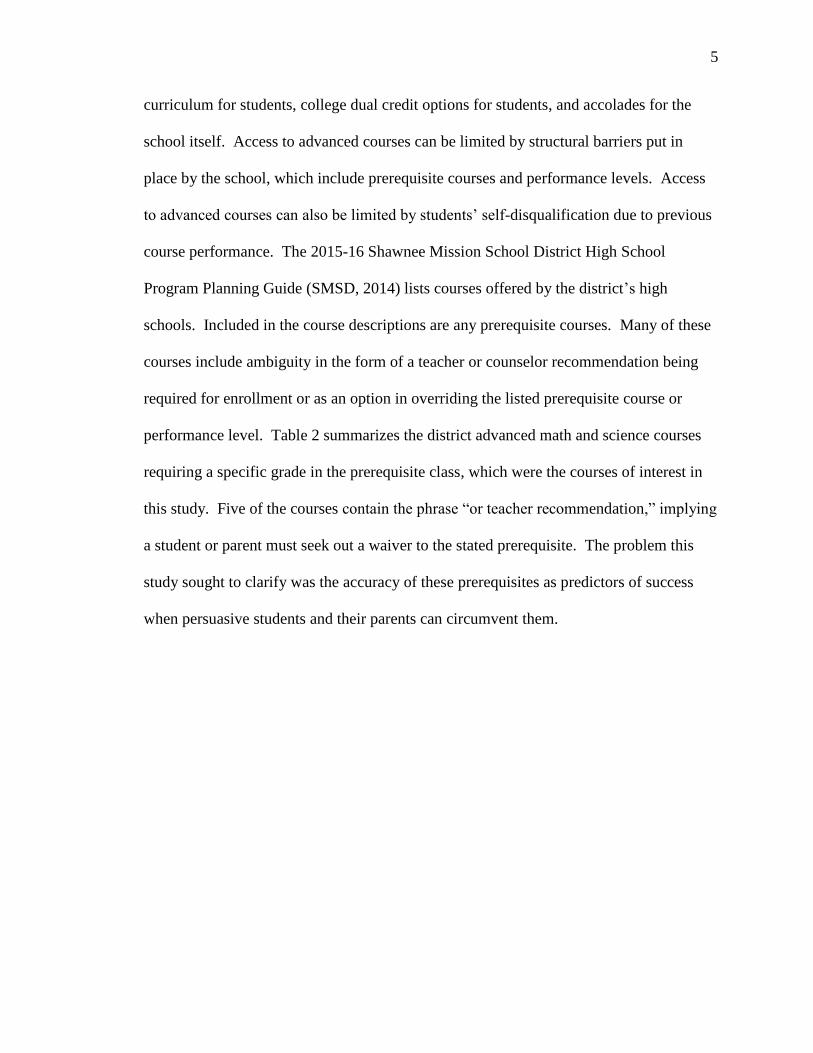
5
curriculum for students, college dual credit options for students, and accolades for the
school itself. Access to advanced courses can be limited by structural barriers put in
place by the school, which include prerequisite courses and performance levels. Access
to advanced courses can also be limited by students’ self-disqualification due to previous
course performance. The 2015-16 Shawnee Mission School District High School
Program Planning Guide (SMSD, 2014) lists courses offered by the district’s high
schools. Included in the course descriptions are any prerequisite courses. Many of these
courses include ambiguity in the form of a teacher or counselor recommendation being
required for enrollment or as an option in overriding the listed prerequisite course or
performance level. Table 2 summarizes the district advanced math and science courses
requiring a specific grade in the prerequisite class, which were the courses of interest in
this study. Five of the courses contain the phrase “or teacher recommendation,” implying
a student or parent must seek out a waiver to the stated prerequisite. The problem this
study sought to clarify was the accuracy of these prerequisites as predictors of success
when persuasive students and their parents can circumvent them.

6
Table 2
Study Target Courses and Prerequisites
Subject Area Course Name Prerequisite
Math Algebra 2 Honors
Geometry with teacher
recommendation only, or
Geometry Honors with a grade of
“B” or better or teacher
recommendation, or concurrent
enrollment in Geometry Honors
with administrator approval
Math Differential Equations
Honors
Calculus 3 Honors with a “B” or
better
Math Geometry Honors Algebra 1 with a “B” or better
and teacher recommendation
Math Precalculus/College Algebra
& Trigonometry
Algebra 2 (a grade of “B” or
better is strongly recommended)
Math Precalculus Honors Algebra 2 Honors with a “B” or
better
Math Advanced Placement
Statistics
Algebra 2 with a grade of “B” or
better
Science Biology 2 Honors/Advanced
Placement
Biology 1 with a “B” or better
and previous or concurrent
enrollment in Chemistry 1
Science Chemistry 2
Honors/Advanced Placement
Chemistry 1 with a “B” or better
and completion of Algebra 2 or
teacher approval
Science Environmental Education 1 Biology 1 with a “C” or better or
teacher recommendation
Science Environmental Education 2
Environmental Education 1 with
a “C” or better or teacher
recommendation
Note. Compiled from the High School Program Planning Guide, SMSD, 2014

7
Purpose Statement
The purpose of this study was to determine the difference in advanced course
performance between students who met the listed prerequisite to enrollment and those
who do not meet the listed prerequisite to enrollment.
Significance of the Study
The study sought to assist educational leaders in guiding both students and
teachers toward a more equitable method of determining which students are prepared for
advanced coursework. The job of an educational leader is to provide for a rigorous
curriculum that is relevant to students’ career and college goals. School leaders must be
certain students are not being left behind when it comes to accessibility to advanced
courses. There is a need to understand what role can be played in breaking down
institutional barriers and encouraging students to further their education.
Delimitations
Delimitations define the scope and boundaries of a study and are determined by
the researcher (Lunenburg & Irby, 2008). The following delimitations were defined in
this study:
1. Grade data were collected and analyzed over the course of six school years
from 2010-2011 to 2014-2015 at the six high schools of the Shawnee Mission
School District.
2. Grade data were collected and analyzed only in advanced math and science
courses with a required grade in the prerequisite course as listed in the
Shawnee Mission School District 2015-16 High School Program Planning
Guide. (SMSD, 2014)

8
Assumptions
Most Shawnee Mission School District students are strongly encouraged by
parents to attempt advanced coursework in preparation for college. Nearly 80% of
graduating seniors indicate the intent to enroll in a two- or four-year college. The results
of this study would not necessarily translate well to the inner-city schools of the adjoining
urban center. The researcher assumes other schools with similar demographics and
course requirements would show similar results.
Research Questions
The questions the researcher sought to answer are:
RQ1. To what extent is there a difference in first semester course grades in
advanced mathematics courses between students who met the listed enrollment criteria
and those who did not meet the listed enrollment criteria?
RQ2. To what extent is there a difference in first semester course grades in
advanced science courses between students who met the listed enrollment criteria and
those who did not meet the listed enrollment criteria?
Definition of Terms
Advanced courses. For the purpose of this study, advanced courses will be
defined as those courses offered at Shawnee Mission high schools requiring completion
of a prerequisite for enrollment. A list of these courses and the descriptions can be found
in Table 2. (SMSD, 2014).
Advanced Placement Program (Advanced Placement). The Advanced
Placement Program (Advanced Placement) is administered by the College Board.
Students who successfully complete the culminating Advanced Placement exam may

9
earn college credit, depending on their level of achievement (College Board, 2015).
Prerequisite Coursework. Prerequisite courses are courses required to be
completed prior to enrolling in an advanced course. Many prerequisites to enrollment
include a certain grade be earned in the prerequisite course. Advanced courses in
Shawnee Mission have prerequisites for enrollment listed in the course descriptions.
Course descriptions for both the advanced courses and their prerequisites are listed in
Table 2 (SMSD, 2014).
Overview of the Methodology
This study was designed to compare student performance in advanced courses
with their performance in the listed prerequisite course. The population for the study was
students from the six high schools of the Shawnee Mission School District enrolled in
advanced math and science courses with prerequisites to enrollment. Chi-square tests of
independence were used to compare students meeting the prerequisite performance level
with students who did not meet the prerequisite performance level for each course pair.
Details of the study methodology are reviewed in chapter three.
Organization of the Study
The purpose of this study was to determine the difference in advanced course
performance between students who met the listed prerequisite to enrollment and those
who do not meet the listed prerequisite to enrollment. This chapter has provided
background information related to the Shawnee Mission School District located in
Johnson County, Kansas. Demographic information was reviewed. This chapter has also
provided a brief overview of the current research and recommendations surrounding
accessibility to advanced coursework in high school. Chapters two, three, four and five

10
provide an overview of current research related to advanced coursework enrollment,
study methodology, study results and interpretation, and recommendations for further
research.

11
Chapter Two
Review of Literature
This chapter reviews current literature relating to access to advanced high school
courses. The information is organized into sections reviewing the history of honors
courses and the Advanced Placement program, the importance of advanced coursework,
the use of Advanced Placement and other measures to rank and compare schools,
qualitative and quantitative research regarding predicting success in advanced high
school coursework, racial equity in advanced high school coursework, tracking of
students into curriculum paths, and common practices related to advanced course
enrollment.
History of Advanced Placement and Honors Courses
The College Board (2003) described the history of the Advanced Placement
program beginning in the years after World War II. The Ford Foundation commissioned
a set of studies which concluded, “secondary schools and colleges work together to avoid
repetition in course work at the high school and college levels and to allow motivated
student to work at the height of their capabilities” (p. 1). The initial set of course
descriptions and assessments was piloted in 1952, with the College Board taking over the
program in the 1955-56 school year. The number of Advanced Placement tests
administered has grown from 162 exams in seven schools in 1954 to nearly two million
exams in 2011 (College Board, 2011).
Honors courses, curriculum tracking, and ability tracking have been a part of the
educational landscape for several decades. Honors courses, according the district being
studied, “are both accelerated and enriched” (Shawnee Mission School District, 2014).

12
These courses are designated as receiving extra grade points when determining grade
point average. Curriculum tracking was defined by Oakes (1987) as a “sequence of
courses designed for college-preparatory students, vocational students, or general track
students” (p. 131). Oakes went on to define ability grouping as more subject specific and
based on students’ aptitude or interest in a particular content area.
Importance of Advanced Coursework for Students
Adelman (1999) completed a longitudinal study of students from eighth grade to
postsecondary education, concluding “the intensity and quality of one’s secondary school
curriculum was the strongest influence not merely on college entrance, but more
importantly, on bachelor’s degree completion” (p. 19). Upper-level mathematics courses
showed the strongest effect on post-secondary success. Adelman found completing a
mathematics course above the level of Algebra 2 “more than doubles the odds that a
student who enters postsecondary education will complete a bachelor’s degree” (p18).
Adelman also found the rigor of a student’s high school curriculum outweighs the effects
of socioeconomic status on bachelor’s degree completion.
Adelman replicated his 1999 study in 2006, and reported additional
recommendations for high schools and colleges. One recommendation was to take a
critical look inside the high school classroom. “Secondary schools must provide
maximum opportunity-to-learn, by which we mean not merely course titles, but course
substance” (p. 108). Adelman also pushed for increased cooperation between high
schools and local postsecondary institutions, “indeed, the first year of postsecondary
education has to begin in high school, if not by Advanced Placement then by the growing
dual enrollment movement” (p. 108).

13
Keng and Dodd (2008) compiled data for the College Board, administer of the
Advanced Placement program, reviewing college success of students who had earned
college credit through the Advanced Placement program and their academically-similar
peers who did not earn college credit through the Advanced Placement program. College
success was measured by college credit hours completed and college grade point average.
Academically similar peers were determined through high school class rank and college
entrance exam scores. The authors found students who had earned Advanced Placement
credit “consistently outperformed others types of students in college, especially in the
related subject area” (p. 18).
School Rankings and Comparisons Based on Advanced Coursework
Many high schools are ranked within their own district and at the state and
national level. These rankings, in many cases, include some aspect of advanced
coursework consumption and performance. Many schools use these ranking as points of
pride and hang banners announcing the rankings.
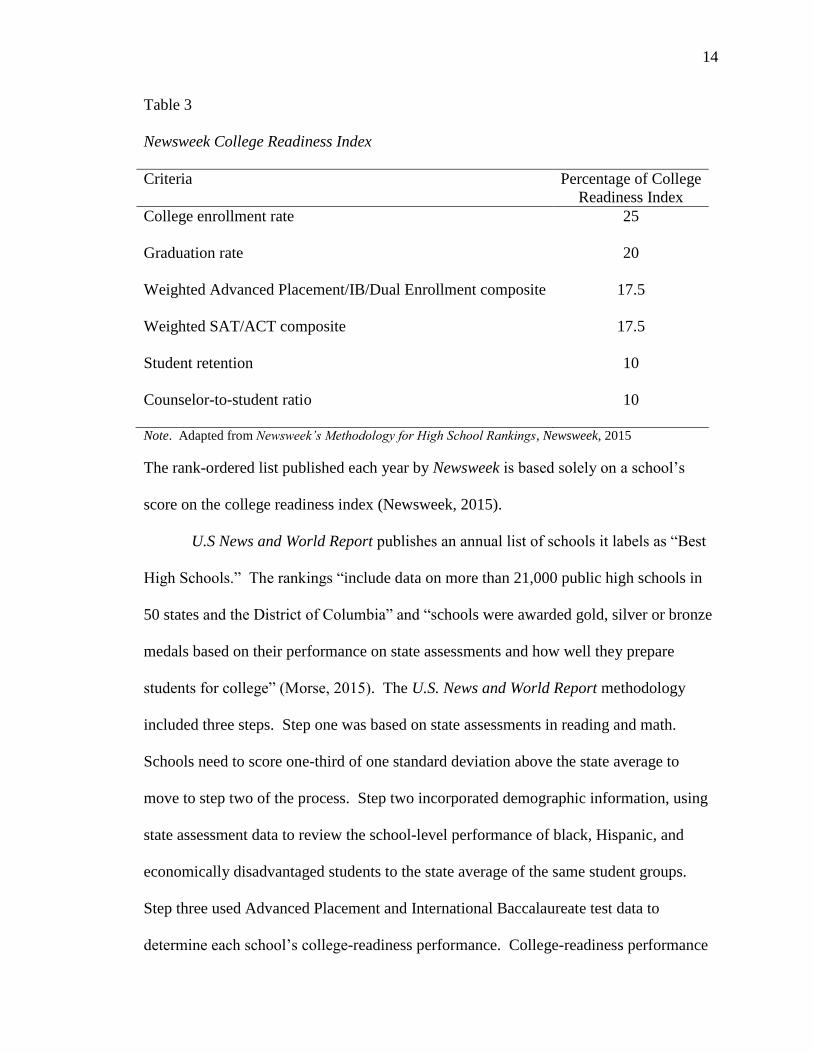
Newsweek publishes an annual list of 500 schools it labels as “America’s Top
High Schools.” The Newsweek methodology includes an analysis of state assessments in
math and reading, an internally-developed college readiness index based on six criteria,
which are detailed in Table 3, and an equity analysis based on economically
disadvantaged students.
14
Table 3
Newsweek College Readiness Index
Criteria Percentage of College
Readiness Index
College enrollment rate 25
Graduation rate 20
Weighted Advanced Placement/IB/Dual Enrollment composite 17.5
Weighted SAT/ACT composite 17.5
Student retention 10
Counselor-to-student ratio 10
Note. Adapted from Newsweek’s Methodology for High School Rankings, Newsweek, 2015
The rank-ordered list published each year by Newsweek is based solely on a school’s
score on the college readiness index (Newsweek, 2015).
U.S News and World Report publishes an annual list of schools it labels as “Best
High Schools.” The rankings “include data on more than 21,000 public high schools in
50 states and the District of Columbia” and “schools were awarded gold, silver or bronze
medals based on their performance on state assessments and how well they prepare
students for college” (Morse, 2015). The U.S. News and World Report methodology
included three steps. Step one was based on state assessments in reading and math.
Schools need to score one-third of one standard deviation above the state average to
move to step two of the process. Step two incorporated demographic information, using
state assessment data to review the school-level performance of black, Hispanic, and
economically disadvantaged students to the state average of the same student groups.
Step three used Advanced Placement and International Baccalaureate test data to
determine each school’s college-readiness performance. College-readiness performance

15
was gauged by the ratio of students taking an Advanced Placement or IB examination to
the number of graduating seniors. The final step included student performance on
Advanced Placement and IB examinations, calculating a ratio of the number of students
receiving a three or higher on an Advanced Placement examination or a four or higher on
an IB examination to the number of graduating seniors (Morse, 2015).
The Washington Post publishes an annual list of “America’s Most Challenging
High Schools.” This list is created from an internally-developed challenge index, which
is the ratio of students taking an Advanced Placement, International Baccalaureate, or
International Certificate of Education examination to the number of graduating seniors
(Matthews, 2015). Schools achieving a challenge index of 1.0 or greater are placed on
the “Most Challenging High Schools” list in rank order from largest ratio to smallest.
The Washington Post does not include performance on the exams as part of the
methodology. Matthews (2015) explains he found “many high schools kept
(performance) artificially high by allowing only top students to take the courses.”
The Shawnee Mission School District publishes an annual report of students
pursuing college credit through advanced coursework taken in high school. This report
includes participation and performance on Advanced Placement and International
Baccalaureate examinations, along with concurrent enrollment programs offered through
the local community college. Each of the five Shawnee Mission School District high
schools is identified with the participation and performance, and the data is reported
publicly (SMSD, 2015a).

16
Predictors of Academic Success
Numerous studies have been completed on the variables contributing to students’
academic success in mathematics courses. Islam and Al-Ghassani (2015) reviewed the
college math success of 615 students and compared it with their gender, overall high
school performance, and high school math performance using multiple regression
analyses. The authors found “the correlation coefficients between overall high school
score and GPA in Calculus I, and the high school math score and GPA in calculus were
very close (r = 0.506 and r = 0.501, respectively)” (p. 74). The highest correlation was
found when combining overall high school score with math score (r = 0.635). Strayhorn
(2010) studied the influence of social, family, and school-related variables on the math
achievement of African-American high school students. The author found college-
education parents, parents involved in the school, and teachers who praise students for
effort had positive effects on math achievement scores. Strayhorn also suggested
“cultural capital (e.g., parent’s level of education, strong support at home) might yield the
academic capital (e.g., parental involvement, time spent studying) necessary to succeed in
school” (p. 191).
The positive effects of adult support of students have been documented at length.
Chen (2005) studied adolescent students finding “the adolescents’ self-perceived
academic support from parents and especially teachers are powerful predictors or their
own perceived levels of academic engagement and achievement” (p. 114). Tucker et al.
(2002) studied predictors of academic engagement of low-income African American
students, reviewing both teacher behaviors and student behaviors. Academic engagement
was measured using a self-rating questionnaire of the students covering emotional

17
engagement, the centrality of school, effort, attention, and going above and beyond the
call. The authors found teacher involvement, defined as a “demonstration of caring and
interest in the child” (p. 479), had the strongest positive effect on student engagement of
all factors reviewed. Tucker et al. also emphasized the importance of teacher classroom
structure, indicating “teachers can promote positive student self-perceptions by providing
a positive, caring and consistent classroom structure, by allowing students to make
choices, and by helping them see connections between their classroom work and other
aspects of their lives” (p.486). Ferguson (2003) echoed these findings and attributed
student performance to teacher expectations of students. A more recent study by
Archambault et al. (2012) examined teacher expectations of students and sense of self-
efficacy on student mathematics achievement, reviewing 79 teachers and 1,364 students,
specifically focusing on low-socioeconomic status students. Student mathematics
achievement was measured by class grades (as a percent). Teacher expectations of
students and self-efficacy were assessed using a survey instrument. Similar to the studies
above, they reported “the more teachers maintain high expectations and the more
efficacious they feel in helping their students succeed, the more students’ achievement
increase over the year” (p. 324).
Student participation in extracurricular activities and its relationship to student
achievement has also been extensively studied. Fredricks and Eccles (2010) examined
the relationship between organized activity participation and developmental outcomes in
high school juniors. The study followed the students into their first year after high
school. The authors found that “participation in a greater number of organized activities
is generally predictive of positive development” (p. 327). They did report a caveat on
18
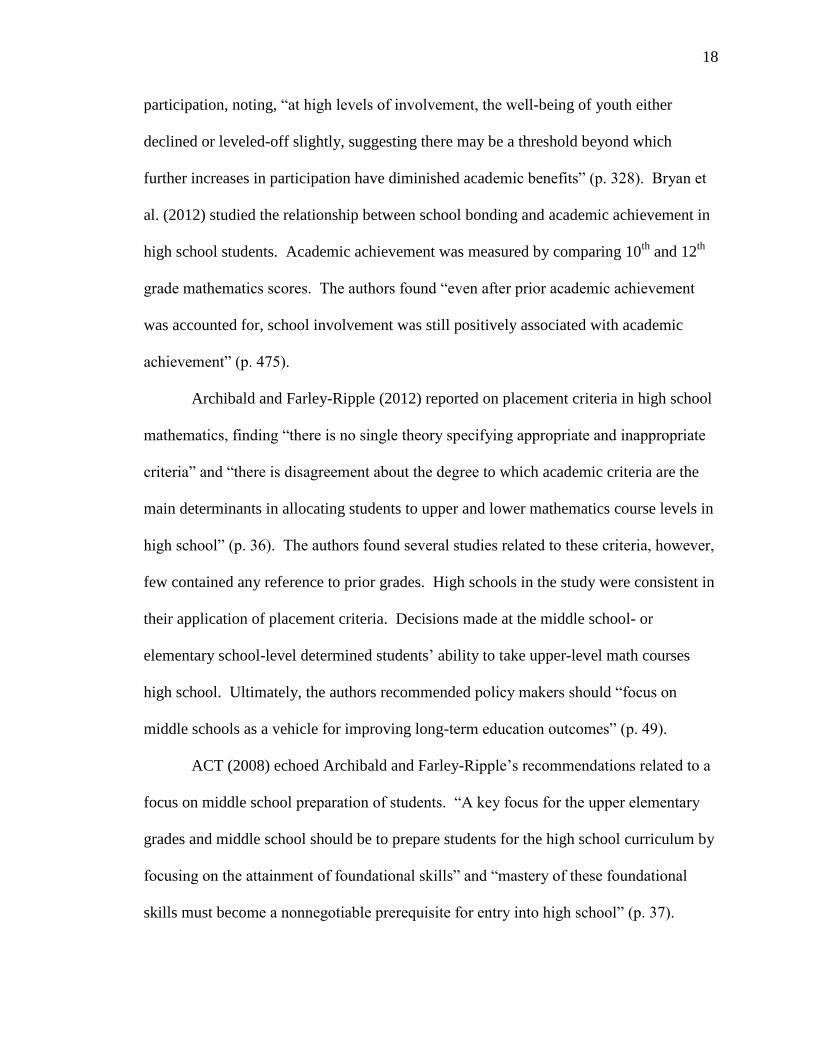
participation, noting, “at high levels of involvement, the well-being of youth either
declined or leveled-off slightly, suggesting there may be a threshold beyond which
further increases in participation have diminished academic benefits” (p. 328). Bryan et
al. (2012) studied the relationship between school bonding and academic achievement in
high school students. Academic achievement was measured by comparing 10th
and 12th
grade mathematics scores. The authors found “even after prior academic achievement
was accounted for, school involvement was still positively associated with academic
achievement” (p. 475).
Archibald and Farley-Ripple (2012) reported on placement criteria in high school
mathematics, finding “there is no single theory specifying appropriate and inappropriate
criteria” and “there is disagreement about the degree to which academic criteria are the
main determinants in allocating students to upper and lower mathematics course levels in
high school” (p. 36). The authors found several studies related to these criteria, however,
few contained any reference to prior grades. High schools in the study were consistent in
their application of placement criteria. Decisions made at the middle school- or
elementary school-level determined students’ ability to take upper-level math courses
high school. Ultimately, the authors recommended policy makers should “focus on
middle schools as a vehicle for improving long-term education outcomes” (p. 49).
ACT (2008) echoed Archibald and Farley-Ripple’s recommendations related to a
focus on middle school preparation of students. “A key focus for the upper elementary
grades and middle school should be to prepare students for the high school curriculum by
focusing on the attainment of foundational skills” and “mastery of these foundational
skills must become a nonnegotiable prerequisite for entry into high school” (p. 37).

19
ACT’s data suggested early intervention is key. Students entering high school without
these foundational skills will not be college- or career-ready upon high school graduation.
Palin (2001) examined Advanced Placement U.S. History scores at a private high
school in Florida in relationship to standardized test scores and other academic measures.
Seventy-three students took part in the three-year study, which reviewed PSAT scores,
student GPA, and anticipated college majors. The results were mixed, as some students
who scored in the 50th percentile on the PSAT out-performed those who scored higher on
the PSAT. GPA was a more determining factor in Advanced Placement test
performance. Students scoring 3, 4 or 5 on the Advanced Placement test had a GPA 0.7
higher than those scoring 1 or 2. Anticipated college major, as listed on PSAT
registration, played a large role in predicting success on the Advanced Placement test.
Fifty percent of the students scoring a 5 on the test were planning on pursuing social
science majors in college. Eighty-six percent of those who scored 1 or 2 expressed no
interest in pursuing the social sciences.
Camara and Echternacht (2000) reviewed SAT college entrance examination
scores and high school grades in comparison with college success, which was measured
by freshman year grade point average. Freshman year grade point average was used
assuming most college freshmen take similar basic courses and freshman grade point
averages correlated well with final cumulative grade point averages. The study authors
reported “high school grades typically are slightly better predictors of achievement” than
SAT scores (p. 9).
Potolsky, Cohen, and Saylor (2003) looked at the current nursing shortage,
focusing on means of retaining first-year nursing students in baccalaureate programs.

20
Tutoring programs and prerequisite grades were examined as a predictor of success in
nursing school. The authors found the tutoring program did not show a significant link to
academic performance. Prerequisite science course grades, however, emerged as a
reliable indicator of achievement in the small sample of 37 students. They recommended
using more stringent entry requirements to ensure success of admitted students.
Equity in Advanced Course Enrollment
The College Board, which administers the Advanced Placement program, is
committed to all students having access to the rigorous curriculum provided by Advanced
Placement courses. According to the College Board, all students who show interest and
are willing to accept the challenge of Advanced Placement courses should be given
consideration for admission to courses. The College Board has recommended the
elimination of barriers that restrict enrollment for members of groups that have been
historically underrepresented in the Advanced Placement program (College Board, 2002).
DiMartino and Miles (2004) viewed heterogeneous groups as key to student
success. “Whenever possible, students should spend significant parts of their school day
in heterogeneous groups so that they learn to see themselves as important members of
this diverse group” (p. 47). They indicated that to promote student achievement a school
must also promote equity. “Strategies that perpetuate inequity promote disillusionment,
distrust, and disengagement” (p. 48).
Goldschmidt and Wang (2003) found a significant racial gap in course
consumption at the 11th
grade level when compared with 8th
grade enrollment. Caucasian
and Asian students were well represented, but African American and Hispanic students
are underrepresented. They found a small gender gap in enrollment that carried over

21
from middle school into high school. These inequities were amplified by tracking
students into low-, middle-, and high-ability groups. The achievement gap was not
explained away by prior achievement alone; other factors influenced the students’ high
school achievement.
Finn, Gerber, and Wang (2002) reviewed practices that encouraged or
discouraged advanced math course enrollment. The authors used data from 305 public
high schools to identify courses taken, determine the correlation between course offerings
and school demographics, and determine the impact of course offerings and graduation
requirements on courses actually taken by students. They found there was virtually no
relationship between course offerings and school demographics. There was some
significance to the poverty level of the school and years of math taken by students.
Graduation requirements were similar in most low- and high-poverty schools; they
concluded the discrepancy must be in how students are selected or assigned to particular
courses. More rigorous graduation standards at some schools translated into an increased
enrollment in advanced courses by all subgroups of students.
Solorzano and Ornelas (2004) examined the access and availability of Advanced
Placement courses for Latino and African American students. The authors focused on
three areas: school practices that maintain discrimination in Advanced Placement access,
student and parent response to these practices, and school reforms that can help eliminate
these practices. They began by looking at recent Supreme Court cases dealing with using
race in the college admissions process and the role of Advanced Placement courses in the
admissions and placement process. They went on to examine several high schools in the
Los Angeles area, both suburban and inner city, for racial inequity in Advanced

22
Placement enrollment. In most cases, white students made up a substantially larger
percentage of Advanced Placement enrollment when compared with the total school
population. Recommendations to alleviate these inequities in high schools included
increased access to qualified teachers, eliminating tracking, intensive academic support,
and creating a college-bound culture. Recommendations to improve access to college
admission for minority students included using broader factors like advanced course
GPA, eliminating Advanced Placement courses from the criteria and admission officers
pressuring high schools to offer a rigorous curriculum for all students.
Ndura, Robinson and Ochs (2003) examined the Advanced Placement enrollment
statistics for minority students and factors affecting their enrollment in courses. The
study was performed in a district of eight high schools. The authors first reviewed the
historical background of the need for a more rigorous curriculum in high schools. Using
data from 2001, they reported approximately 70% of U.S. high school graduates enroll in
some form of post-secondary program and only 50% of students enrolling in a four-year
college graduate with a degree. The primary reason for lack of college completion was
students not being prepared by high schools for the rigors of college coursework.
Minority groups showed disproportionately low enrollment in Advanced Placement
courses, with the exception of Asian/Pacific Islander students. Parents and teachers were
determined to be the most influential people when students make decisions on course
enrollment. The study also looked at household income related to Advanced Placement
enrollment and found there is a positive relationship between the two. Hispanic and
Native American groups had the lowest percentage of parents with professional or
highly-skilled jobs, and also had the lowest Advanced Placement enrollment.
23
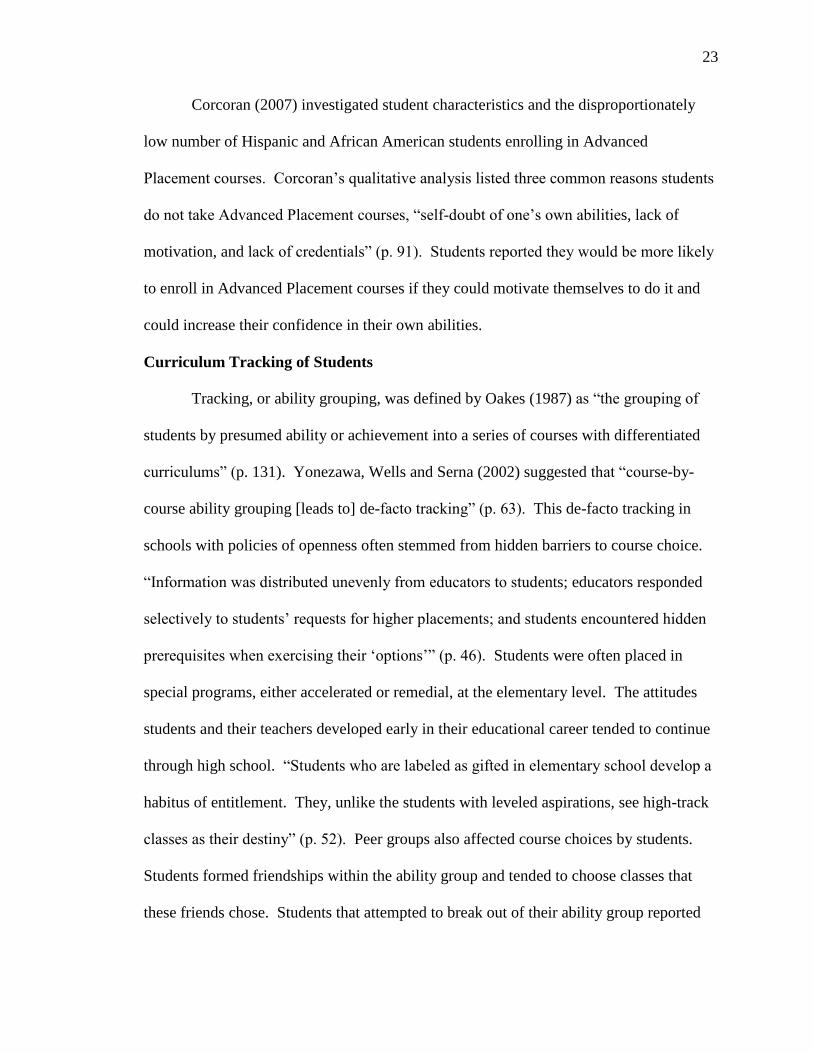
Corcoran (2007) investigated student characteristics and the disproportionately
low number of Hispanic and African American students enrolling in Advanced
Placement courses. Corcoran’s qualitative analysis listed three common reasons students
do not take Advanced Placement courses, “self-doubt of one’s own abilities, lack of
motivation, and lack of credentials” (p. 91). Students reported they would be more likely
to enroll in Advanced Placement courses if they could motivate themselves to do it and
could increase their confidence in their own abilities.
Curriculum Tracking of Students
Tracking, or ability grouping, was defined by Oakes (1987) as “the grouping of
students by presumed ability or achievement into a series of courses with differentiated
curriculums” (p. 131). Yonezawa, Wells and Serna (2002) suggested that “course-by-
course ability grouping [leads to] de-facto tracking” (p. 63). This de-facto tracking in
schools with policies of openness often stemmed from hidden barriers to course choice.
“Information was distributed unevenly from educators to students; educators responded
selectively to students’ requests for higher placements; and students encountered hidden
prerequisites when exercising their ‘options’” (p. 46). Students were often placed in
special programs, either accelerated or remedial, at the elementary level. The attitudes
students and their teachers developed early in their educational career tended to continue
through high school. “Students who are labeled as gifted in elementary school develop a
habitus of entitlement. They, unlike the students with leveled aspirations, see high-track
classes as their destiny” (p. 52). Peer groups also affected course choices by students.
Students formed friendships within the ability group and tended to choose classes that
these friends chose. Students that attempted to break out of their ability group reported
24
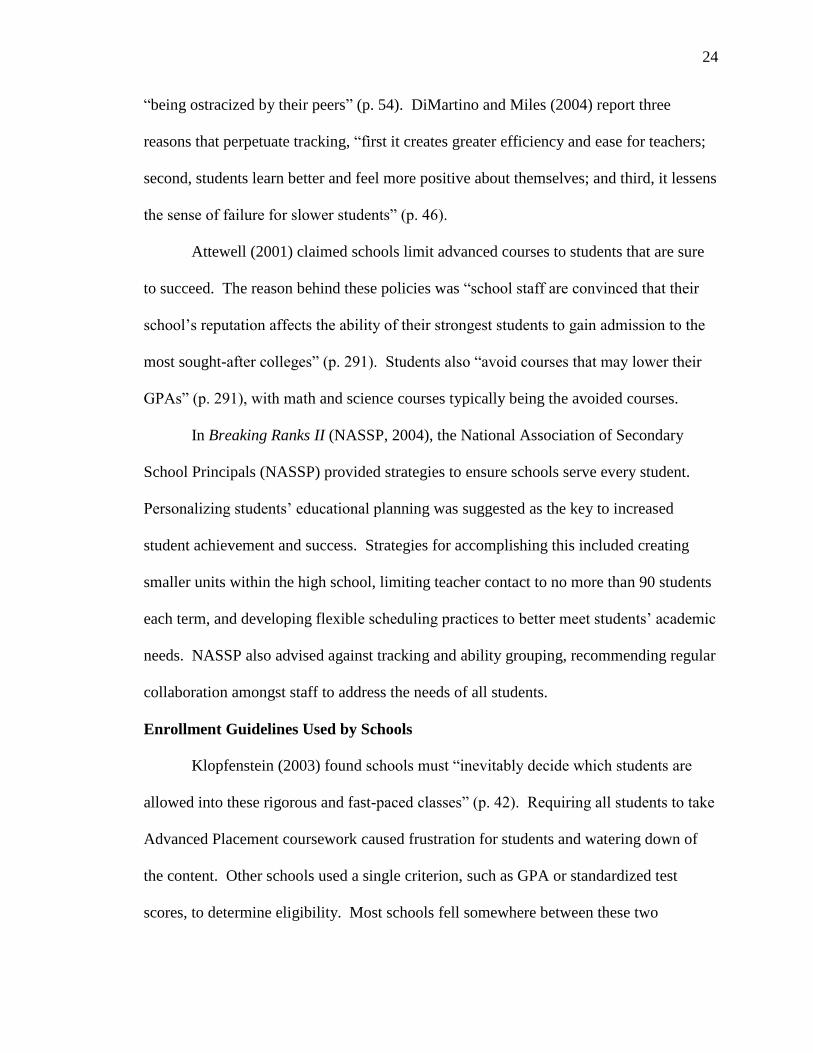
“being ostracized by their peers” (p. 54). DiMartino and Miles (2004) report three
reasons that perpetuate tracking, “first it creates greater efficiency and ease for teachers;
second, students learn better and feel more positive about themselves; and third, it lessens
the sense of failure for slower students” (p. 46).
Attewell (2001) claimed schools limit advanced courses to students that are sure
to succeed. The reason behind these policies was “school staff are convinced that their
school’s reputation affects the ability of their strongest students to gain admission to the
most sought-after colleges” (p. 291). Students also “avoid courses that may lower their
GPAs” (p. 291), with math and science courses typically being the avoided courses.
In Breaking Ranks II (NASSP, 2004), the National Association of Secondary
School Principals (NASSP) provided strategies to ensure schools serve every student.
Personalizing students’ educational planning was suggested as the key to increased
student achievement and success. Strategies for accomplishing this included creating
smaller units within the high school, limiting teacher contact to no more than 90 students
each term, and developing flexible scheduling practices to better meet students’ academic
needs. NASSP also advised against tracking and ability grouping, recommending regular
collaboration amongst staff to address the needs of all students.
Enrollment Guidelines Used by Schools
Klopfenstein (2003) found schools must “inevitably decide which students are
allowed into these rigorous and fast-paced classes” (p. 42). Requiring all students to take
Advanced Placement coursework caused frustration for students and watering down of
the content. Other schools used a single criterion, such as GPA or standardized test
scores, to determine eligibility. Most schools fell somewhere between these two

25
extremes. Klopfenstein (2003) reported the College Board, which administers the
Advanced Placement program, believes schools should “open their programs to any
student willing to take on the challenge” (p. 43). Recommendations included considering
“enrollment criteria for Advanced Placement students and ensure that it includes multiple
measures of achievement and motivation. Goal-oriented, motivated students with
relatively low test scores are likely to gain more from the program than unmotivated
students with high test scores” (p. 47).
Potter and Morgan (2000) described a school that implemented several steps to
improve both enrollment and success in Advanced Placement courses. Beginning in
middle school there was intense counseling for students and parents on the need to take
rigorous courses. A tutoring program was available for all students in the high school,
regardless of the courses they are enrolled in. Curriculum between courses was aligned
and scheduling set up to provide a seamless flow from class to class. Weekly progress
was reported back to parents and students in Advanced Placement courses. All students
were advised on the expectations of Advanced Placement courses and given a ten-day
window in which to drop the course. A dedicated testing coordinator freed up teachers,
administrators and counselors to focus on students. Special PSAT/ACT preparation was
included in all English and math courses. The district paid for all Advanced Placement
training. The results were impressive. Out of nearly 1100 Advanced Placement tests
taken by 900 students, 70% score 3 or above (Potter & Morgan, 2000).
Adlai Stevenson High School is a comprehensive high school in suburban
Chicago, Illinois, with an enrollment of over 4,000 students. The school has been
repeatedly awarded for excellence in education by the United States Department of
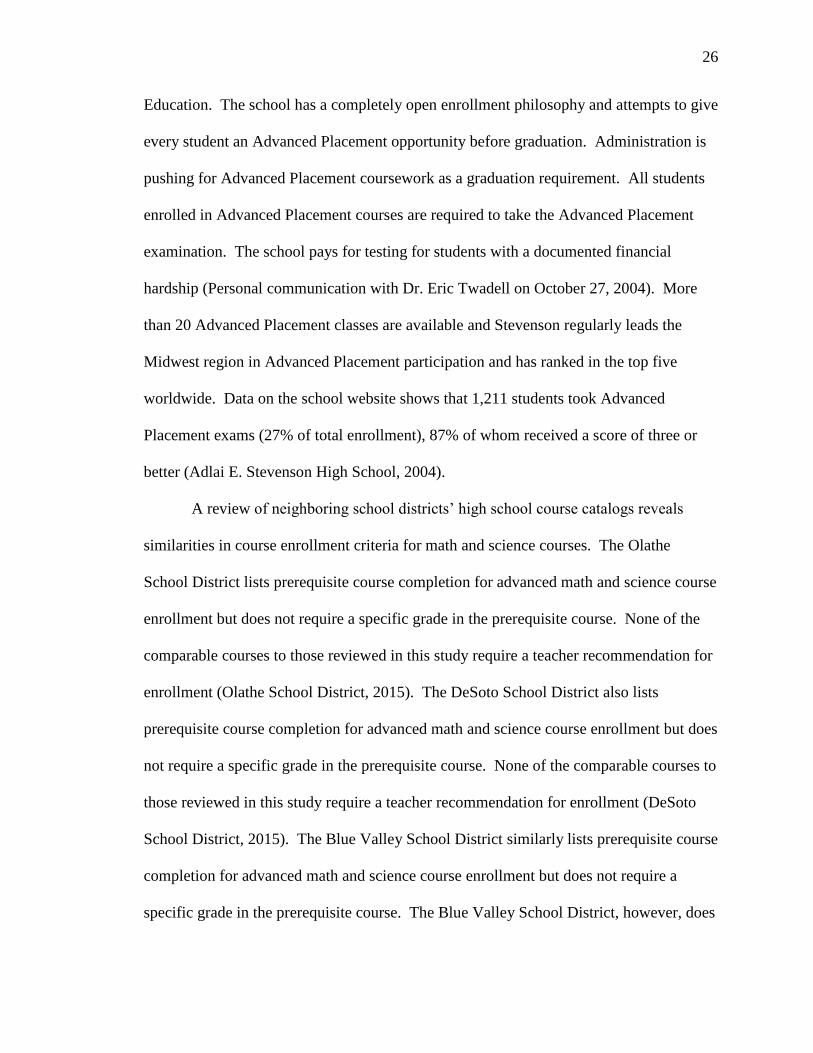
26
Education. The school has a completely open enrollment philosophy and attempts to give
every student an Advanced Placement opportunity before graduation. Administration is
pushing for Advanced Placement coursework as a graduation requirement. All students
enrolled in Advanced Placement courses are required to take the Advanced Placement
examination. The school pays for testing for students with a documented financial
hardship (Personal communication with Dr. Eric Twadell on October 27, 2004). More
than 20 Advanced Placement classes are available and Stevenson regularly leads the
Midwest region in Advanced Placement participation and has ranked in the top five
worldwide. Data on the school website shows that 1,211 students took Advanced
Placement exams (27% of total enrollment), 87% of whom received a score of three or
better (Adlai E. Stevenson High School, 2004).
A review of neighboring school districts’ high school course catalogs reveals
similarities in course enrollment criteria for math and science courses. The Olathe
School District lists prerequisite course completion for advanced math and science course
enrollment but does not require a specific grade in the prerequisite course. None of the
comparable courses to those reviewed in this study require a teacher recommendation for
enrollment (Olathe School District, 2015). The DeSoto School District also lists
prerequisite course completion for advanced math and science course enrollment but does
not require a specific grade in the prerequisite course. None of the comparable courses to
those reviewed in this study require a teacher recommendation for enrollment (DeSoto
School District, 2015). The Blue Valley School District similarly lists prerequisite course
completion for advanced math and science course enrollment but does not require a
specific grade in the prerequisite course. The Blue Valley School District, however, does
27
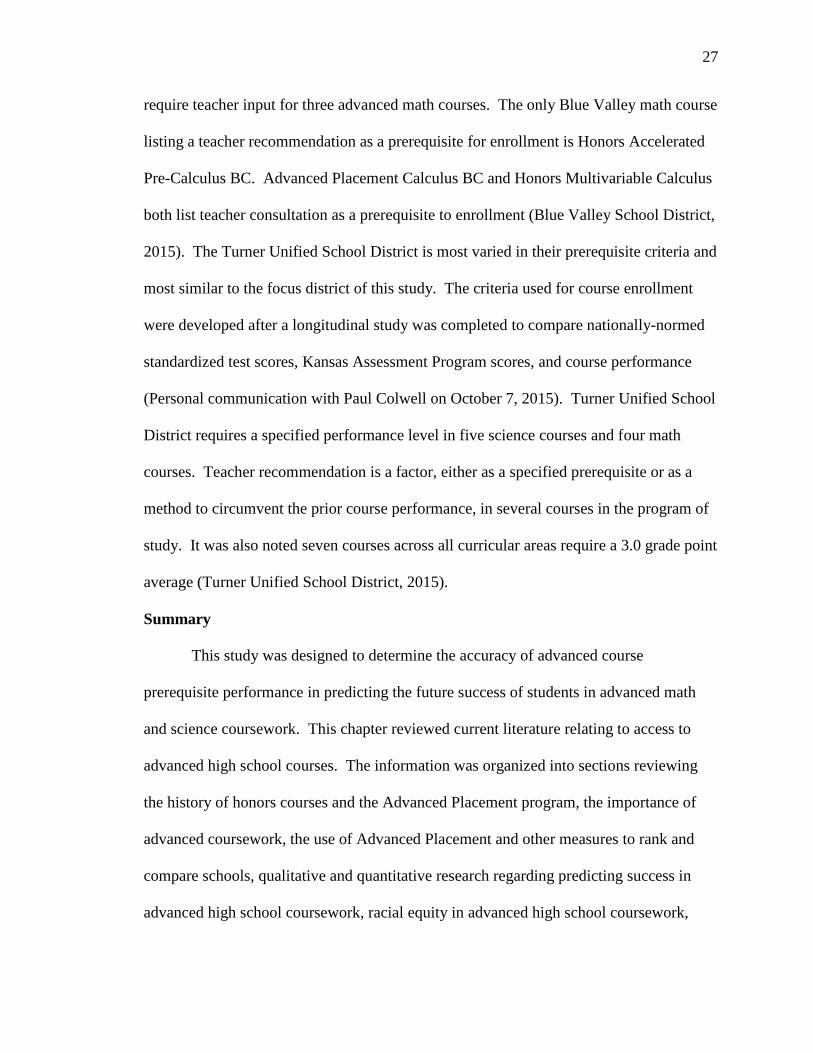
require teacher input for three advanced math courses. The only Blue Valley math course
listing a teacher recommendation as a prerequisite for enrollment is Honors Accelerated
Pre-Calculus BC. Advanced Placement Calculus BC and Honors Multivariable Calculus
both list teacher consultation as a prerequisite to enrollment (Blue Valley School District,
2015). The Turner Unified School District is most varied in their prerequisite criteria and
most similar to the focus district of this study. The criteria used for course enrollment
were developed after a longitudinal study was completed to compare nationally-normed
standardized test scores, Kansas Assessment Program scores, and course performance
(Personal communication with Paul Colwell on October 7, 2015). Turner Unified School
District requires a specified performance level in five science courses and four math
courses. Teacher recommendation is a factor, either as a specified prerequisite or as a
method to circumvent the prior course performance, in several courses in the program of
study. It was also noted seven courses across all curricular areas require a 3.0 grade point
average (Turner Unified School District, 2015).
Summary
This study was designed to determine the accuracy of advanced course
prerequisite performance in predicting the future success of students in advanced math
and science coursework. This chapter reviewed current literature relating to access to
advanced high school courses. The information was organized into sections reviewing
the history of honors courses and the Advanced Placement program, the importance of
advanced coursework, the use of Advanced Placement and other measures to rank and
compare schools, qualitative and quantitative research regarding predicting success in
advanced high school coursework, racial equity in advanced high school coursework,

28
tracking of students into curriculum paths, and common practices related to advanced
course enrollment. Keys points are summarized here. Klopfenstein (2003)
recommended considering multiple measures when reviewing student enrollment in
advanced coursework. “Goal-oriented, motivated students with relatively low test scores
are likely to gain more from the program than unmotivated students with high test scores”
(p. 47). Palin (2001) demonstrated GPA had a greater effect on predicting success on
Advanced Placement tests than PSAT scores. Yonezawa, Wells and Serna (2002)
reported ability-grouping as pervasive even as early as elementary school, and that many
high schools with open enrollment policies for advanced coursework maintain hidden
barriers. Schools with successful open enrollment policies for advanced courses focused
their resources on teacher training, vertical curriculum alignment, and tutoring programs.
Chapters three, four, and five provide an overview of the study methodology, study
results and interpretation, and recommendations for further research.

29
Chapter Three
Methods
The purpose of this study was to determine the difference in advanced math and
science course performance between students who met the listed prerequisite to
enrollment and those who did not meet the listed prerequisite to enrollment. The purpose
of this chapter is to review the research design, population and sample, sampling
procedures, instrumentation, measurement, validity and reliability, data collection
procedures, data analysis and hypothesis testing, and limitations of the study.
Research Design
This research study was designed using quantitative, quasi-experimental methods.
The independent variable was performance in prerequisite courses, categorized into those
who met the prerequisite course performance level for enrollment in an advanced math or
science course and those who did not meet the prerequisite performance level. The
dependent variable in this study was performance in high school advanced math and
science courses. The quantitative method of chi-square tests of independence was used
for each course pairing to determine the difference between students who met the
prerequisite course performance level for enrollment in an advanced math or science
course and those who did not meet the prerequisite performance level. Chi-square testing
was used due to the categorical nature of semester course grades. Chi-square testing
“compares the proportions actually observed in a study to the proportions expected by
chance, to see if they are significantly different” (Lunenburg & Irby, 2008, p. 78).
30
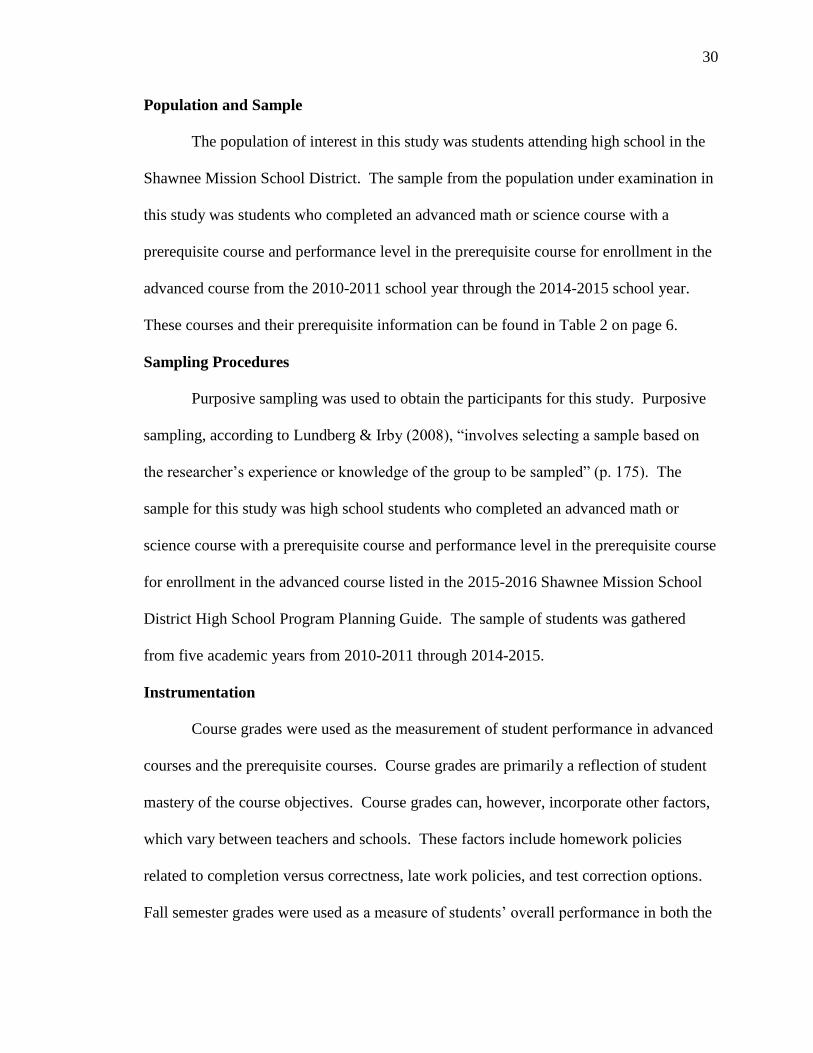
Population and Sample
The population of interest in this study was students attending high school in the
Shawnee Mission School District. The sample from the population under examination in
this study was students who completed an advanced math or science course with a
prerequisite course and performance level in the prerequisite course for enrollment in the
advanced course from the 2010-2011 school year through the 2014-2015 school year.
These courses and their prerequisite information can be found in Table 2 on page 6.
Sampling Procedures
Purposive sampling was used to obtain the participants for this study. Purposive
sampling, according to Lundberg & Irby (2008), “involves selecting a sample based on
the researcher’s experience or knowledge of the group to be sampled” (p. 175). The
sample for this study was high school students who completed an advanced math or
science course with a prerequisite course and performance level in the prerequisite course
for enrollment in the advanced course listed in the 2015-2016 Shawnee Mission School
District High School Program Planning Guide. The sample of students was gathered
from five academic years from 2010-2011 through 2014-2015.
Instrumentation
Course grades were used as the measurement of student performance in advanced
courses and the prerequisite courses. Course grades are primarily a reflection of student
mastery of the course objectives. Course grades can, however, incorporate other factors,
which vary between teachers and schools. These factors include homework policies
related to completion versus correctness, late work policies, and test correction options.
Fall semester grades were used as a measure of students’ overall performance in both the
31
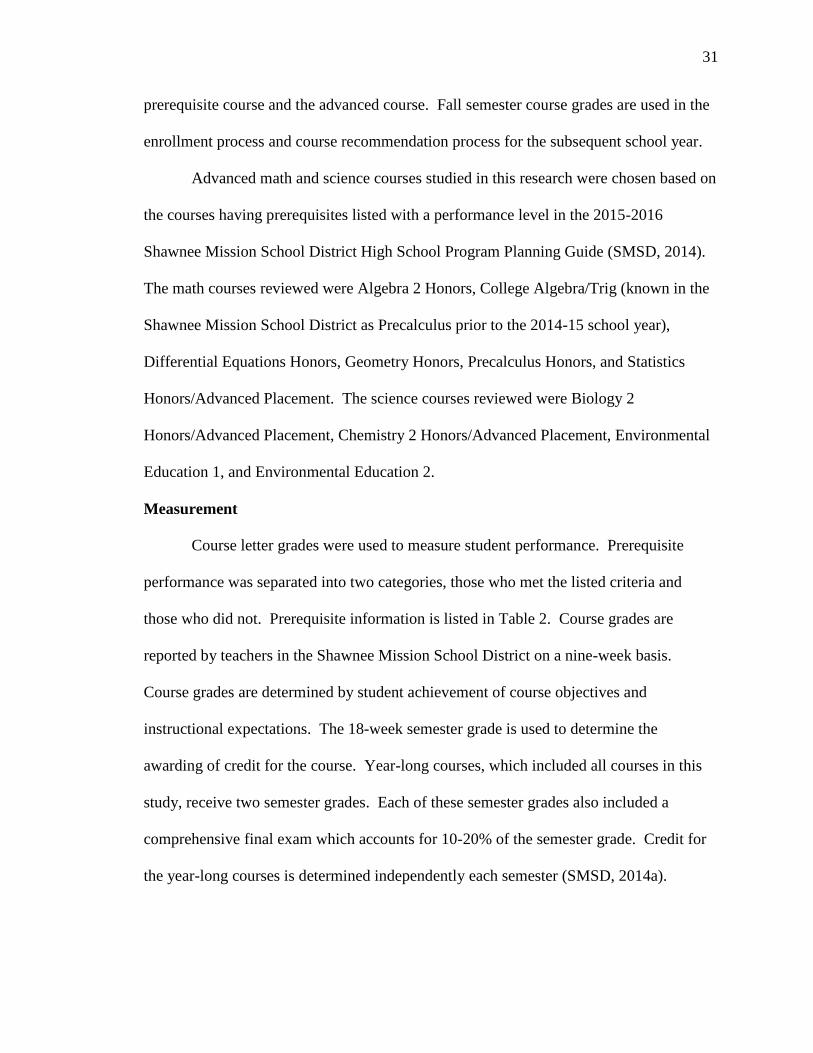
prerequisite course and the advanced course. Fall semester course grades are used in the
enrollment process and course recommendation process for the subsequent school year.
Advanced math and science courses studied in this research were chosen based on
the courses having prerequisites listed with a performance level in the 2015-2016
Shawnee Mission School District High School Program Planning Guide (SMSD, 2014).
The math courses reviewed were Algebra 2 Honors, College Algebra/Trig (known in the
Shawnee Mission School District as Precalculus prior to the 2014-15 school year),
Differential Equations Honors, Geometry Honors, Precalculus Honors, and Statistics
Honors/Advanced Placement. The science courses reviewed were Biology 2
Honors/Advanced Placement, Chemistry 2 Honors/Advanced Placement, Environmental
Education 1, and Environmental Education 2.
Measurement
Course letter grades were used to measure student performance. Prerequisite
performance was separated into two categories, those who met the listed criteria and
those who did not. Prerequisite information is listed in Table 2. Course grades are
reported by teachers in the Shawnee Mission School District on a nine-week basis.
Course grades are determined by student achievement of course objectives and
instructional expectations. The 18-week semester grade is used to determine the
awarding of credit for the course. Year-long courses, which included all courses in this
study, receive two semester grades. Each of these semester grades also included a
comprehensive final exam which accounts for 10-20% of the semester grade. Credit for
the year-long courses is determined independently each semester (SMSD, 2014a).

32
Math course grades used in this study were Algebra 1 first semester grade,
Algebra 2 first semester grade, Algebra 2 Honors first semester grade, College
Algebra/Trig first semester grade (known in the Shawnee Mission School District as
Precalculus prior to the 2014-15 school year), Differential Equations Honors first
semester grade, Geometry Honors first semester grade, Precalculus Honors first semester
grade, and Statistics Honors/Advanced Placement first semester grade.
Science course grades used in this study were Biology 1 first semester grade,
Biology 2 Honors/Advanced Placement first semester grade, Chemistry 1 first semester
grade, Chemistry 2 Honors/Advanced Placement first semester grade, Environmental
Education 1 first semester grade, and Environmental Education 2 first semester grade.
Validity
Internal validity is defined by Gall, Gall and Borg (2005) as “the extent to which
extraneous variables have been controlled and thus the level of certainty that the
experimental treatment has a causal influence on the dependent variable” (p. 252). The
choice of semester course grades for instrumentation in this study provides a relatively
consistent measure of student performance. There was, however, some slight variation in
how course grades were calculated from teacher to teacher. Using geometry as an
example, the weighting of homework versus assessment varied slightly between teachers
and buildings. Teacher syllabi pulled from the Teacher Pages section of the Shawnee
Mission School District website showed classroom assessments ranged from 75-80% of
the pre-final exam semester grade and homework ranged from 20-25% of the pre-final
exam semester grade. Final exam weighting for geometry was consistent within the five
high schools, however, ranged from 10-15% (SMSD, 2015).

33
External validity is defined by Gall, Gall and Borg (2005) as “the extent to which
the experimental findings can be generalized beyond the research sample to other groups”
(p. 252). The Shawnee Mission School District is a large suburban school district
consisting of a diverse student population. The sample for this study was representative
of the district as a whole. Variations between teacher grading procedures could affect the
generalization of the results to other settings.
Reliability
Reliability of a measurement tool is defined by Gall, Gall and Borg (2005) as “the
degree that it is free of measurement error” (p. 139). Inter-rater reliability factors into
course grades. Classroom-level decisions related to grading practices, as noted above,
could affect the reliability the course grades used in this study.
Data Collection Procedures
Permission was obtained from the Shawnee Mission School District director of
research and assessment to conduct the study using district archival data. Data was
extracted by the Shawnee Mission School District research and assessment department
from the district’s student information system for the schools years from 2010-2011 to
2014-2015. The data were anonymized by the district before being provided to the
researcher. Data provided included student ethnicity, race, gender, math and science
course consumption, and semester course grades.
Data Analysis and Hypothesis Testing
The research questions guiding this study focused on the predictive ability of
prerequisite course grades on students’ advanced course grades. The following research
questions, hypotheses, and statistical tests were used in the data analysis.

34
RQ1. To what extent is there a difference in first semester course grades in
advanced mathematics courses between students who met the listed enrollment criteria
and those who did not meet the listed enrollment criteria?
H1. There is a difference between student semester grades in Algebra 2 Honors
for those who earned a letter grade of B or better in Geometry Honors and those who did
not.
H2. There is a difference between student semester grades in College
Algebra/Trigonometry for those who earned a letter grade of B or better in Algebra 2 and
those who did not.
H3. There is a difference between student semester grades in Differential
Equations Honors for those who earned a letter grade of B or better in Calculus 3 Honors
and those who did not.
H4. There is a difference between student semester grades in Geometry Honors
for those who earned a letter grade of B or better in Algebra 1 and those who did not.
H5. There is a difference between student semester grades in Precalculus Honors
for those who earned a letter grade of B or better in Algebra 2 Honors and those who did
not.
H6. There is a difference between student semester grades in Statistics
Honors/Advanced Placement for those who earned a letter grade of B or better in Algebra
2 and those who did not.
To test each hypothesis (H1-H6), first semester course grades from the selected
advanced math courses were compared against the two categories for prerequisite
completion (students who met prerequisite performance level and students who did not

35
meet prerequisite performance level). A chi-square test of independence was completed
for each pair of courses to compare students who met the listed enrollment criteria and
those who did not meet the listed enrollment criteria. A significance level of 0.05 was set
for all hypothesis testing.
RQ2. To what extent is there a difference in first semester course grades in
advanced science courses between students who met the listed enrollment criteria and
those who did not meet the listed enrollment criteria?
H7. There is a difference between student semester grades in Biology 2
Honors/Advanced Placement for those who earned a letter grade of B or better in Biology
1 and those who did not.
H8. There is a difference between student semester grades in Chemistry 2
Honors/Advanced Placement for those who earned a letter grade of B or better in
Chemistry 1 and those who did not.
H9. There is a difference between student semester grades in Environmental
Education 1 for those who earned a letter grade of C or better in Biology 1 and those who
did not.
H10. There is a difference between student semester grades in Environmental
Education 2 for those who earned a letter grade of C or better in Environmental
Education 1 and those who did not.
To test each hypothesis (H7-H10), first semester course grades from the selected
advanced science courses were compared against the two categories for prerequisite
completion (students who met prerequisite performance level and students who did not
meet prerequisite performance level). A chi-square test of independence was completed

36
for each pair of courses to compare students who met the listed enrollment criteria and
those who did not meet the listed enrollment criteria. A significance level of 0.05 was set
for all hypothesis testing.
Limitations
Roberts (2004) defined limitations as areas the researcher has little or no control
over. The relationship between prerequisite course grades and subsequent advanced
course grades could include unknown variables not controlled for in this study.
Classroom-level decisions surrounding grading policies could have an effect on course
grades.
Summary
This chapter provided an outline of the study methodology used in determining
the relationship between advanced coursework grades and prerequisite coursework
grades for high school students in the Shawnee Mission School District from the 2010-11
school year to the 2014-15 school year. Chi-square tests for independence were used to
determine the difference in advanced coursework performance between students meeting
the criteria for enrollment in the advanced course and those who did not meet the criteria
and gained admittance via other means. Chapters four provides the research study results
and discussion. Chapter five provides interpretation of the results and recommendations
for further research.

37
Chapter Four
Results
The purpose of this study was to determine the difference in advanced math and
science course performance between students who met the listed prerequisite to
enrollment and those who do not meet the listed prerequisite to enrollment. The purpose
of this chapter is to review the descriptive statistics of the courses reviewed and review
the results of hypothesis testing used to address the research questions.
Descriptive Statistics
The sample from the population under examination in this study was students who
completed an advanced math or science course with a prerequisite course and
performance level in the prerequisite course for enrollment in the advanced course from
the 2010-2011 school year through the 2014-2015 school year. These courses and their
prerequisite information can be found in Table 2 on page 6.
The sample contained 14,144 students who completed one or more of the
advanced math or advanced science courses reviewed in this study. A review of the
demographic makeup of the sample revealed 81.7% of the students were white, 6.3%
were Hispanic, 4.7% were Asian, 3.8% were of multi-racial, 2.8% were black, and 0.7%
other races. These percentages reflect an unduplicated count of students who took one or
more of the courses being reviewed. The gender makeup of the sample was 51.6%
female and 48.4% male. Overall population demographics of the school district studied
can be found in Table 1 on page 2.
38
Hypothesis Testing
A chi-square test of independence was completed for each pair of courses to
compare advanced math and advanced science course grades of students who met the
listed enrollment criteria and those who did not meet the listed enrollment criteria. The
observed frequencies were compared to those expected by chance. First semester course
grades from the selected advanced math courses were compared against the two
categories for prerequisite completion (students who met prerequisite performance level
and students who did not meet prerequisite performance level). The expected frequency
assumption, which requires five or more expected events in the calculation, was violated
on some analyses. In these cases, the variable of advanced course grade categories was
collapsed into successful completion of the advanced course and unsuccessful completion
of the advanced course. Successful completion was defined using the course’s
prerequisite performance level. A significance level of 0.05 was set for all hypothesis
testing.
The research questions guiding this study focused on the predictive ability of
prerequisite course grades on students’ advanced course grades. The following research
questions, hypotheses and statistical tests were used in the data analysis. Results of the
hypothesis testing are presented below.
RQ1. To what extent is there a difference in first semester course grades in
advanced mathematics courses between students who met the listed enrollment criteria
and those who did not meet the listed enrollment criteria?

39
H1. There is a difference between student semester grades in Algebra 2 Honors
for those who earned a letter grade of B or better in Geometry Honors and those who did
not.
The results of the 2 test of independence indicated a statistically significant
difference between the observed and expected values, 2 = 229.13, df = 4, p < .001. The
null hypothesis is rejected. See Table 4 for the observed and expected frequencies. The
observed frequencies for students who earned an A in the Algebra 2 Honors course and
who had met the criteria for enrollment (n = 693.00) were higher than the expected
frequency (n = 647.66). The observed frequencies for students who earned a B in the
Algebra 2 Honors course and who had met the criteria for enrollment (n = 749.00) were
higher than the expected frequency (n = 733.15). The observed frequencies for students
who earned a C in the Algebra 2 Honors course and who had not met the criteria for
enrollment (n = 55.00) were higher than the expected frequency (n = 21.87). The
observed frequencies for students who earned a D in the Algebra 2 Honors course and
who had not met the criteria for enrollment (n = 26.00) were higher than the expected
frequency (n = 5.52). The observed frequencies for students who earned an F in the
Algebra 2 Honors course and who had not met the criteria for enrollment (n = 9.00) were
higher than the expected frequency (n = 1.42). These results indicated students who met
the enrollment criteria performed better in the Algebra 2 Honors course.

40
Table 4
Observed and Expected Frequencies for Hypothesis 1
Geometry Honors Grade
Algebra 2 Honors Grade Met Criteria
(B or better)
Did Not Meet
Criteria
A Observed 693.00 4.00
Expected 647.66 49.34
B Observed 749.00 40.00
Expected 733.15 55.85
C Observed 254.00 55.00
Expected 287.13 21.87
D Observed 52.00 26.00
Expected 72.48 5.52
F Observed 11.00 9.00
Expected 18.58 1.42
H2. There is a difference between student semester grades in College
Algebra/Trigonometry for those who earned a letter grade of B or better in Algebra 2 and
those who did not.
The results of the 2 test of independence indicated a statistically significant
difference between the observed and expected values, 2 = 217.8, df = 4, p < .001. The
null hypothesis is rejected. See Table 5 for the observed and expected frequencies. The
observed frequencies for students who earned an A in the College Algebra/Trigonometry
course and who had met the criteria for enrollment (n = 262.00) were higher than the
expected frequency (n = 215.18). The observed frequencies for students who earned a B
in the College Algebra/Trigonometry course and who had met the criteria for enrollment
(n = 594.00) were higher than the expected frequency (n = 520.93). The observed

41
frequencies for students who earned a C in the College Algebra/Trigonometry course and
who had not met the criteria for enrollment (n = 179.00) were higher than the expected
frequency (n = 137.16). The observed frequencies for students who earned a D in the
College Algebra/Trigonometry course and who had not met the criteria for enrollment (n
= 110.00) were higher than the expected frequency (n = 60.11). The observed
frequencies for students who earned an F in the College Algebra/Trigonometry course
and who had not met the criteria for enrollment (n = 46.00) were higher than the expected
frequency (n = 17.85). These results indicated students who met the enrollment criteria
performed better in the College Algebra/Trigonometry course.
Table 5
Observed and Expected Frequencies for Hypothesis 2
Algebra 2 Grade
College Algebra/Trig
Grade
Met Criteria
(B or better)
Did Not Meet
Criteria
A Observed 262.00 16.00
Expected 215.18 62.82
B Observed 594.00 79.00
Expected 520.93 152.07
C Observed 428.00 179.00
Expected 469.84 137.16
D Observed 156.00 110.00
Expected 205.89 60.11
F Observed 33.00 46.00
Expected 61.15 17.85

42
H3. There is a difference between student semester grades in Differential
Equations Honors for those who earned a letter grade of B or better in Calculus 3 Honors
and those who did not.
The expected frequency assumption was violated in the chi-square analysis, as
well as having observed values of zero, preventing calculation of the test statistic. See
Table 14 in Appendix D for the observed and expected frequencies. The chi-squared test
of independence was recalculated after collapsing the Differential Equations Honors
course grades into categories of successful completion, which was defined as a grade of
A or B, and unsuccessful completion, which was defined as a grade of C, D or F. The
expected frequency assumption was also violated in this analysis, which could
compromise the results; however, the observed frequencies were not zero and the test
statistic was calculated. The results of the 2 test of independence indicated a statistically
significant difference between the observed and expected values, 2 = 87.8, df = 1, p <
.001. See Table 6 for the observed and expected frequencies of the collapsed categories.
The observed frequencies for students who were successful in the Differential Equations
Honors course and who had met the criteria for enrollment (n = 240.00) were higher than
the expected frequency (n = 233.53). The observed frequencies for students who were
unsuccessful in the Differential Equations Honors course and who had not met the
criteria for enrollment (n = 7.00) were higher than the expected frequency (n = 0.53).
These results indicated students who met the enrollment criteria performed better in the
Differential Equations Honors course.
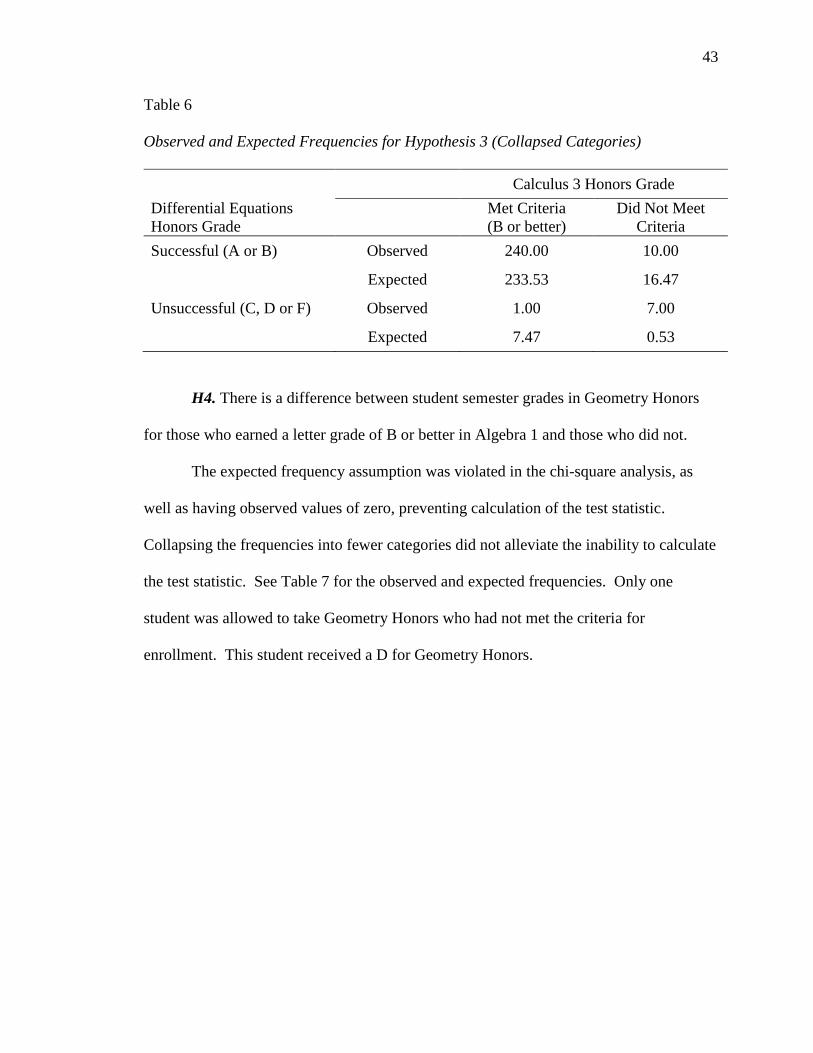
43
Table 6
Observed and Expected Frequencies for Hypothesis 3 (Collapsed Categories)
Calculus 3 Honors Grade
Differential Equations
Honors Grade
Met Criteria
(B or better)
Did Not Meet
Criteria
Successful (A or B) Observed 240.00 10.00
Expected 233.53 16.47
Unsuccessful (C, D or F) Observed 1.00 7.00
Expected 7.47 0.53
H4. There is a difference between student semester grades in Geometry Honors
for those who earned a letter grade of B or better in Algebra 1 and those who did not.
The expected frequency assumption was violated in the chi-square analysis, as
well as having observed values of zero, preventing calculation of the test statistic.
Collapsing the frequencies into fewer categories did not alleviate the inability to calculate
the test statistic. See Table 7 for the observed and expected frequencies. Only one
student was allowed to take Geometry Honors who had not met the criteria for
enrollment. This student received a D for Geometry Honors.
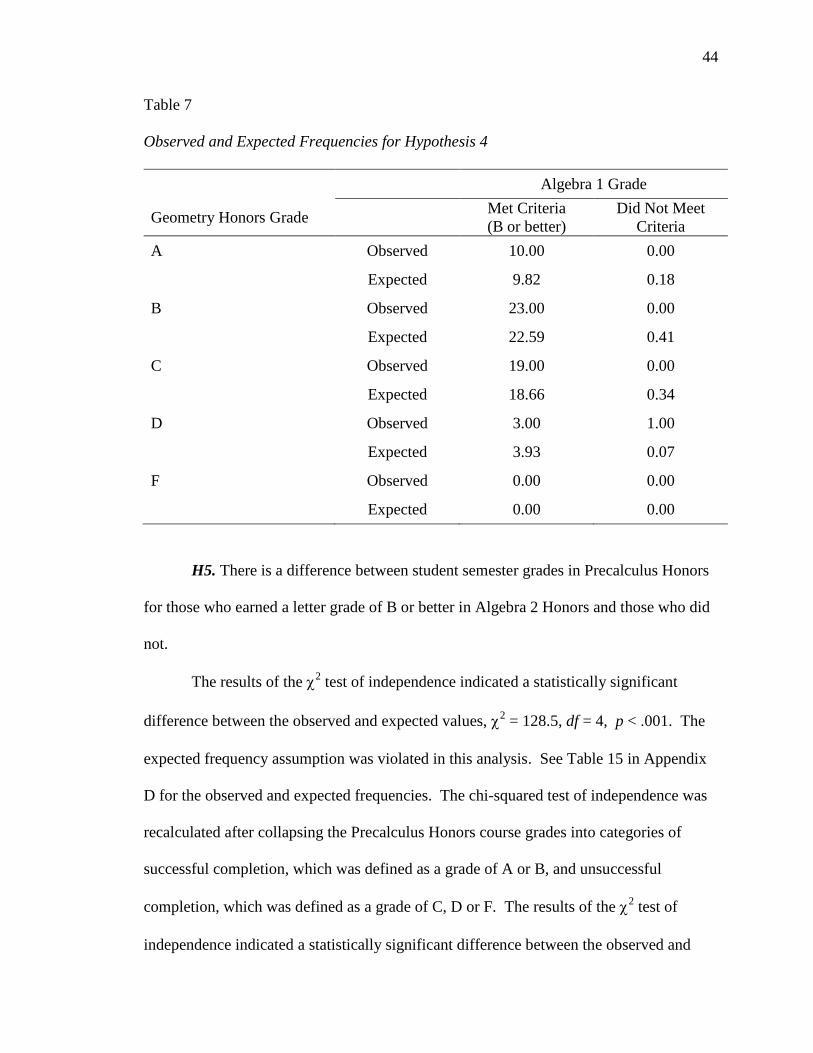
44
Table 7
Observed and Expected Frequencies for Hypothesis 4
Algebra 1 Grade
Geometry Honors Grade Met Criteria
(B or better)
Did Not Meet
Criteria
A Observed 10.00 0.00
Expected 9.82 0.18
B Observed 23.00 0.00
Expected 22.59 0.41
C Observed 19.00 0.00
Expected 18.66 0.34
D Observed 3.00 1.00
Expected 3.93 0.07
F Observed 0.00 0.00
Expected 0.00 0.00
H5. There is a difference between student semester grades in Precalculus Honors
for those who earned a letter grade of B or better in Algebra 2 Honors and those who did
not.
The results of the 2 test of independence indicated a statistically significant
difference between the observed and expected values, 2 = 128.5, df = 4, p < .001. The
expected frequency assumption was violated in this analysis. See Table 15 in Appendix
D for the observed and expected frequencies. The chi-squared test of independence was
recalculated after collapsing the Precalculus Honors course grades into categories of
successful completion, which was defined as a grade of A or B, and unsuccessful
completion, which was defined as a grade of C, D or F. The results of the 2 test of
independence indicated a statistically significant difference between the observed and

45
expected values, 2 = 72.0, df = 1, p < .001. The expected frequency assumption was met
in this analysis. The null hypothesis is rejected. See Table 8 for the observed and
expected frequencies of the collapsed results. The observed frequencies for students who
were successful in the Precalculus Honors course and who had met the criteria for
enrollment (n = 1182.00) were higher than the expected frequency (n = 1159.07). The
observed frequencies for students who were unsuccessful in the Precalculus Honors
course and who had not met the criteria for enrollment (n = 32.00) were higher than the
expected frequency (n = 9.07). These results indicated students who met the enrollment
criteria performed better in the Precalculus Honors course.
Table 8
Observed and Expected Frequencies for Hypothesis 5 (Collapsed Categories)
Algebra 2 Honors Grade
Precalculus Honors Grade Met Criteria
(B or better)
Did Not Meet
Criteria
A or B Observed 1182.00 24.00
Expected 1159.07 46.93
C, D or F Observed 201.00 32.00
Expected 223.93 9.07
H6. There is a difference between student semester grades in Statistics
Honors/Advanced Placement for those who earned a letter grade of B or better in Algebra
2 and those who did not.
The results of the 2 test of independence indicated a statistically significant
difference between the observed and expected values, 2 = 13.2, df = 4, p = 0.01. The
expected frequency assumption was violated in this analysis. See Table 16 in Appendix

46
D for the observed and expected frequencies. The chi-squared test of independence was
recalculated after collapsing the Statistics Honors/Advanced Honors course grades into
categories of successful completion, which was defined as a grade of A or B, and
unsuccessful completion, which was defined as a grade of C, D or F. The results of the
2 test of independence indicated a statistically significant difference between the
observed and expected values, 2 = 5.99, df = 1, p = 0.01. The expected frequency
assumption was met in this analysis. The null hypothesis is rejected. See Table 9 for the
observed and expected frequencies of the collapsed results. The observed frequencies for
students who were successful in the Statistics Honors/Advanced Placement course and
who had met the criteria for enrollment (n = 210.00) were higher than the expected
frequency (n = 201.95). The observed frequencies for students who were unsuccessful in
the Statistics Honors/Advanced Placement course and who had not met the criteria for
enrollment (n = 27.00) were higher than the expected frequency (n = 18.95). These
results indicated students who met the enrollment criteria performed better in the
Statistics Honors/Advanced Placement course.
Table 9
Observed and Expected Frequencies for Hypothesis 6 (Collapsed Categories)
Algebra 2 Grade
Statistics Honors/AP Grade Met Criteria
(B or better)
Did Not Meet
Criteria
A or B Observed 210.00 34.00
Expected 201.95 42.05
C, D or F Observed 83.00 27.00
Expected 91.05 18.95
47
RQ2. To what extent is there a difference in first semester course grades in
advanced science courses between students who met the listed enrollment criteria and
those who did not meet the listed enrollment criteria?
H7. There is a difference between student semester grades in Biology 2
Honors/Advanced Placement for those who earned a letter grade of B or better in Biology
1 and those who did not.
The results of the 2 test of independence indicated a statistically significant
difference between the observed and expected values, 2 = 12.4 df = 4, p = 0.01. The
expected frequency assumption was violated in this analysis. See Table 17 in Appendix
D for the observed and expected frequencies. The chi-squared test of independence was
recalculated after collapsing the Biology 2 Honors/Advanced course grades into
categories of successful completion, which was defined as a grade of A or B, and
unsuccessful completion, which was defined as a grade of C, D or F. The expected
frequency assumption was also violated in this analysis, which could compromise the
results; however, the observed frequencies were not zero and the test statistic was
calculated. The results of the 2 test of independence indicated a statistically significant
difference between the observed and expected values, 2 = 3.98, df = 1, p = 0.05. The
null hypothesis is rejected. See Table 10 for the observed and expected frequencies of
the collapsed results. The observed frequencies for students who were successful in the
Biology 2 Honors/Advanced Placement course and who had met the criteria for
enrollment (n = 74.00) were higher than the expected frequency (n = 71.11). The
observed frequencies for students who were unsuccessful in the Biology 2
Honors/Advanced Placement course and who had not met the criteria for enrollment (n =

48
7.00) were higher than the expected frequency (n = 4.11). These results indicated
students who met the enrollment criteria performed better in the Biology 2
Honors/Advanced Placement course.
Table 10
Observed and Expected Frequencies for Hypothesis 7 (Collapsed Categories)
Biology 1 Grade
Biology 2 Honors/AP
Grade
Met Criteria
(B or better)
Did Not Meet
Criteria
A or B Observed 74.00 2.00
Expected 71.11 4.89
C, D or F Observed 57.00 7.00
Expected 59.89 4.11
H8. There is a difference between student semester grades in Chemistry 2
Honors/Advanced Placement for those who earned a letter grade of B or better in
Chemistry 1 and those who did not.
The results of the 2 test of independence indicated a statistically significant
difference between the observed and expected values, 2 = 30.1 df = 4, p < .001. The
expected frequency assumption was violated in this analysis. See Table 18 in appendix D
for the observed and expected frequencies. The chi-squared test of independence was
recalculated after collapsing the Chemistry 2 Honors/Advanced Placement course grades
into categories of successful completion, which was defined as a grade of A or B, and
unsuccessful completion, which was defined as a grade of C, D or F. The expected
frequency assumption was also violated in this analysis, which could compromise the
results; however, the observed frequencies were not zero and the test statistic was
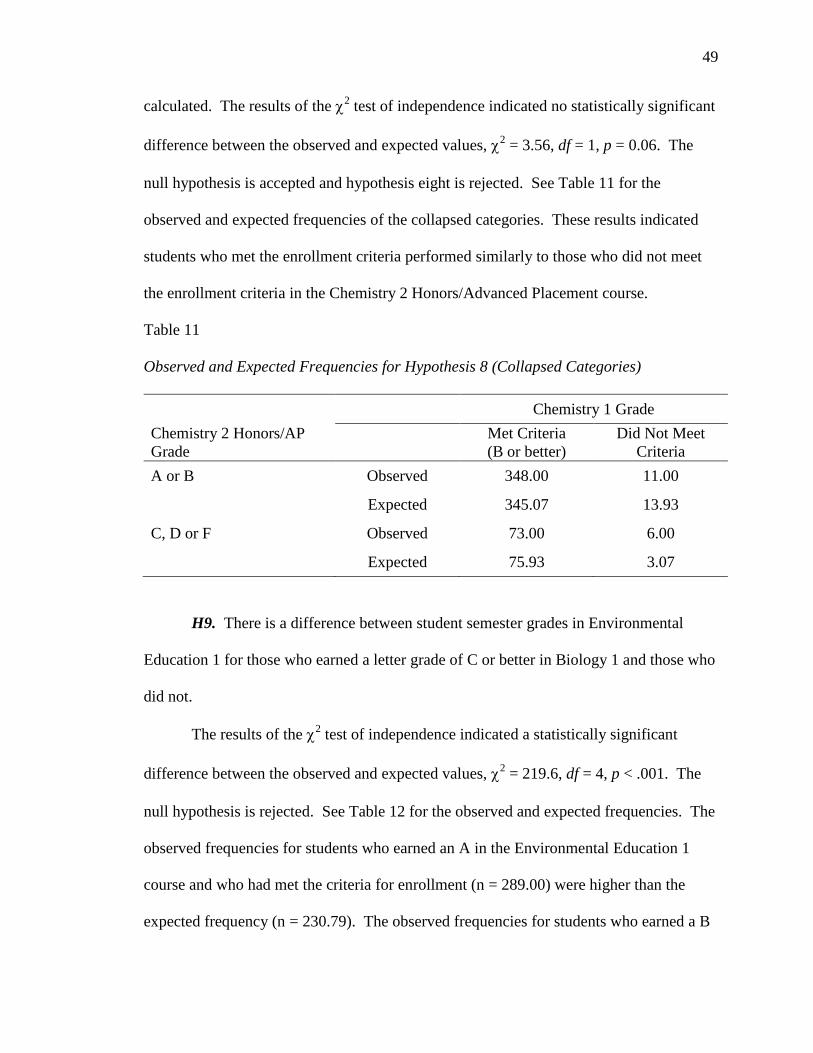
49
calculated. The results of the 2 test of independence indicated no statistically significant
difference between the observed and expected values, 2 = 3.56, df = 1, p = 0.06. The
null hypothesis is accepted and hypothesis eight is rejected. See Table 11 for the
observed and expected frequencies of the collapsed categories. These results indicated
students who met the enrollment criteria performed similarly to those who did not meet
the enrollment criteria in the Chemistry 2 Honors/Advanced Placement course.
Table 11
Observed and Expected Frequencies for Hypothesis 8 (Collapsed Categories)
Chemistry 1 Grade
Chemistry 2 Honors/AP
Grade
Met Criteria
(B or better)
Did Not Meet
Criteria
A or B Observed 348.00 11.00
Expected 345.07 13.93
C, D or F Observed 73.00 6.00
Expected 75.93 3.07
H9. There is a difference between student semester grades in Environmental
Education 1 for those who earned a letter grade of C or better in Biology 1 and those who
did not.
The results of the 2 test of independence indicated a statistically significant
difference between the observed and expected values, 2 = 219.6, df = 4, p < .001. The
null hypothesis is rejected. See Table 12 for the observed and expected frequencies. The
observed frequencies for students who earned an A in the Environmental Education 1
course and who had met the criteria for enrollment (n = 289.00) were higher than the
expected frequency (n = 230.79). The observed frequencies for students who earned a B

50
in the Environmental Education 1 course and who had met the criteria for enrollment (n =
698.00) were higher than the expected frequency (n = 634.67). The observed frequencies
for students who earned a C in the Environmental Education 1 course and who had not
met the criteria for enrollment (n = 180.00) were higher than the expected frequency (n =
162.65). The observed frequencies for students who earned a D in the Environmental
Education 1 course and who had not met the criteria for enrollment (n = 165.00) were
higher than the expected frequency (n = 85.59). The observed frequencies for students
who earned an F in the Environmental Education 1 course and who had not met the
criteria for enrollment (n = 66.00) were higher than the expected frequency (n = 30.22).
These results indicated students who met the enrollment criteria performed better in the
Environmental Education 1 course.
Table 12
Observed and Expected Frequencies for Hypothesis 9
Biology 1 Grade
Environmental Education 1
Grade
Met Criteria
(B or better)
Did Not Meet
Criteria
A Observed 289.00 11.00
Expected 230.79 69.21
B Observed 698.00 127.00
Expected 634.67 190.33
C Observed 525.00 180.00
Expected 542.35 162.65
D Observed 217.00 154.00
Expected 285.41 85.59
F Observed 65.00 66.00
Expected 100.78 30.22

51
H10. There is a difference between student semester grades in Environmental
Education 2 for those who earned a letter grade of C or better in Environmental
Education 1 and those who did not.
The results of the 2 test of independence indicated a statistically significant
difference between the observed and expected values, 2 = 21.2 df = 4, p < .001. The
expected frequency assumption was violated in this analysis. See Table 19 in appendix D
for the observed and expected frequencies. The chi-squared test of independence was
recalculated after collapsing the Environmental Education 2 course grade categories into
successful completion, which was defined as a grade of A, B or C, and unsuccessful
completion, which was defined as a grade of D or F. The expected frequency assumption
was also violated in this analysis, which could compromise the results; however, the
observed frequencies were not zero and the test statistic was calculated. The results of
the 2 test of independence indicated a statistically significant difference between the
observed and expected values, 2 = 19.6, df = 1, p < .001. The null hypothesis is rejected.
See Table 13 for the observed and expected frequencies of the collapsed categories. The
observed frequencies for students who were successful in the Environmental Education 2
course and who had met the criteria for enrollment (n = 170.00) were higher than the
expected frequency (n = 165.34). The observed frequencies for students who were
unsuccessful in the Environmental Education 2 course and who had not met the criteria
for enrollment (n = 6.00) were higher than the expected frequency (n = 1.34). These
results indicated students who met the enrollment criteria performed better in the
Environmental Education 2 course.
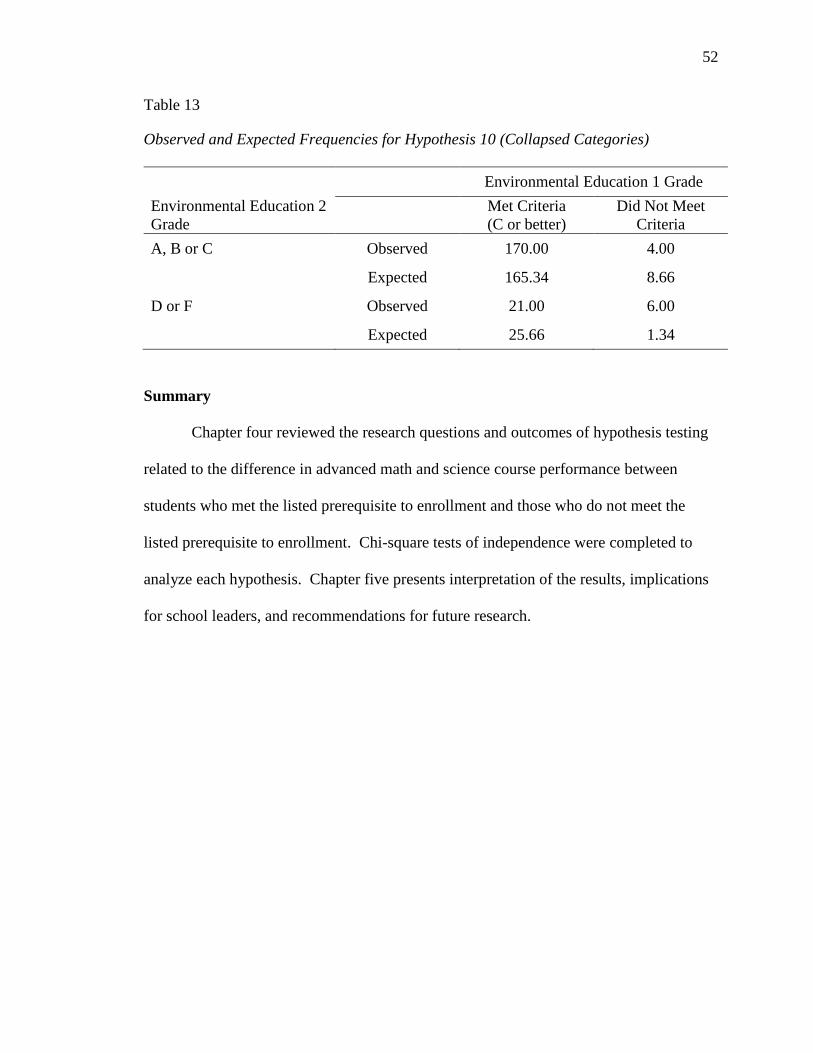
52
Table 13
Observed and Expected Frequencies for Hypothesis 10 (Collapsed Categories)
Environmental Education 1 Grade
Environmental Education 2
Grade
Met Criteria
(C or better)
Did Not Meet
Criteria
A, B or C Observed 170.00 4.00
Expected 165.34 8.66
D or F Observed 21.00 6.00
Expected 25.66 1.34
Summary
Chapter four reviewed the research questions and outcomes of hypothesis testing
related to the difference in advanced math and science course performance between
students who met the listed prerequisite to enrollment and those who do not meet the
listed prerequisite to enrollment. Chi-square tests of independence were completed to
analyze each hypothesis. Chapter five presents interpretation of the results, implications
for school leaders, and recommendations for future research.

53
Chapter Five
Interpretation and Recommendations
The first chapter of this research study introduced the background, purpose, and
significance of the study. Chapter two contained a review of literature on the history of
honors courses and the Advanced Placement program, the importance of advanced
coursework, the use of Advanced Placement and other measures to rank and compare
schools, qualitative and quantitative research regarding predicting success in advanced
high school coursework, racial equity in advanced high school coursework, tracking of
students into curriculum paths, and common practices related to advanced course
enrollment. Chapter three provided an outline of the study methodology used in
determining the relationship between advanced coursework grades and prerequisite
coursework grades for high school students. Chapter four provided the results of
hypothesis testing related to the research questions. Chapter five provides a review of the
problem, purpose, research questions, methodology, and major findings of the study. In
addition, findings related to relevant literature on predictors of academic success,
implications for actions, and recommendations for future research are addressed.
Study Summary
Overview of the Problem. Many schools require students to complete
prerequisite courses prior to enrollment in advanced courses in high school. Many of
these courses include ambiguity in the form of a teacher or counselor recommendation
being an option in overriding the listed prerequisite course or performance level. Table 2
on page 6 lists the courses of interest in this study and their prerequisites. The problem

54
this study sought to clarify was the accuracy of these prerequisites as predictors of
success when persuasive students and their parents can circumvent them.
Purpose Statement and Research Questions. The purpose of this study was to
determine the difference in advanced course performance between students who met the
listed prerequisite to enrollment and those who do not meet the listed prerequisite to
enrollment. The questions the researcher sought to answer were:
RQ1. To what extent is there a difference in first semester course grades in
advanced mathematics courses between students who met the listed enrollment
criteria and those who did not meet the listed enrollment criteria?
RQ2. To what extent is there a difference in first semester course grades in
advanced science courses between students who met the listed enrollment criteria
and those who did not meet the listed enrollment criteria?
Review of the Methodology. This study was designed to compare student
performance in advanced courses with their performance in the listed prerequisite course.
This research study was designed using quantitative, quasi-experimental methods. The
population for the study was students from the six high schools of the Shawnee Mission
School District enrolled in advanced math and science courses with prerequisites to
enrollment. The sample of the population for this study was high school students who
completed an advanced math or science course with a prerequisite course and
performance level in the prerequisite course for enrollment in the advanced course listed
in the 2015-2016 Shawnee Mission School District High School Program Planning
Guide. The sample of students was gathered from five academic years from 2010-2011
through 2014-2015. The independent variable was performance in prerequisite courses,

55
categorized into those who met the prerequisite course performance level for enrollment
in an advanced math or science course and those who did not meet the prerequisite
performance level. The dependent variable in this study was performance in high school
advanced math and science courses. Chi-square tests of independence were used to
compare the variables for ten sets of courses.
Major Findings. Multiple chi-square tests of independence were conducted to
determine the difference in advanced mathematics and advanced science course grades
between students who met the listed criteria for enrollment and those who did not meet
the listed criteria for enrollment. The detailed results of the chi-square analysis of the ten
hypotheses can be found in chapter four. There was a statistically significant result
indicating students who met the enrollment criteria performed better in the Algebra 2
Honors course. There was a statistically significant result indicating students who met
the enrollment criteria performed better in the College Algebra/Trigonometry course.
There was a statistically significant result indicating students who met the enrollment
criteria performed better in the Differential Equations Honors course; however, this result
could be compromised due to violation of the expected frequency assumption during the
chi-square analysis, even after collapsing the dependent variable from five to two
categories. The test statistic could not be calculated for students in Geometry Honors due
to the extremely low observed frequencies. Collapsing the frequencies into fewer
categories did not alleviate the inability to calculate the test statistic. Only one student
was allowed to take Geometry Honors who had not met the criteria for enrollment. This
student received a D for Geometry Honors. There was a statistically significant result
indicating students who met the enrollment criteria performed better in the Precalculus

56
Honors course; however, it should be noted the test was conducted after collapsing the
dependent variable from five to two categories to prevent violation of the expected
frequencies assumption. There was a statistically significant result indicating students
who met the enrollment criteria performed better in the Statistics Honors/Advanced
Placement course; however, it should be noted the test was conducted after collapsing the
dependent variable from five to two categories to prevent violation of the expected
frequencies assumption. There was a statistically significant result indicating students
who met the enrollment criteria performed better in the Biology 2 Honors/Advanced
Placement course; however, this result could be compromised due to violation of the
expected frequency assumption during the chi-square analysis, even after collapsing the
dependent variable from five to two categories. There was a statistically significant result
indicating students who met the enrollment criteria performed similarly to those who did
not meet the enrollment criteria in the Chemistry 2 Honors/Advanced Placement course;
however, this result could be compromised due to violation of the expected frequency
assumption during the chi-square analysis, even after collapsing the dependent variable
from five to two categories. There was a statistically significant result indicating students
who met the enrollment criteria performed better in the Environmental Education 1
course. There was a statistically significant result indicating students who met the
enrollment criteria performed better in the Environmental Education 2 course; however,
this result could be compromised due to violation of the expected frequency assumption
during the chi-square analysis, even after collapsing the dependent variable from five to
two categories.

57
Casual inspection of the advanced mathematics and advanced science course
grades show over half of the students not meeting the enrollment criteria were still
successful in Differential Equations Honors, Statistics Honors/Advanced Placement,
Chemistry 2 Honors/Advanced Placement and Environmental Education 1. All of the
courses reviewed, except Geometry Honors, revealed students who did not meet the
enrollment criteria yet still earned a grade of A in the advanced course.
Findings Related to the Literature
The College Board (2002) recommends “all students who are willing to accept the
challenge of a rigorous academic curriculum should be given consideration for admission
to Advanced Placement courses” (p. i). Adelman’s (1999 and 2006) longitudinal studies
of students from middle school to college found the rigor of a student’s high school
curriculum outweighs the effects of socioeconomic status on bachelor’s degree
completion. Adelman (1999) reported completing one mathematics course above the
level of Algebra 2 “more than doubles the odds that a student who enters postsecondary
education will complete a bachelor’s degree” (p18). Klopfenstein (2003), however,
found that schools must “inevitably decide which students are allowed into these rigorous
and fast-paced classes” (p. 42). Requiring all students to take advanced coursework can
cause frustration for students and watering down of the content. Some schools use a
single criterion, such as GPA or standardized test scores, to determine eligibility. Most
schools fall somewhere between these two extremes. The current study reviewed
information from the Shawnee Mission School District, which uses prior course grades as
enrollment criteria for ten advanced mathematics and advanced science courses. Students
meeting the enrollment criteria were found to perform better in the advanced courses than
those who did not. There were, however, students who were successful in their advanced

58
mathematics or advanced science course even though they did not meet the enrollment
criteria. Numerous studies report on the importance of the individual teacher in this
success. Chen (2005) found “the adolescents’ self-perceived academic support from
parents and especially teachers are powerful predictors of their own perceived levels of
academic engagement and achievement” (p. 114). Archambault et al. (2012) reported
“the more teachers maintain high expectations and the more efficacious they feel in
helping their students succeed, the more students’ achievement increase over the year” (p.
324). These studies, along with the current study, continue to emphasize the importance
of avoiding a one size fits all model of enrollment criteria for advanced coursework.
Conclusions
Access to advanced coursework in mathematics and science is critical to ensuring
students are both college and career ready. The purpose of this study was to review the
predictive ability of enrollment criteria on advanced mathematics and science course
performance. This sections reviews implications for action and recommendations for
further research as it relates to the findings of this study.
Implications for Action. School leaders must be equipped to guide parents and
students. Prerequisites to course enrollment are necessary for general guidance of
students into a proper curricular sequence. All but two of the hypotheses tested indicate
students meeting the listed enrollment criteria performed better in the advanced
mathematics or science course than those who did not meet the enrollment criteria.
Students, however, change significantly over time with relation to their goals and
perception of the importance of school for their future. For each of the courses reviewed
in this study, with the exception of Geometry Honors, there were students who did not

59
meet the enrollment criteria yet were still successful in the advanced course. It is critical
for parents, students, teachers and school leaders to work together to give students a
chance to prove themselves in advanced coursework, whether they have met the
enrollment criteria or not. These conversations need to be driven by the school using
multiple measures of student performance as opposed to a one-time snapshot of student
performance that could set them on a low-rigor track for their educational career. This
recommendation echoes the College Board’s equity statement, “all students who are
willing to accept the challenge of a rigorous academic curriculum should be given
consideration for admission” (College Board, 2002, p. i). Opening advance mathematics
and science course enrollment opportunities to students who have not typically performed
well in math or science requires support and professional development for teachers
instructing the advance courses. The role of the teacher in supporting students new to
advanced coursework is critical in the success of these students.
Recommendations for Future Research. This study sought to add to the current
literature and research on predicting success in advanced mathematics and advanced
science coursework, along with providing guidance towards increasing opportunities for
students to enroll in advanced mathematics and advanced science courses. The following
are recommendations to extend and enhance this study.
First, a qualitative study is needed investigating the effect of student attitudes for
students who did not meet the enrollment criteria could enhance the ability to guide
students. Determining why students were successful even though they did not meet the
enrollment criteria is crucial.

60
Second, further study is needed of grading practices and their consistency
between teachers and across schools. Additional reflection on the data shows wide
variety in the numbers of each grade mark given for the advanced courses. For example,
29.0% of students in the study sample attending one school earned a grade of A in their
advanced course, while 39.9% of students in the study sample attending a different
school earned a grade of A in their advanced course.
Third, an extended study on the teacher-student relationship in advanced
mathematics and science courses could provide guidance related to opening enrollment
and creating opportunities for support for students in historically under-represented
groups. Additional reflection on the data shows 34.7% of white students earned a grade
of A in their advanced course, while 24.2% of Hispanic students and 16.7% of black
students earned a grade of A in their advanced course. A clearer picture of this
relationship could provide insight for teacher development and clarify any potential bias
against these groups of students.
Concluding Remarks. Advanced mathematics and advanced science coursework
provides students a window of opportunity into high-demand and high-paying careers.
Findings from this study indicate the reviewed courses’ prerequisites listed in the
Shawnee Mission School District High School Program Planning Guide are, for the most
part, accurate in predicting success in advanced coursework in mathematics and science.
It is the belief of this author, however, that students, regardless of prior grades, must be
given every opportunity to enroll in and experience advanced coursework if they have the
desire to attempt it. The goal of advanced coursework for all students must be supported
with staff development. The majority of staff development time has been spent helping

61
teachers serving the lowest-performing students and helping these students meet
proficiency on state assessments. School leaders must not forget to focus staff
development on helping advanced course teachers support students who are not typical
advanced students. School leaders and counselors need to work with students on
motivational factors, including students’ self-disqualification due to perceived lack of
skills or peer-group factors. Schools must engage in a cultural shift to support these
students and help them find success.

62
References
ACT. (2008). The forgotten middle: Ensuring that all students are on target for college
and career readiness before high school. Retrieved from
http://www.act.org/research/policymakers/pdf/ForgottenMiddle.pdf
Adelman, C. (1999). Answers in the toolbox: Academic intensity, attendance patterns,
and bachelor’s degree attainment. Retrieved from
https://www2.ed.gov/pubs/Toolbox/toolbox.html
Adelman, C. (2006). The toolbox revisited: Paths to degree completion from high school
through college. Retrieved from
http://www2.ed.gov/rschstat/research/pubs/toolboxrevisit/toolbox.pdf
Adlai E. Stevenson High School. (2004). About us. Retrieved October 24, 2004, from
http://www.district125.k12.il.us/
Archambault, I., Janasz, M., & Chouinard, R. (2012). Teacher beliefs as predictors of
adolescents’ cognitive engagement and achievement in mathematics. Journal of
Education Research, 105(5), 319-328.
Archibald, D., & Farley-Ripple, E. (2012). Predictors of placement in lower level versus
high level high school mathematics. High School Journal, 96(1), 33-51.
Attewell, P. (2001). The winner-take-all high school: Organizational adaptations to
educational stratification. Sociology of Education, 74(4), 267-295.
Blue Valley School District. (2015). High school course description guide 2015-2016.
Retrieved from
https://district.bluevalleyk12.org/ParentsAndStudents/FormsAndDocsCurriculum/
High-School-Curriculum-Guide-2015-16.pdf

63
Bryan, J., Moore-Thomas, C., Gaenzle, S., Kim, J., Lin, C., & Na, G. (2012). The effects
of school bonding on high school seniors' academic achievement. Journal of
Counseling & Development, 90(4), 467-480.
Camara, W., & Echternacht, G. (2000). The SAT I and high school grades: Utility in
predicting success in college. New York: College Board.
Chen, J. J. (2005). Relation of academic support from parents, teachers, and peers to
Hong Kong adolescents' academic achievement: The mediating role of
academic engagement. Genetic, Social & General Psychology
Monographs, 131(2), 77-127.
College Board. (2002). Equity policy statement. New York: Author.
College Board. (2011). Annual Advanced Placement program participation 1956-2011.
New York: Author.
College Board. (2015). Explore Advanced Placement. Retrieved
from https://apstudent.collegeboard.org/exploreap
Corcoran, H. (2000). An investigation of the racial gap in Advanced Placement course
enrollment (Unpublished doctoral dissertation). Temple University, Philiadelphia.
DeSoto Unified School District. (2015). Course guide 2015-2016. Retrieved from
http://mvhs.usd232.org/files/_AbIvI_/f573b0628e2bea163745a49013852ec4/MV
HS_course_guide_2016.pdf
DiMartino, J., & Miles, S. (2004). Equity in the classroom. Principal Leadership, 5(4),
44-48.
Ferguson, R. F. (2003). Teacher’s perceptions and expectations and the black-white test
score gap. Urban Education, 38(4), 460-507.

64
Finn, J.D., Gerber, S.B., & Wang, M.C. (2002). Course offerings, course
requirements, and course taking in mathematics. Journal of Curriculum and
Supervision, 17(4), 336-366.
Fredricks, J. A., & Eccles, J. S. (2010). Breadth of extracurricular participation and
adolescent adjustment among African-American and European-American
youth. Journal Of Research On Adolescence, 20(2), 307-333.
Gall, J. P., Gall, M. D., & Borg, W. R. (2005). Applying educational research: A
practical guide (5th
ed.). Boston: Pearson.
Goldschmidt, P. & Wang, J. (2003). Importance of middle school mathematics on
high school students’ mathematics achievement. Journal of Educational
Research, 97(1), 3-19.
Howard, A. K., & Ziomek-Daigle, J. (2009). Bonding, achievement, and activities:
School bonding, academic achievement, and participation in extracurricular
activities. Georgia School Counselors Association Journal,16(1), 39-48.
Islam, M., & Al-Ghassani, A. (2015). Predicting college math success: Do high
school performance and gender matter?. International Journal of Higher
Education, 4(2), 67-80.
Kansas State Department of Education. (2015). USD 512 Shawnee Mission Public
Schools Report Card. Retrieved from
http://online.ksde.org/rcard/district.aspx?org_no=D0512
Keng, L., & Dodd, B.. (2008). A comparison of college performances on AP and non-
AP student groups in 10 subject areas. New York: College Board.

65
Klopfenstein, C. (2003). Recommendations for maintaining the quality of Advanced
Placement programs. American Secondary Education, 32(1), 39-48.
Lunenburg, F. C., & Irby, B. J. (2008). Writing a successful thesis or dissertation: Tips
and strategies for students in the social and behavioral sciences. Thousand Oaks,
CA: Corwin Press.
Matthews, Jay. (2015, April 19). How the America’s most challenging high school list
works. The Washington Post. Retrieved from
https://www.washingtonpost.com/local/education/how-americas-most-
challenging-high-schools-works-the-selection-method/2015/04/14/cfdd9e44-
e30a-11e4-905f-cc896d379a32_story.html
Morse, Robert. (2015, May 11). How U.S. News calculated the 2015 best high school
rankings. U.S. News and World Report. Retrieved from
http://www.usnews.com/education/best-high-schools/articles/how-us-news-
calculated-the-rankings
National Association of Secondary School Principals. (2004). Breaking ranks II:
Strategies for Leading High School Reform. Reston, VA: Author.
Ndura, E., Robinson, M., Ochs, G. (2003). Minority students in high school Advanced
Placement courses: Opportunity and equity denied. American Secondary
Education, 32(1), 21-38.
Newsweek. (2015). Methodology of Newsweek’s high school rankings 2015.
Newsweek. Retrieved from http://www.newsweek.com/methodology-newsweeks-
top-high-school-rankings-2015-363698

66
Oakes, Jeannie. (1987). Tracking in secondary schools: A contextual perspective.
Educational Psychologist, 22(2), 128-153.
Olathe School District. (2015). 2015-16 Program planning guide. Retrieved from
https://www.olatheschools.com/aboutus/docs/category/10-high-school-
curriculum?download=479:2015-16-high-school-program-planning-guide
Palin, R.J. (2001). PSAT and Advanced Placement success. OAH Magazine of History,
15(3), 55-56.
Potolsky, A., Cohen, J., & Saylor, C. (2003). Academic performance of nursing
students: Do prerequisite grades and tutoring make a difference?. Nursing
Education Perspectives, 24(5), 246-250.
Potter, L., & Morgan, P. (2000). Improve your Advanced Placement program: What one
high school did. American Secondary Education, 29(2), 2-8.
Roberts, C. (2004). The dissertation journey: A practical and comprehensive guide to
planning, writing, and defending your dissertation. Thousand Oaks, CA: Corwin
Press.
Shawnee Mission School District. (2014). SMSD 2015-16 High School Program
Planning Guide. Shawnee Mission, KS: SMSD.
Shawnee Mission School District. (2014a). Administrative guidelines and procedures
affecting students of the Shawnee Mission School District K-12. Shawnee
Mission, KS: SMSD.
Shawnee Mission School District. (2015). Teacher Pages. Retrieved from
http://www4.smsd.org/

67
Shawnee Mission School District. (2015a). Advanced Placement, IB, CN, ACT, Oh My.
Unpublished report to the Shawnee Mission School District Board of Education,
Shawnee Mission, KS.
Solorzano, D.G. & Ornelas, A. (2004). A critical race analysis of Latina/o and African
American Advanced Placement enrollment in public high schools. The High
School Journal, 87(3), 15-26.
Strayhorn, T. L. (2010). The rold of schools, families and psychological variables on
math achievement of black high school students. High School Journal, 93(4),
177-184.
Tucker, C. M., Zayco, R. A., Herman, K. C., Reinke, W. M., Trujillo, M., Carraway, K.,
& ... Ivery, P. D. (2002). Teacher and child variables as predictors of academic
engagement among low-income African-American children. Psychology In The
Schools,39(4), 477.
Turner Unified School District. (2015). Turner High School Course Description
Handbook 2015-2016. Retrieved from
http://www.turnerusd202.org/uploaded/THS_Course_Book_2015-
2016_(FINAL).pdf
United States Department of Education. (2008). New race and ethnicity guidelines for
the collection of federal education data. Retrieved from
http://www2.ed.gov/policy/rschstat/guid/raceethnicity/index.html
Yonezawa, S., Wells, A.S. & Serna, I. (2002). Choosing tracks: “Freedom of choice” in
detracking schools. American Educational Research Journal, 39(1), 37-67.

68
Appendices

69
Appendix A: Shawnee Mission School District Research Approval

70

71
Appendix B: Baker University IRB Form

72
Date:__________________ School of education IRB PROTOCOL NUMBER __________________
Graduate department (irb USE ONLY)
IRB Request
Proposal for Research
Submitted to the Baker University Institutional Review Board
I. Research Investigator(s) (Students must list faculty sponsor first)
Department(s) School of Education Graduate Department
Name Signature
1. Dr. Harold Frye ____________________, Major Advisor
2. Margaret Waterman ____________________, Research Analyst
3. Jim Robins University Committee Member
4. Christy Ziegler External Committee Member
Principal Investigator: Ryan Flurry
Phone: 816-679-6459
Email: [email protected]
Mailing address: 7333 Falmouth
Prairie Village, KS 66208
Faculty sponsor: Dr. Harold Frye
Phone: 913-344-1220
Email: [email protected]
Expected Category of Review: _X_Exempt ____Expedited ____Full

73
II: Protocol Title
“Predictors of Success in High School Advanced Math and Science Coursework”
Summary
The following summary must accompany the proposal. Be specific about exactly what
participants will experience, and about the protections that have been included to safeguard
participants from harm. Careful attention to the following may help facilitate the review process:
In a sentence or two, please describe the background and purpose of the research.
The purpose of this study was to determine the difference, if any, in advanced course
performance between students who met the listed prerequisite to enrollment and those who do
not meet the listed prerequisite to enrollment. The sample for the study comes from students
enrolled in advanced math and science courses in a large suburban school district.
Briefly describe each condition or manipulation to be included within the study.
The independent variable for this study will be semester course grades in courses which are
prerequisites to advanced course enrollment. Students who met the prerequisite performance
level for the advanced courses will be compared with those so did not using a chi-square
analysis.
What measures or observations will be taken in the study? If any questionnaire or other
instruments are used, provide a brief description and attach a copy.
The dependent variable for this study will be achievement in advanced math and science courses
as measured by semester course grades.
Will the subjects encounter the risk of psychological, social, physical, or legal risk? If so,
please describe the nature of the risk and any measures designed to mitigate that risk.
The subjects will not encounter any psychological, social, physical, or legal risk.
Will any stress to subjects be involved? If so, please describe.
The subjects will not be exposed to any stress.
Will the subjects be deceived or misled in any way? If so, include an outline or script of the
debriefing.
The subjects will not be deceived or misled in any way.

74
Will there be a request for information that subjects might consider to be personal or
sensitive? If so, please include a description.
Information from the student management system will be used for this research study and
students will not be directly interviewed or surveyed. Information to be extracted from the
student management includes gender, ethnicity, race, course consumption, and course grades.
The district assessment and research department will anonymize the data with a randomly
generated identification number for each student. The researcher will not be able to connect data
provided with specific individuals.
Will the subjects be presented with materials that might be considered to be offensive,
threatening, or degrading? If so, please describe.
The subjects will not be presented with materials that might be considered to be offensive,
threatening, or degrading.
Approximately how much time will be demanded of each subject?
No additional time will be demanded of each subject. The information to be analyzed will be
gleaned from the district’s student information system.
Who will be the subjects in this study? How will they be solicited or contacted? Provide an
outline or script of the information which will be provided to subjects prior to their
volunteering to participate. Include a copy of any written solicitation as well as an outline
of any oral solicitation.
The subjects in this study are or were high school students in the district who enrolled in
advanced science or math courses between the 2010-11 school year and the 2014-15 school year.
Subjects will not be contacted or solicited for the study.
What steps will be taken to ensure that each subject’s participation is voluntary? What if
any inducements will be offered to the subjects for their participation?
Student subjects will not be contacted for this study.
How will you ensure that the subjects give their consent prior to participating? Will a
written consent form be used? If so, include the form. If not, explain why not.
Student subjects will not be contacted for this study and therefore a written consent is not
necessary.
Will any aspect of the data be made a part of any permanent record that can be identified
with the subject? If so, please explain the necessity.

75
No identifying data will be made part of any permanent record associated with this study. The
district assessment and research department will anonymize the data with a randomly generated
identification number for each student.
Will the fact that a subject did or did not participate in a specific experiment or study be
made part of any permanent record available to a supervisor, teacher or employer? If so,
explain.
No identifying data will be made part of any permanent record associated with this study. The
district assessment and research department will anonymize the data with a randomly generated
identification number for each student.
What steps will be taken to ensure the confidentiality of the data?
All data used by the researcher will be stripped of student identifying information. The district
assessment and research department will anonymize the data with a randomly generated
identification number for each student.
If there are any risks involved in the study, are there any offsetting benefits that might
accrue to either the subjects or society?
There are no risks involved in the study. Benefits to this study are to increase the body of
research in this area. The findings could assist in decision making with regards to student course
enrollment and encouraging a rigorous course selection.
Will any data from files or archival data be used? If so, please describe.
Archived data from the district’s student management system will be used. Information to be
extracted from the student management includes gender, ethnicity, race, course consumption,
and course grades. The district assessment and research department will anonymize the data
with a randomly generated identification number for each student. The researcher will not be
able to connect data provided with specific individuals.

76
Appendix C: Baker University IRB Approval

77

78
Appendix D: Additional Data Tables

79
Un-collapsed frequency tables for chi-square tests violating expected frequency assumption
Table 14
Observed and Expected Frequencies for Hypothesis 3
Calculus 3 Honors Grade
Differential Equations
Honors Grade
Met Criteria
(B or better)
Did Not Meet
Criteria
A Observed 197.00 4.00
Expected 187.76 13.24
B Observed 43.00 6.00
Expected 45.77 3.23
C Observed 1.00 5.00
Expected 5.60 0.40
D Observed 0.00 2.00
Expected 1.87 0.13
F Observed 0.00 0.00
Expected 0.00 0.00

80
Table 15
Observed and Expected Frequencies for Hypothesis 5
Algebra 2 Honors Grade
Precalculus Honors Grade Met Criteria
(B or better)
Did Not Meet
Criteria
A Observed 638.00 2.00
Expected 615.09 24.91
B Observed 544.00 22.00
Expected 543.97 22.03
C Observed 170.00 18.00
Expected 180.68 7.32
D Observed 28.00 12.00
Expected 38.44 1.56
F Observed 3.00 2.00
Expected 4.81 0.19

81
Table 16
Observed and Expected Frequencies for Hypothesis 6
Algebra 2 Grade
Statistics Honors/AP Grade Met Criteria
(B or better)
Did Not Meet
Criteria
A Observed 55.00 4.00
Expected 48.83 10.17
B Observed 155.00 30.00
Expected 153.12 31.88
C Observed 66.00 17.00
Expected 68.70 14.30
D Observed 15.00 8.00
Expected 19.04 3.96
F Observed 2.00 2.00
Expected 3.31 0.69

82
Table 17
Observed and Expected Frequencies for Hypothesis 7
Biology 1 Grade
Biology 2 Honors/AP
Grade
Met Criteria
(B or better)
Did Not Meet
Criteria
A Observed 21.00 1.00
Expected 20.59 1.41
B Observed 53.00 1.00
Expected 50.53 3.47
C Observed 35.00 4.00
Expected 36.49 2.51
D Observed 19.00 1.00
Expected 18.71 1.29
F Observed 3.00 2.00
Expected 4.68 0.32

83
Table 18
Observed and Expected Frequencies for Hypothesis 8
Chemistry 1 Grade
Chemistry 2 Honors/AP
Grade
Met Criteria
(B or better)
Did Not Meet
Criteria
A Observed 195.00 4.00
Expected 191.28 7.72
B Observed 153.00 7.00
Expected 153.79 6.21
C Observed 63.00 2.00
Expected 62.48 2.52
D Observed 8.00 4.00
Expected 11.53 0.47
F Observed 2.00 0.00
Expected 1.92 0.08

84
Table 19
Observed and Expected Frequencies for Hypothesis 10
Environmental Education 1 Grade
Environmental Education 2
Grade
Met Criteria
(C or better)
Did Not Meet
Criteria
A Observed 60.00 0.00
Expected 57.01 2.99
B Observed 74.00 3.00
Expected 73.17 3.83
C Observed 36.00 1.00
Expected 35.16 1.84
D Observed 16.00 5.00
Expected 19.96 1.04
F Observed 5.00 1.00
Expected 5.70 0.30