preparation of silver nanoparticle loaded cotton threads to · pdf file ·...
TRANSCRIPT

NIST Special Publication 1200-8
Preparation of silver nanoparticle loaded cotton
threads to facilitate measurement development
for textile applications
Version 1.0
J. M. Gorham
K. Murphy
J. Liu
D. Tselenchuk
G. Stan
T. M. Nguyen
R. D. Holbrook
M. Winchester
R. F. Cook
R. I. MacCuspie
V. A. Hackley
This publication is available free of charge from:
http://dx.doi.org/10.6028/NIST.SP.1200-8

NIST Special Publication 1200-8
Preparation of silver nanoparticle loaded cotton
threads to facilitate measurement development
for textile applications
Version 1.0
J. M. Gorham
J. Liu
D. Tselenchuk
G. Stan
T. M. Nguyen
R. D. Holbrook
V. A. Hackley
R. F. Cook
Material Measurement Science Division
Material Measurement Laboratory
K. Murphy
M. Winchester
Chemical Sciences Division
Material Measurement Laboratory
R. I. MacCuspie
Florida Polytechnic University
Lakeland, FL
This publication is available free of charge from:
http://dx.doi.org/10.6028/NIST.SP.1200-8
January 2015
U.S. Department of Commerce
Penny Pritzker, Secretary
National Institute of Standards and Technology
Willie May, Acting Under Secretary of Commerce for Standards and Technology and Acting Director

Certain commercial entities, equipment or materials may be identified in this
document in order to describe an experimental procedure or concept adequately.
Such identification is not intended to imply recommendation or endorsement by the
National Institute of Standards and Technology, nor is it intended to imply that the
entities, materials or equipment are necessarily the best available for the purpose.
National Institute of Standards and Technology Special Publication 1200-8
Natl. Inst. Stand. Technol. Spec. Publ. 1200-8, 21 pages (January 2015)
CODEN: NSPUE2
This publication is available free of charge from:
http://dx.doi.org/10.6028/NIST.SP.1200-8

iii
FOREWORD
This NIST Special Publication (SP) is one in a series of NIST SPs that address research needs
articulated in the National Nanotechnology Initiative (NNI) Environmental, Health, and Safety
Research Strategy published in 2011 [1]. This Strategy identified a Nanomaterial Measurement
Infrastructure (NMI) as essential for science-based risk assessment and risk management of
nanotechnology-enabled products as pertaining to human health, exposure, and the environment.
NIST was identified as the lead federal agency in the NMI core research area of the Strategy.
This research area includes development of measurement tools for the detection and
characterization of engineered nanomaterials in nanotechnology-enabled products. Textiles
containing silver nanoparticles, the focus of this SP, are consumer products of great interest for
nanotechnology environmental, health, and safety (nano-EHS) research and for product
regulation.
The protocol presented in this SP describes a strategy for developing a validation known to
contain silver nanoparticles loaded onto the surface of a cotton thread. These validation threads
can be used to test the capabilities of various analytical methods to characterize silver
nanoparticles in textiles. Updates to this protocol may be released in the future. Visit
http://nist.gov/mml/np-measurement-protocols.cfm to check for revisions of this protocol or for
new protocols in the series. We also encourage users of this protocol to reference it in their
publications.

1
1. Introduction Silver (Ag) has long been used for its antiseptic qualities. These qualities are attributed to the
surface oxidation of metallic Ag to Ag (+1) and a ligand (Ag0 Ag(I)L) followed by the
generation of an ion (Ag+) which can be toxic to many bacteria and fungi. Efforts to exploit this
process have led to the widespread incorporation of Ag nanoparticles (AgNPs) into many
consumer products as an anti-microbial agent. Their small size and large surface area to volume
(SA/V) ratio result in increased rates of oxidation and subsequent dissolution compared to larger-
scale forms of Ag. The enhancement of Ag+ formation due to increased SA/V ratios has led to
the incorporation of AgNPs into composites and textiles with the aim of enhancing their anti-
microbial efficacy. As highlighted in a recent review [2], the widespread usage of AgNPs has led
to increased concerns regarding risk for humans and the environment. In the NNI 2011 EHS
Research Strategy [1], risk is broadly defined as the product of hazard × exposure. In order to
address the second component of this equation, a set of instrumentation must first be identified
and proven to be capable of detecting AgNPs in consumer products and when released from
products by testing controls known to have an AgNP component. Such an assessment is
necessary to determine the potential for human or environmental exposure to AgNPs from
clothing, bandages, toys, towels, etc. This SP provides a well-defined protocol for the generation
of a control material to aid in the assessment of an instrument’s measurement capabilities for
detecting AgNP in textiles.
There are two approaches for assessing AgNP characteristics and potential for transformation
due to their surroundings. The first focuses on the AgNPs and examines their formation and
stability in various environments [3-5], using the information learned towards predicting likely
behavior in applications after incorporation into a material or product. The scientific
understanding gained from studying the formation and stability of AgNPs in various
environments can be used to provide engineering guidance for the safe storage and handling of
AgNP suspensions [4] and for the development of AgNP reference materials [1, 5] for
instrument calibration or measurement intercomparison. The second approach focuses on AgNP
-containing products, such as textiles, and examines the release of Ag in various environments
[6], using the information learned towards assessing the binding strength of Ag to a textile. The
engineering understanding gained from this approach can provide guidance for product handling
and scientific insights into how AgNPs could be treated to control binding and release.
Researchers at NIST have followed both of these approaches. However, attempts to characterize
and quantify specific properties of AgNP-containing textile products accurately (e.g., particle
size, shape, number density, total Ag concentration, oxidation state) have been hindered by
unknown variables in the products including the material identity of textile fibers, size of the
nano-particulate Ag added to the textile, and the heterogeneity of the Ag within the consumer
products. Furthermore, the presence of an actual “nanoparticle” form of Ag within these
products was often unclear.
This SP provides a tool to evaluate an instruments effectiveness in characterizing AgNPs within
consumer products that has been designed from aspects of the two aforementioned approaches.
Specifically, a protocol for the preparation of a test material, more relevant than free AgNP
suspensions, less complex than a Ag-containing commercial textile product and known to have

an AgNP component, has been developed. AgNPs for the test material are generated by a
solution-based reduction technique while cotton threads are fully immersed in the solution. The
threads are then examined using analytical techniques typically employed by researchers to
characterize AgNPs [3,4,6].
2. Principles and Scope The chemical reduction of Ag+ to form AgNPs stabilized with citrate is a commonly utilized
synthesis method designed to make a relatively uniform suspensions of particles in water,
typically with a particle diameter near 20 nm [3, 4]. These suspensions are employed in studies
involving stability, fate and transport as well as in further processing to yield more chemically
complex systems. This SP details a protocol where Ag+ reduction is used for the in-situ loading
of citrate-capped AgNPs onto the surface of cotton threads. This protocol provides a step-wise
method to form AgNP for use in developing validation samples for determining the effectiveness
of various analytical techniques commonly used in the characterization of consumer products
containing AgNPs. The current protocol describes the preparation of AgNP loaded cotton
threads: a baseline (control) thread containing no Ag and five threads containing progressively
higher levels of Ag loading. In the remainder of the SP, validation samples were characterized
by a suite of measurement techniques.
3. Terminology
Nanoscale: Characterized by a dimensions between approximately 1 nm and 100 nm [7]
Engineered nanomaterial: Materials that have been purposely synthesized or manufactured to
have at least one external dimension of approximately 1 to 100 nanometers (nm) and that exhibit
unique properties determined by this size [1]
Nanoparticle: Sub-classification of ultrafine particle that is characterized by at least two
dimensions in the nanoscale [7]; also referred to as “nano-object” [8]
Textile: Flexible woven material consisting of a network of natural or artificial fibers often
referred to as thread or yarn [9]
Loading: Incorporation of Ag-NPs into cotton threads via a chemical solution-based method
4. Materials and equipment 4.1 Starting materials
4.1.1 12 sections (≈56 cm each) of white cotton thread1 (Gutermann). Each thread consists of a
number of fibers.
4.1.2 Deionized (DI) water source.
4.1.3 Silver nitrate powder (0.36 g) (>99 % purity, Sigma Aldrich).
4.1.4 Trisodium citrate dihydrate powder (0.48 g) (Sigma Aldrich, meets US Pharmacopeia
testing specifications).
4.1.5 Sodium borohydride powder (0.40 g) (99.99 % purity, Sigma Aldrich).
1 The total number of threads may vary depending on the number of loadings and controls

4.2 Glassware and standard equipment
4.2.1 6 cleaned2 medium graduated borosilicate glass beakers (≈ 250ml capacity).
4.2.2 6 cleaned Teflon stir bars.
4.2.3 3 cleaned small borosilicate glass beakers (50 mL to 100 mL capacity).
4.2.4 6 heated stir plates1.
4.2.5 Aluminum foil3 .
4.2.6 Cleaned glass covers2,3.
4.2.7 2 cleaned large beakers (>500 mL).
4.3 Measurement Equipment
4.3.1 Analytical balance and plastic weigh boats.
4.3.2 Thermometer3.
4.3.3 A 10 mL and a 100 mL graduated cylinder.
4.3.4 Calibrated Eppendorf pipettes (capacity 10 µL to 10 mL)1.
4.3.5 Characterization instruments4.
4.3.5.1 Atomic Force Microscopy (AFM): Images were acquired using MultiMode Bruker
(Santa Barbara/California) AFM equipped with PPP-SEIH integrated silicon probes
from NanoSensors (Neuchatel/Switzerland).
4.3.5.2 Field Emission Scanning Electron Microscopy (FE-SEM): Images were acquired
using a Hitachi S-4700, operated at an acceleration voltage of 3 keV. Sputtering was
performed with a Denton Vacuum Desktop III system.
4.3.5.3 Energy Dispersive X-ray Spectroscopy (EDS): Quanta 200 environmental SEM
(ESEM) from FEI (Hillsboro, OR)
4.3.5.4 Inductively Coupled Plasma-Mass Spectrometry (ICP-MS): Mass spectrometric
analyses were performed on a ThermoFisher Scientific X series II ICP-MS.
4.3.5.5 X-ray Photoelectron Spectroscopy (XPS): XPS spectra were acquired on an Axis
Ultra DLD spectrophotometer (Kratos Analytical, Chestnut Ridge, New York).
5. Preparation and loading of AgNPs onto cotton threads 5.1 Immerse the sections of cotton thread in DI water in a large beaker to wash off any
contaminants, salts and/or small particulates that are loosely bound to the surface.
5.2 Label the six beakers with numbers 1 to 6. These numbers correspond to the validated
thread numbers in Table 1. Note that sample 6 is the control thread that contains no Ag. For
these preparations, the control was prepared on a separate day.
5.3 Fill each medium beaker with ≈150 mL of DI water and place them on a heated stir plate.
Into each beaker, add a stir bar and spin at a rate where a vortex is visible in the water. Heat
1 Variable depending on the number of loadings and controls 2 Cleaning of new glassware was accomplished by rinsing with DI water and drying. Used glassware was first soaked in a 2 % to 5 % cleaning solution of Contrad 70 prior to rinsing triply with DI water. 3 Optional 4 Instruments used to generate data for this SP are presented here. Refer to disclaimer on pg. 3.
the water to 97 °C to 100 °C (or to a gentle boil). Optional: To expedite heating, the outer
surfaces of the beaker can be wrapped in Al foil.
5.4 While heating, add the cleaned lengths of thread to the water. Add two threads to a beaker.
So that the threads can be easily removed later and to avoid the creation of knots in the line,
leave one end of each thread outside of the beaker and secure this with tape. Ensure that the
thread is secure in its attachment because once exposed to the tape’s adhesive, addition of
that end of the thread to the solution/suspension could introduce contamination.
5.5 While the water is heating, prepare the following two solutions.
Silver nitrate (AgNO3) solution: Into the first small beaker, add 0.36 g of AgNO3 into
20 mL of DI water to form a 0.11 mol • L-1 solution of AgNO3 ([Ag+] = 0.11 M). Ensure
that the powder completely dissolves.
Citrate solution: In a second small beaker, add 0.48 g of trisodium citrate dihydrate
(Na3C6H5O7 • 2H2O) to 30 mL of DI water to form a 0.054 mol • L-1 solution of. Ensure
that the solid completely dissolves.
5.6 When the water temperature is > 90 °C, prepare a third solution containing sodium
borohydride (NaBH4). To a small beaker with 40 mL of DI water, add 0.40 g of NaBH4 to
create a 0.26 mol • L-1 solution of NaBH4. Ensure that the powder completely dissolves.
5.7 Once the water reaches a slow steady boil record the temperature and increase stir speed so
that the vortex formed in the center goes between ½ to ¾ of the way to the bottom of the
beaker. Steadily add your prepared solutions (steps 5.5 and 5.6) in the quantities indicated
in Table 1 for validation thread 1. Use an Eppendorf pipette that is designed to work with
the specified volumes. The following order of addition must be performed rapidly (ideally,
< 10 min). Complete steps 5.7.1 – 5.7.3 one loading concentration at a time:
5.7.1 First, add the citrate solution to the beaker. Ensure that the temperature is still 97 °C to
100 °C before proceeding.
5.7.2 Next add the Ag nitrate to the same beaker. Once this is added quickly record the
temperature again and move on immediately to the final addition.
5.7.3 Drop-wise add in the sodium borohydride. It is important to ensure that the addition of
this solution slowly especially for validation thread 1, which has the greatest
concentration of Ag0 (around 1 mL • min-1). For most of the intended [AgNP] in Table 1,
addition of NaBH4 should immediately cause a color change from clear to dark
yellowish/brown. By design, this reducing agent is added in excess and therefore should
convert all Ag+ to Ag0. NOTE: If AgNO3 concentrations are too high, aggregation may
be unavoidable.

5.7.4 Repeat steps 5.1.6.1-5.1.6.3 for the remaining validation threads. (Validation thread 6 is
the positive control and is not treated with the three solutions.)
5.8 Allow the temperature to remain just below boiling for ≈ 30 min with stirring. After 30 min
turn off the heat and stirring.
5.8.1 Optional: To obtain an approximation of the size and concentration of AgNPs that were
formed in suspension, remove a 5 ml aliquot from each, cool, and perform desired
measurements (e.g., UV-vis, DLS, ICP-MS).
5.9 Cover the beaker with either a glass cover or parafilm and cool for >12 h. Shield all
samples from light with Al foil to prevent photoreactions from occurring.
5.10 Once the suspension has cooled, fill a large beaker half way with DI water to wash loosely
bound particles and/or aggregates from the AgNP-loaded threads.
5.11 While holding the thread ends, remove the tape from the side of the first container (the
highest Ag concentration solution/suspension/loading). Aggregation may be visible in the
beaker as sediment, floating material and/or as a coating on the thread, and the two threads
may be tangled together. Lift the threads out of the beaker.
5.12 First, dip the threads into the clean DI water and move them in a circular motion in order to
wash the threads. Ensure that the entirety of the coated thread is submerged with the
exception of the section that was taped/out of the suspension. The loose aggregates may be
removed and loosely attached AgNPs may become detached. As a result, the DI water may
change to a light shade of yellow and/or have visible aggregates floating in the cleaning
water.
5.13 If the threads were tangled, untangle them and repeat step 5.1.10.
5.14 Hang each thread to air dry. This can be done by fixing the previously taped end
(presumably Ag free) to a horizontal bar. Make sure that the drying lengths of the thread do
not touch anything, including each other.
5.15 Properly dispose of wash water as nanoparticle aqueous waste.
5.16 Repeat steps 5.10 to 5.15 separately for validation threads 2, 3, 4, 5, and 6 (see Table 1).
Complete all steps for one thread number before proceeding to the next thread number.
5.17 Once washing is completed and the threads are dried, remove the hanging threads from their
drying location. Cut off the end of the thread that was taped/out of suspension to ensure no
contamination is transferred to the final product. For example, if 2.5 cm was held by the
tape, then 2.5 cm or more of that end should be removed from the final product. This end
should be properly disposed of as nanoparticle waste.
5.18 Use gloves or tweezers to move the threads into containers; validation threads with different
numbers must be stored in different containers so as to prevent cross contamination which
could skew future measurements of the surface concentrations.
5.18.1 Figure 1 (A) provides photographs of the typical appearance of the validation threads,
listed by their estimated [Ag0] from Table 1. Estimated [Ag0] are based on 100 %
conversion to metallic AgNP in suspension, zero loss of Ag to adsorption or aggregation,
and zero loss of volume due to the evaporation. As a result of these assumptions
(especially the zero-loss due to evaporation), it is emphasized that the reported ‘estimated
[Ag0]’ are estimates of suspensions for internal comparison and should not be considered
quantitatively accurate for validation threads.
5.19 Store the threads away from light until needed for characterization. When smaller sections
of a validation thread are cut for samples, the sections should be stored in the same manner
unless reported otherwise.
6 Procedures for Measurement of Threads 6.1 AFM: AFM was employed to image micrometer-scale areas of AgNP-loaded threads using
tapping mode. To immobilize a thread for measurement, single fibers were removed from
the thread and pinned on glass slides with epoxy glue at the thread ends. Prior to scanning,
the AFM probe used was visually guided under the optical microscope of the AFM to land
the tip on the target fiber. The acquired AFM topography images were flattened in the
second order to account for the roundness of the fiber.
6.2 FE-SEM: An additional set of AgNP loaded validation threads were freshly prepared to
examine the potential of confirming the presence of nanoparticles using FE-SEM. About 1
cm lengths of the threads were cut and attached to an SEM specimen holder using double-
sided carbon tape. To minimize charging and increase magnification of the surface,
selected threads were sputter-coated with a layer of gold no more than 10 nm in thickness
using a Denton Vacuum Desktop III system.
6.3 EDS: Elemental compositions were determined from spectra acquired at acceleration
voltages of 10 kV and 20 kV. Thread samples were adhered to double-sided copper tape
and spectra were acquired without additional coatings. Weight percentages were calculated
for all detected elements using commercially available software. 6.4 ICP-MS: ICP-MS was used to measure the total silver in the prepared threads. Three sub-
samples per loaded thread of approximately equal length were prepared for analysis by
cutting with clean Teflon scissors; except for the control, where only one sub-sample was
processed. The mass of each analyzed sub-sample was measured on a calibrated Mettler AT
20 analytical balance. Sub-sample masses ranged from nominally 1.6 mg to 2.3 mg.
Samples were placed in clean 50-mL Perfluoroalkoxy (PFA) Teflon beakers with 1 g
concentrated nitric acid (HNO3) (Optima grade, Thermo Fisher Scientific, Waltham, MA,
USA), covered and refluxed on a hot plate at high heat for 40 min. An additional 1 g HNO3
was added and samples were refluxed for an additional 40 min. The thread was observed to
completely dissolve. Samples were taken to dryness, re-dissolved in 2 % volume fraction
HNO3, and quantitatively transferred to clean, tared, low-density polyethylene bottles,
forming the first serial dilution. After the addition of nominally 2 µg/kg indium (In)
internal standard, samples were quantitatively diluted a second time, to an analysis
concentration of nominally 5 µg/kg Ag.

From the mass spectrometric analyses, the mass fraction of Ag in each sample was
calculated from the using an external calibration curve. Temporal changes in signal
intensity resulting from effects of the cotton thread were corrected via the In internal
standard.
6.5 XPS: Threads were mounted so as to be elevated to minimize contributions to the spectra
from the sample holder. Presented spectra were acquired using monochromatic Al Kα X-
rays acquired at 40 eV pass energy over a variety of spot sizes, up to 250 µm. Weight
percentages were calculated from atomic percentages that were based on the elemental
relative sensitivity factor (RSF) corrected areas for carbon, oxygen, silicon and silver. RSFs
were obtained from the instrument manufacturer.
7 Outcomes
7.1 Visible observations can be quite instructive as a starting point regarding whether or not the
cotton threads have been successfully loaded with AgNPs (see Figure 1(A)). Specifically,
the characteristic yellow/brown color representative of AgNP suspensions (see Figure 1(B)
as an example from a separate study) is observed on the threads in varying shades, from a
dark yellow/brown in validation thread 1 to a faint yellow for validation threads 4 and 5[3,
4]. This should be especially evident since a white thread was employed (see control in
Figure 1 (A)). Validation thread 1 appeared yellow/brown after washing even though
aggregation occurred suggesting a highly localized reaction.
7.2 Microscopy based measurements
7.2.1 AFM measurements provided evidence of particulate deposition on the surface of the
thread fibers as demonstrated by comparing the images shown in Figure 2(A) and 2(B)
for zero-Ag control and the highest Ag loading, respectively. After image processing, the
control in Figure 2(A) was found to be devoid of any particles while Figure 2(B)
appeared to have a significant fraction of particles and aggregates with heights measuring
between 20 nm and 40 nm. While AFM is quite useful and successful at identifying
nanoparticles on the Ag-loaded threads (data not shown for the remaining threads), it is
important to note that nanoscale features were not found at every analysis point and
required some searching.
7.2.2 SEM images were acquired on three samples that were from a small batch of Ag loaded
cotton threads prepared separately from those listed in Table 1 and presented in Figure
1(A). Figure 3 demonstrates the morphological characteristics of the individual fibers.
As can be observed, the fibers transform from being smooth and devoid of features in
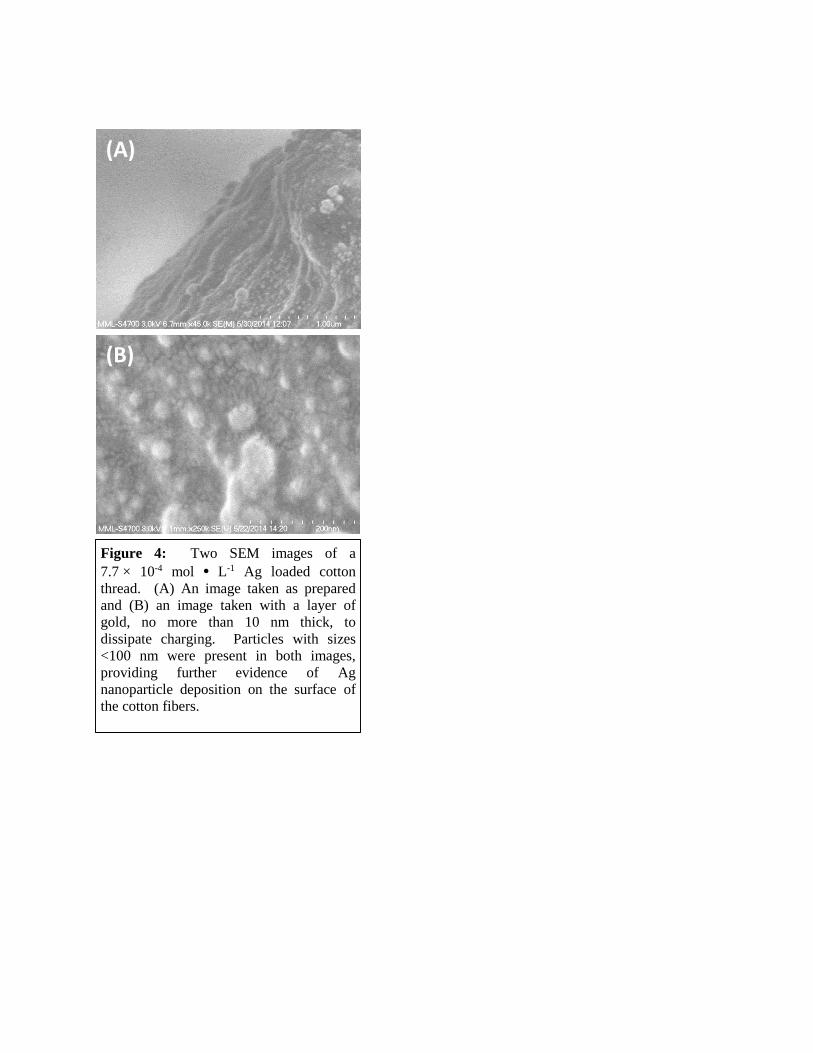
their zero-loading state (control thread) to increasingly irregular with large adsorbed
particulates with increasing estimated [Ag0]. Figure 4 demonstrates higher resolution
images for the 7.7 × 10⁻⁴ mol • L-1 [Ag0] samples only. Figure 4 (A) demonstrates the
presence of nanoscale particles on the surface of this thread in addition to
features/aggregates >100 nm in size. Figure 4 (B) reveals the presence of particles from
20 nm and greater in diameter with the alleviation of charging effects by a gold coating
less than 10 nm in thickness. It was not possible to differentiate between particles
smaller than 20 nm and the gold coating, which is known to produce nanoparticles on the

order of 10 nm and less. However, the presence of nanoscale features in Figure 4(A) and
EDS spectra (data not shown), which revealed the presence of Ag on the thread’s surface,
suggested that the nanoparticles > 20 nm observed in Figure 4 (B) were indeed AgNPs.
7.3 Spectroscopy based measurements
7.3.1 ICP-MS measurements demonstrated an increase in the total measured Ag concentration
(see Table 2) with increased estimated [Ag0]; the results are plotted in Figure 5(A). The
observed variability between subsamples for the highest four Ag loadings (validation
threads 1 to 4) is greater than the expected variability of the measurement method (5 %,
relative), indicating some heterogeneity in the Ag content along the length of a thread.
7.3.2 XPS measurements demonstrated an increase in the surface Ag content with increased
estimated [Ag0], (see Figure 6). The Ag loading increased from zero Ag measured on the
control thread to a mass percentage of 8.5% ± 1.2 % (average and range of 2 points) for
validation thread 1 (highest Ag loading, Figure 5(B)). On average, surface Ag
concentration increased with increasing estimated [Ag0], although some thread loadings
revealed a larger degree of heterogeneity than others. XPS measurements suggested a
surface enhancement for a given validation thread when compared to ICP-MS.
7.3.3 EDS Measurements were consistent with both XPS and ICP-MS measurements, with the
measured Ag concentration on the thread increasing with increased estimated [Ag0] (See
Figure 5(C)). In further support for a surface enhancement of Ag deposition, there was a
clear increase in the measured Ag weight percentage at lower accelerating voltages,
which one would expect if AgNPs were adsorbed at higher concentrations on the thread
surfaces.
7.4 Discussion of Outcomes
Several different microscopy-based techniques have been employed in conjunction with
spectroscopic and chemical analysis to provide evidence of AgNPs loaded onto the surface
of the cotton threads. Both AFM and SEM images revealed the presence of particles loaded
onto the threads with dimensions at the nanoscale, in addition to other aggregates/
agglomerates/features that were of larger size.
Ag-loaded cotton threads consistently had a significantly greater mass % of Ag measured at
the surface as observed by comparing XPS and ICP-MS measurements (Figure 5(A) and
5(B)). This finding was further corroborated by EDS measurements (Figure 5(C)) which
yield Ag mass % values typically falling between the XPS and ICP-MS values. This
suggests that the Ag was predominantly adsorbed via reduction on or near the cotton fiber’s
surface as opposed to absorption and reduction of Ag within the bulk of the thread. This
conclusion is supported by Figure 7, which is a plot of Ag concentration in the threads
measured by XPS vs that measured by ICP-MS. The two techniques show good correlation
over all but the highest concentration ranges measured, as indicated by the upper solid line
representing a linear relationship. The lower dashed line in Figure 7 is representative of
identical surface and bulk compositions; data lying above this line indicates a surface
enhancement. As is clearly depicted by the upper solid line in Figure 7, a surface

enhancement factor of approximately 30 is what was observed for the four lower estimated
[Ag0] values.
8 Abbreviations
AFM Atomic Force Microscopy
AgNP Ag nanoparticle
DI Deionized
EDS Energy Dispersive X-ray Spectroscopy
eV electron volt
FE-SEM Field Emission Scanning Electron Microscopy
ICP-MS Inductively Coupled Plasma Mass Spectrometry
Nano-EHS Environmental, Health and Safety as it pertains to nanomaterials
NNI National Nanotechnology Initiative
UV-vis Ultraviolet Visible Spectroscopy
Wt% Weight percent
XPS X-ray Photoelectron Spectroscopy
9 Acknowledgements We would like to thank Debra Kaiser for her direction and vision in the characterization of
nanomaterials in consumer products, from which the development of this protocol derived.
10 References 1. National Nanotechnology Initiative: Environmental, Health and Safety Research Strategy. 2012,
Presidents Council of Advisors on Science and Technology: National Science and Technology Council Committee on Technology: Washington, DC.
2. Wijnhoven, S.W.P., et al., Nano-silver – a review of available data and knowledge gaps in human and environmental risk assessment. Nanotoxicology, 2009. 3(2): p. 109-138.
3. Gorham, J.M., et al., UV-induced photochemical transformations of citrate-capped silver nanoparticle suspensions. Journal of Nanoparticle Research, 2012. 14(10).
4. Gorham, J.M., et al., Storage Wars: how citrate-capped silver nanoparticle suspensions are affected by not-so-trivial decisions. Journal of Nanoparticle Research, 2014. 16(4).
5. MacCuspie, R.I., et al., Just add water: reproducible singly dispersed silver nanoparticle suspensions on-demand. Journal of Nanoparticle Research, 2013. 15(7).
6. Benn, T.M. and P. Westerhoff, Nanoparticle Silver Released into Water from Commercially Available Sock Fabrics. Environ. Sci. Technol., 2008. 42: p. 4133-4139.
7. ASTM, E2456-06(2012): Standard terminology relating to nanotechnology. 2012. 8. ISO, IS TS 80004-1:2010: Nanotechnologies-Vocabulary - Part 1: Core Terms. 2010, ISO: Geneva,
Switzerland. 9. Wikipedia. http://en.wikipedia.org/wiki/Textile.
Figures and Tables for SP
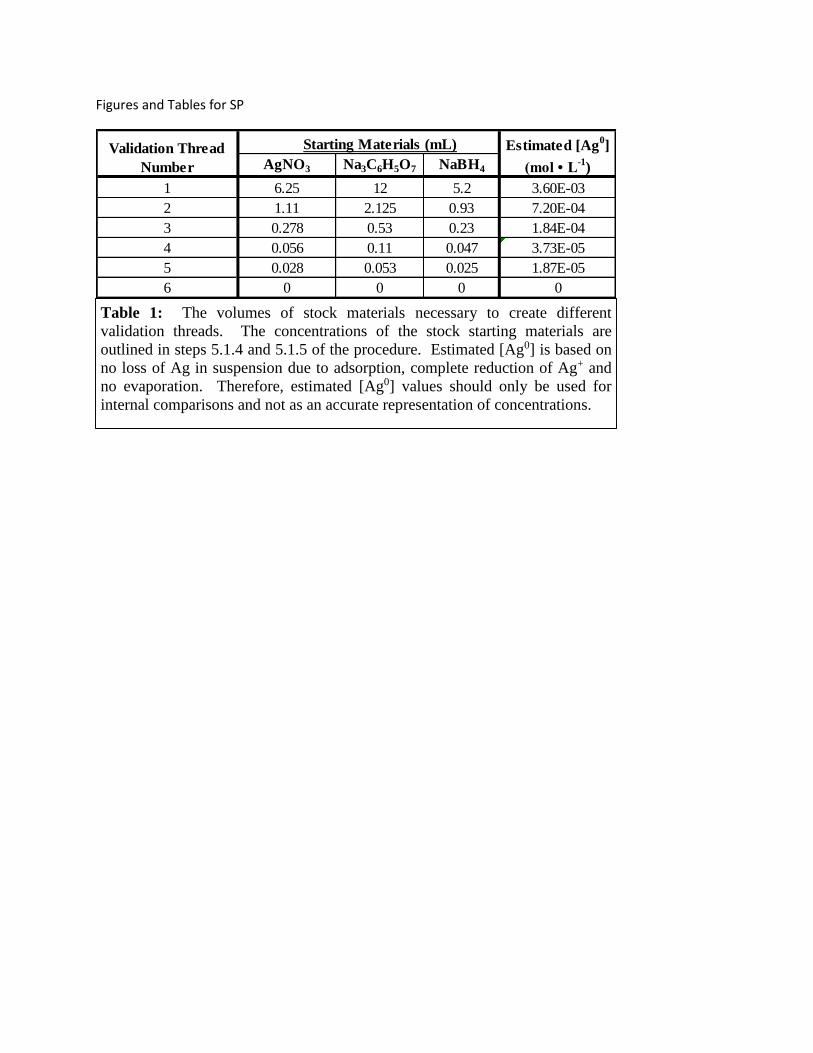
Table 1: The volumes of stock materials necessary to create different
validation threads. The concentrations of the stock starting materials are
outlined in steps 5.1.4 and 5.1.5 of the procedure. Estimated [Ag0] is based on
no loss of Ag in suspension due to adsorption, complete reduction of Ag+ and
no evaporation. Therefore, estimated [Ag0] values should only be used for
internal comparisons and not as an accurate representation of concentrations.
Starting Materials (mL)
AgNO3 Na3C6H5O7 NaBH4
1 6.25 12 5.2 3.60E-03
2 1.11 2.125 0.93 7.20E-04
3 0.278 0.53 0.23 1.84E-04
4 0.056 0.11 0.047 3.73E-05
5 0.028 0.053 0.025 1.87E-05
6 0 0 0 0
Validation Thread
Number
Estimated [Ag0]
(mol • L-1
)
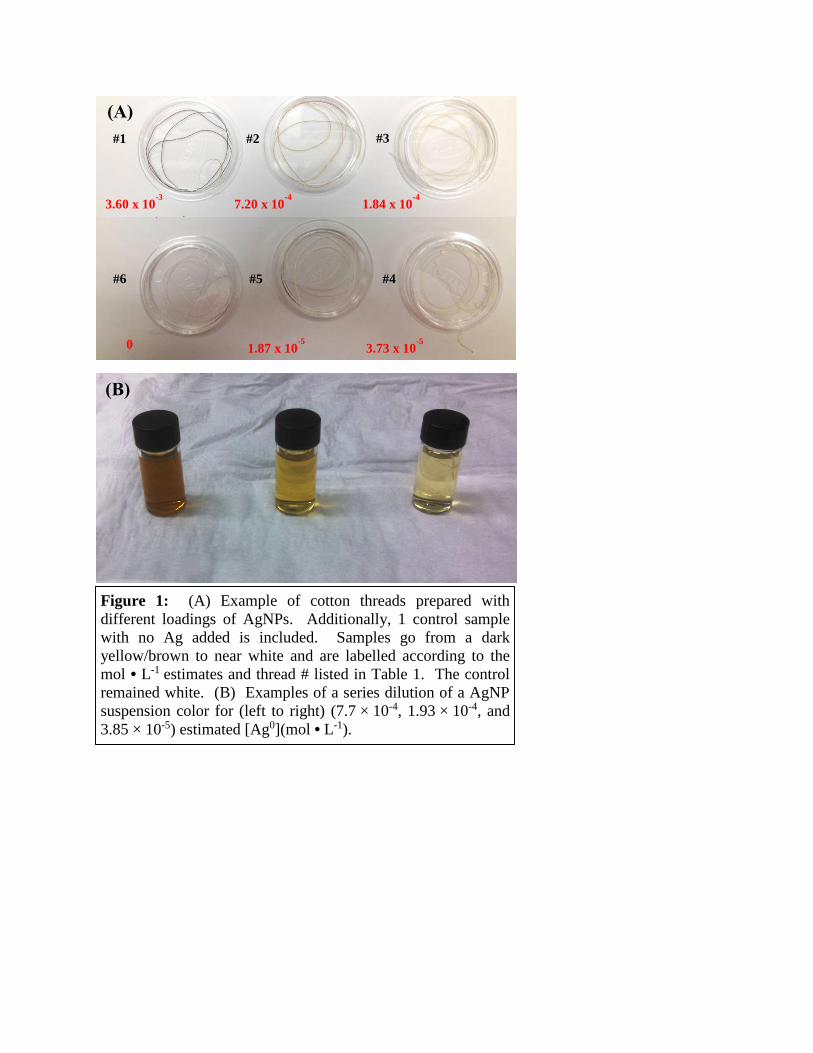
Figure 1: (A) Example of cotton threads prepared with
different loadings of AgNPs. Additionally, 1 control sample
with no Ag added is included. Samples go from a dark
yellow/brown to near white and are labelled according to the
mol • L-1 estimates and thread # listed in Table 1. The control
remained white. (B) Examples of a series dilution of a AgNP
suspension color for (left to right) (7.7 × 10⁻⁴, 1.93 × 10⁻⁴, and
3.85 × 10⁻⁵) estimated [Ag0](mol • L-1).
3.60 x 10⁻³ 7.20 x 10
-4 1.84 x 10
-4
0 1.87 x 10⁻⁵ 3.73 x 10
-5
(A)
(B)
#1 #2 #3
#6 #5 #4

Figure 2: AFM micrographs of thread surfaces. (A) A fiber from validation
thread 6, the control, with no evidence of particles adsorbed to the surface and (B)
a fiber from the preparation of the highest Ag concentration, validation thread 1,
with evidence for isolated, nanoscale particles and aggregates on its surface.
(A) (B)

Figure 3: Images of three, as prepared
cotton threads. Fibers were freshly
prepared in at estimated [Ag0] of (A)
validation thread 6, (B) an intermediate
Ag loading (1.97 × 10⁻⁴ mol • L-1) and (C)
a high Ag loading
(7.7 × 10⁻⁴ mol • L-1).
(A)
(B)
Figure 4: Two SEM images of a
7.7 × 10⁻⁴ mol • L-1 Ag loaded cotton
thread. (A) An image taken as prepared
and (B) an image taken with a layer of
gold, no more than 10 nm thick, to
dissipate charging. Particles with sizes
<100 nm were present in both images,
providing further evidence of Ag
nanoparticle deposition on the surface of
the cotton fibers.

Table 2: ICP-MS measurements and standard deviations for three
sub-samples per level of the AgNP loaded threads and one sample
of the control.
Estimated [Ag0] Measured Ag
mol • L-1
ICP mass% S.D
1 3.60E-03 3.1 2.4
2 7.20E-04 0.142 0.02
3 1.84E-04 0.0365 0.0089
4 3.73E-05 0.0219 0.0027
5 1.87E-05 0.01258 0.0005
6 0 0.0001 N/A
Validation Thread
Number

Figure 5: Plots of measured Ag
concentration on exposed cotton threads
as a function of estimated [Ag0]. (A) ICP-
MS measured total Ag in and on the
thread; (B) XPS measured surface
concentration on the thread; and (C) EDS
measures predominantly surface Ag, with
a depth sensitivity that increases with
accelerating voltage (shown). The straight
lines are guides to the eye indicating
linear relationships.

Figure 6: XPS spectra of the Ag (3d) region
for the five cotton threads loaded with AgNP.
*XPS acquisition for validation thread 1
collected photoelectron intensity from roughly
¼ the area, acquiring ¼ the signal, as compared
to the remaining fibers.

Figure 7: Plot of Ag concentration measured by (surface
sensitive) XPS vs (bulk sensitive) ICP-MS. The straight
lines are guides to the eye, representing linear
relationships. The lower, dashed line represents identical
surface and bulk concentrations; the data suggest
significant surface enhancement. Average and standard
deviation is representative of three samples measured by
ICP-MS and >2 spots by XPS.