presentation fy 2019-2023 five-year forecast 11-21-2017 · peak months since peak employment u.s....
TRANSCRIPT

Five-Year ForecastFive-Year Forecast
Greg Grootendorst, Chief Economist at Hampton Roads Planning District Commission
David Bradley, Director of Budget and Management Services
Farrell Hanzaker, Chief Financial Officer at VBC Public Schools
Greg Grootendorst, Chief Economist at Hampton Roads Planning District Commission
David Bradley, Director of Budget and Management Services
Farrell Hanzaker, Chief Financial Officer at VBC Public Schools

2012 REGIONAL FORECAST
Presented to:the City of
Virginia Beach
Greg GrootendorstChief EconomistNovember 21, 2017
Hampton RoadsEconomic Briefing

% Who Worked Outside County of Residence
1 35
% of People Who Have a Bachelor's Degree
1 35
Median Age 1 35
Gini Coefficient (Measure of Income Equality) 1 35
% of Renter’s Spending >30% of Income on Housing
1 35
Per Capita Income 1 35
% of Veterans in the Civilian Population
1 35
Highest Value Lowest Value
15.9 %
47.7%
26.3%
$31,622
.44
35.9
31.4%
3
1
19
5
29
25
33
HR Rank in the Comparable Metro Areas
2016 American Community Survey Data for Hampton Roads
Hampton Roads Regional Benchmarking StudyPresentation to Virginia Beach

Hampton Roads Regional Benchmarking Study
Source: Bureau of Economic Analysis and HRPDC
$50
$55
$60
$65
$70
$75
$80
$85
$90
Billion
s of 2
009 Dollars
Non‐ZeroAxis
4
Hampton Roads Gross ProductInflation‐Adjusted 2009 Dollars
Presentation to Virginia Beach

Annualized Percent Change in Total Employment
Hampton Roads Regional Benchmarking Study
Source: Bureau of Economic Analysis and HRPDC
1.07%
0.0%0.5%1.0%1.5%2.0%2.5%3.0%3.5%4.0%4.5%
Annu
alize
d Ch
ange in
Employmen
t(201
2 ‐2
015)
Metropolitan Areas with Population between 1 and 3 Million
U.S. Metro Area Average is 2.19%
5Presentation to Virginia Beach

Employment Decline and Recovery
‐8%
‐6%
‐4%
‐2%
0%
2%
4%
6%
8%
Percen
t Job
Loss R
elative to Peak
Months Since Peak Employment
U.S. Virginia Hampton Roads
Source: Bureau of Labor Statistics, HRPDC
Presentation to Virginia Beach 6

10‐Year Employment Change in HRSeptember 2007 – September 2017
Source: Bureau of Labor Statistics, HRPDC
ConstructionRetail Trade
Local GovernmentManufacturing
InformationReal Estate & Leasing
Wholesale TradeFinance & InsuranceState Government
Leisure & HospitalityAdministrative & SupportTransportation & Utilities
Other ServicesManagement
Education ServicesScientific & TechnicalFederal GovernmentHealthcare & Social
Change inEmployment
Presentation to Virginia Beach 7

1‐Year Employment Change in HRSeptember 2016 – September 2017
Retail TradeLeisure & HospitalityReal Estate & LeasingFinance & Insurance
InformationLocal GovernmentWholesale Trade
Federal GovernmentState Government
Scientific & TechnicalEducation Services
ManufacturingOther ServicesManagementConstruction
Transportation & UtilitiesHealthcare & Social
Administrative & Support
Change inEmployment
Source: Bureau of Labor Statistics, HRPDC
Presentation to Virginia Beach 8

U.S., Virginia, & Hampton Roads Unemployment Rate
(Seasonally Adjusted)
0%
2%
4%
6%
8%
10%
12%
Une
mploymen
t Rate
U.S. Hampton Roads Virginia
Source: Bureau of Labor Statistics, HRPDC
Presentation to Virginia Beach 9

Payroll Employment and Labor Force12 – Month Moving Average
700,000
720,000
740,000
760,000
780,000
800,000
820,000
840,000
860,000 Civilian Payroll Employment
Employed Civilians
Civilian Labor Force
Source: Virginia Employment Commission, HRPDC
Presentation to Virginia Beach 10

Initial Unemployment ClaimsDeseasonalized
0
1,000
2,000
3,000
4,000
5,000
6,000
7,000
8,000
9,000
Initial Claim
s per M
onth
Recessions
Source: Virginia Employment Commission, HRPDC
Presentation to Virginia Beach 11

75%
80%
85%
90%
95%
100%
105%
110%
Ratio
of H
ampton
Roa
ds PCI to
U.S. &
Virg
inia
Share of US PCI Share of Virginia PCI
Non‐ZeroAxis
Relative Per Capita Income
Hampton Roads Regional Benchmarking Study
Source: Bureau of Economic Analysis and HRPDC
12Presentation to Virginia Beach

U.S. and Hampton Roads Real Median Family Incomes
Hampton Roads Regional Benchmarking Study
Source: U.S. Census Bureau, American Community Survey and HRPDC
$0
$10,000
$20,000
$30,000
$40,000
$50,000
$60,000
$70,000
$80,000
Income in 201
5 Dollars
Hampton Roads U.S.
13Presentation to Virginia Beach

Earnings Per Worker(Inflation‐Adjusted)
Hampton Roads Regional Benchmarking Study
Source: Bureau of Economic Analysis and HRPDC
$0$5,000$10,000$15,000$20,000$25,000$30,000$35,000$40,000$45,000
Salary and
Wages Per Jo
b(201
5 $s)
Hampton Roads U.S.
14Presentation to Virginia Beach

Annualized Real Defense Outlays(U.S. Quarterly Data, Seasonally Adjusted)
Hampton Roads Regional Benchmarking Study
Source: Bureau of Economic Analysis and HRPDC
$0
$100
$200
$300
$400
$500
$600
$700
$800
$900
$1,000
Billion
s of R
eal D
ollars (2
016 $'s)
KoreanWar
War on Terror80's Cold War
BuildupVietnamWar
15
30% 41% 27%
Presentation to Virginia Beach

0%
5%
10%
15%
20%
25%
30%
Share of Total Employmen
t
Military Personnel as a Share of Hampton Roads Employment
Hampton Roads Regional Benchmarking Study
Source: Bureau of Economic Analysis and HRPDC
145K Personnel
86K Personnel
Since 1990
‐ 56,800Past 10 years
‐22,600
16Presentation to Virginia Beach

Defense Contracts in Hampton Roads(Inflation‐Adjusted)
Hampton Roads Regional Benchmarking Study
Source: USAspending.gov, Consolidated Federal Funds Report and HRPDC
$0
$2,000
$4,000
$6,000
$8,000
$10,000
$12,000
Millions of 2
016 Dollars
(5‐Year M
oving Av
erage)
Fiscal Year
17Presentation to Virginia Beach

Defense Expenditures and Statutory Budget Caps
Hampton Roads Regional Benchmarking Study
Source: Congressional Research Office, Congressional Budget Office and HRPDC
$400
$450
$500
$550
$600
$650
$700
$750
Billion
s in Projected Defen
se Spe
nding
Presidents Budget, 2012 Budget Control Act, 2011 American Taxpayer Relief Act, 2012 Bipartisan Budget Act, 2013 Bipartisan Budget Act, 2015 Actual Defense Expenditures
18Presentation to Virginia Beach

General Cargo in Hampton Roads
Hampton Roads Regional Benchmarking Study
Source: Port of Virginia and HRPDC
0
5
10
15
20
25
Millions of Sho
rt Ton
s
Exports Imports
19Presentation to Virginia Beach

Hampton Roads Employment in theLeisure and Hospitality Industry
Hampton Roads Regional Benchmarking Study
Source: Bureau of Labor Statistics and HRPDC
0
10,000
20,000
30,000
40,000
50,000
60,000
70,000
80,000
90,000
100,000
Employmen
t
20Presentation to Virginia Beach

Retail Share of Total Employment
Hampton Roads Regional Benchmarking Study
Source: Virginia Employment Commission and HRPDC
199013.2%
201611.4%
199012.0%
201611.0%
9.5%
10.0%
10.5%
11.0%
11.5%
12.0%
12.5%
13.0%
13.5%
Retail Em
ploymen
t as a
Percent of
Civilian Non
‐farm
Employmen
t
HR Share U.S. Share
Non‐ZeroAxis
21Presentation to Virginia Beach

Hampton Roads Retail Sales and Incomes(Inflation‐Adjusted)
Hampton Roads Regional Benchmarking Study
Source: Virginia Department of Taxation, Bureau of Economic Analysis and HRPDC
$0
$10
$20
$30
$40
$50
$60
$70
$80
$90
$0
$5
$10
$15
$20
$25 Personal Incomes, Billions of 2016 D
ollarsRe
tail Sales, Billions of 2
016 Dollars
Hampton Roads Retail Sales Hampton Roads Personal Incomes
22Presentation to Virginia Beach

Hampton Roads Retail Sales(Local Option Retail: 3‐Month Moving Average)
$1.2
$1.3
$1.4
$1.5
$1.6
$1.7
$1.8
$1.9
$2.0
Billion
s of D
ollars of Sales (Seasona
lly Adjusted)
Source: Virginia Department of Taxation, HRPDC
Presentation to Virginia Beach 23

Building Permits in Hampton Roads
Source: U.S. Census Bureau and HRPDC
0
2,000
4,000
6,000
8,000
10,000
12,000
Units Permitted
5 or More Units 3 or 4 Units 2 Units 1 Unit
24Presentation to Virginia Beach

Closings in Hampton Roads(Seasonally‐Adjusted)
Hampton Roads Regional Benchmarking Study
Source: Rose and Womble Residential Data Bank and HRPDC
0
500
1,000
1,500
2,000
2,500
3,000
Total Closings
New Resales
25Presentation to Virginia Beach

Home Price Index
80
90
100
110
120
130
14020
07 Q1
2008
Q1
2009
Q1
2010
Q1
2011
Q1
2012
Q1
2013
Q1
2014
Q1
2015
Q1
2016
Q1
2017
Q1
Hom
e Price Inde
x(200
0 Q1 = 10
0)
HR VA US
Sources: HRPDC and the Fair Housing Finance Agency
Presentation to Virginia Beach 26

Per Capita Local Revenues(Inflation‐Adjusted)
Hampton Roads Regional Benchmarking Study
Source: Auditor of Public Accounts, Weldon Cooper Center, BLS, and HRPDC
$0
$500
$1,000
$1,500
$2,000
$2,500
2016
Dollars Per Cap
ita
Other Local Taxes Local Sales and Use Tax Non‐Tax Revenue Personal Property Tax Real Property Tax
27Presentation to Virginia Beach

Per Capita Expenditure by Category, 2016
Hampton Roads Regional Benchmarking Study
Source: Auditor of Public Accounts, Weldon Cooper Center, BLS, and HRPDC
$0$200$400$600$800
$1,000$1,200$1,400$1,600$1,800$2,000
Per C
apita
Expen
diture
Expenditure Category
Hampton Roads
Virginia Average
28Presentation to Virginia Beach

Regional Per Capita Expenditures Compared to State, 2016
Hampton Roads Regional Benchmarking Study
Source: Auditor of Public Accounts, Weldon Cooper Center, BLS, and HRPDC
29Presentation to Virginia Beach
0%20%40%60%80%100%120%140%160%
Per C
apita
Expen
diture
Expenditure Category
Hampton Roads Virginia Average

Per Pupil School Spending(Inflation‐Adjusted)
Hampton Roads Regional Benchmarking Study
Source: U.S. Census Bureau, American Community Survey and HRPDC
$0
$2,000
$4,000
$6,000
$8,000
$10,000
$12,000
$14,000
2015
Dollars Per Pup
il
Hampton Roads Virginia
30Presentation to Virginia Beach

Graduation Rates
Hampton Roads Regional Benchmarking Study
Source: Virginia Department of Education and HRPDC
0%10%20%30%40%50%60%70%80%90%100%
2000
2001
2002
2003
2004
2005
2006
2007
2008
2008*
2009*
2010*
2011*
2012*
2013*
2014*
2015*
2016*
2017*
4 Year Gradu
ation Ra
te
Hampton Roads
Virginia Graduation Rate
Virginia Graduation Rate‐ Cohort
* Dates are Graduation Rates Calculated Using the Cohort Method
31Presentation to Virginia Beach

Violent Crime
Hampton Roads Regional Benchmarking Study
Source: Federal Bureau of Investigation and HRPDC
0
100
200
300
400
500
600
Violen
t Crim
e Pe
r 100
,000
Peo
ple
Hampton Roads United States
*The FBI did not report data for Hampton Roads in 2009
32Presentation to Virginia Beach

Poverty Rate
Source: U.S. Census Bureau and HRPDC
0%
2%
4%
6%
8%
10%
12%
14%
16%
18%
Poverty Ra
te
Hampton Roads United States
33Presentation to Virginia Beach

Ozone Levels in Hampton Roads
Hampton Roads Regional Benchmarking Study
Source: Virginia Department of Environmental Quality and HRPDC
0
10
20
30
40
50
60
70
80
90
100
Ozone
Parts Per Billion
Ozone Level
Primary Standard
34Presentation to Virginia Beach

Hampton Roads Population
Hampton Roads Regional Benchmarking Study
Source: Weldon Cooper Center and HRPDC
927,854
1,726,907
0
200,000
400,000
600,000
800,000
1,000,000
1,200,000
1,400,000
1,600,000
1,800,000
2,000,000
Popu
latio
n
Only Year‐Over‐Year Decrease1978 ‐ 1979
35Presentation to Virginia Beach
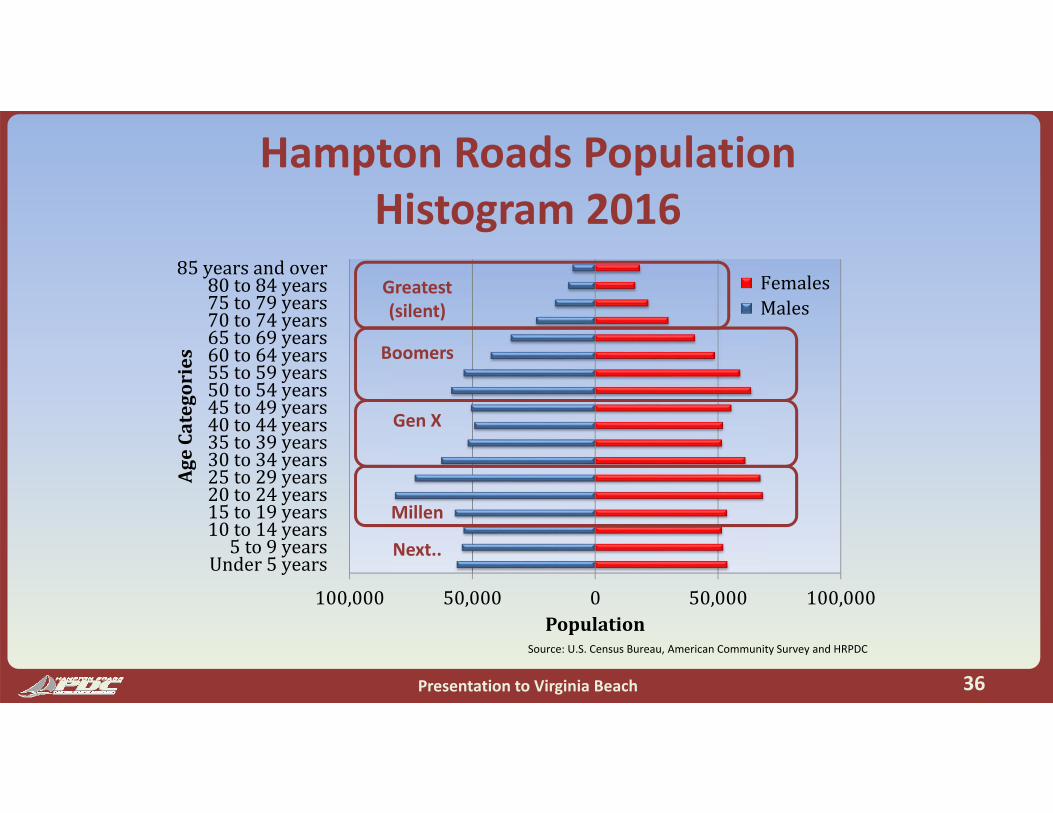
Hampton Roads Population Histogram 2016
Hampton Roads Regional Benchmarking Study
Source: U.S. Census Bureau, American Community Survey and HRPDC
100,000 50,000 0 50,000 100,000
Under5years5to9years
10to14years15to19years20to24years25to29years30to34years35to39years40to44years45to49years50to54years55to59years60to64years65to69years70to74years75to79years80to84years
85yearsandover
Population
AgeCategories
FemalesMales
Greatest(silent)
Boomers
Gen X
Millen
Next..
36Presentation to Virginia Beach

Annualized Percent Change in Gross Domestic Product
Sources: HRPDC, the Bureau of Economic Analysis, and Blue Chip Economic Indicators
‐8%
‐6%
‐4%
‐2%
0%
2%
4%
6%
8%
Annu
alize
d Pe
rcen
t Cha
nge
Consensus Forecast
Presentation to Virginia Beach 37

Sources: HRPDC, HRTPO, and the U.S. Census Bureau
Presentation to Virginia Beach 38

Sources: HRPDC, HRTPO, and the U.S. Census Bureau
Presentation to Virginia Beach 39
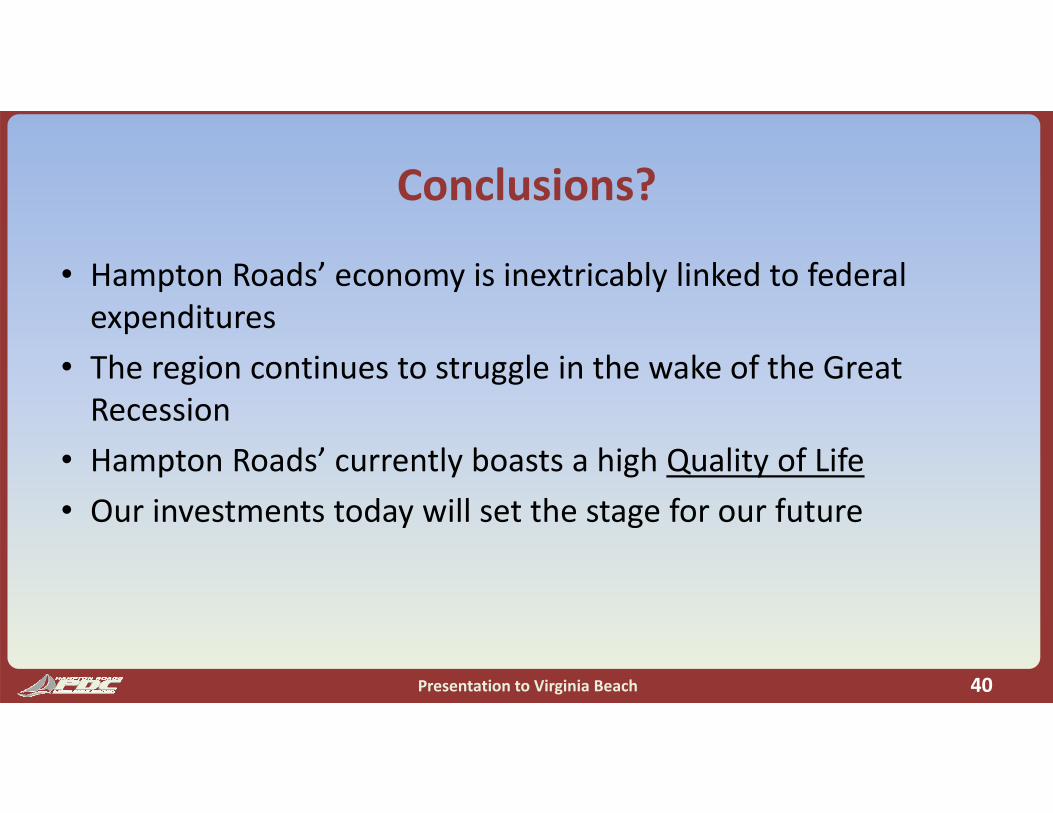
Conclusions?
• Hampton Roads’ economy is inextricably linked to federal expenditures
• The region continues to struggle in the wake of the Great Recession
• Hampton Roads’ currently boasts a high Quality of Life• Our investments today will set the stage for our future
Presentation to Virginia Beach 40

City of Virginia BeachDemographic Overview
City of Virginia BeachDemographic Overview

Population with Growth Rate By Decade1980 to 2016Population with Growth Rate By Decade1980 to 2016
- 50,000
100,000 150,000 200,000 250,000 300,000 350,000 400,000 450,000 500,000
1980
1981
1982
1983
1984
1985
1986
1987
1988
1989
1990
1991
1992
1993
1994
1995
1996
1997
1998
1999
2000
2001
2002
2003
2004
2005
2006
2007
2008
2009
2010
2011
2012
2013
2014
2015
2016
4.13% Annual Growth Rate
0.79% Annual Growth Rate
0.30% Annual Growth Rate
0.59% Annual Growth Rate
Sources: Census Bureau and Weldon Cooper Center for Public Service

Population By Age Segment 1980 compared to 2016Population By Age Segment 1980 compared to 2016
Source: Census Bureau

Dependency RatioDependency Ratio
0.0%
10.0%
20.0%
30.0%
40.0%
1980 1990 2000 2010 2016
Under 18 65+Source: Census Bureau

Educational AttainmentEducational Attainment
80.0%88.0% 90.4% 93.1% 93.4%
22.4% 25.5% 28.1% 31.6% 35.0%
7.7% 8.9% 10.9% 12.3%
0.0%10.0%20.0%30.0%40.0%50.0%60.0%70.0%80.0%90.0%
100.0%
1980 1990 2000 2010 2016
High School Graduate Bachleor's Degree Graduate or Professional DegreeSource: Census Bureau

Imbalance of Education and JobsImbalance of Education and Jobs
Nationally, 47% of adults over the age of 25 have an Associate’s Degree or higher
While only 27% of jobs require a degree.
Sources: Census Bureau and Bureau of Labor Statistics

Cost Burdened HousingHousing Expenses Exceed 30% of IncomeCost Burdened HousingHousing Expenses Exceed 30% of Income
26.3%30.7%
27.4%
37.6%
27.6%
0.0%
5.0%
10.0%
15.0%
20.0%
25.0%
30.0%
35.0%
40.0%
1980 1990 2000 2010 2016
OwnersSource: Census Bureau

Homeowners Who Are Mortgage FreeHomeowners Who Are Mortgage Free
11.10% 11.40%13.90%
19.70%
24.90%
0.0%
5.0%
10.0%
15.0%
20.0%
25.0%
30.0%
1980 1990 2000 2010 2016Source: Census Bureau

IncomeIncome
$11,998
$21,743 $32,331
$44,812 $52,235
$20,203
$36,271 $47,705
$64,212 $71,117
$- $10,000 $20,000 $30,000 $40,000 $50,000 $60,000 $70,000 $80,000
1980 1990 2000 2010 2016Per Capita Median Household
Median Household Income Adjusted for Inflation from 2010 is $64,613. Per Capita Income Adjusted for Inflation from 2010 is $48,056.
2015 Data
Sources: Census Bureau and Bureau of Economic Analysis

Poverty RatesPoverty Rates
13.0%10.8%
8.9% 7.9%10.3%
5.1%
0.0%2.0%4.0%6.0%8.0%
10.0%12.0%14.0%16.0%18.0%
1980 1990 2000 2002 2003 2004 2005 2006 2007 2008 2009 2010 2011 2012 2013 2014 2015 2016
Children Individuals ElderlyFirst 3 data points are decades
Source: Census Bureau

Students Qualifying for Free and Reduced Lunch
Students Qualifying for Free and Reduced Lunch
30.7
9%
27.1
8%
29.1
3%
31.1
3%
30.4
6%
33.1
5%
32.8
5%
36.1
8%
36.9
4%
37.7
4%
2006/07 2007/08 2008/09 2009/10 2010/11 2011/12 2012/13 2013/14 2014/15 2015/16
% o
f Stu
den
ts
Source: VBCPS Department of School Division Services, Office of Food Services

Relative Measures of Tax BurdenRelative Measures of Tax Burden
6.12%7.19%
8.57% 8.12%7.23%
9.11% 9.07%
0.00%
2.00%
4.00%
6.00%
8.00%
10.00%
VirginiaBeach
Chesapeake Norfolk Portsmouth Suffolk Hampton NewportNews
Per Capita Expenditures as a Percentage of Per Capita Income
Source: VBCPS Department of School Division Services, Office of Food Services

Technology Changes and Impact on Revenue Technology Changes and Impact on Revenue
Telecommunications Tax – Loss of Revenue
Marketplace Fairness Act
Sales Tax – Growth in Services vs. Retail
Other – Airbnb, E-cigarettes and Uber
Telecommunications Tax – Loss of Revenue
Marketplace Fairness Act
Sales Tax – Growth in Services vs. Retail
Other – Airbnb, E-cigarettes and Uber

RevenuesRevenues

Real EstateReal Estate
$428,113,788
$599
$420
$440
$460
$480
$500
$520
$540
$560
$580
$600
$620
FY 14 FY 15 FY 16 FY 17 FY 18 FY 19 FY 20 FY 21 FY 22 FY 23
Millions
Budget Actual Projection

Personal Property Personal Property
$139
$132
$153
$171
$120
$130
$140
$150
$160
$170
$180
FY 14 FY 15 FY 16 FY 17 FY 18 FY 19 FY 20 FY 21 FY 22 FY 23
Milli
ons
Budget Actual Projection

Consumer Driven Revenues Consumer Driven Revenues
$9
$75
$53
$-
$10
$20
$30
$40
$50
$60
$70
$80
FY 14 FY 15 FY 16 FY 17 FY 18 FY 19 FY 20 FY 21 FY 22 FY 23
Milli
ons
Budget Actual Projection
General Sales
BPOL
Restaurant
Hotel

State Revenue State Revenue
$95
$108
$90$92$94$96$98
$100$102$104$106$108$110
FY 14 FY 15 FY 16 FY 17 FY 18 FY 19 FY 20 FY 21 FY 22 FY 23
Milli
ons

Expenditure AssumptionsExpenditure Assumptions
2% salary increase per year from FY 2018-19 to FY 2022-23 2% inflation 1% increase in VRS every 2 years beginning in FY 2018-19 Healthcare cost increasing by 3% from FY 2018-19 to FY 2022-23 City CIP and Operating Budget commitments Debt based on current debt schedules and projected issuances
2% salary increase per year from FY 2018-19 to FY 2022-23 2% inflation 1% increase in VRS every 2 years beginning in FY 2018-19 Healthcare cost increasing by 3% from FY 2018-19 to FY 2022-23 City CIP and Operating Budget commitments Debt based on current debt schedules and projected issuances

Expenses and Revenue Five Year ForecastExpenses and Revenue Five Year Forecast
$1.13 $1.15
$1.19
$1.22
$1.25
$1.28
$1.13$1.15 $1.18
$1.21
$1.24
$1.27
$1.10$1.12$1.14$1.16$1.18$1.20$1.22$1.24$1.26$1.28$1.30
FY 2018 FY 2019 FY 2020 FY 2021 FY 2022 FY 2023
Billio
ns
Expenditures Revenues
FY 2019 FY 2020 FY 2021 FY 2022 FY 2023
$ 109,118 $ (3,525,157) $ (6,597,800) $ (7,136,677) $ (10,115,989)

Status of Enterprise FundsStatus of Enterprise Funds
Stormwater Fund - Balanced Through Final Year of 5 Year ERU Rate Increases Slight Deficit in FY 2022-23
Water and Sewer Fund – Balanced Through FY 2020-21 Slight Deficits in FY 2021-22 and FY 2022-23
Waste Management Fund – Shows Deficit in Each Year of the Forecast
Stormwater Fund - Balanced Through Final Year of 5 Year ERU Rate Increases Slight Deficit in FY 2022-23
Water and Sewer Fund – Balanced Through FY 2020-21 Slight Deficits in FY 2021-22 and FY 2022-23
Waste Management Fund – Shows Deficit in Each Year of the Forecast

Schools’ Operating BudgetSchools’ Operating Budget

VBCPS’ Key Budget AssumptionsVBCPS’ Key Budget Assumptions
Other Revenue Sources
Anticipate reducing the reliance on reversion funding by $2 million each year of the forecast period until this revenue source is no longer needed to balance the School Operating budget by FY 2022-23
Other Revenue Sources
Anticipate reducing the reliance on reversion funding by $2 million each year of the forecast period until this revenue source is no longer needed to balance the School Operating budget by FY 2022-23
REVENUE HIGHLIGHTS
2018-19 2019-20 2020-21 2021-22 2022-23
State Shared Sales Tax +2.5% +2.5% +3.0% +3.0% +3.0%
Other State Revenue +2.0% +2.5% +3.0% +3.0% +3.0%
Local Revenue (RSF) +1.97% +2.03% +2.01% +2.03% +1.96%
Federal Revenue - - - - -
Local, State and Federal Revenue This forecast reflects increases in revenue at the state and local levels and continues
to reverse the impact of significant cuts VBCPS has sustained since 2008.

VBCPS’ Key Budget AssumptionsVBCPS’ Key Budget Assumptions
Non-Personnel Expenses
All non-personnel budget line items impacted by inflation are expected to increase by approximately 2% each year of the forecast period
Capital outlay expenditures are expected to increase by approximately $450,000 to purchase five additional replacement school buses each year from FY 2018-19 to FY 2022-23
EXPENDITURE HIGHLIGHTS
Personnel Services and Fringe Benefits Each year of the forecast period includes a 2% salary increase
The current Virginia Retirement System (VRS) rate of 16.32% is expected to drop by 0.64% in FY 2018-19 to 15.68% and remain flat at that rate from FY 2019-20 through FY 2022-23

VBCPS’ Budgetary Goals and ChallengesVBCPS’ Budgetary Goals and Challenges
Programmatic Priorities - expansion of existing programs or adding new programs (e.g. expansion of preschool and full-day kindergarten)
Technology - 1:1 technology initiative (access for all students)
Employee Compensation - competitive pay increases, Unified Pay Scale equity adjustments
Employee Benefits - costs associated with healthcare (pending outcome of federal legislation)
State and Federal Mandates - new financial transparency provision in the Every Student Succeeds Act of 2015 (ESSA)
The following list highlights examples of factors that place considerable pressure on the School Operating budget.

VBCPS’ Budgetary Goals and ChallengesVBCPS’ Budgetary Goals and Challenges
Lagging State Funding - state budget allocates nine percent less on K-12 instruction than it did in 2005
Life Cycle Needs - school buses, white fleet vehicles, copiers/multifunction devices and replacement technology equipment
Structurally Flawed Operating budget strategy - FY 2017/18 marks the eighth consecutive year VBCPS is relying on one-time reversion funds for ongoing expenses ($8.8 million)
Enrollment and demographics - slow decline in student enrollment projected to continue

VBCPS’ Forecasted Revenues and ExpendituresVBCPS’ Forecasted Revenues and Expenditures
FY 2017-18Adopted
FY 2018-19Forecast
FY 2019-20Forecast
FY 2020-21Forecast
FY 2021-22Forecast
FY 2022-23Forecast
Revenue Sharing Formula* 427,710,350 436,149,554 444,983,377 453,926,729 463,125,190 472,179,891 Schools Use of Sandbridge TIF 409,000 409,000 - - - - From the Use of Money and Property 477,000 477,000 477,000 477,000 477,000 477,000 Charges for Services 2,816,638 2,816,638 2,816,638 2,816,638 2,816,638 2,816,638 Miscellaneous Revenue 224,703 224,703 224,703 224,703 224,703 224,703 State Shared Sales Tax 73,718,340 75,561,299 77,450,331 79,773,841 82,167,056 84,632,068 Other State Revenue 273,443,481 278,912,351 285,885,159 294,461,714 303,295,566 312,394,433 Federal Revenue 12,200,000 12,200,000 12,200,000 12,200,000 12,200,000 12,200,000 School Reversion/Fund Balance 8,803,897 6,800,000 4,800,000 2,800,000 800,000 -
799,803,409 813,550,544 828,837,208 846,680,625 865,106,153 884,924,732
FY 2017‐18Adopted
FY 2018‐19Forecast
FY 2019‐20Forecast
FY 2020‐21Forecast
FY 2021‐22Forecast
FY 2022‐23Forecast
Personnel Services 460,704,795 471,165,890 481,861,146 491,498,369 501,328,336 511,354,903 Fringe Benefits
FICA 35,124,805 36,044,191 36,862,378 37,599,625 38,351,618 39,118,650 VRS 72,142,284 73,878,812 75,555,828 77,066,944 78,608,283 80,180,449 Health Insurance 59,146,766 60,921,169 62,748,804 64,631,268 66,570,206 68,567,312 Life Insurance 3,303,644 6,172,273 6,312,381 6,438,629 6,567,401 6,698,749 All Other Fringe Benefits 3,149,554 3,149,554 3,149,554 3,149,554 3,149,554 3,149,554
Contractual Services 49,216,858 50,201,195 51,205,219 52,229,323 53,273,910 54,339,388 Other Charges 55,629,948 56,742,547 57,877,398 59,034,946 60,215,645 61,419,958 Capital Outlay 4,541,259 4,991,259 5,441,259 5,891,259 6,341,259 6,791,259 Land, Structures and Improvement 222,577 222,577 222,577 222,577 222,577 222,577 Debt Service 44,947,680 41,951,320 44,583,067 44,558,369 45,429,259 45,830,953 Transfers to Other Funds
Athletics Fund 4,595,823 4,595,823 4,595,823 4,595,823 4,595,823 4,595,823 Categorical Grants Fund 3,313,969 3,573,608 3,833,246 3,833,246 3,833,246 3,833,246 Green Run Collegiate Fund 3,763,447 3,822,058 3,893,157 3,959,445 4,027,138 4,096,268
799,803,409 817,432,275 838,141,836 854,709,377 872,514,255 890,199,089
Forecasted Revenues
Forecasted Expenditures

VBCPS’ Baseline ForecastVBCPS’ Baseline Forecast
Projected Deficits Utilizing the revenue and expenditure assumptions from the previous slide, VBCPS is projecting the following
deficits over the forecast period.
Projected Deficits Utilizing the revenue and expenditure assumptions from the previous slide, VBCPS is projecting the following
deficits over the forecast period.
-
( 3,881,731 )
( 9,304,628 )
( 8,028,752 )( 7,408,102 )
( 5,274,357 )
-
1,000,000
2,000,000
3,000,000
4,000,000
5,000,000
6,000,000
7,000,000
8,000,000
9,000,000
10,000,000
740,000,000
760,000,000
780,000,000
800,000,000
820,000,000
840,000,000
860,000,000
880,000,000
900,000,000
FY 2017-18Adopted
FY 2018-19Forecast
FY 2019-20Forecast
FY 2020-21Forecast
FY 2021-22Forecast
FY 2022-23Forecast
Revenue Expenditures Baseline Deficit

City and Schools’ Combined Expenditures and Revenues
City and Schools’ Combined Expenditures and Revenues
City and School’s Surplus and Deficit
FY 2018‐19 Forecast FY 2019‐20 Forecast FY 2020‐21 Forecast FY 2021‐22 Forecast FY 2022‐23 ForecastCity Surplus and Deficit $ 109,118 $ (3,525,157) $ (6,597,880) $ (7,136,677) $ (10,115,989)
Schools’ Deficit $ (3,881,731) $ (9,304,628) $ (8,028,752) $ (7,408,102) $ (5,274,357)
City and School Combined Expenditures and Revenues Expenditures $ 1,971,985,569 $ 2,023,563,517 $ 2,070,810,639 $ 2,117,561,725 $ 2,167,456,192
Revenues $ 1,968,212,956 $ 2,010,733,732 $ 2,056,184,008 $ 2,103,016,945 $ 2,152,065,847 Total Combined Deficit $ (3,772,613) $ (12,829,785) $ (14,626,631) $ (14,544,779) $ (15,390,346)
*The combined City and School Expenditures and Revenues includes transfers
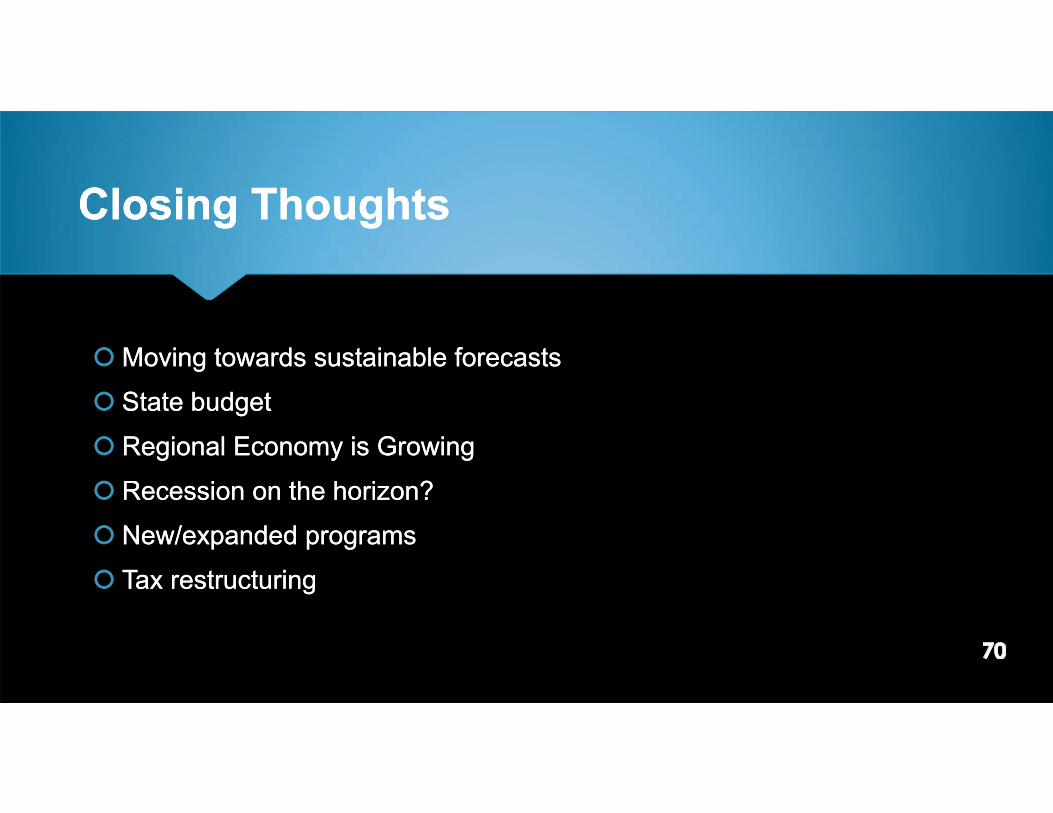
Closing ThoughtsClosing Thoughts
Moving towards sustainable forecasts State budget Regional Economy is Growing Recession on the horizon? New/expanded programs Tax restructuring
Moving towards sustainable forecasts State budget Regional Economy is Growing Recession on the horizon? New/expanded programs Tax restructuring

Questions?Questions?