presentation policies and initiatives of sed
TRANSCRIPT


Presented by: Muhammad Javaid Rafiq District Education Officer (EE-M) Multan
IMPLEMENTATION OF SCHOOL EDUCATION DEPARTMENT POLICIES & INITIATIVE AT MARKAZ LEVEL

School Education Department comes under the Jurisdiction of Govt. Of Punjab
Minister of Education over-all Supervises the department
School Education Department

OrganogramMinister for Education
ADDL. SECY (ER)
DY. SECY (ER)
ADDL. SECY. (SCHOOLS)
DY. SECY (A&C) DY. SECY (EE) DY. SECY
ADDL. SECY (DEA)
ADDL. SECY (GENERAL)
ADDL. (B & P)
Secretary SED
Special Secretary
SED

Legislation, policy formulation and planning
The following are the legislation, policy formulation and planning areas of the School Education Department:
Primary education Elementary education Secondary and Higher Secondary education
Functions of School Education Department

Director Public Instruction (Secondary Education) Administrative and establishment matters Seniority & Promotion (Male & Female) teaching & ministerial staff of BS-17 & above, Coordination among the districts, Budget and Planning.
Director Public Instruction (Elementary Education)
Administrative and establishment matters (Male & Female) teaching & ministerial staff of BS-1 to 16, Coordination among the districts, Budget and Planning
Attached Departments

Directorate of Staff Development (DSD)
Teachers’ training programme, CPD frame work, Cluster Training Support Centres, District Training Support Centres, Establishment matters of DTEs, Developing teachers training modules.
Attached Departments

Children Library Complex Punjab Critical thinking development in children through the provision of educational and recreational services, Educational services, recreational services, expansion of Children’s Library complex services, Children Library Complex administration.
Punjab Education Assessment System (PEAS) Implement National Education Assessment activities in Punjab, Assess students learning achievement level in the Province on the basis of sample, Develop instruments for learning assessment, Identify strong and weak areas of students learning with reference to National Curriculum and target competencies, Disseminate findings to the stake holders so that they may contribute in improving the quality of Education.
Attached Departments

Punjab Curriculum Authority Punjab Examination Commission (PEC) Punjab Education Foundation Punjab Teachers Foundation The Danish Schools Authority (DSA)
Autonomous Bodies

30 June 2015
Parho Punjab Barho PunjabRevised District Ranking Methodology

Pre DRC
DRC

13
Agenda
• The new district ranking system
• Core indicators
• Retention indicators
• Infrastructure indicators
• Management & monitoring indicators
• Administrative ranking system

14
The new rankings system is based on a) Administrative indicators b) Quality indicators
Administrative indicators
Qualityindicators
1 2 coaching visits per school2 Separate quality ranking based on this indicator for district which is not part of the quarterly
rating used for bonus award
1
2
Categorized into Core, Retention, Infrastructure and
Monitoring & management indicators
Sub categorized into 13 metrics
Focus mainly on achieving administrative
excellence at the school level
Top performing districts to be rewarded financially
Consists of 4 metrics
Focus mainly on accessing quality of Learning &
Education at the school level

15
The Administrative indicators are the following
Core indicators
3
Student attendance (1-12) 1Teacher presence2Functioning facilities3Administrator visits4
MEA visits
2 Overcrowding and multigrade (OCMG) due to classroomsInfrastructure indicators
1 Overcrowding and multigrade (OCMG) due to teachers
3 Dangerous building
Monitoring & managementindicators
2 DTE visits1 1 AEO span of control
Retention indicators
1 Student attendance (Kachi)
2 Retention (Kachi)
3 Student attendance (1-5)
4 Retention (1-5)
Not included in district rankings
1 2 coaching visits per school
A
C
D
B
1

District will be ranked out of a total score of 13Definitions
ValueMetrics1
Functioning facilities
Teacher presence
Student attendance (Kachi)
Retention (Kachi)
Student attendance (1-5)
Retention (1-5)
OCMG due to teachers
OCMG due to classrooms
Dangerous buildings
AEO span of control
DTE visits
Functioning & available facilities2 as a % of total required facilities
Teachers present as a % of total teachers
Student present as % of total students enrolled
Current enrolment as % of baseline enrolment retained
Student present as % of total students enrolled
Current enrolment as % of baseline enrolment retained
Student present as % of total students enrolled
Schools with inadequate3 number of primary teachers as a % of total schools4
Schools with inadequate3 number of classrooms as a % of total schools4
Schools with dangerous buildings as a % of total schools
Average number of schools per AEO
% of schools with adequate3 number of coaching visits by DTEs
13
1
1
1
1
1
1
1
1
1
1
1
A2
A3
B1
B2
B3
B4
C1
C2
C3
D1
D2
Student attendance (1-12) 1A1
District administrator visits % of schools4 visited by district administrators 1A4
1 All the metrics are calculated on a monthly basis2 Includes electricity, boundary wall, drinking water and toilets3 Step function defined in the backup section of the document4 with primary section
Core
Retention
Infra-structure
Monitoring &
Management
Indicators
1

17
District ranking
SOURCE: PMIU
3.53.5
4.04.54.54.54.5
5.05.05.05.0
5.55.55.55.55.55.5
6.06.06.06.0
6.56.56.5
7.07.07.0
7.57.57.5
8.08.08.08.08.0
8.5
NAROWALRAJANPUR
RAWALPINDI
D.G. KHAN
RAHIMYAR KHAN
FAISALABAD
SIALKOT
ATTOCK
BHAKKAR
KHUSHAB
OKARA
MIANWALIGUJRANWALA
SHEIKHUPURALAHORE
MUZAFFARGARH
LAYYAH
GUJRAT
JHANG
BAHAWALNAGARHAFIZABADPAKPATTAN
T.T.SINGH
NANKANA SAHIB
CHINIOT
LODHRAN
CHAKWAL
KASUR
MANDI BAHA UD DIN
KHANEWAL
MULTAN
JHELUM
VEHARI
BAHAWALPUR
SARGODHA
SAHIWAL
Performance (out of 13)
District
1 Based on average score of April & May
Average district score, baseline1

Student attendance
Source: Team analysis
Evaluation criteria
On or above target
Below target by less than or equal to 2%
Below target by more than 4%
Total students present divided by the total enrolment (as per class register)
Calculation
BaselineAverage student attenance for 2014
2018 Target
Districts classified into three categories of performance (high, moderate & low) and targets assigned accordingly (90%, 88% & 85%)
Student present as a % of total students enrolledDefinition
Metric detail
Below target by more than 2% but less than or equal to 4%

Teacher presence
Source: Team analysis
Evaluation criteria
Greater than or equal to 90%
Less than 90% but greater than or equal to 88%
Less than 86%
2018 Target
90%
Teachers present as a % of total teachersDefinition
Metric detail
Less than 88% but greater than or equal to 86%
Definition
Average teacher presence for 2014Baseline

Retention
Source: Team analysis
Evaluation criteria
On or above target
Below target by less than or equal to 1.5%
Below target by greater than 3%
BaselinePeak month enrolment for current school year
2018 Target
Reduce dropout to lower of the following:▪ Retention floor
– Kachi: 7%– Grade 1-5: 13%
▪ 50% of a district’s baseline dropout1 rate
Current enrolment as a % of baseline enrolmentDefinition
1 Drop out is calculated as the difference between month with highest enrolment and any subsequent month with lowest enrolment, based on enrollment from 2012-2013, 2013-2014, 2014-2015 – All enrolment figures are adjusted for MEA coverage
Metric detail
Below target by greater than 1.5% but less than or equal to 3%
On or above target
Below target by less than or equal to 3%
Below target by greater than 6%
Below target by greater than 3% but less than or equal to 6%
Kachi Grade 1-5

Administrator visits
Source: Team analysis
Evaluation criteria
2018 Target
90%
% of schools1 visited by district administrators Definition
Metric detail
Greater than or equal to 90%
Less than 90% but greater than or equal to 88%
Less than 86%
Less than 88% but greater than or equal to 86%
1 With primary section

Overcrowding & multigrade due to teachers
Source: Team analysis
Evaluation criteria
2018 Target
0% of schools with overcrowding and multigrade due to teachers
% of schools with inadequate1 number of primary school teachersDefinition
Metric detail
Less than or equal to 5%
Greater than 5% but less than or equal to 25%
Greater than 50%
Greater than 25% but less than or equal to 50%
1 0-30 enrolment: 2 teachers, 30-45 enrolment: 3 teachers, 45-180 enrolment: 4 teachers, 180-300 enrolment: 6 teachers, 300-400 enrolment: 8 teachers, >400 enrolment : primary STR of 50
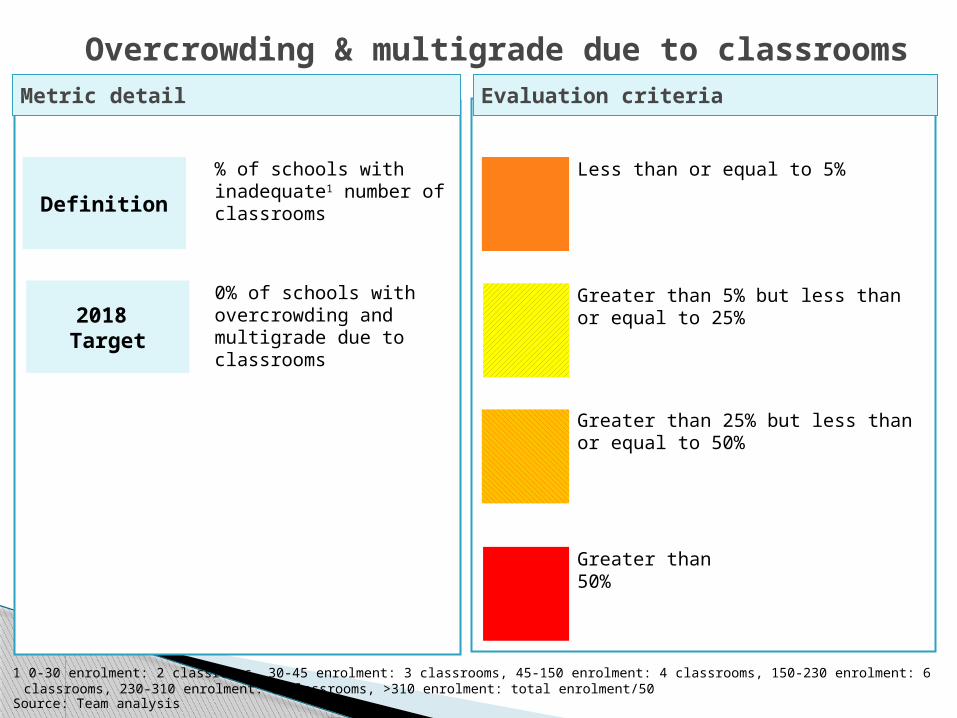
Overcrowding & multigrade due to classrooms
Source: Team analysis
Evaluation criteria
2018 Target
0% of schools with overcrowding and multigrade due to classrooms
% of schools with inadequate1 number of classroomsDefinition
Metric detail
Less than or equal to 5%
Greater than 5% but less than or equal to 25%
Greater than 50%
Greater than 25% but less than or equal to 50%
1 0-30 enrolment: 2 classrooms, 30-45 enrolment: 3 classrooms, 45-150 enrolment: 4 classrooms, 150-230 enrolment: 6 classrooms, 230-310 enrolment: 8 classrooms, >310 enrolment: total enrolment/50

Functioning facilities
Source: Team analysis
Evaluation criteria
2018 Target
Functioning & available facilities as a % of total required facilities1 Definition
Metric detail
1 Each school should have 4 facilities including electricity, boundary wall, drinking water and toilets.Total possible is a product of 4 and the total number of schools
95% of total possible facilities should be functional and available
Greater than or equal to 95%
Less than 95% but greater than or equal to 90%
Less than 85%
Less than 90% but greater than or equal to 85%

Dangerous buildings
Source: Team analysis
Evaluation criteria
2018 Target
Schools with dangerous1 buildings as a % of total schools Definition
Metric detail
• 0% of dangerous buildings in a district
• Intermediary target of 2% in June 2016
Less than or equal to 1%
Greater than 1% but less than or equal to 2%
Greater than 5%
Greater than 2% but less than or equal to 5%
1 Defined as life threating to teachers or/and students, further details in the “Training on dangerous building” document for MEAs

AEO span of control
Source: Team analysis
Evaluation criteria
Less than or equal to 251
Greater than 25 but less than or equal to 27
Greater than 28
2018 Target
232
Average number of schools per AEODefinition
Metric detail
Greater than 27 but less than or equal to 28
1 The districts are allowed a 10% deviation from target2 Conditional upon hiring of additional 1000 AEOs

DTE visits
Source: Team analysis
Evaluation criteria
2018 Target
% of schools with adequate1 number of coaching visits by a DTE
Definition
Metric detail
90%
Greater than or equal to 90%
Less than 90% but greater than or equal to 85%
Less than 80%
Less than 85% but greater than or equal to 80%
1 Defined as two visits per school

LND results
Source: Team analysis
Evaluation criteria
2018 Target
% of correct responses by students Definition
Metric detail
85%
Greater than or equal to 85%
Less than 85% but greater than or equal to 75%
Less than 65%
Less than 75% but greater than or equal to 65%

INITIATIVES

Chief Minister’s Initiatives for Teachers Focus on Students Focus on Schools 100% Enrolment to be ensured before 31st O
ctober 2014 100% Retention Ranking of Districts on Targets Ensuring Quality Education Governance Supportive Actions Merit Based Transfer Policy
School Reform Road Map

LND & QD Initiative Background CM Stock-take meeting on 29 January
2015 and presided by Mian Shahbaz Sharif Chief Minister of Punjab.
LND/ASER Reports: 38% of class 3 students could not match the word
CHAIR with its picture. CM showed apprehension regarding
Quality Education in public schools

To increase Literacy (reading, writing while improving common sense questions preparation of students learning in natural set up) & Numeracy of Grade 1-3 in Urdu, English and Mathematics
Improving Skills in English, Urdu and Mathematics Phonological awareness Word identification Composition Reading Comprehension Vocabulary Fluency Counting 1 – 100 (Urdu & English) Simple addition & subtraction through activity
Literacy Numeracy Drive (LND) and Quality Drive (QD)

Introduction of QD & LND
Secretary School Education took the Quality Drive (QD) Initiative
He proposed the need of imparting basic learning (basic literacy & numeracy) to the students of grade 1-3 in public schools in the subjects of Urdu, English and Mathematics

Strategy for Implementation
Minimum standards of learning in primary schools of Punjab
Working Force: 4000 DTEs + 1000 AEOs There are 40, 000 stand alone PSs. They will adopt 2 schools each for 2 months COVER ALL 40, 000 SCHOOLS IN 8 MONTHS 13,000 Heads of Elem&High Schools will
adopt their attached schools and implement QD

Article 25A of the constitution of Pakistan of Compulsory Education
Every Child will be given free education upto secondary level.
Scholarship will be given to needy students and on merit base.
Books will be provided by the government
Free & Compulsory Education

The Punjab Education and English Language Initiative (PEELI) will assist the School Education Department of the Government of Punjab in Pakistan to help 300,000 Primary (Grades 1-5) and Middle school (Grades 6-8) use English to teach English and other subjects. PEELI will be integrated into the continuous professional development and training. The aim of PEELI is to enable the Punjab Government’s English Medium of Instruction (MoI) policy to succeed.
Punjab Education and English Language Initiative (PEELI)

Public Private Partnership 100% Enrollment Quality Education i. FAS ii. Voucher Scheme iii. New School Program iv. PSSP
Punjab Education Foundation

l
The Punjab Education Foundation (PEF) is a non-profit government body working under the School Education Department of the Government of Punjab, Pakistan. It was established in 1991 to promote and encourage education in private institutes in Punjab. The Foundation was restructured in 2004 to keep pace with the changing requirements of the education sector in Punjab. [1] Now, the vision of the Foundation is: “To promote quality education through Public Private Partnership
Punjab Education Foundation

Foundation Assisted School (FAS) is the flagship program of the Punjab Education Foundation. It encourages and promotes free access to quality education through Public Private Partnership.
The financial assistance @ rate Rs.550/- for primary level, Rs. 650 for elementary classes, Rs.700/- for secondary arts classes and Rs. 800/- for secondary science classes, on per child enrolment is provided to partner schools every month.
FAS

Current number of FAS partner schools is more than 3000 (including 3 higher secondary schools) while the number of beneficiaries has risen to more than 14 lakh.
Quality Assurance Test (QAT) results show improvement in quality of education in FAS partner schools. Financial assistance is discontinued in case of partner school fails consecutively in two Quality Assurance Tests (QATs).

he PEF Board of Directors designed Education Voucher Scheme (EVS) for the slums/katchi abadies in the province of Punjab
The voucher is redeemable against payment of fee in the private educational institutions.
There has been an increase in enrolment of students, regularity of attendance of students in the schools.
Education Voucher Scheme (EVS)

The Punjab Education Foundation (PEF) has arranged free school education of 86,488 deserving male and female students under its New School Program (NSP) in different districts of the province. This initiative has been launched in collaboration with 518 private partner schools in these districts so that the deserving students could improve their lives through gratis education. NSP was launched in 5 selected districts of Punjab namely, Chiniot, Lodhran, Bahawalpur, Muzaffargarh and Rajanpur on 13 March 2008. Besides provision of monthly fee, students enrolled in the NSP partner schools are also provided with free text books.
New School Program (NSP):

Under this program, low-performing public sector schools will be run through private partners to provide good quality education to the students near to their doorsteps.
No fee would be charged from the students in the schools to be run through the PSSP.
Public School Support Program (PSSP)

Overview
Punjab Examination Commission is an autonomous body set up by the Government of the Punjab to assess and examine students’ learning achievements particularly of grade 5 and 8. PEC started functioning in 2005 and in 2006 conducted 5th grade population examination for the first time in the Province.
Punjab Examination Commission

PEC develops tests and further gets them printed for the districts of Punjab. The districts administer and score the tests. PEC then prepares results for each district, about 2 to5 million students, both from public and private sector schools appear in the examination every year.
Moreover, we prepare reports which serve teachers, teacher educators and researchers for improving students’ learning. The data collected from 36 districts of the province provides feedback to the system, policy making, educational managers and teachers for improving students’ learning.

There was no public policy, commitment and investment in ECE till late 1990s. It was for the first time that National Education Policy (1998-2010) mentioned ECE and called for reintroduction of Katchi/Pre-Primary Class as a formal class in Primary Schools.
Early Childhood Education -ECE

Induction level training of Newly recruited Teachers/Officers
Effective Pre-service
In-service training of all cadre of Education Teachers/ Administration
TRAININGs

On Spot Capacity Development Assessment Mentoring Assessment & Evaluation Based Ranking Training Need Assessment Professional Support to PSTs
CPD

Re-Allocation/ Rationalization of Teachers
First 90 Students = 3 Teachers
Above Than 90 Students = 1 Teacher on 40 st.
Middle Section = 1.5 Teacher for 01Section
Re-Allocation of Furniture
Rationalization/ Re-allocation

Cost Reduction (Free Education): Provision of incentives/stipends for children of poor families. Stipend for Girls in 15 Districts
Community Involvement: School Councils need to be mobilized and made functional. Head teachers also need to be trained to effectively engage community.
INITITATIVES

UPE & USE SURVEY AND 100% ENROLLMENT AND 100% RETENTION
ENROLLEMENT OF WORKERS OF BRICK KILN CHILDREN
TO ERADICATE CHILD LABOUR IN THE PROVINICE
ALLOCATION OF NON SALARY BUDGET
Initiatives

Merit Based HRM: Specialized recruitment tests for teachers and
managers on the pattern of independent testing services.
Retention of Quality Managers and Educationists: Security of tenure of key positions in the
district, and incentives for key managerial positions and subject specialists in rural areas need to be provided.
Initiatives
