presentation to wte industry event in perth, australia · industry event in perth, australia ......
TRANSCRIPT
PRESENTATION TO WtEINDUSTRY EVENT IN PERTH, AUSTRALIA
December 5th 2012Perth Zoo
14th November 2012
A review of state-of-the-art for WtE technologies in relation to the study just completed for the Department of Environment & Conservation, Government of Western Australia.
Dr Kevin Whiting

We are WSP
WSP is one of the world’s fastest-growing design, engineering and management consultancies, specialising in projects for the property, transport and environment and energy sectors.
Illus
tratio
n: A
TS L
td, E
ngla
nd
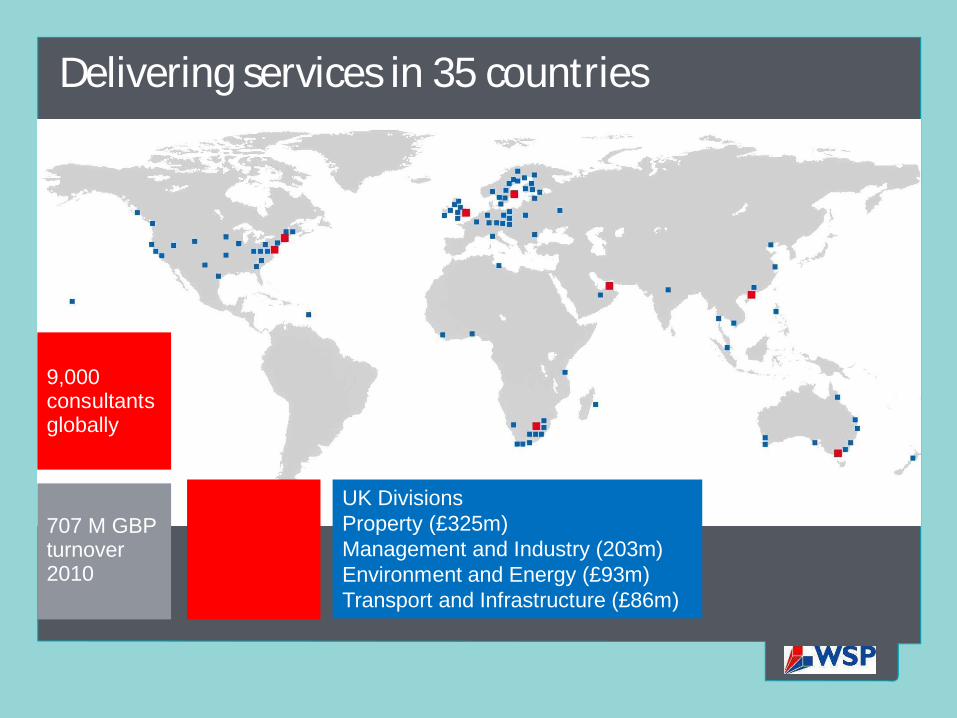
Delivering services in 35 countries
9,000 consultants globally
707 M GBP turnover 2010
Listed on the London Stock Exchange since 1987
UK DivisionsProperty (£325m)Management and Industry (203m)Environment and Energy (£93m)Transport and Infrastructure (£86m)
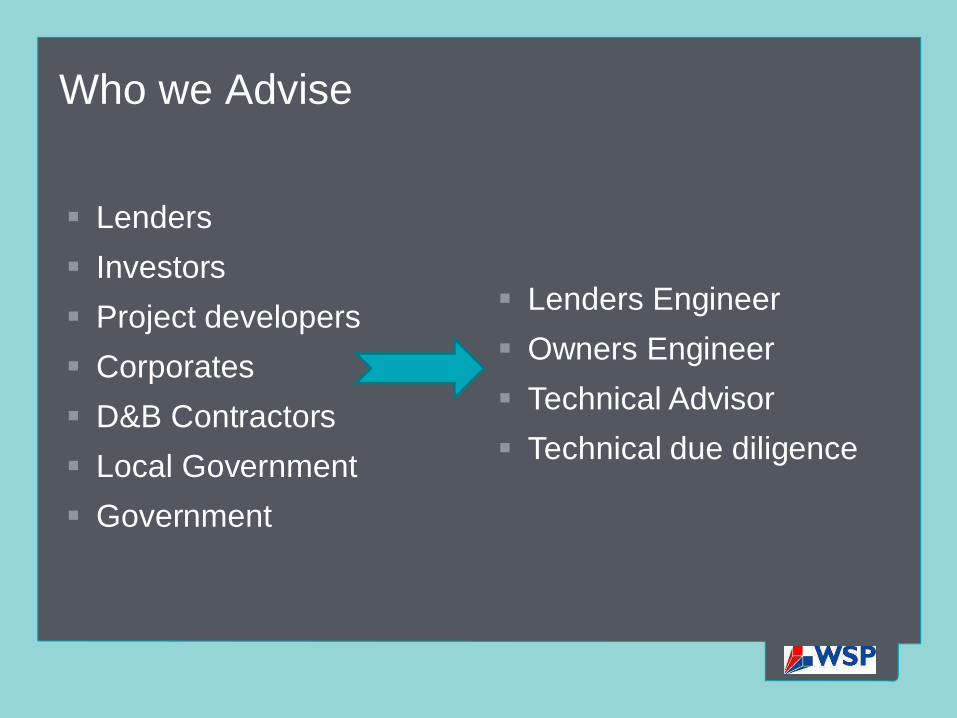
Who we Advise
Lenders EngineerOwners EngineerTechnical AdvisorTechnical due diligence
LendersInvestors Project developers Corporates D&B ContractorsLocal Government Government
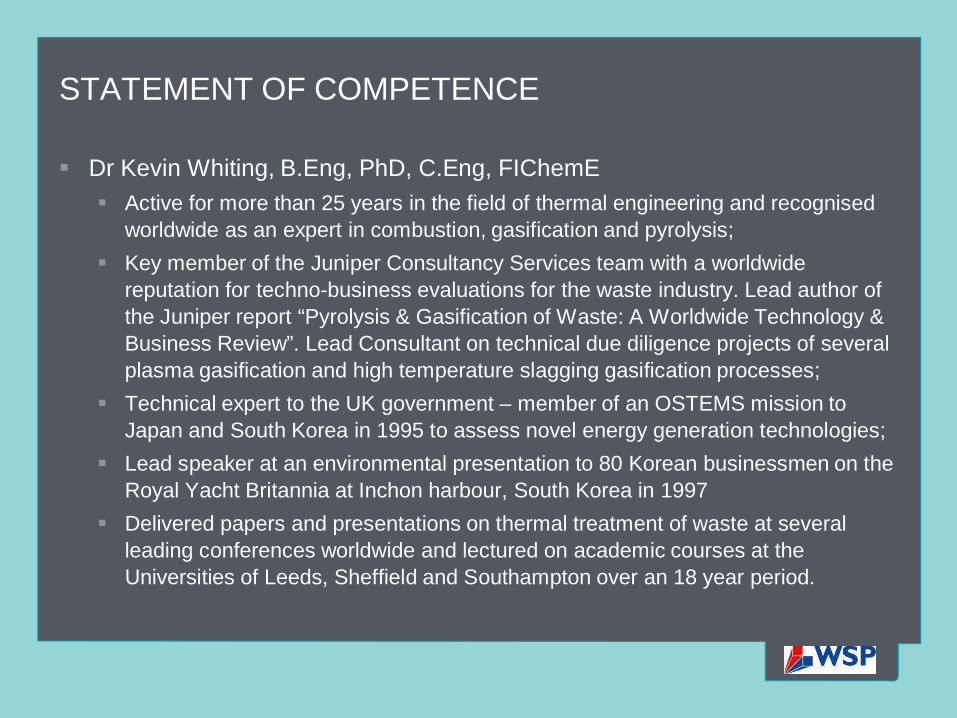
STATEMENT OF COMPETENCE
Dr Kevin Whiting, B.Eng, PhD, C.Eng, FIChemEActive for more than 25 years in the field of thermal engineering and recognised worldwide as an expert in combustion, gasification and pyrolysis;Key member of the Juniper Consultancy Services team with a worldwide reputation for techno-business evaluations for the waste industry. Lead author of the Juniper report “Pyrolysis & Gasification of Waste: A Worldwide Technology & Business Review”. Lead Consultant on technical due diligence projects of several plasma gasification and high temperature slagging gasification processes;Technical expert to the UK government – member of an OSTEMS mission to Japan and South Korea in 1995 to assess novel energy generation technologies;Lead speaker at an environmental presentation to 80 Korean businessmen on the Royal Yacht Britannia at Inchon harbour, South Korea in 1997Delivered papers and presentations on thermal treatment of waste at several leading conferences worldwide and lectured on academic courses at the Universities of Leeds, Sheffield and Southampton over an 18 year period.

Objectives of Thermal Waste TreatmentPreviously …• Reduction of waste volume• Cost effective waste treatmentCurrently …• Recycling and re-use of useful products – including
energy• Production of minimum quantity of inert solid residues• Minimal environmental impact, particularly the
reduction of CO2 emissions• Sustainable production of renewable energy• Fully proven and bankable technology
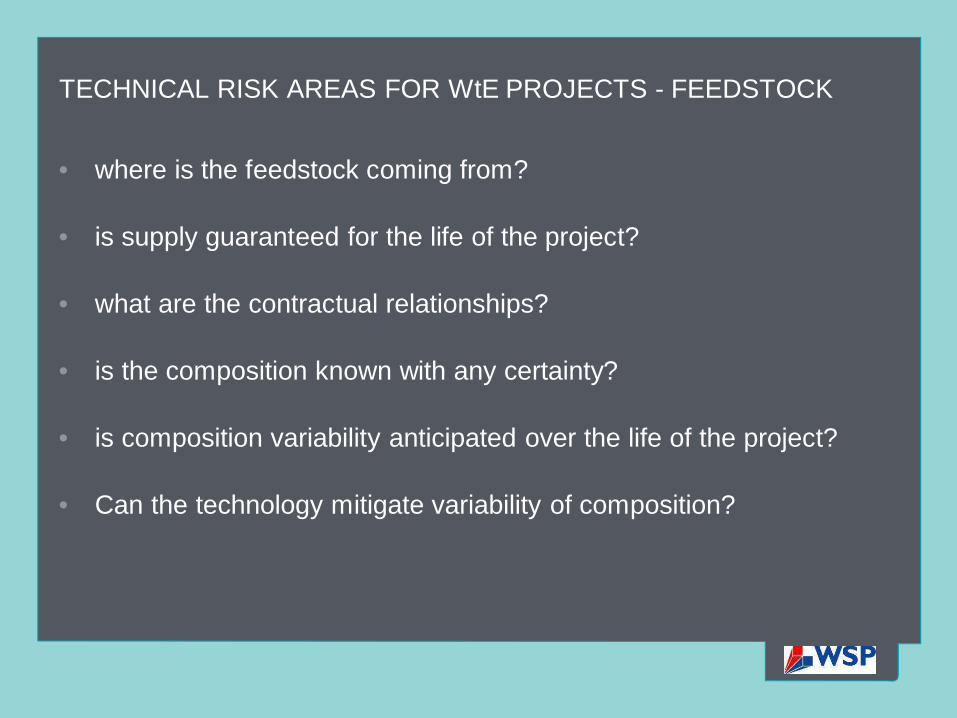
TECHNICAL RISK AREAS FOR WtE PROJECTS - FEEDSTOCK
• where is the feedstock coming from?
• is supply guaranteed for the life of the project?
• what are the contractual relationships?
• is the composition known with any certainty?
• is composition variability anticipated over the life of the project?
• Can the technology mitigate variability of composition?
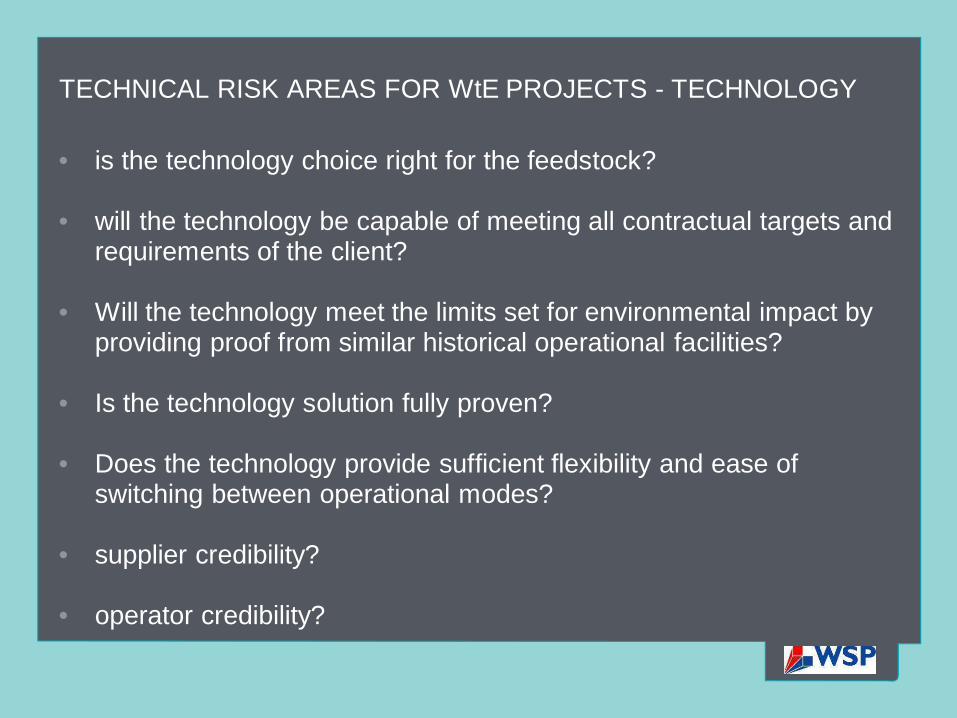
TECHNICAL RISK AREAS FOR WtE PROJECTS - TECHNOLOGY
• is the technology choice right for the feedstock?
• will the technology be capable of meeting all contractual targets and requirements of the client?
• Will the technology meet the limits set for environmental impact by providing proof from similar historical operational facilities?
• Is the technology solution fully proven?
• Does the technology provide sufficient flexibility and ease of switching between operational modes?
• supplier credibility?
• operator credibility?
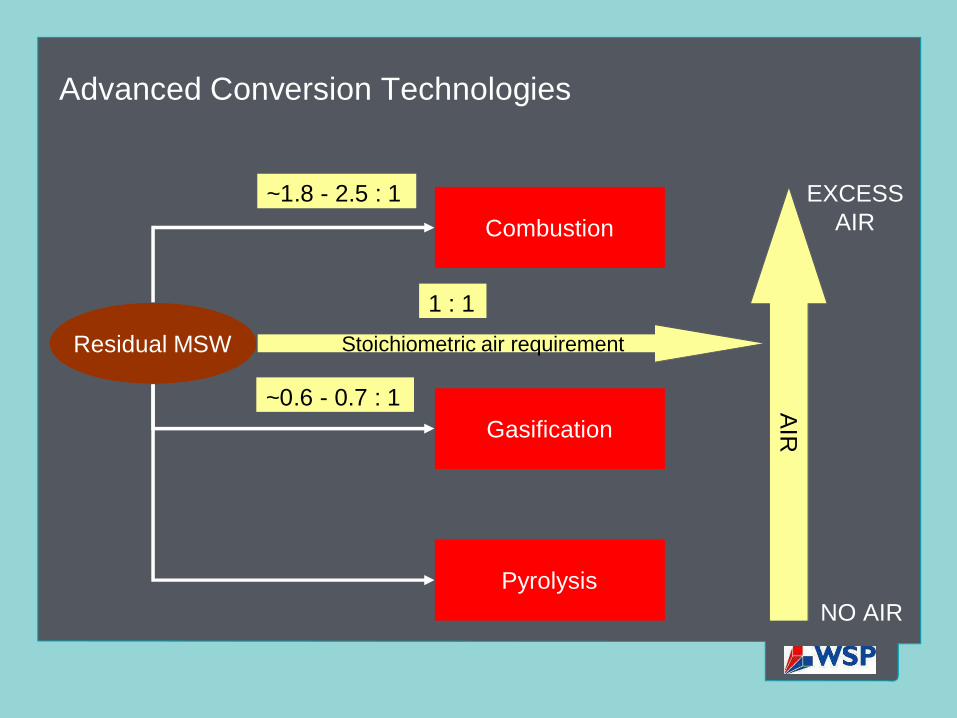
Advanced Conversion Technologies
Residual MSW
AIR
NO AIR
EXCESSAIRCombustion
Pyrolysis
Gasification
Stoichiometric air requirement
1 : 1
~0.6 - 0.7 : 1
~1.8 - 2.5 : 1
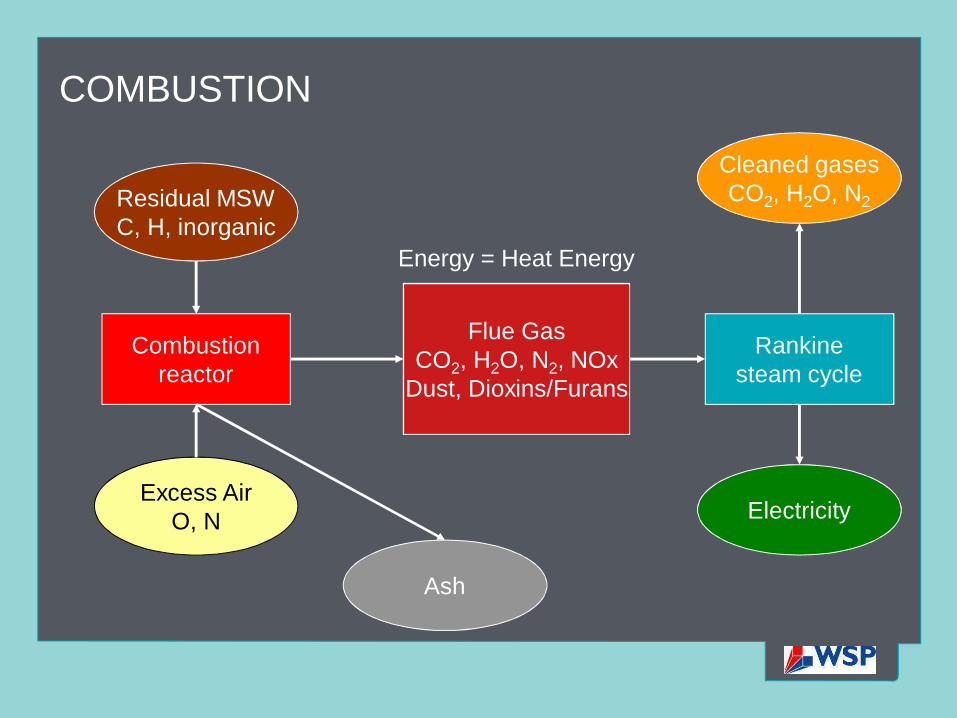
COMBUSTION
Combustionreactor
Residual MSWC, H, inorganic
Excess AirO, N
Flue GasCO2, H2O, N2, NOx
Dust, Dioxins/Furans
Ash
Energy = Heat Energy
Rankinesteam cycle
Electricity
Cleaned gasesCO2, H2O, N2
THERMAL WASTE TREATMENT
Conventional Energy from Waste processes dependent on scale
Moving grateFluidised bedOscillating kiln - Cyclerval
Novel thermal treatment processesGasificationPyrolysisPlasma gasification
MOVING GRATE COMBUSTORS
Grate moves burning solid waste through combustion chamber
Typically divided into three zones:drying and preheatingignition and combustionburnout and ash removal
Four main designs:forward reciprocatingreverse reciprocatingrollerhorizontal

PROCESSES OCCURING WITHIN A MOVING GRATE
W a s te
A irA ir
H o t F lu eG a s e s
G ra teA s h
D ry in gP y ro ly s is /
G a s if ic a t io n C o m b u s tio nB u rn o u t /S in te r in g
C o m b u s tio n
C o m b u s tio n
A ir
MOVING GRATE COMBUSTORS
Moving grate types:Forward reciprocating
Vølund (now Babcock & Wilcox), Steinmüller (now FisiaBabcock), Von Roll Inova (now Hitachi Zosen Inova), Noell (now Fisia Babcock), Takuma
Reverse reciprocatingMartin (including Covanta and MHI as licensees), Stein Industrie(now CNIM)
RollerDeutsche Babcock (now Fisia Babcock)
HorizontalABB Enertech (now CNIM and Martin), JFE (NKK)
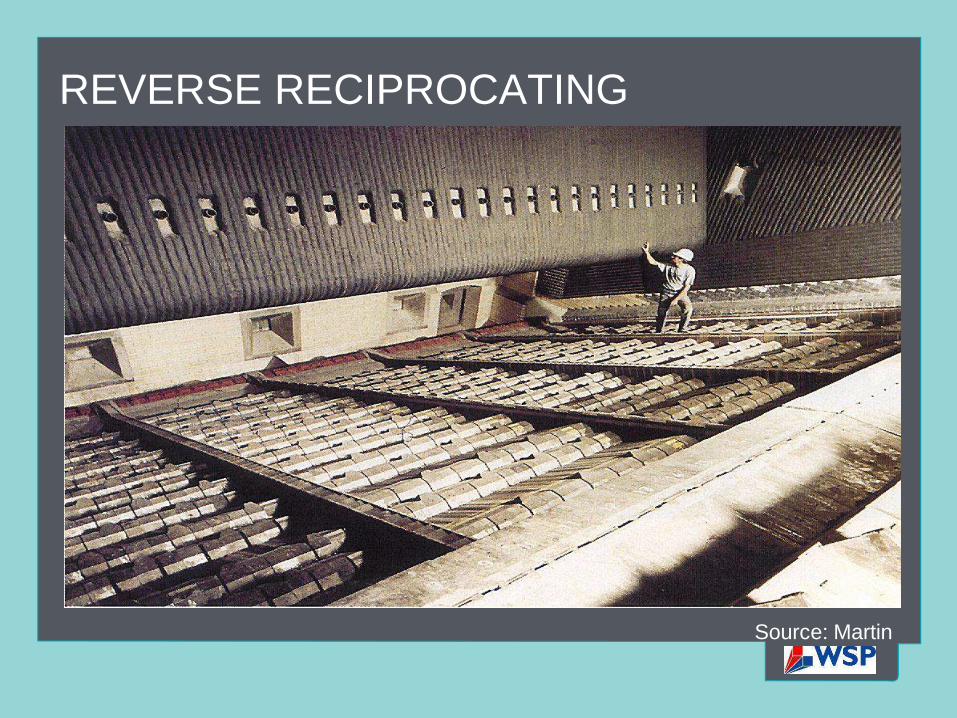
REVERSE RECIPROCATING
Source: Martin
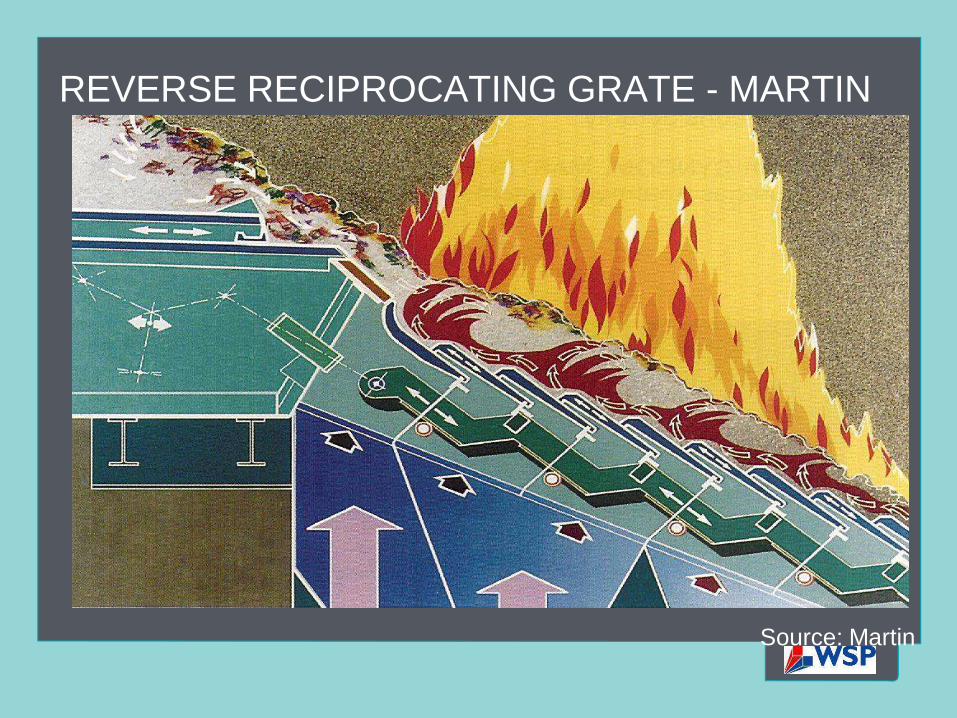
REVERSE RECIPROCATING GRATE - MARTIN
Source: Martin

FLUIDISED BED COMBUSTORS
Technology known for most of this century
Rapid developments during 1970's
Today well established and proven process for energy conversion
Technology has been applied to:coal (worldwide)biomass (Scandinavia and Canada)MSW/RDF (Japan, USA and Europe)
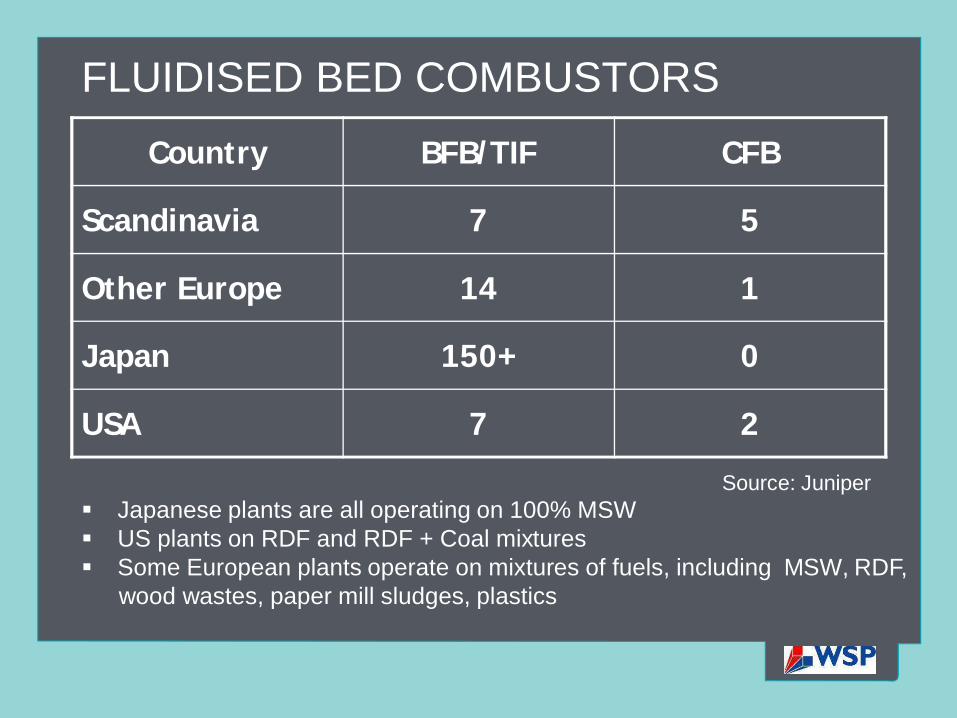
FLUIDISED BED COMBUSTORS
Country BFB/TIF CFB
Scandinavia 7 5
Other Europe 14 1
Japan 150+ 0
USA 7 2
Japanese plants are all operating on 100% MSW US plants on RDF and RDF + Coal mixturesSome European plants operate on mixtures of fuels, including MSW, RDF, wood wastes, paper mill sludges, plastics
Source: Juniper
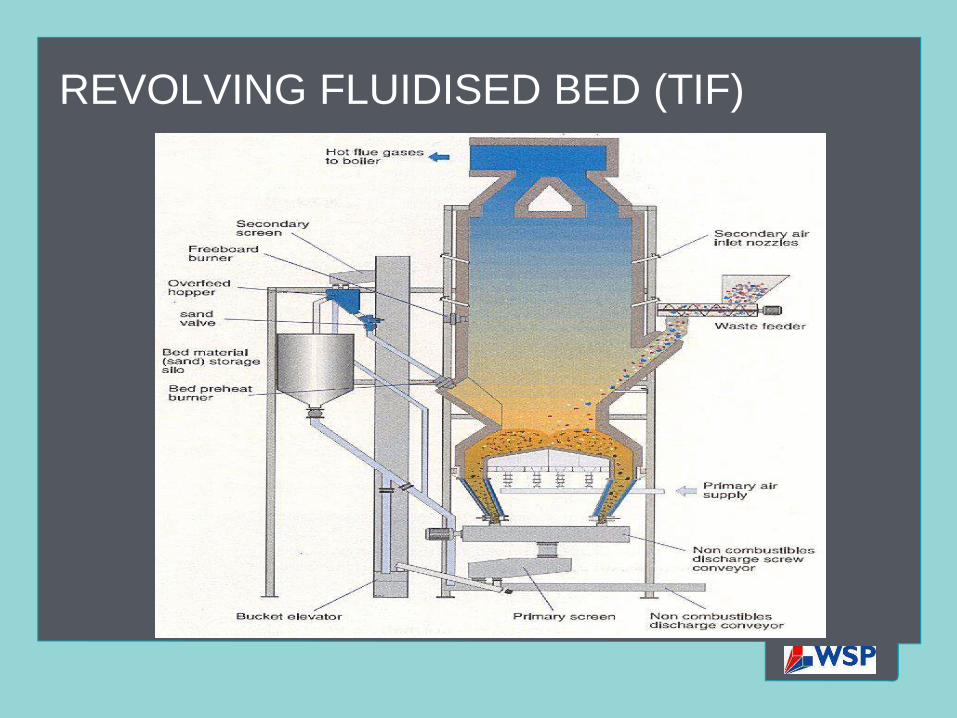
REVOLVING FLUIDISED BED (TIF)
FLUIDISED BED COMBUSTORS
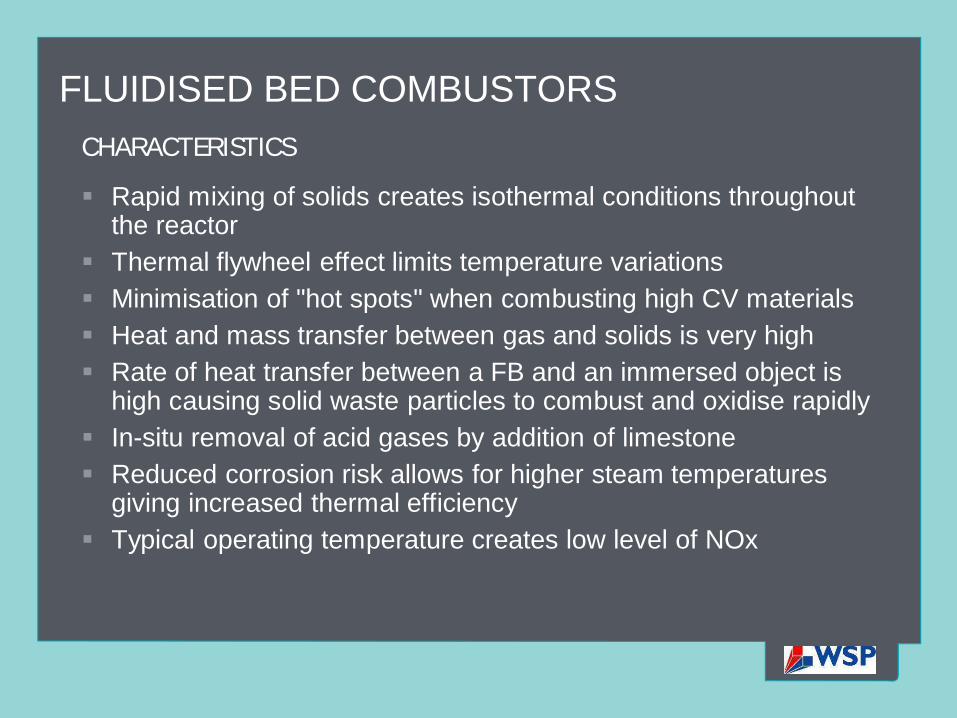
Rapid mixing of solids creates isothermal conditions throughout the reactorThermal flywheel effect limits temperature variationsMinimisation of "hot spots" when combusting high CV materialsHeat and mass transfer between gas and solids is very highRate of heat transfer between a FB and an immersed object is high causing solid waste particles to combust and oxidise rapidlyIn-situ removal of acid gases by addition of limestoneReduced corrosion risk allows for higher steam temperatures giving increased thermal efficiencyTypical operating temperature creates low level of NOx
CHARACTERISTICS
FLUIDISED BED COMBUSTORS
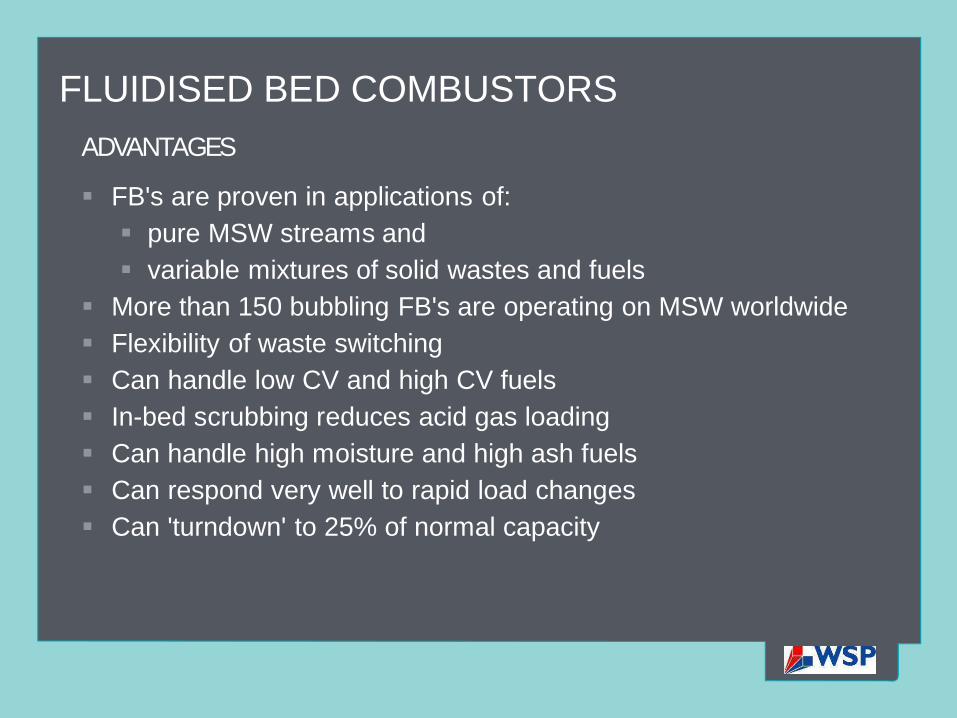
FB's are proven in applications of:pure MSW streams andvariable mixtures of solid wastes and fuels
More than 150 bubbling FB's are operating on MSW worldwideFlexibility of waste switchingCan handle low CV and high CV fuelsIn-bed scrubbing reduces acid gas loadingCan handle high moisture and high ash fuelsCan respond very well to rapid load changesCan 'turndown' to 25% of normal capacity
ADVANTAGES
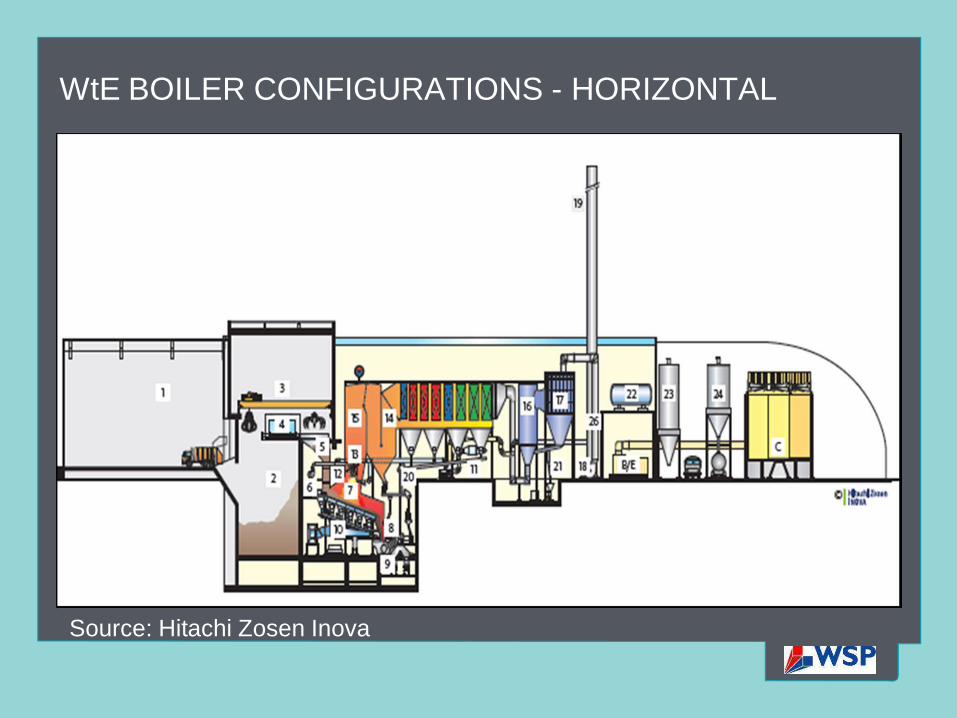
WtE BOILER CONFIGURATIONS - HORIZONTAL
Source: Hitachi Zosen Inova
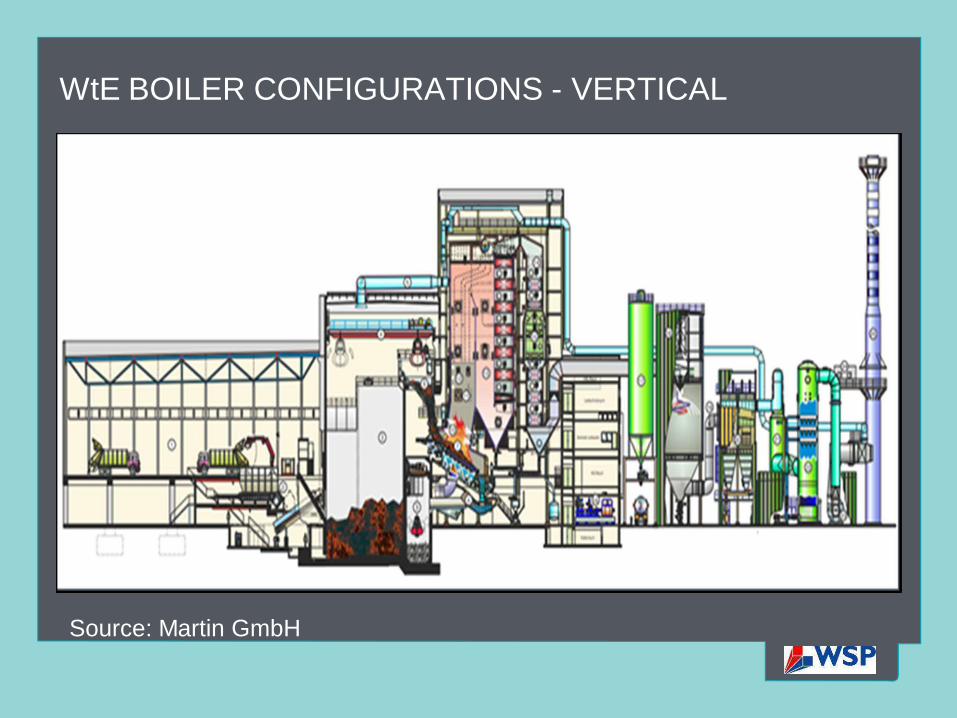
WtE BOILER CONFIGURATIONS - VERTICAL
Source: Martin GmbH

PROS & CONS OF BOILER COFIGURATION IN WtEPLANTS
Horizontal boiler arrangement Vertical boiler arrangement
Meets current state-of-the-art designMany reference plants worldwideMeets all current guaranteesEmploys mechanical rapping tube cleaning methods therefore lowers internal steam consumptionRequires more land take
Meets current state-of-the-art designMany reference plants worldwideMeets all current guaranteesEmploys soot blowers therefore steam consumption higherRequires taller buildingLower investment cost
THERMAL CAPACITY AND THERMAL EFFICIENCYThermal capacity of an EfW plant governed by:
Mechanical loadFuel CVThermal capacity of boilerFiring Diagram
Thermal efficiency of an EfW plant constrained by:Rankine steam cycleSteam pressure and temperatureChlorine corrosionFouling by alkali metals
EU Waste Framework Directive R1 Efficiency FactorEfW plant determined as Resource Recovery process …… and not a Disposal process (D10)New plants must meet an R1 value > 0.65
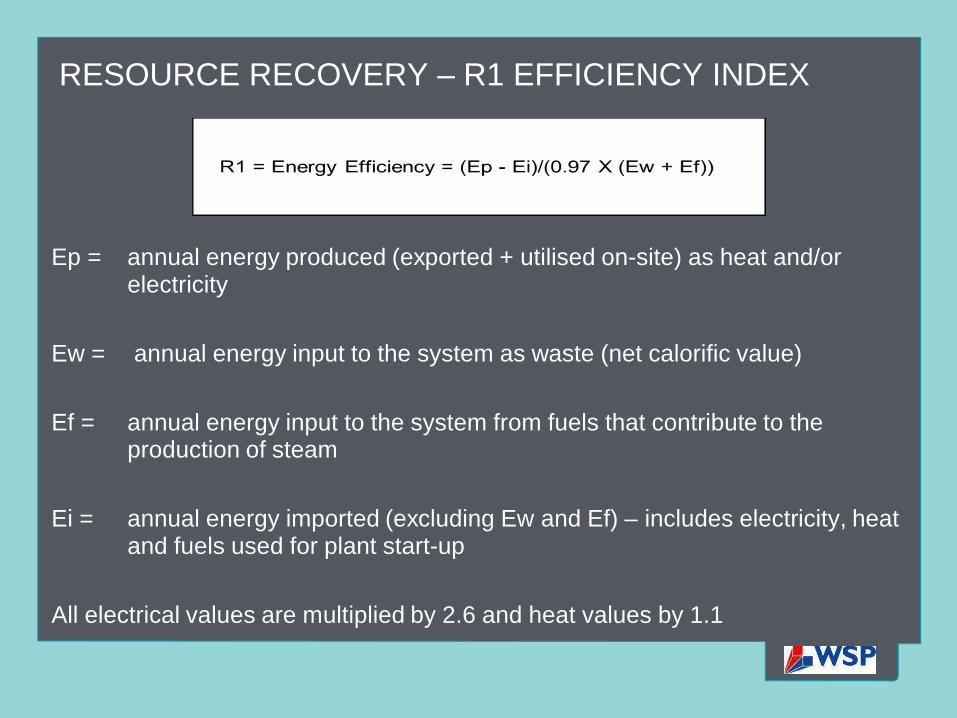
RESOURCE RECOVERY – R1 EFFICIENCY INDEX
Ep = annual energy produced (exported + utilised on-site) as heat and/or electricity
Ew = annual energy input to the system as waste (net calorific value)
Ef = annual energy input to the system from fuels that contribute to the production of steam
Ei = annual energy imported (excluding Ew and Ef) – includes electricity, heat and fuels used for plant start-up
All electrical values are multiplied by 2.6 and heat values by 1.1
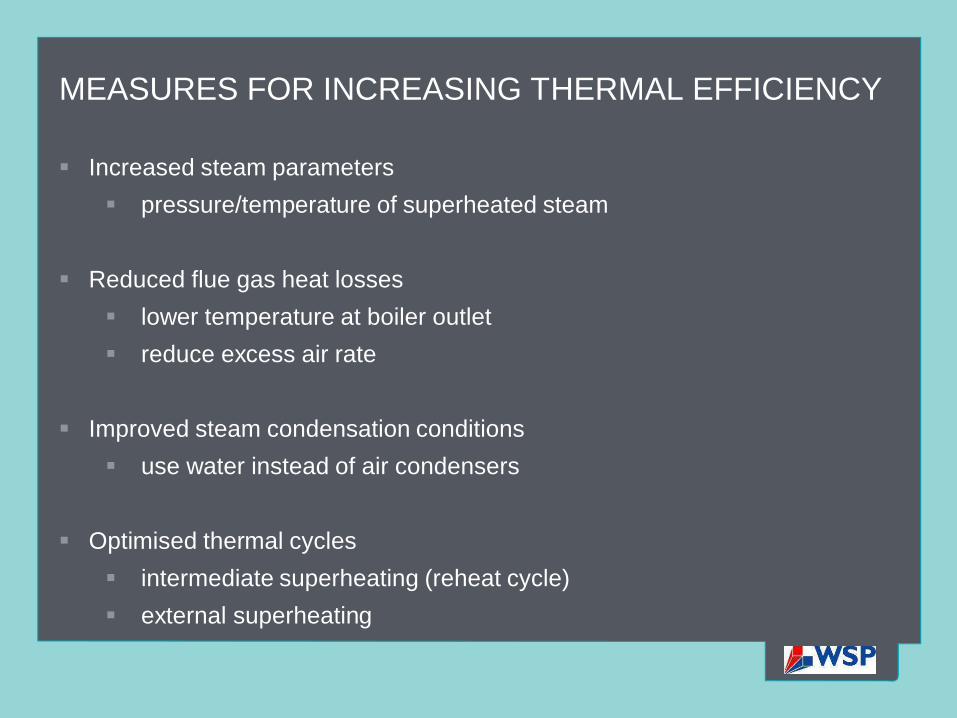
MEASURES FOR INCREASING THERMAL EFFICIENCY
Increased steam parameterspressure/temperature of superheated steam
Reduced flue gas heat losseslower temperature at boiler outletreduce excess air rate
Improved steam condensation conditionsuse water instead of air condensers
Optimised thermal cyclesintermediate superheating (reheat cycle)external superheating
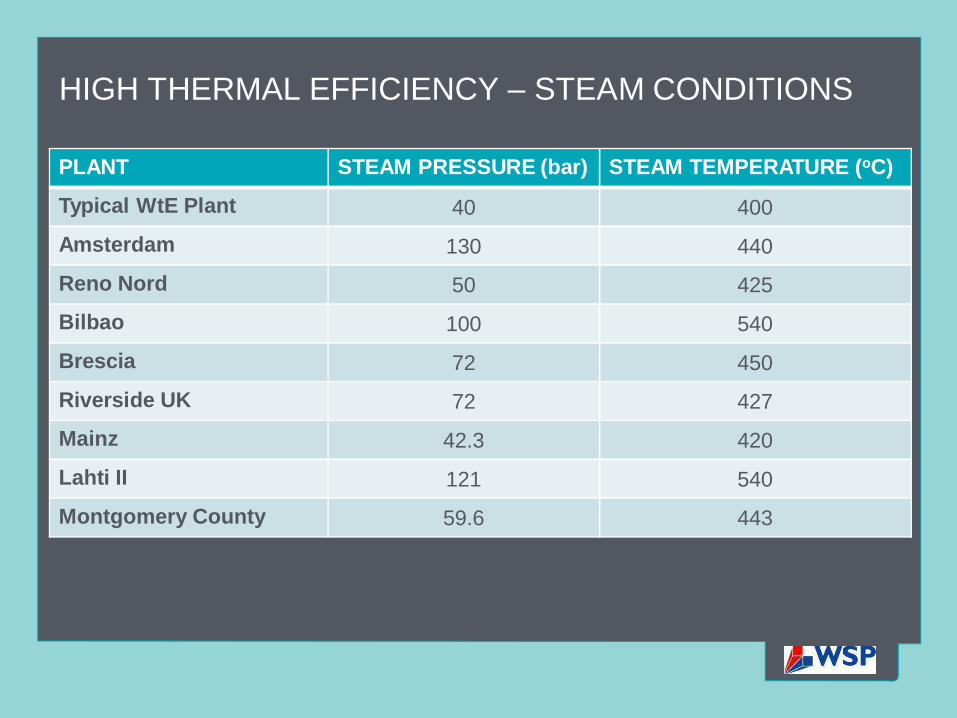
HIGH THERMAL EFFICIENCY – STEAM CONDITIONS
PLANT STEAM PRESSURE (bar) STEAM TEMPERATURE (oC)
Typical WtE Plant 40 400
Amsterdam 130 440
Reno Nord 50 425
Bilbao 100 540
Brescia 72 450
Riverside UK 72 427
Mainz 42.3 420
Lahti II 121 540
Montgomery County 59.6 443
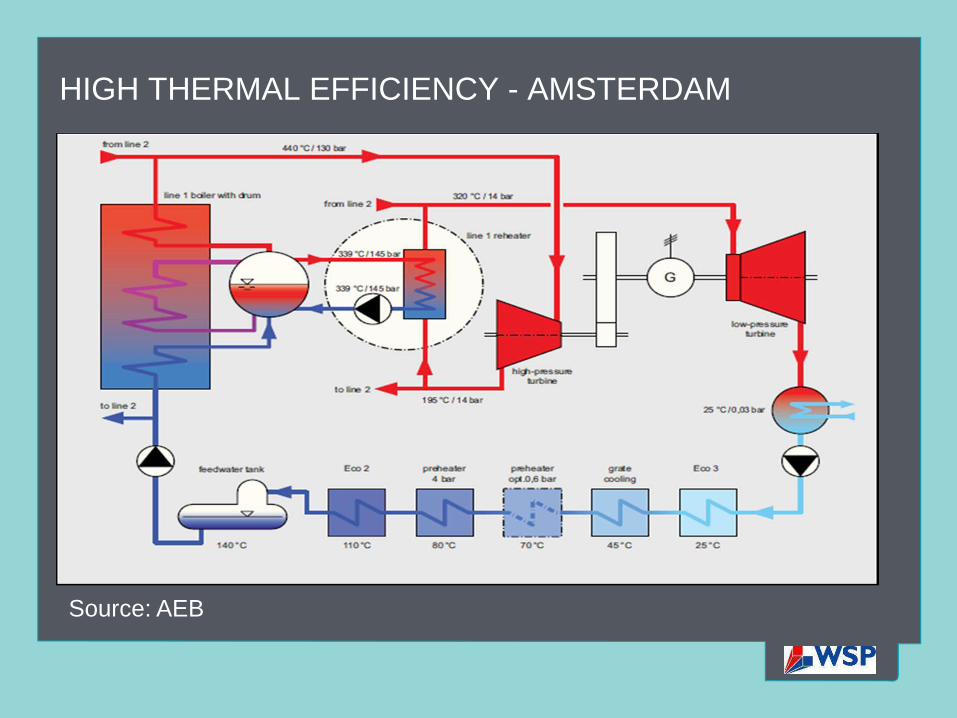
HIGH THERMAL EFFICIENCY - AMSTERDAM
Source: AEB
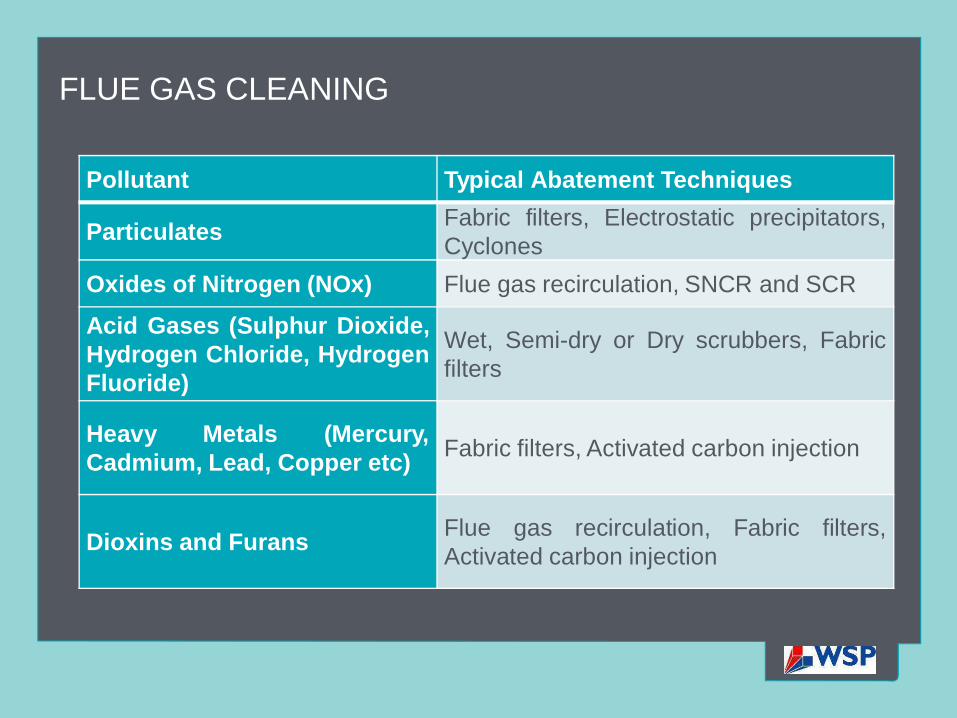
FLUE GAS CLEANING
Pollutant Typical Abatement Techniques
Particulates Fabric filters, Electrostatic precipitators,Cyclones
Oxides of Nitrogen (NOx) Flue gas recirculation, SNCR and SCR
Acid Gases (Sulphur Dioxide,Hydrogen Chloride, HydrogenFluoride)
Wet, Semi-dry or Dry scrubbers, Fabricfilters
Heavy Metals (Mercury,Cadmium, Lead, Copper etc) Fabric filters, Activated carbon injection
Dioxins and Furans Flue gas recirculation, Fabric filters,Activated carbon injection
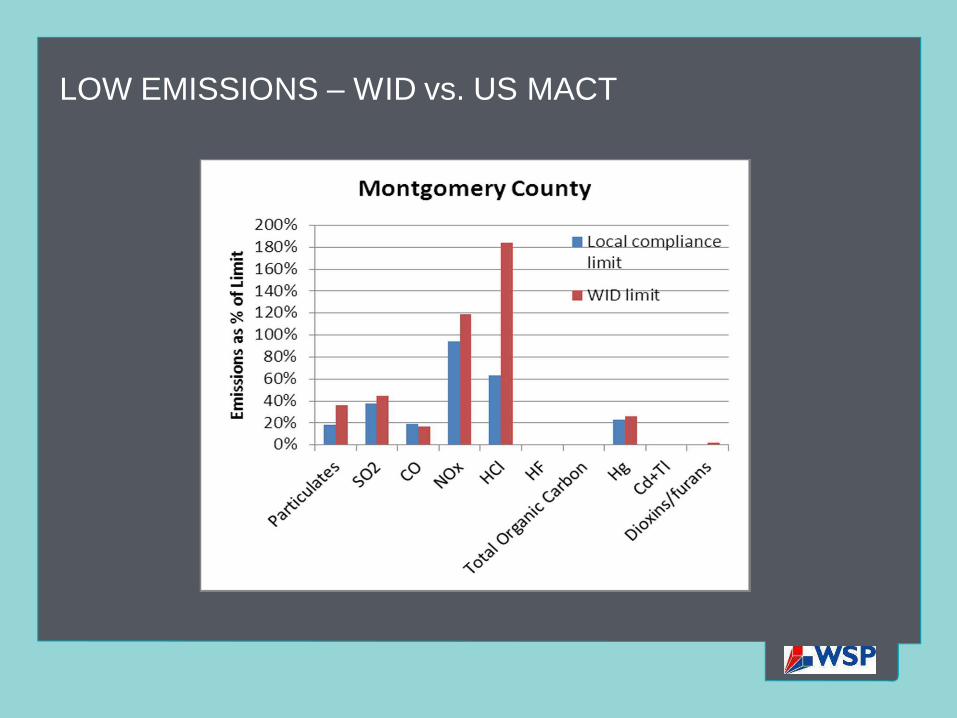
LOW EMISSIONS – WID vs. US MACT
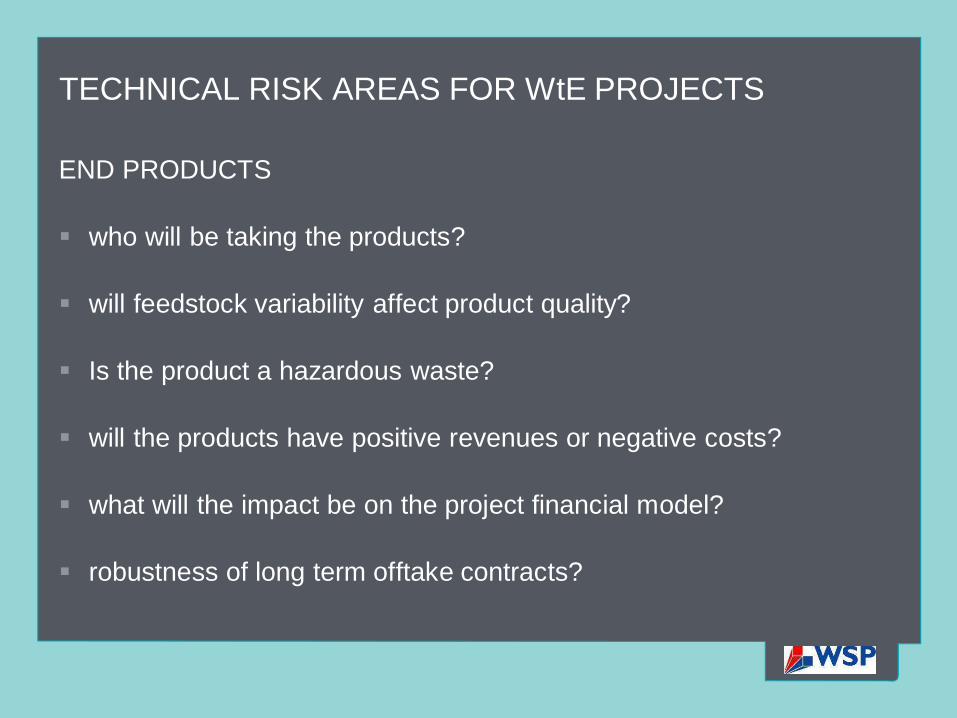
TECHNICAL RISK AREAS FOR WtE PROJECTS
END PRODUCTS
who will be taking the products?
will feedstock variability affect product quality?
Is the product a hazardous waste?
will the products have positive revenues or negative costs?
what will the impact be on the project financial model?
robustness of long term offtake contracts?
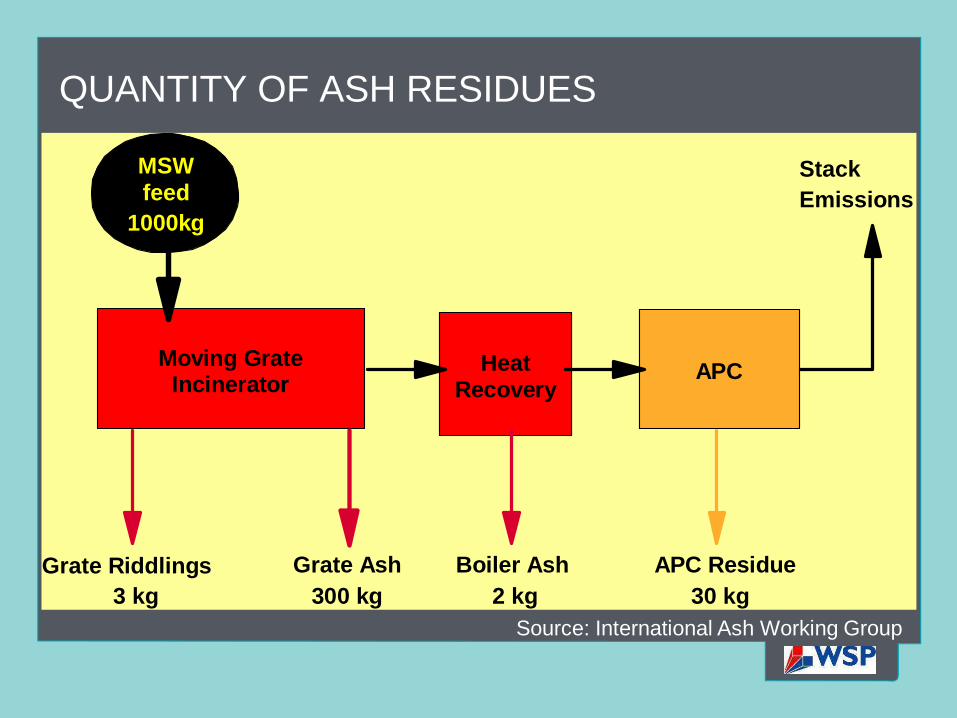
QUANTITY OF ASH RESIDUES
Moving Grate Incinerator
Heat Recovery
APC
MSW feed
1000kg
StackEmissions
Grate Riddlings Grate Ash Boiler Ash APC Residue3 kg 300 kg 2 kg 30 kg
Source: International Ash Working Group
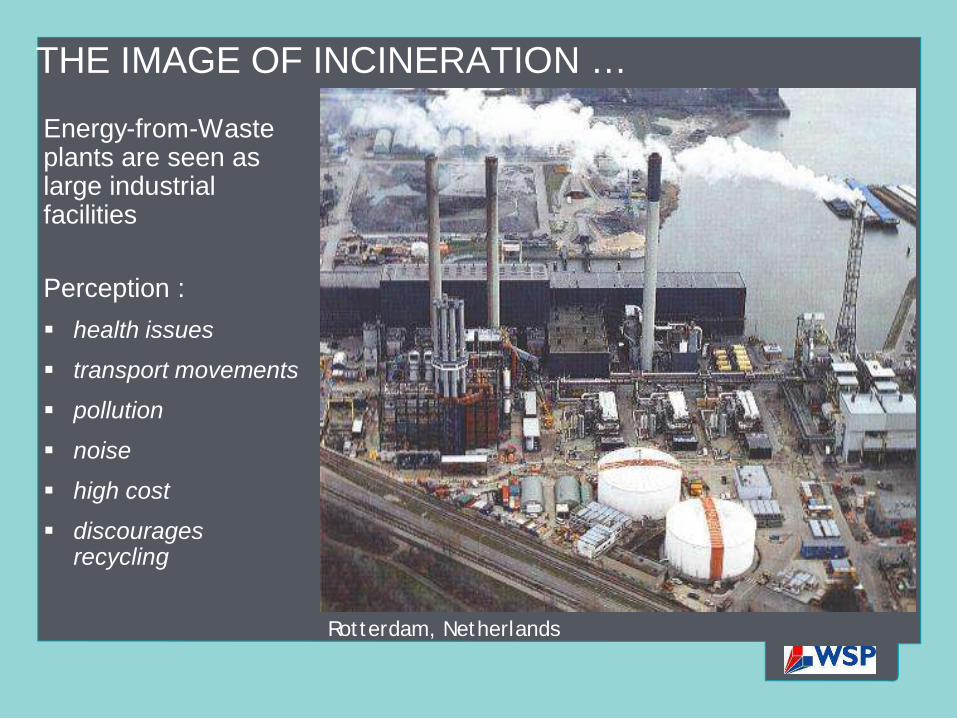
THE IMAGE OF INCINERATION …
Energy-from-Waste plants are seen as large industrial facilities
Perception :health issues
transport movements
pollution
noise
high cost
discourages recycling
Rotterdam, Netherlands
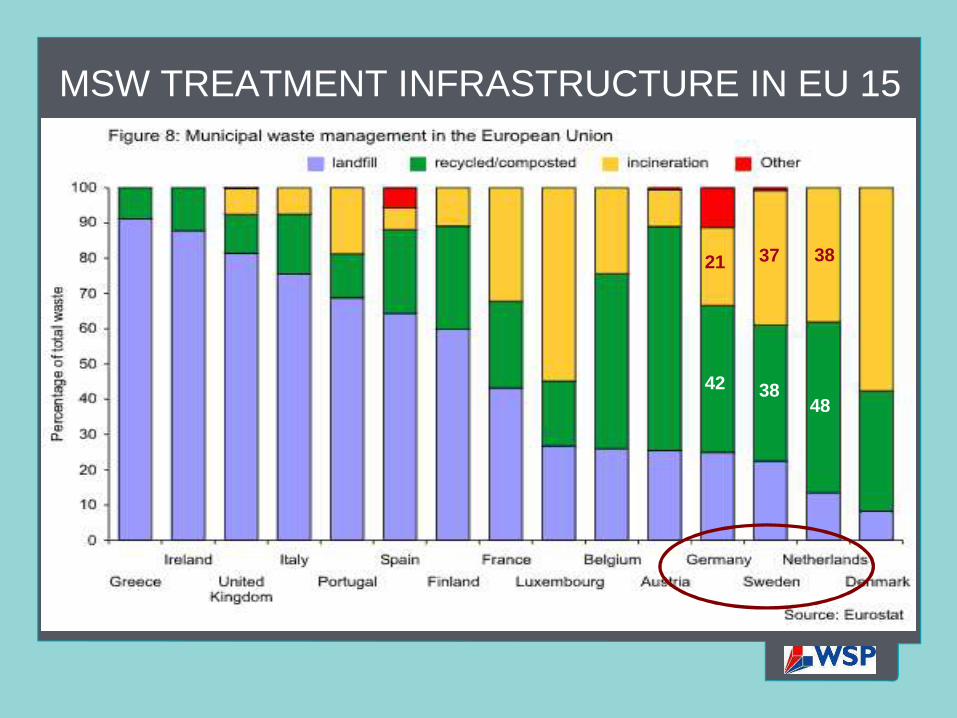
MSW TREATMENT INFRASTRUCTURE IN EU 15
42
21
38
37 38
48
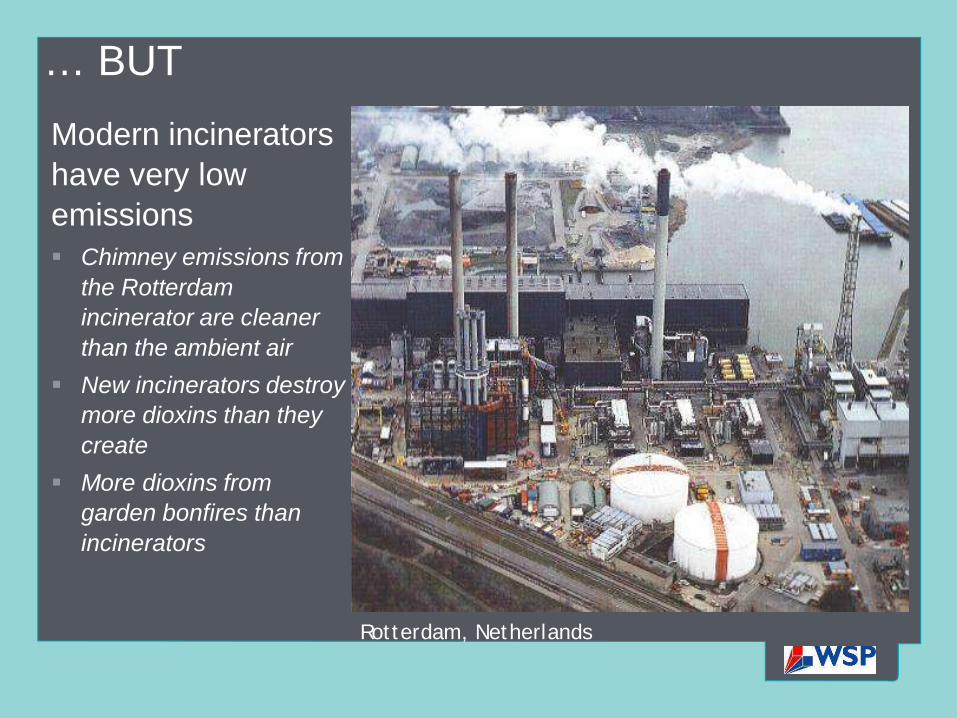
… BUTModern incinerators have very low emissions
Chimney emissions from the Rotterdam incinerator are cleaner than the ambient airNew incinerators destroy more dioxins than they createMore dioxins from garden bonfires than incinerators
Rotterdam, Netherlands
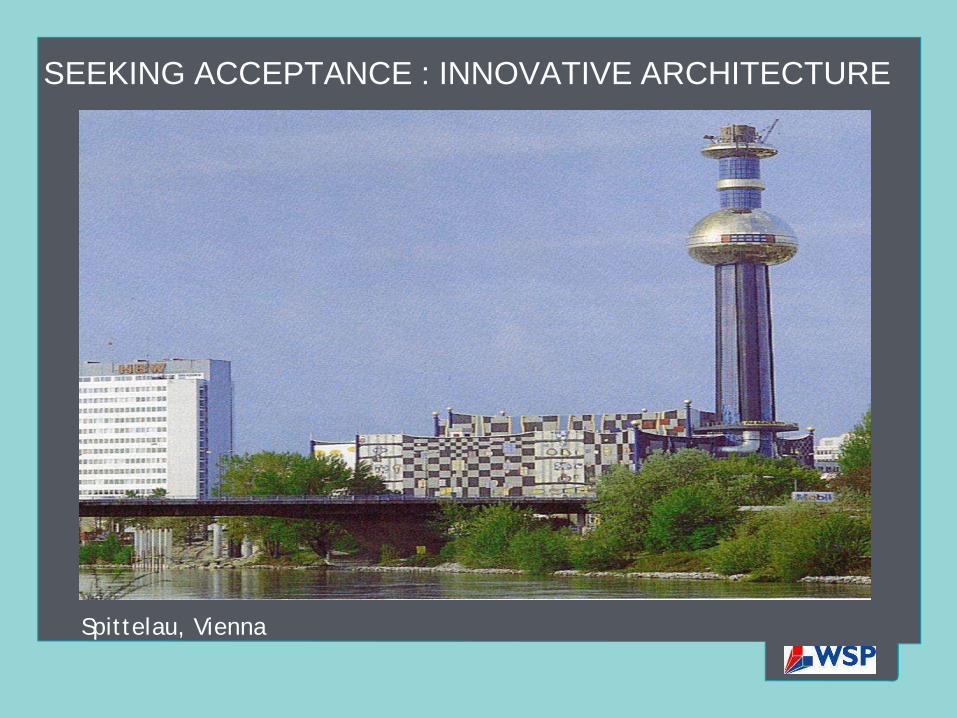
SEEKING ACCEPTANCE : INNOVATIVE ARCHITECTURE
Spittelau, Vienna
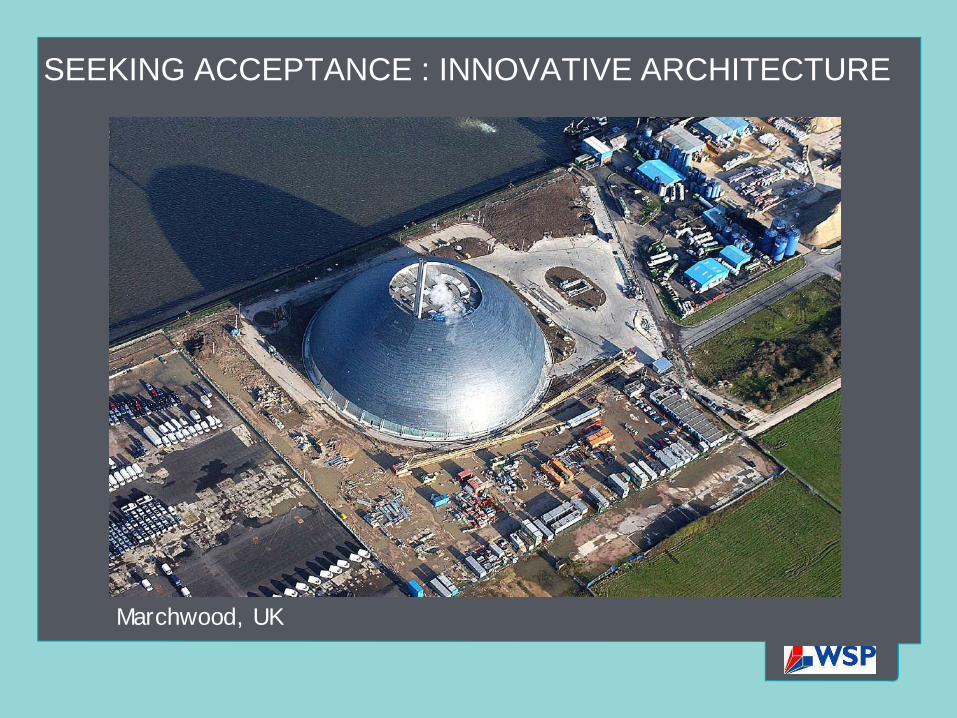
SEEKING ACCEPTANCE : INNOVATIVE ARCHITECTURE
Marchwood, UK
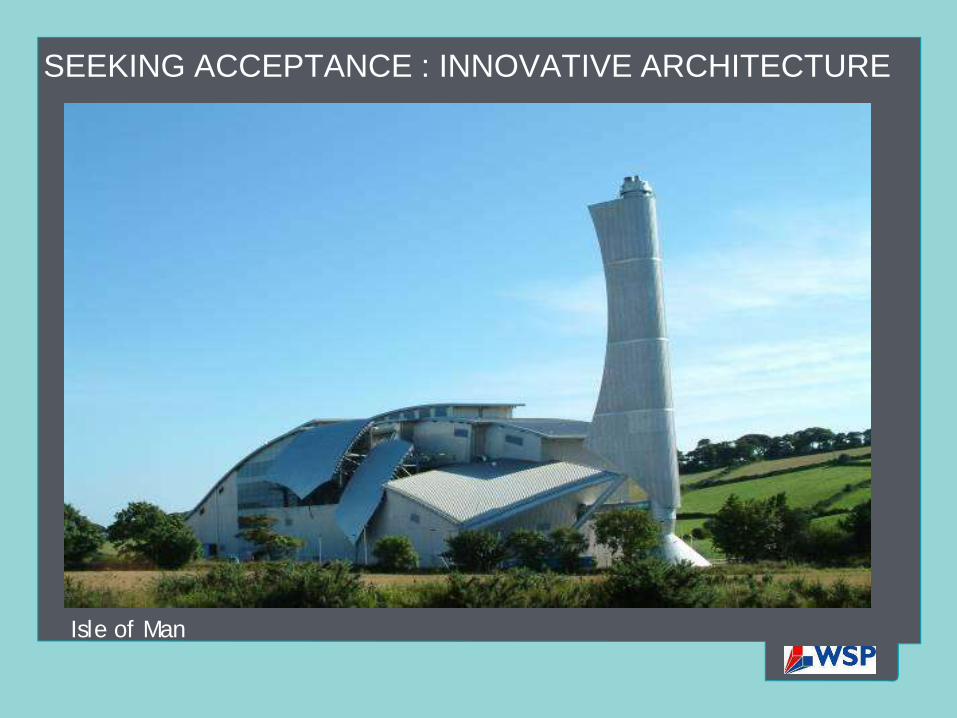
SEEKING ACCEPTANCE : INNOVATIVE ARCHITECTURE
Isle of Man
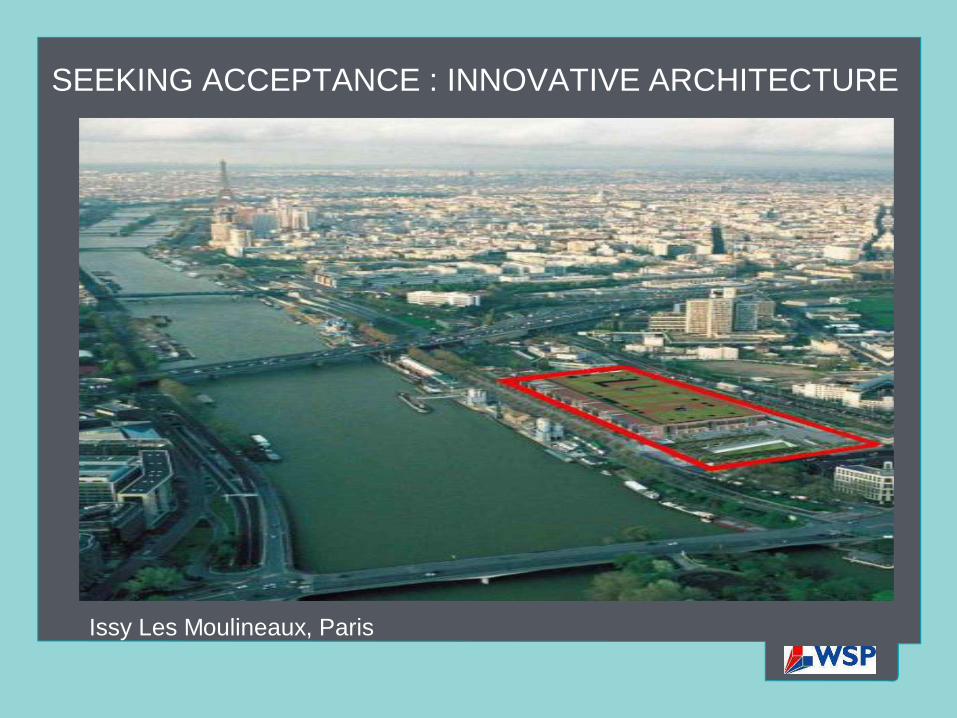
SEEKING ACCEPTANCE : INNOVATIVE ARCHITECTURE
Issy Les Moulineaux, Paris
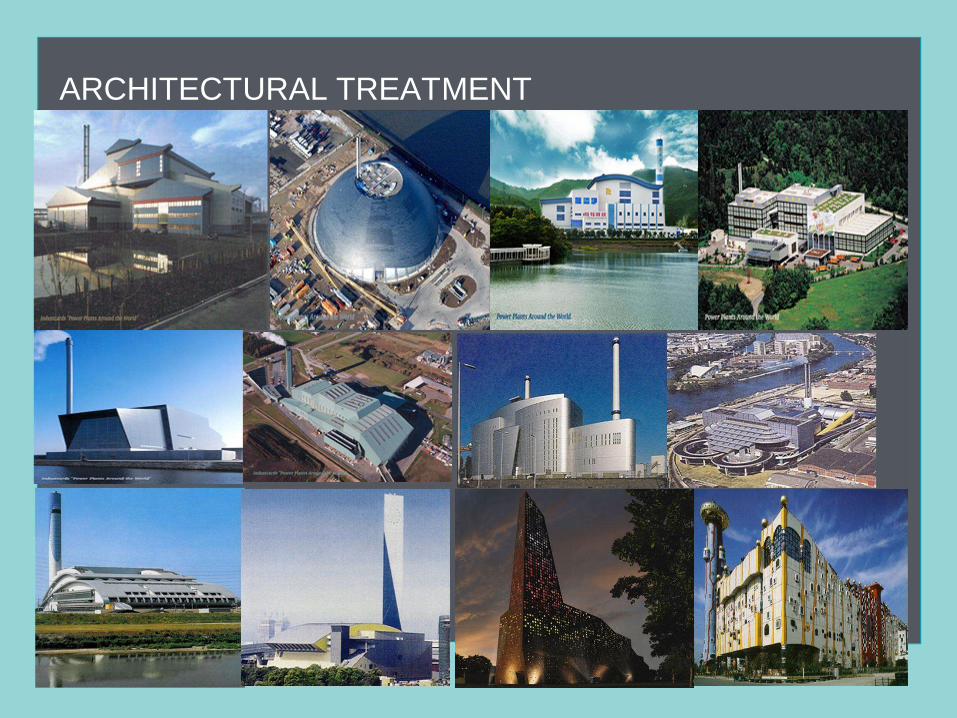
ARCHITECTURAL TREATMENT
Winkler fluid bed gasifier
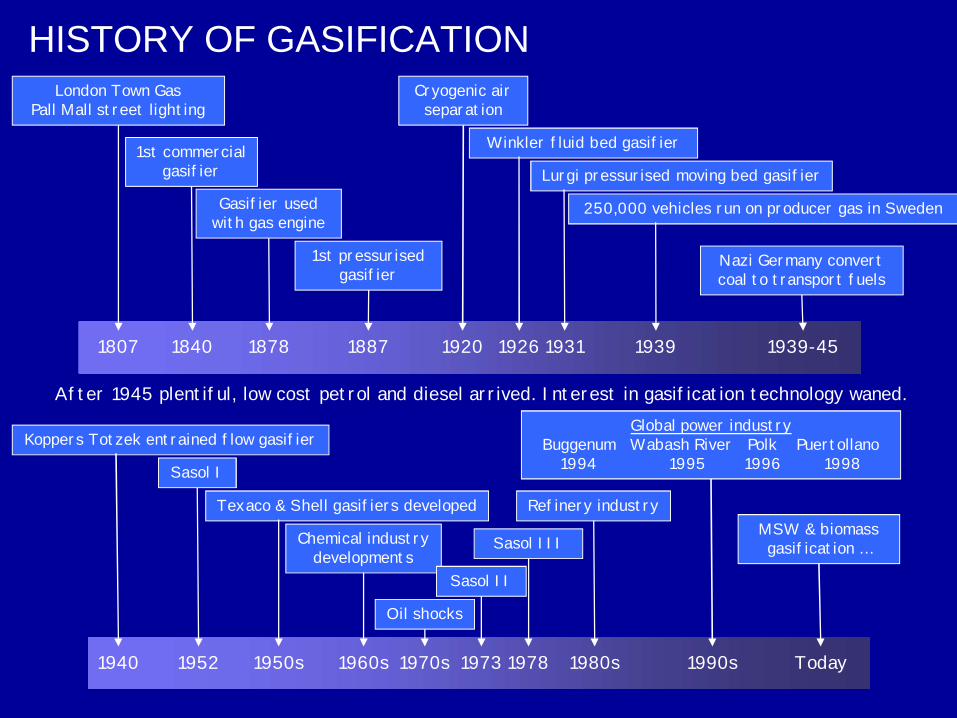
HISTORY OF GASIFICATIONLondon Town Gas
Pall Mall street lighting
1st commercialgasifier
1807 1840 1878
Gasifier usedwith gas engine
1887
1st pressurisedgasifier
1920
Cryogenic airseparation
1931 1939-45
Nazi Germany convertcoal to transport fuels
1939
250,000 vehicles run on producer gas in Sweden
After 1945 plentiful, low cost petrol and diesel arrived. Interest in gasification technology waned.
1926
Lurgi pressurised moving bed gasifier
1940
Koppers Totzek entrained flow gasifier
1952
Sasol I
1950s
Texaco & Shell gasifiers developed
1960s
Chemical industrydevelopments
1973
Sasol II
1978
Sasol III
1980s
Refinery industry
1990s
Global power industryBuggenum Wabash River Polk Puertollano
1994 1995 1996 1998
1970s
Oil shocks
Today
MSW & biomassgasification …
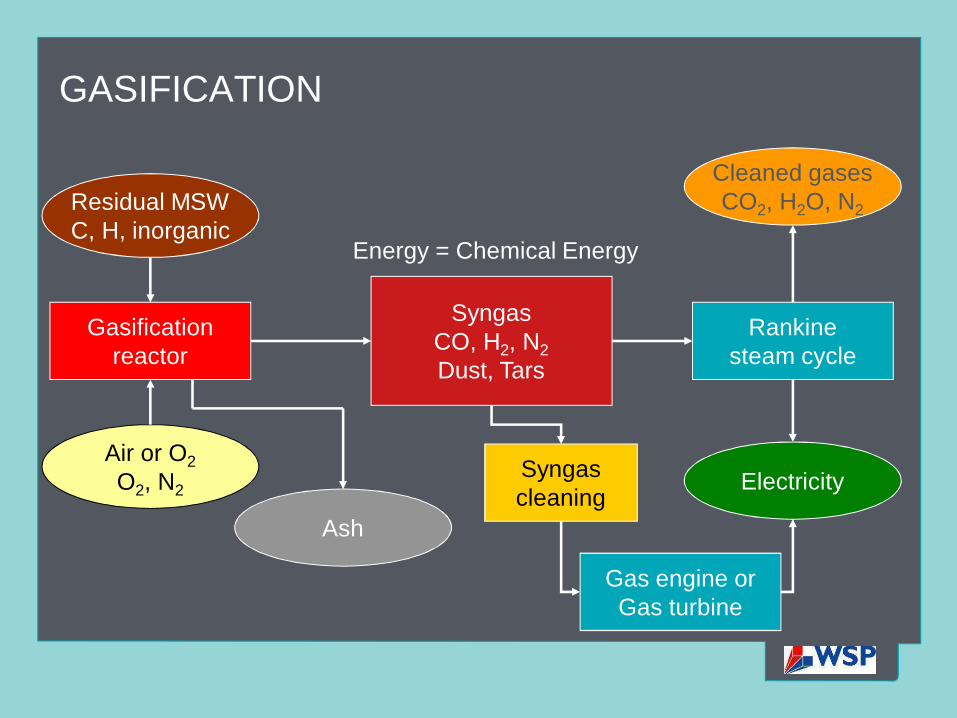
GASIFICATION
Gasificationreactor
Residual MSWC, H, inorganic
Air or O2O2, N2
SyngasCO, H2, N2Dust, Tars
Ash
Energy = Chemical Energy
Rankinesteam cycle
Electricity
Cleaned gasesCO2, H2O, N2
Gas engine orGas turbine
Syngascleaning
SOLIDS DO NOT BURN!
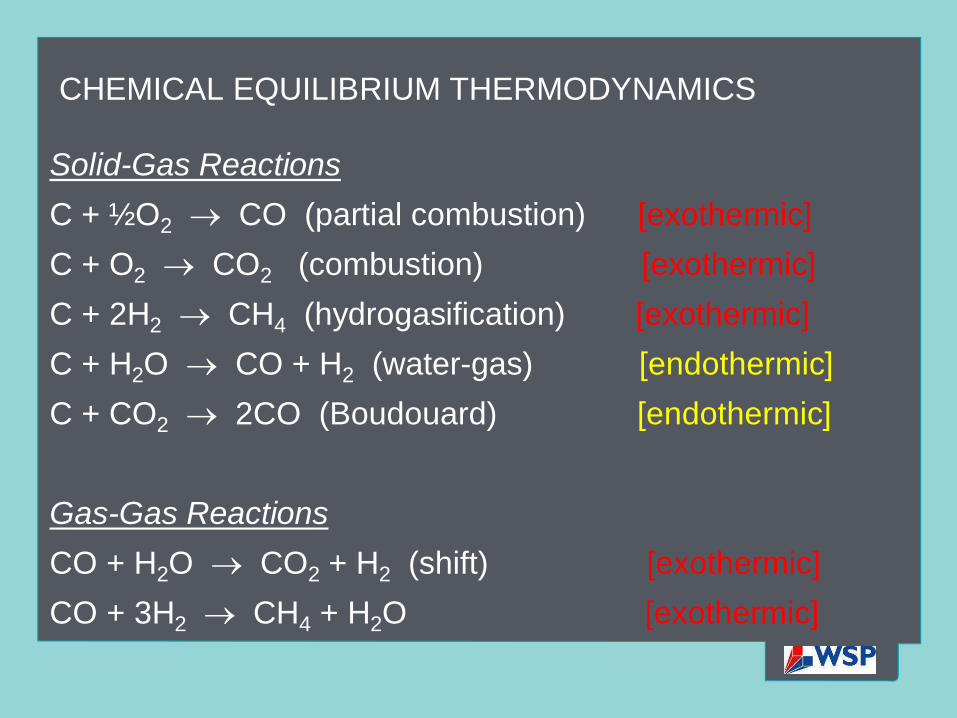
CHEMICAL EQUILIBRIUM THERMODYNAMICS
Solid-Gas ReactionsC + ½O2 CO (partial combustion) [exothermic]C + O2 CO2 (combustion) [exothermic]C + 2H2 CH4 (hydrogasification) [exothermic]C + H2O CO + H2 (water-gas) [endothermic]C + CO2 2CO (Boudouard) [endothermic]
Gas-Gas ReactionsCO + H2O CO2 + H2 (shift) [exothermic]CO + 3H2 CH4 + H2O [exothermic]
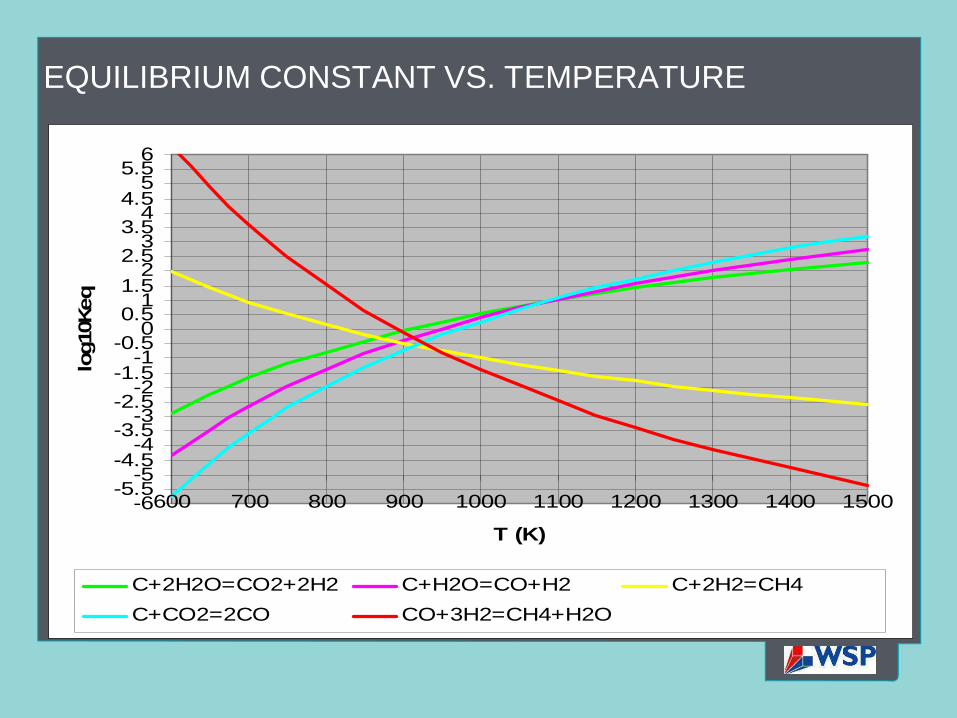
EQUILIBRIUM CONSTANT VS. TEMPERATURE
-6-5.5
-5-4.5
-4-3.5
-3-2.5
-2-1.5
-1-0.5
00.5
11.5
22.5
33.5
44.5
55.5
6
600 700 800 900 1000 1100 1200 1300 1400 1500
T (K)
log1
0Keq
C+2H2O=CO2+2H2 C+H2O=CO+H2 C+2H2=CH4C+CO2=2CO CO+3H2=CH4+H2O
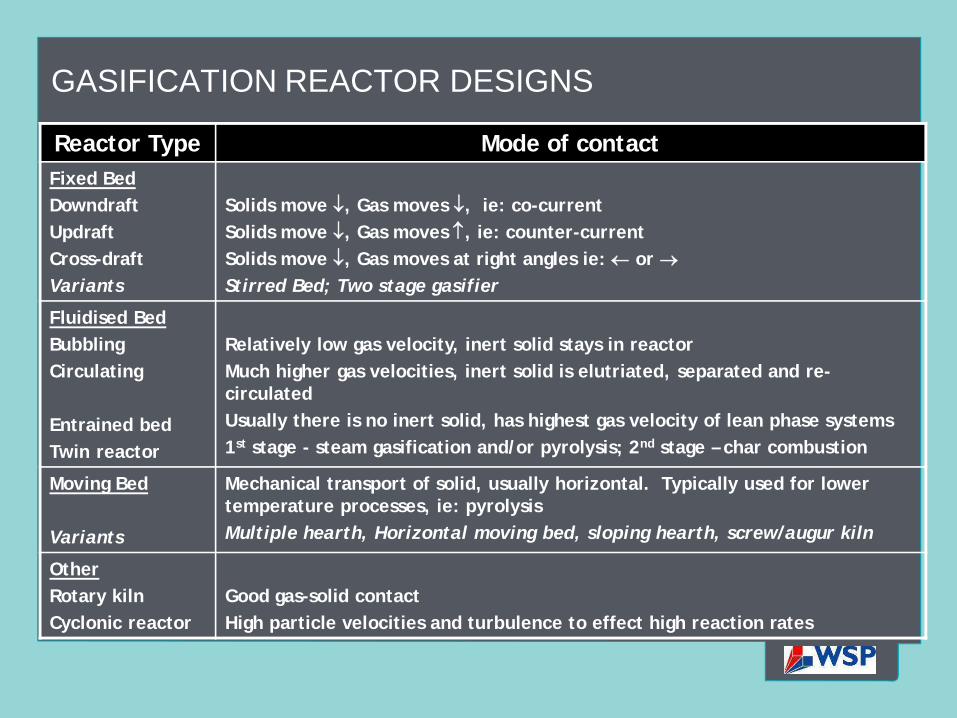
GASIFICATION REACTOR DESIGNS
Reactor Type Mode of contactFixed BedDowndraftUpdraftCross-draftVariants
Solids move , Gas moves , ie: co-currentSolids move , Gas moves , ie: counter-currentSolids move , Gas moves at right angles ie: or Stirred Bed; Two stage gasifier
Fluidised BedBubblingCirculating
Entrained bedTwin reactor
Relatively low gas velocity, inert solid stays in reactorMuch higher gas velocities, inert solid is elutriated, separated and re-circulatedUsually there is no inert solid, has highest gas velocity of lean phase systems1st stage - steam gasification and/or pyrolysis; 2nd stage – char combustion
Moving Bed
Variants
Mechanical transport of solid, usually horizontal. Typically used for lower temperature processes, ie: pyrolysisMultiple hearth, Horizontal moving bed, sloping hearth, screw/augur kiln
OtherRotary kilnCyclonic reactor
Good gas-solid contactHigh particle velocities and turbulence to effect high reaction rates

“ADVANTAGES” OF PYROLYSIS & GASIFICATION
Not combustion or incineration …… therefore better PR imageAppeals to the proponents of the NIMTOO syndrome …… but not necessarily to the proponents of the BANANA syndromeGreater flexibility - can produce useful products
concentrated syngas (low volume)gaseous fueltransportable fuelsfeedstock chemicals
Can produce a melted ash granulatePotentially higher thermal efficiency – more energy/tonneLower NOx and toxic organics
SO YOU WANT TO BUY A GASIFICATION PLANT?
WHICH TYPE OF GASIFICATION PLANT SHOULD YOU CHOOSE?
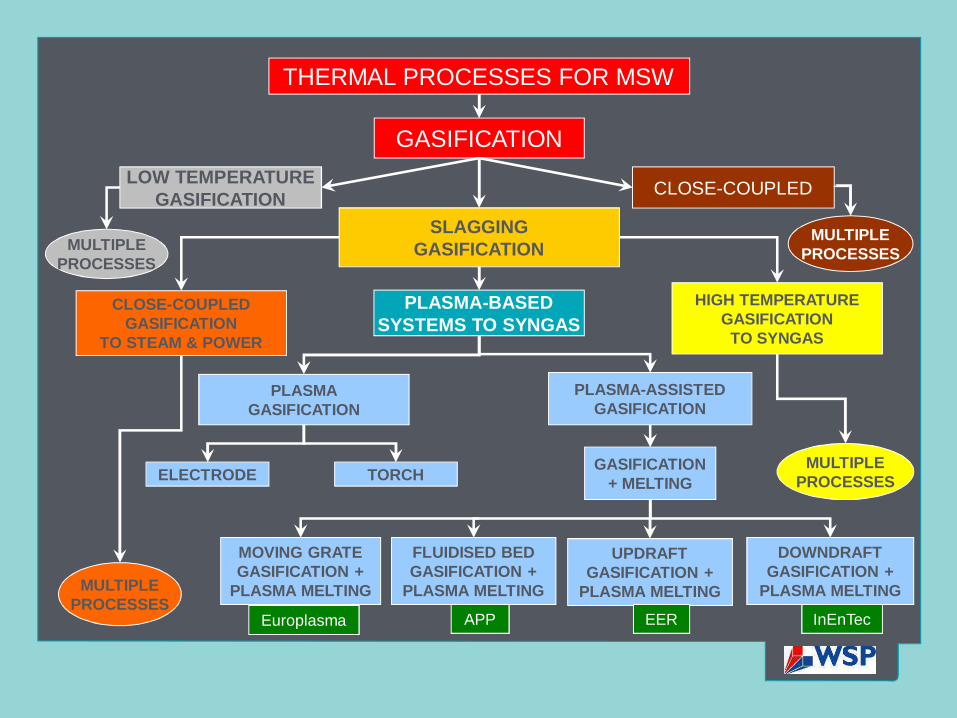
GASIFICATION
SLAGGINGGASIFICATION
CLOSE-COUPLEDGASIFICATION
TO STEAM & POWER
HIGH TEMPERATUREGASIFICATION
TO SYNGAS
PLASMA-BASEDSYSTEMS TO SYNGAS
PLASMAGASIFICATION
PLASMA-ASSISTEDGASIFICATION
ELECTRODE TORCH GASIFICATION+ MELTING
FLUIDISED BEDGASIFICATION +
PLASMA MELTING
UPDRAFTGASIFICATION +
PLASMA MELTING
DOWNDRAFTGASIFICATION +
PLASMA MELTING
THERMAL PROCESSES FOR MSW
CLOSE-COUPLED
MULTIPLEPROCESSES
LOW TEMPERATUREGASIFICATION
MULTIPLEPROCESSES
MULTIPLEPROCESSES
MULTIPLEPROCESSES
MOVING GRATEGASIFICATION +
PLASMA MELTING
APP EER InEnTecEuroplasma
51
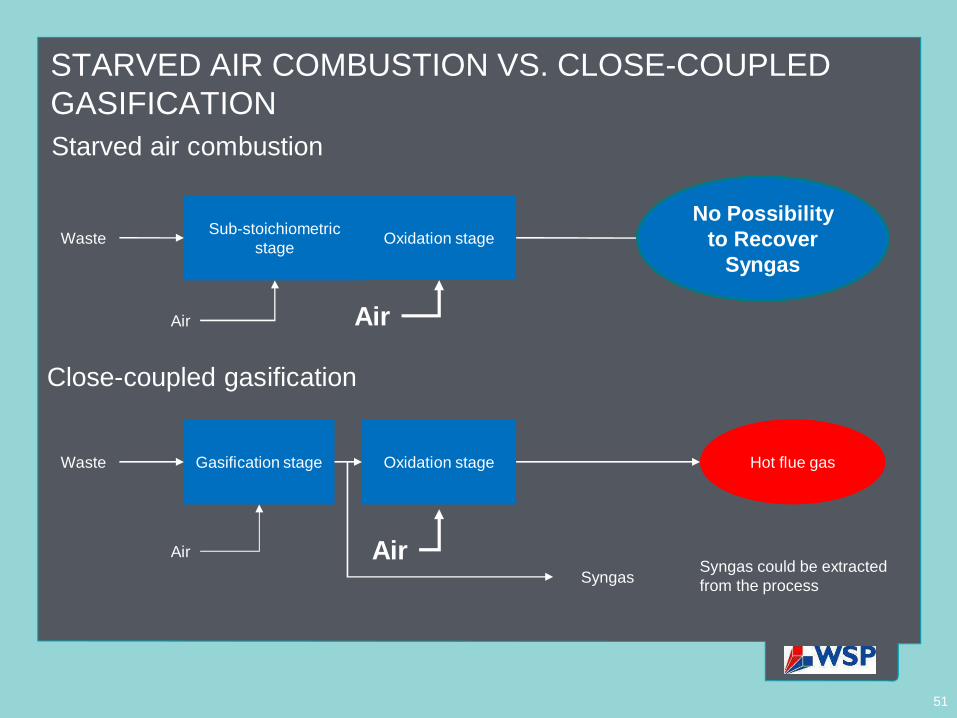
STARVED AIR COMBUSTION VS. CLOSE-COUPLED GASIFICATION
Sub-stoichiometric stage Oxidation stageWaste
Air Air
Hot flue gas
Starved air combustion
Gasification stage Oxidation stageWaste
Air Air
Hot flue gas
Close-coupled gasification
SyngasSyngas could be extracted from the process
Hot flue gasNo Possibility
to Recover Syngas
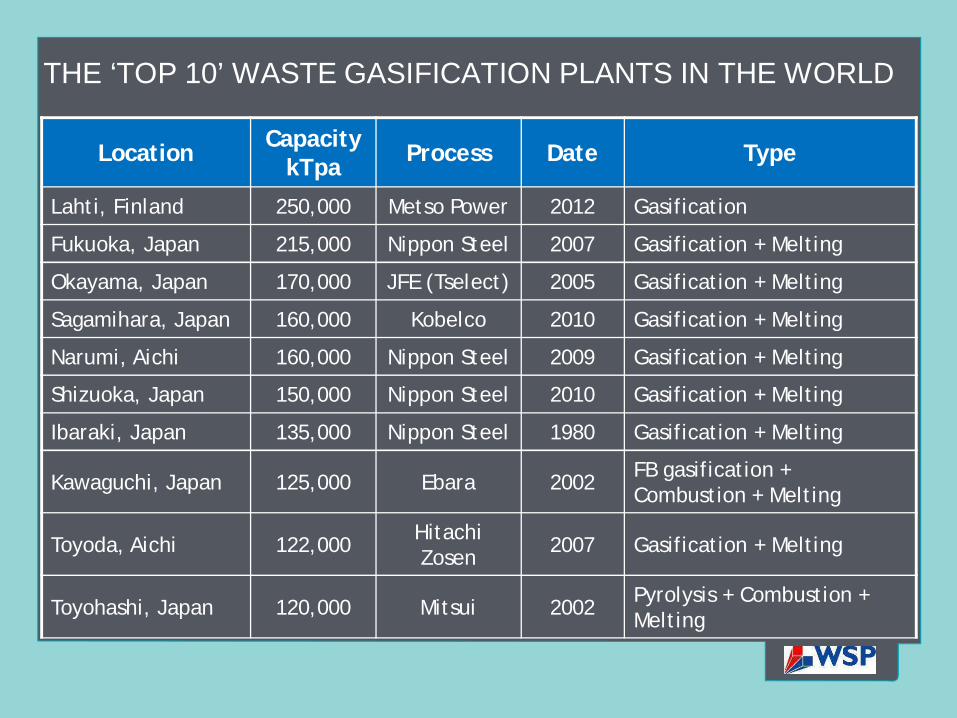
THE ‘TOP 10’ WASTE GASIFICATION PLANTS IN THE WORLD
Location Capacity kTpa Process Date Type
Lahti, Finland 250,000 Metso Power 2012 Gasification
Fukuoka, Japan 215,000 Nippon Steel 2007 Gasification + Melting
Okayama, Japan 170,000 JFE (Tselect) 2005 Gasification + Melting
Sagamihara, Japan 160,000 Kobelco 2010 Gasification + Melting
Narumi, Aichi 160,000 Nippon Steel 2009 Gasification + Melting
Shizuoka, Japan 150,000 Nippon Steel 2010 Gasification + Melting
Ibaraki, Japan 135,000 Nippon Steel 1980 Gasification + Melting
Kawaguchi, Japan 125,000 Ebara 2002 FB gasification + Combustion + Melting
Toyoda, Aichi 122,000 Hitachi Zosen 2007 Gasification + Melting
Toyohashi, Japan 120,000 Mitsui 2002 Pyrolysis + Combustion + Melting
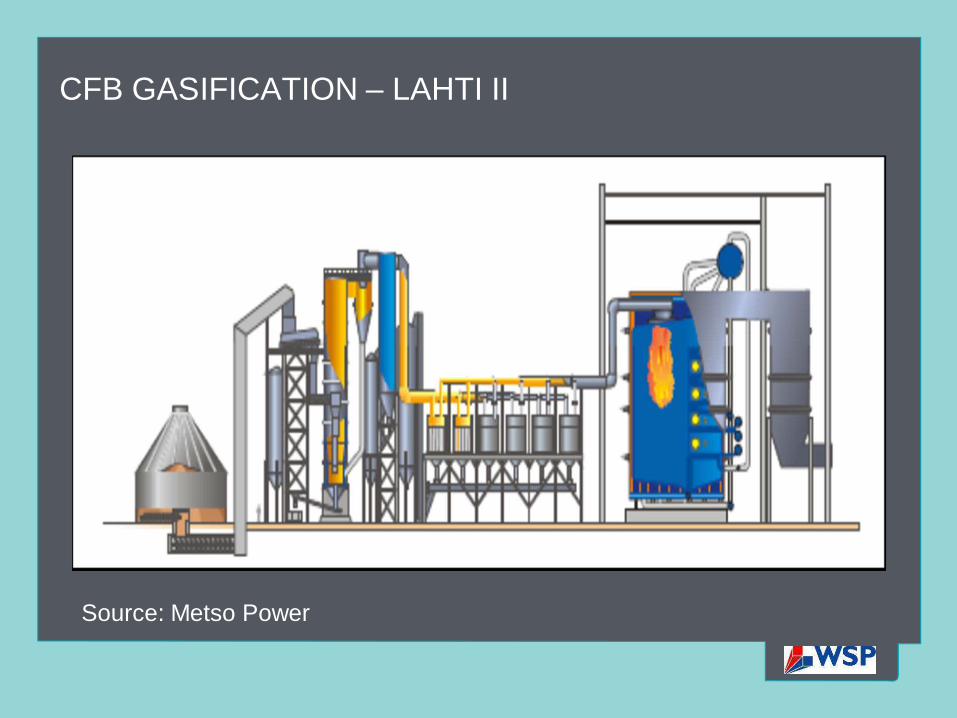
CFB GASIFICATION – LAHTI II
Source: Metso Power
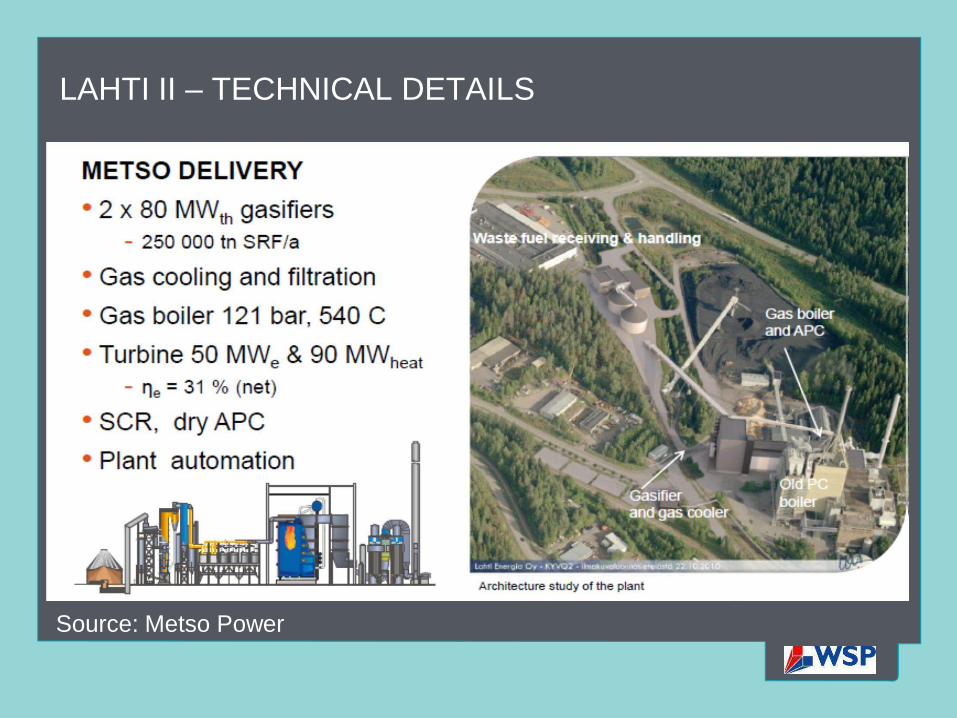
LAHTI II – TECHNICAL DETAILS
Source: Metso Power
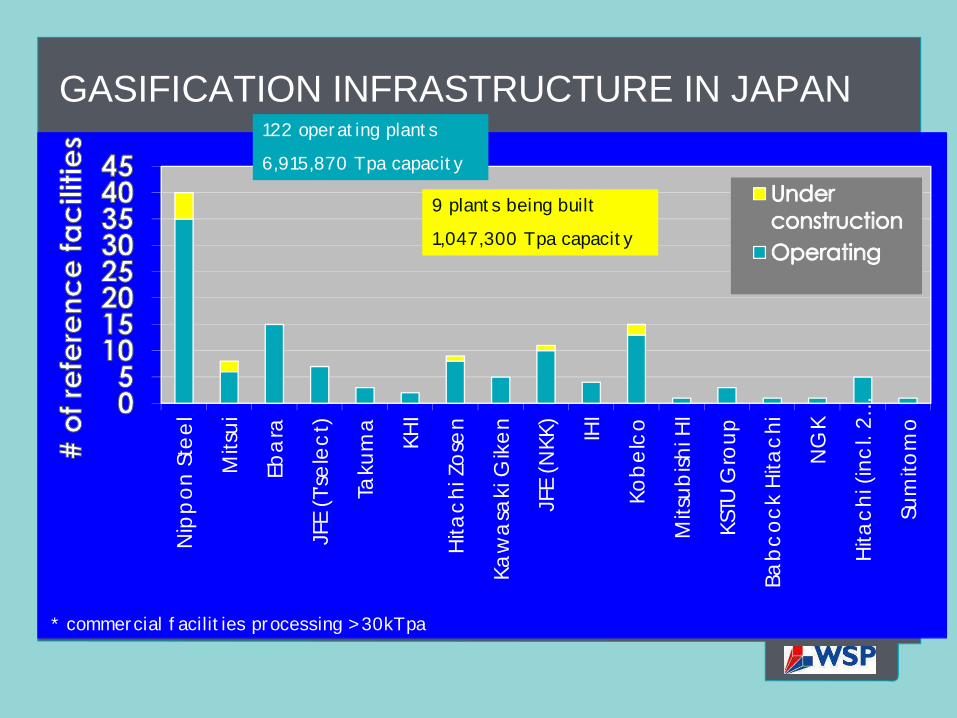
GASIFICATION INFRASTRUCTURE IN JAPAN
Nip
pon
Ste
el
Mits
ui
Eba
ra
JFE
(T'se
lect
)
Taku
ma
KHI
Hita
chi Z
osen
Kaw
asa
ki G
iken
JFE
(NKK
)
IHI
Kob
elco
Mits
ubish
i HI
KSTU
Gro
up
Babc
ock
Hita
chi
NG
K
Hita
chi (
incl
. 2…
Sum
itom
o
* commercial facilities processing > 30kTpa
122 operating plants
6,915,870 Tpa capacity
9 plants being built
1,047,300 Tpa capacity
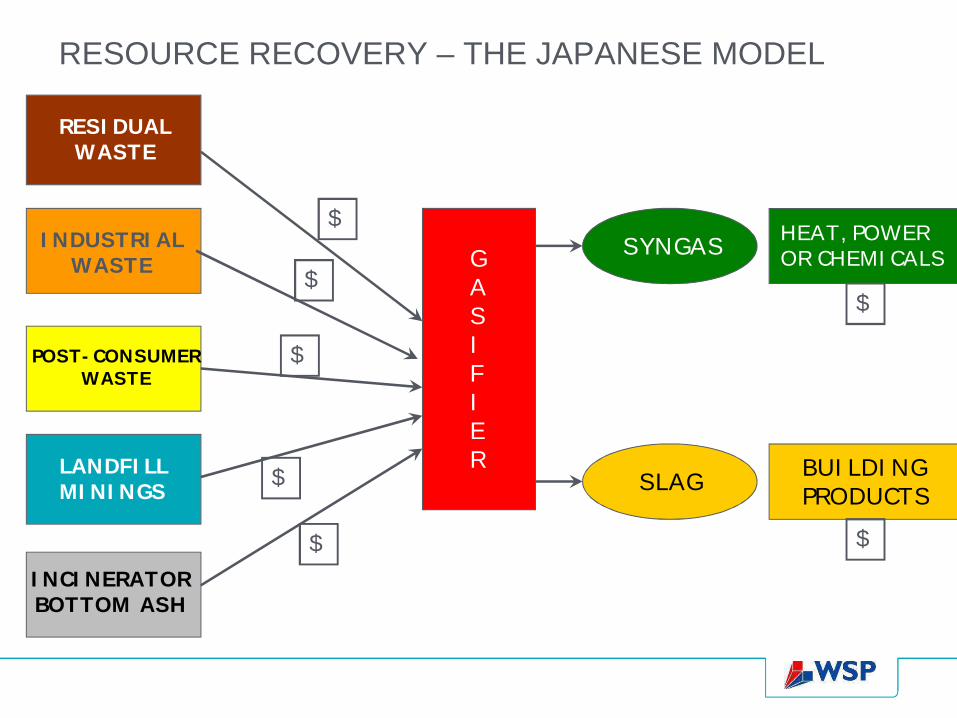
RESOURCE RECOVERY – THE JAPANESE MODEL
GASIFIER
RESIDUALWASTE
INDUSTRIALWASTE
POST-CONSUMERWASTE
INCINERATORBOTTOM ASH
LANDFILLMININGS
SYNGAS
SLAG BUILDINGPRODUCTS
HEAT, POWEROR CHEMICALS
$
$
$
$
$
$
$
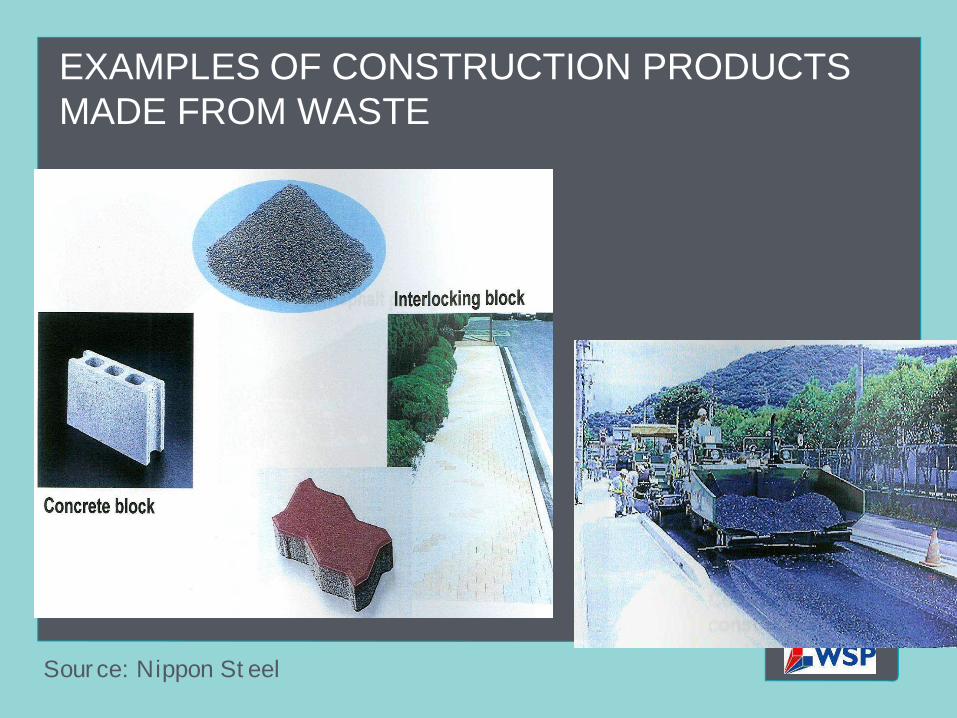
EXAMPLES OF CONSTRUCTION PRODUCTS MADE FROM WASTE
Source: Nippon Steel
PLASMA TECHNOLOGIES FOR WASTETwo types of technologies usually offered for waste
treatment:Plasma Incineration
Plasma Gasification
Plasma systems are being used in the MSW industry in Japan to vitrify incinerator bottom ash and fly ash residues. These are referred to as plasma melters, but they utilise a similar combustion concept as plasma incineration technologies.
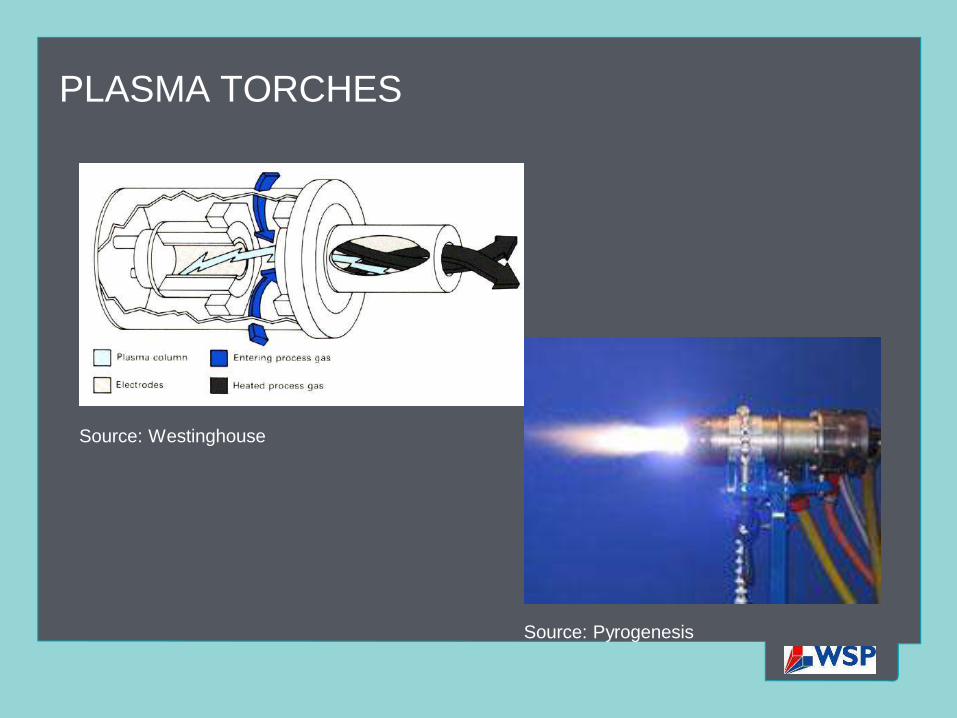
PLASMA TORCHES
Source: Westinghouse
Source: Pyrogenesis
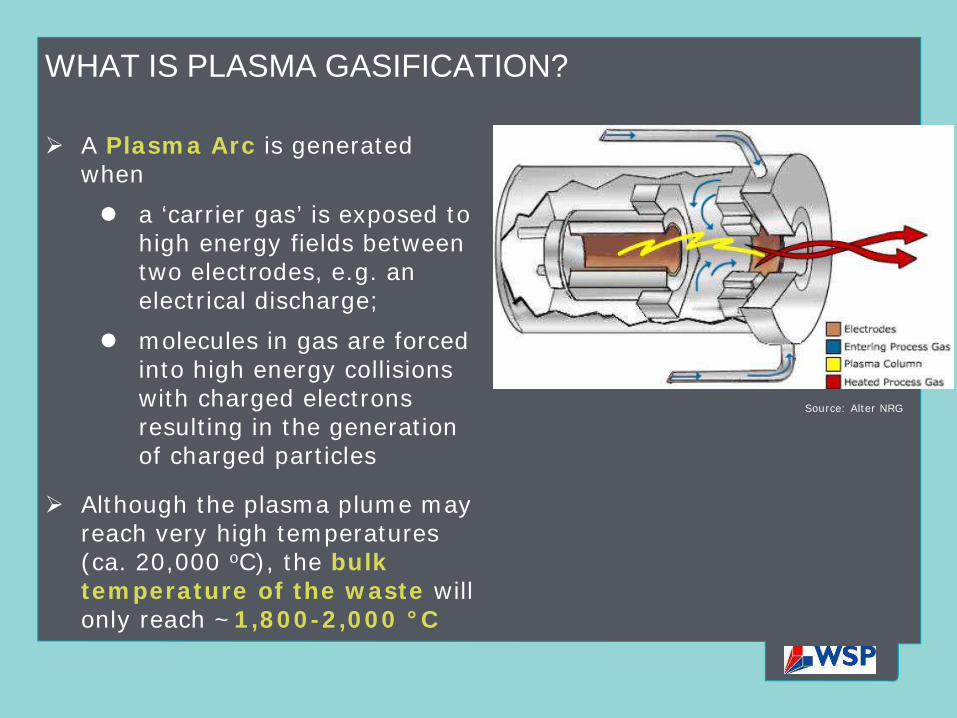
WHAT IS PLASMA GASIFICATION?
A Plasma Arc is generated when
a ‘carrier gas’ is exposed to high energy fields between two electrodes, e.g. an electrical discharge;molecules in gas are forced into high energy collisions with charged electrons resulting in the generation of charged particles
Although the plasma plume may reach very high temperatures (ca. 20,000 oC), the bulk temperature of the waste will only reach ~1,800-2,000 °C
Source: Alter NRG
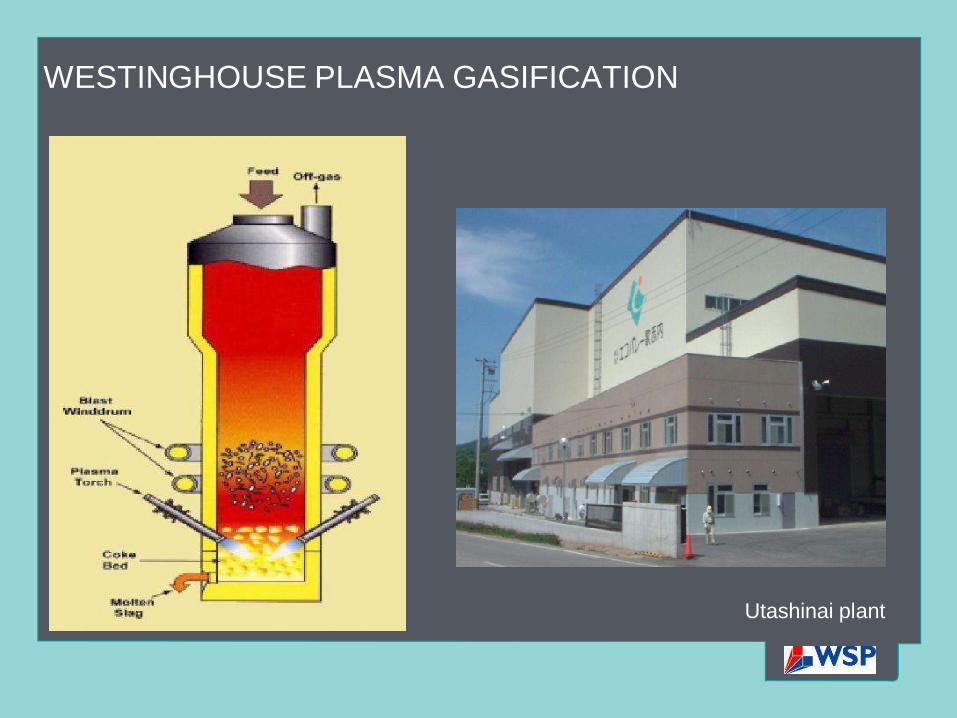
WESTINGHOUSE PLASMA GASIFICATION
Utashinai plant
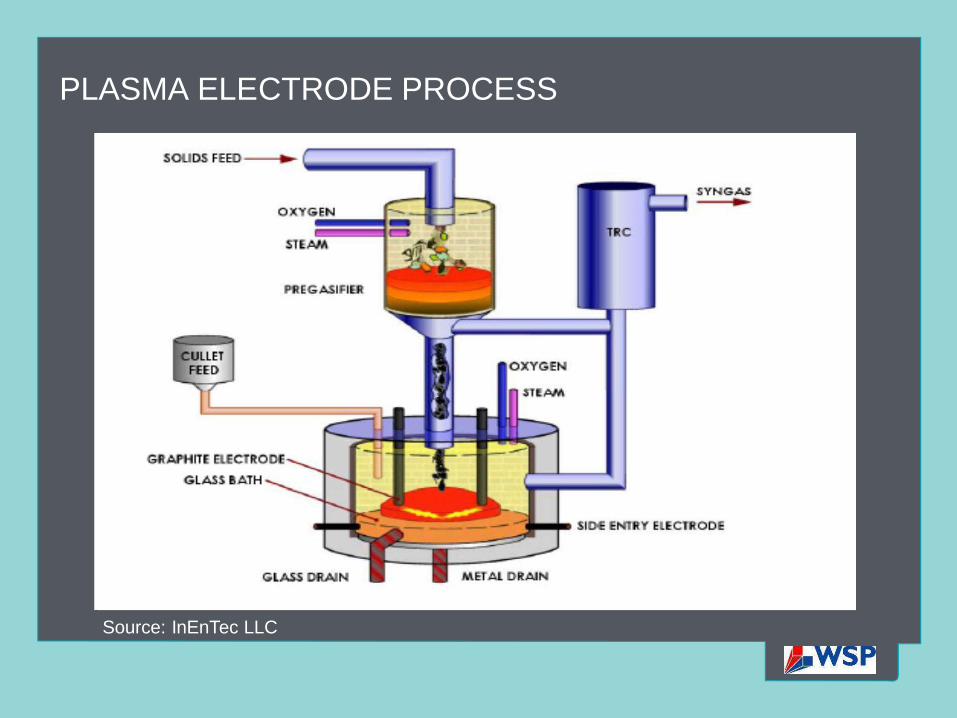
PLASMA ELECTRODE PROCESS
Source: InEnTec LLC
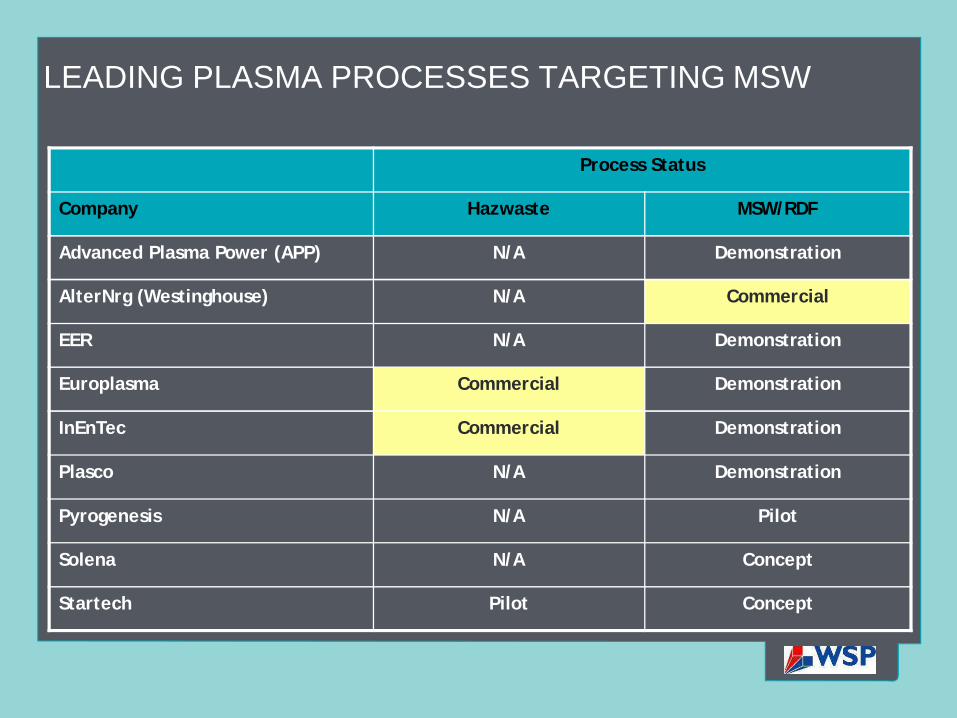
LEADING PLASMA PROCESSES TARGETING MSW
Process Status
Company Hazwaste MSW/RDF
Advanced Plasma Power (APP) N/A Demonstration
AlterNrg (Westinghouse) N/A Commercial
EER N/A Demonstration
Europlasma Commercial Demonstration
InEnTec Commercial Demonstration
Plasco N/A Demonstration
Pyrogenesis N/A Pilot
Solena N/A Concept
Startech Pilot Concept
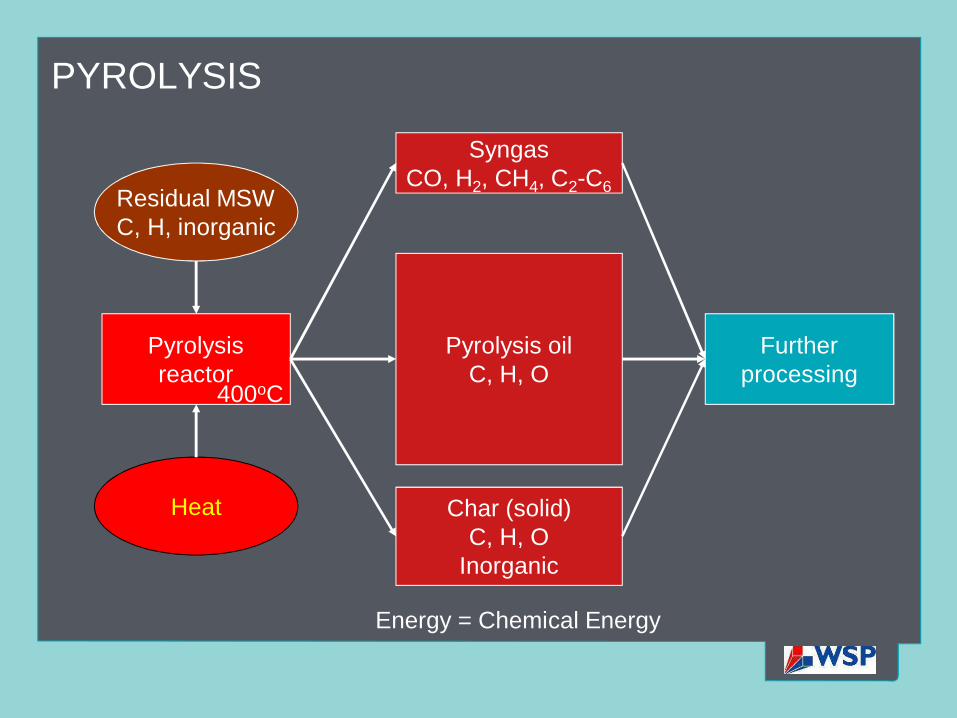
PYROLYSIS
Pyrolysisreactor
Residual MSWC, H, inorganic
Heat
SyngasCO, H2, CH4, C2-C6
Energy = Chemical Energy
Furtherprocessing
Pyrolysis oilC, H, O
Char (solid)C, H, O
Inorganic
400oC
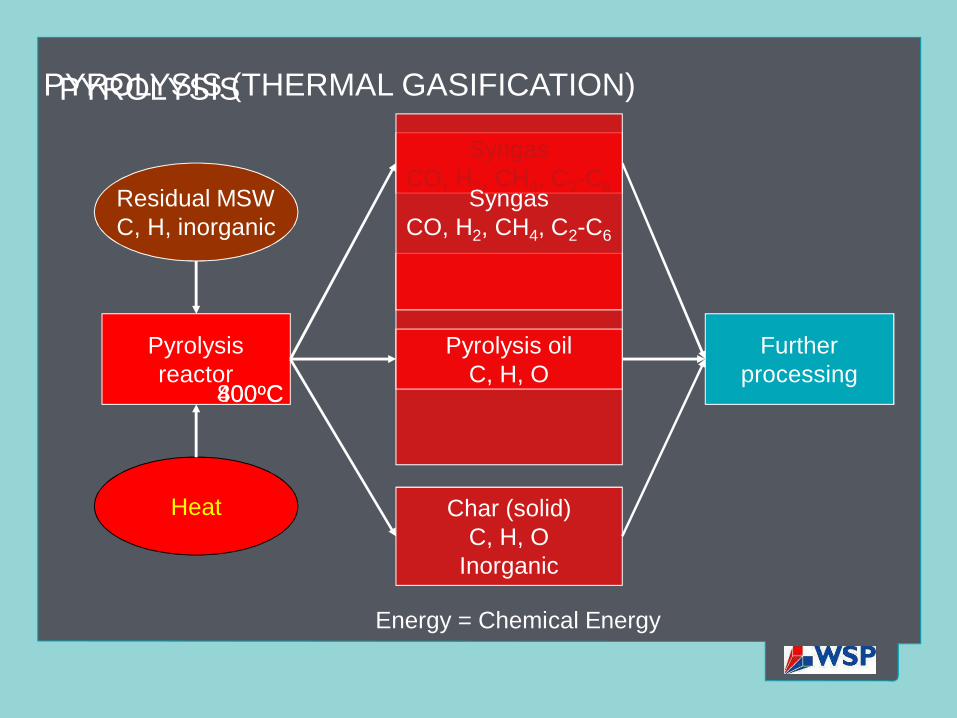
PYROLYSIS
Pyrolysisreactor
Residual MSWC, H, inorganic
Heat
SyngasCO, H2, CH4, C2-C6
Energy = Chemical Energy
Furtherprocessing
Pyrolysis oilC, H, O
Char (solid)C, H, O
Inorganic
400oC
Pyrolysis oilC, H, O
SyngasCO, H2, CH4, C2-C6
800oC
PYROLYSIS (THERMAL GASIFICATION)
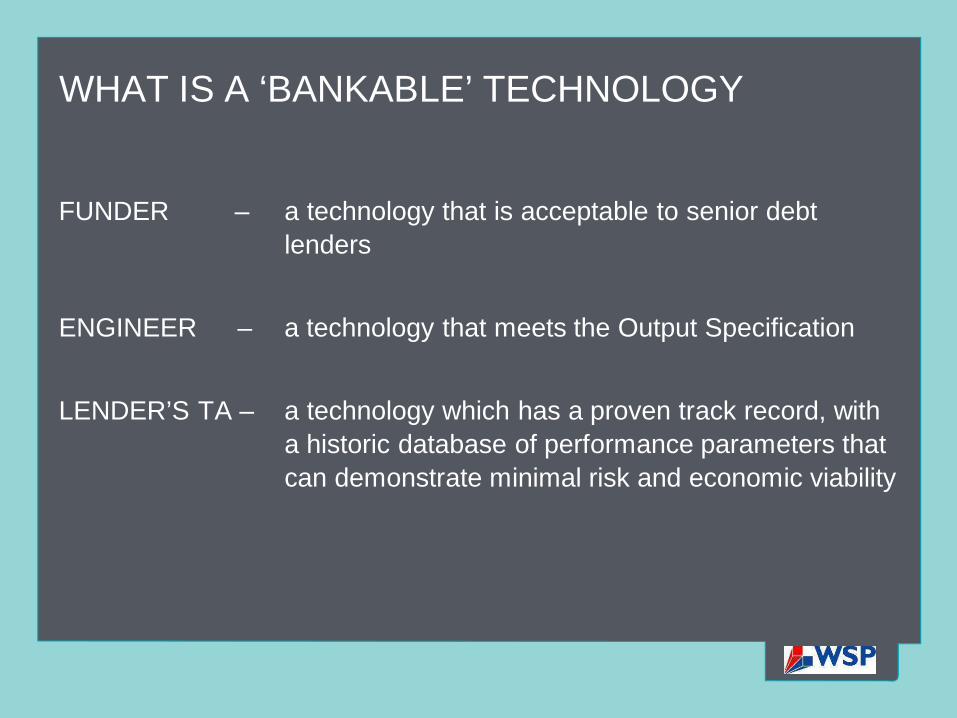
WHAT IS A ‘BANKABLE’ TECHNOLOGY
FUNDER – a technology that is acceptable to senior debt lenders
ENGINEER – a technology that meets the Output Specification
LENDER’S TA – a technology which has a proven track record, with a historic database of performance parameters that can demonstrate minimal risk and economic viability
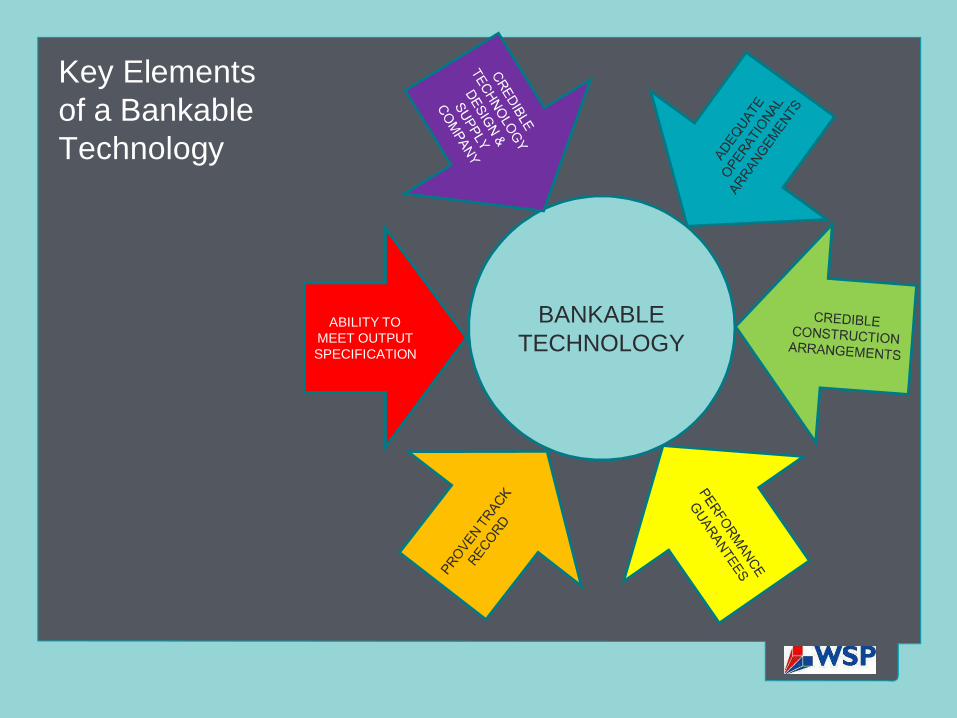
Key Elementsof a BankableTechnology
BANKABLETECHNOLOGY
ABILITY TO MEET OUTPUT SPECIFICATION

Source: Martin GmbH