presentation v mware performance overview
TRANSCRIPT

VMware Performance Overview
Virtualizing Demanding Applications
Scott Drummonds Group Manager, Technical Marketing

VMware ESX Architecture
VMkernel
Guest
Physical Hardware
Monitor (BT, HW, PV)
Guest
Memory Allocator
NIC Drivers
Virtual Switch
I/O Drivers
File System
Monitor
Scheduler
Virtual NIC Virtual SCSI
TCP/IP File
System
CPU is controlled by scheduler and virtualized by monitor
Memory is allocated by the VMkernel and virtualized by the monitor
Network and I/O devices are emulated and proxied though native device drivers
Monitor supports: • BT (Binary Translation) • HW (Hardware assist) • PV (Paravirtualization)

Can Your Application Be Virtualized?
Red: Exceeds capabilities of virtual platform
Yellow: Runs well under right conditions
Green: Runs perfectly out-of-box

Can Your Application Be Virtualized?
No Worries! Plan Accordingly Don’t Virtualize!

Characterizing and Categorizing Applications

CPU Bound Workloads Usually “Green”
SPECcpu results: http://www.vmware.com/pdf/asplos235_adams.pdf
Websphere results published jointly by IBM/VMware
SPEC results used for comparison only and not submitted to SPEC

Maximum reported storage: 365K IOPS • 100K on VI3
Maximum reported network: 16 Gb/s • Measured on VI3
I/O Utilization Above Maximums: Usually “Red”

0
2
4
6
8
1 2 4 8
ScalingRa
0o
v/pCPUs
Na0ve VM
IO In Action: Oracle/TPC-C*
58000 IOPS ESX achieves 85% of
native performance with an industry standard OLTP workload on an 8-vCPU VM
1.9x increase in throughput with each doubling of vCPUs

Eight vCPU Oracle System Characteristics
Metric 8 vcpu VM
Business transactions per minute 250,000
Disk IOPS 60,000
Disk Bandwidth 258 MB/s
Network Packets/sec 27,000
Network Throughput 77 Mb/s
* Our benchmark was a fair-use implementation of the TPC-C business model; our results are not TPC-C compliant results, and not comparable to official TPC-C results

Oracle/TPC-C* Experimental Details
Host was an 8 CPU system with an Xeon 5500 OLTP Benchmark: fair-use implementation of TPC-C workload Software stack includes: RHEL5.1, Oracle 11g R1, internal build of
ESX (ESX 4.0 RC) Were there many Tweaks in getting this result? Not really…
– ESX development build with these features • Async I/O, pvscsi driver, virtual Interrupt coalescing, topology-aware
scheduling • EPT: H/W MMU enabled processor
– The only ESX “tunable” applied: static vmxnet TX coalescing • 3% improvement in performance

Hardware Selection

Platform: Choose Newer Hardware
If Possible Choose Latest Hardware Older processors with longer pipelines and smaller caches can
be particularly challenging for virtualized workloads
Newer processors have hardware virtualization support for Privileged instructions
Virtual machine memory management
Most applications perform better with Hardware-assisted monitors (Intel VT, AMD RVI) Enable hardware virtualization in BIOS.

Intel Architecture Virtualization Performance
0
200
400
600
800
1000
1200
1400
Prescott Cedar Mill
Merom Penryn
Nehalem
Intel Architecture VMEXIT Latencies
Latency (cycles)
HW virtualization support improving from CPU generation to generation

Memory Virtualization in Hardware
Hardware memory management units (MMU) improve efficiency AMD RVI currently available
Dramatic gains can be seen
But some workloads see little or no value And a small few actually
slow down
0 0.2 0.4 0.6 0.8
1 1.2 1.4 1.6
SQL Server Citrix XenApp
Apache Compile
AMD RVI Speedup

Optimal Virtual Machine Setup

General Best Practices: VM Setup
During VM creation select right guest OS type Determines the monitor type and related optimizations Determines default optimal devices and their settings
Do not choose ‘other’
Install 64-bit OS if large amounts of memory are needed Choose a OS version with fewer timer interrupts
Windows, Linux 2.4 100/sec per vCPU Some Linux 2.6 250/sec per vCPU
Some Linux 2.6 1000/sec per vCPU
Disable unused devices that use a polling scheme USB, CDROM
Consume CPU when idle

Large Pages
Increases TLB memory coverage Removes TLB misses, improves
efficiency
Improves performance of applications that are sensitive to TLB miss costs Configure OS and application to leverage large pages LP will not be enabled by default
0% 2% 4% 6% 8%
10% 12%
Performance Gains
Gain (%)

VM Configuration: HW or SW Memory Management?
Example: number crunching financial software
SW and HW virtualizations perform equally well
Example: Citrix, Apache web server
HW virtualization performs better
Example: Java applications
With large pages, HW, with small pages, SW
Example: databases
Depends on which cost is higher: memory virt overhead or TLB cost? Benchmark!
Sens
itive
to
TLB
mis
s co
sts?
App is memory management intensive? No Yes
No
Yes

Platform Optimization: Network Use a network adapter that supports: Checksum offload, TCP segmentation offload (TSO),
Jumbo frames (JF)
Enable JF when hardware is available (default is off!)
Capability to handle high memory DMA (64-bit DMA addresses)
Capability to handle multiple scatter/gather elements per Tx frame
Check configuration Ensure host NICs are running with highest supported speed
and full-duplex
NIC teaming distributes networking load across multiple NICs
Better throughput and allows passive failover
Use separate NICs to avoid traffic contention For Console OS (host management traffic), VMKernel
(vmotion, iSCSI, NFS traffic), and VMs

Jumbo Frames
Before transmitting, IP layer fragments data into MTU (Maximum Transmission Unit) sized packets Ethernet MTU is 1500 bytes
Receive side reassembles the data
Jumbo Frames Ethernet frame with bigger MTU
Typical MTU is 9000 bytes Reduces number of packets transmitted
Reduces the CPU utilization on transmit and receive side

Jumbo Frames Linux ifconfig eth0 mtu 9000
Windows Device Manager ->
Network adapters -> VMware PCI Ethernet Adapter -> Properties -> Advanced -> MTU to 9000
Switches/ Routers
NIC Driver
Client
TCP/IP Stack
Guest (VM)
vNIC
Virtual Switch
TCP/IP Stack
ESX

Jumbo Frames
esxcfg-vswitch -m 9000 vSwitch1
Switches/ Routers
NIC Driver
Client
TCP/IP Stack
Guest (VM)
vNIC
Virtual Switch
TCP/IP Stack
ESX Refer switch/router configuration guide

Jumbo Frames
Switches/ Routers
NIC Driver
Client
TCP/IP Stack
Guest (VM)
vNIC
Virtual Switch
TCP/IP Stack
ESX
Linux ifconfig eth0 mtu 9000
Windows Device Manager ->
Network adapters -> VMware PCI Ethernet Adapter -> Properties -> Advanced -> MTU to 9000
SMP and the Scheduler

VMware vSphere enables you to use all those cores…
1
10
100
1000
1990 1995 2000 2005 2010 2015
Nu
mb
er
of
Co
res
use
d
Year
Oracle
SQL Server
Exchange
Avg. Cust, Application
Avg. Four Socket
Web Servers
Most applications don’t scale beyond 4/8 way
Virtualization provides a means to exploit the hardware’s increasing parallelism
VMware ESX Scaling: Keeping up with core counts

Virtualization-aware Architecture: Building Blocks
Many applications lack scalability beyond certain CPUs Apache web server,
WebSphere, Exchange Configure vCPUs to
application scalability limits
For additional capacity instantiate more of such VMs
SPECweb2005 Native and Virtual Scaling
http://www.vmware.com/files/pdf/consolidating_webapps_vi3_wp.pdf

Scheduler Opportunities
vCPUs from one VM stay on one socket* With two quad-core sockets, there are only two positions for a 4-way VM 1- and 2-way VMs can be arranged many ways on quad core socket Newer ESX schedulers more efficiency use fewer options Relaxed co-scheduling
Socket 0 Socket 1 VM Size Options
2
12
8
(*) The cell limit has been removed in vSphere
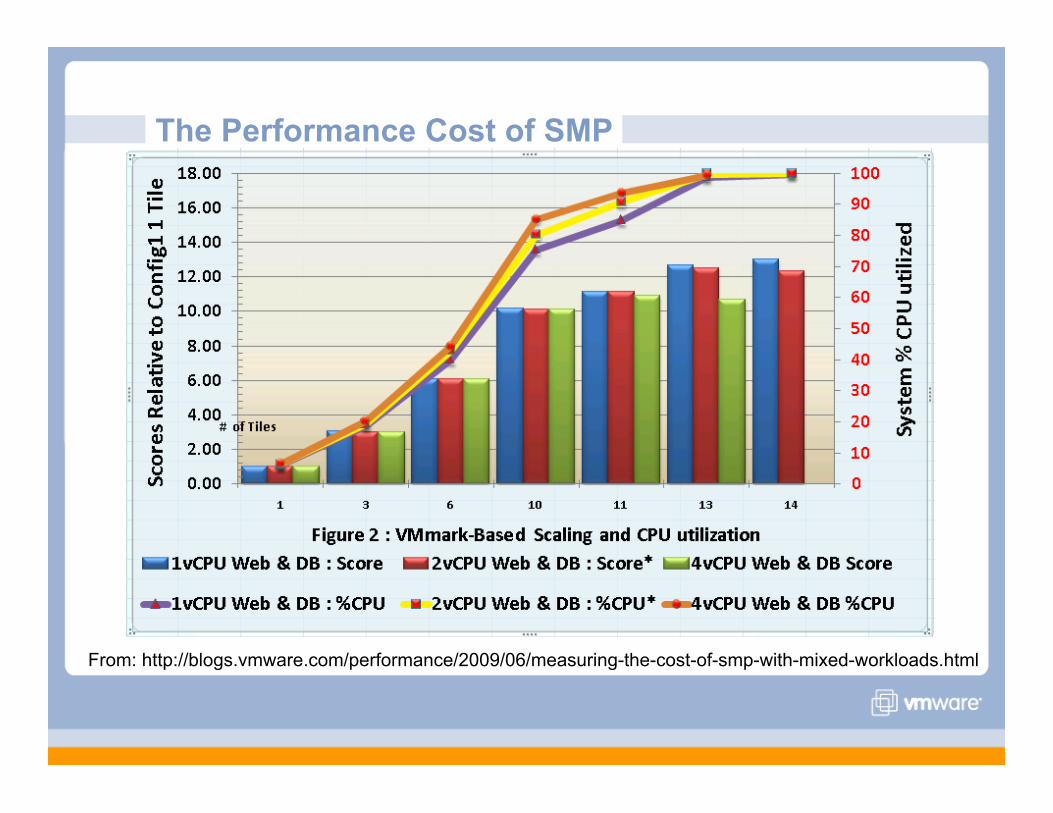
The Performance Cost of SMP
From: http://blogs.vmware.com/performance/2009/06/measuring-the-cost-of-smp-with-mixed-workloads.html
Memory Management

“Bonus” Memory During Consolidation: Sharing!
Content-based Hint (hash of page
content) generated for 4K pages
Hint is used for a match If matched, perform bit by
bit comparison
COW (Copy-on-Write) Shared pages are marked
read-only Write to the page breaks
sharing
VM 1 VM 2 VM 3
Hypervisor
VM 1 VM 2 VM 3
Hypervisor

Memory footprint of four idle VMs quickly decreased to 300MB due to aggressive page sharing.
Page Sharing in XP

Page Sharing in Vista
Memory footprint of four idle VMs quickly decreased to 800MB. (Vista has larger memory footprint.)

Expand
Shrink
May page content out to virtual disk
May bring content from virtual disk
Borrow Pages
Lend Pages
ESX Server Memory Ballooning
Guest OS has better information than VMkernel Which pages are stale
Which pages are unused
Guest Driver installed with VMware Tools Artificially induces memory
pressure
VMkernel decides how much memory to reclaim, but guest OS gets to choose particular pages
VM with VMware Tools Installed
VM with VMware Tools Installed

Ballooning Pins Pages
Memory has been reduced and pinned to induce guest to page, if needed If memory is short, ESX must choose which pages to swap to disk
App VM
Hyper visor
OS
Balloon App VM
Hyper visor
OS
Balloon
Inflating

Ballooning Can Induce Non-harmful Guest Paging
0
100
200
300
400
500
600
0
0.2
0.4
0.6
0.8
1
1.2
512 448 384 320 256 192 128
Bal
loon
ed/S
wap
ped
Mem
ory
(MB
)
Nor
mal
ized
Thr
ough
put
Memory limit (MB)
Ballooned size Swapped size
Throughout (Balloon only) Throughput (Swapping only)
Kernel Compile (Limited Memory Usage)

Ballooning Can Be More Effective Than Swapping
0
500
1000
1500
2000
2500
3000
0
0.2
0.4
0.6
0.8
1
1.2
3840 3584 3328 3072 2816 2560 2304 2048 1792 1536
Bal
loon
ed/S
wap
ped
Mem
ory
(MB
)
Nor
mal
ized
Thr
ough
put
Memory limit (MB)
Ballooned size Swapped size
Throughout (Balloon only) Throughput (Swapping only)
Oracle Swingbench (Flexible Memory Usage)

Java Requires Careful Memory Management
Java/SPECjbb (Static Maximum Memory Usage)
0
500
1000
1500
2000
2500
3000
0
0.2
0.4
0.6
0.8
1
1.2
3072 2816 2560 2304 2048 1792 1536
Bal
loon
ed/S
wap
ped
Mem
ory
(MB
)
Nor
mal
ized
Thr
ough
put
Memory limit (MB)
Ballooned size Swapped size
Throughout (Balloon only) Throughput (Swapping only)

Managing Memory in Java Environments
Calculate OS memory Estimate JVM needs Specify heap exactly
Reservations = OS + JVM + heap

Monitor guest paging using traditional tools Consider putting guest swap file on its own VMDK
Put all guest swap VMDKs on the same LUN vSphere client can then monitor guest paging by watching that LUN’s traffic
Use vSphere Client to track host memory usage There is no way to predict this before hand
Run workloads and analyze performance
Statistic VirtualCenter esxtop
Active Memory (recently used by guest OS)
Active Memory %ACTV, %ACTVS, %ACTVS
Swap rate (VC on VI3 reports swap magnitude)
VI3: Swap In/Out vSphere: Swap In/Out Rate
SWW/s, SWR/s
Getting Memory Sizing Just Right

Understanding and Correcting Storage Performance

Platform Optimization: Storage
Over 90% of storage related performance problems stem from misconfigured storage hardware Consult SAN Configuration Guides Ensure disks are correctly
distributed
Ensure caching is enabled
Consider tuning layout of LUNs across RAID sets
Spread I/O requests across available paths
FC Switch
VMware ESX
HBA1 HBA2 HBA3 HBA4
Storage array
SP2 SP1
1 2 3 4

Platform Optimization: File System
Always use VMFS Negligible performance cost and
superior functionality
Align VMFS on 64K boundaries Automatic with vCenter
www.vmware.com/pdf/esx3_partition_align.pdf
VMFS is a distributed file system Be aware of the overhead of
excessive metadata updates
If possible schedule maintenance for off-peak hours
0
1000
2000
3000
4000
5000
6000
7000
8000
4K IO 16K IO 64K IO
VMFS
RDM (virtual) RDM (physical)
IOs
per s
econ
d
VMFS Scalability

Server Consolidation: Storage Planning
Win2k3
SQL
Win2k3
SQL
Win2k3
SQL
ESX Server ESX Server
VI3
VMDK VMDK VMDK 5 Disks 5 Disks 5 Disks
Physical setup: each instance provided 5-spindle LUN
Virtual architecture: Each VM provided its own VMDK • But now do they map to disks?

Server Consolidation: Storage Planning
Nine spindles for VMFS volume This is clearly less than the 15 disks in the physical deployment
15 spindles for virtual deployment matches physical But this configuration inferior to multiple LUNs and access pattern changes (see following)
ESX Server ESX Server VI3
VMDK VMDK VMDK
9 Dsk
ESX Server ESX Server VI3
VMDK VMDK VMDK
15 Dsk

Sequential Workloads Generate Random Access As observed in VMFS scalability tests
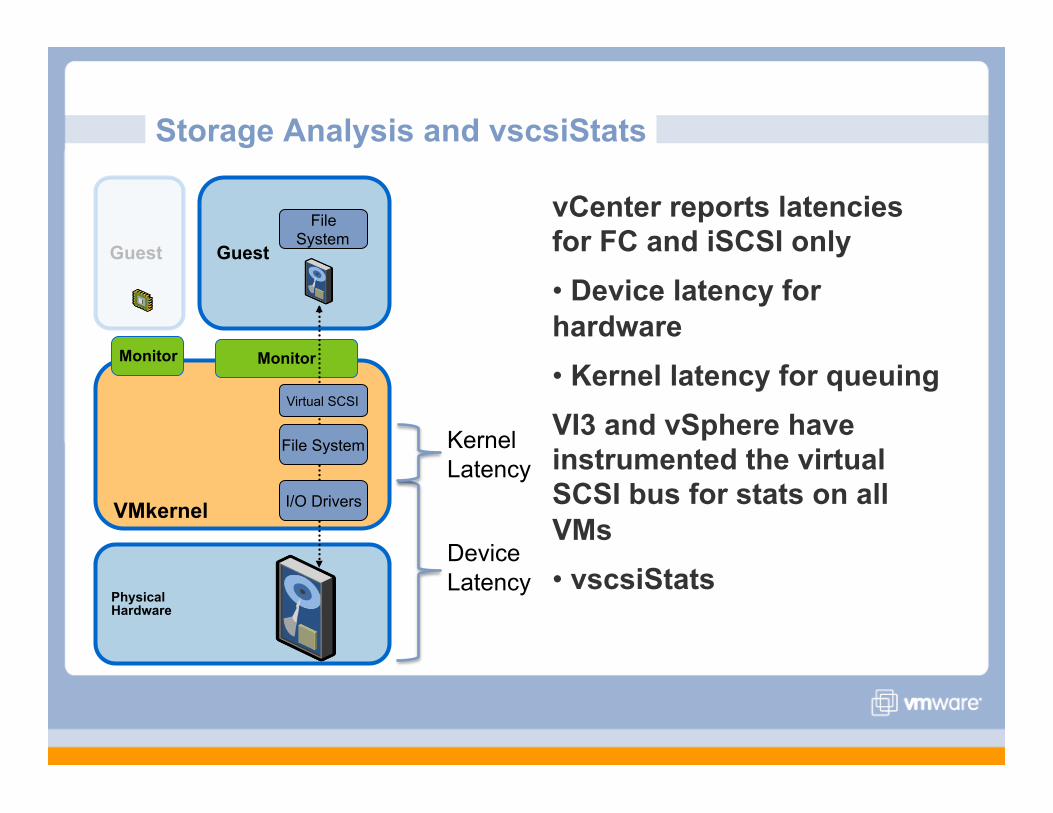
Storage Analysis and vscsiStats
vCenter reports latencies for FC and iSCSI only • Device latency for hardware • Kernel latency for queuing VI3 and vSphere have instrumented the virtual SCSI bus for stats on all VMs • vscsiStats
VMkernel
Guest
Physical Hardware
Monitor
Guest
I/O Drivers
File System
Monitor
Virtual SCSI
File System
Device Latency
Kernel Latency

Workload Characterization Using vscsiStats
vscsiStats characterizes IO for each virtual disk Allows us to separate out each
different type of workload into its own container and observe trends
Histograms only collected if enabled; no overhead otherwise
Technique: For each virtual machine I/O request
in ESX, we insert some values into histograms
E.g., size of I/O request → 4KB
Data collected
per-virtual
disk

vscsiStats Reports Results Using Histograms
Read/Write Distributions are available for our histograms Overall Read/Write ratio? Are Writes smaller or larger than
Reads in this workload? Are Reads more sequential than
Writes? Which type of I/O is incurring
more latency? In reality, the problem is not knowing which question to ask Collect data, see what you find
I/O Size All, Reads, Writes Seek Distance All, Reads, Writes Seek Distance Shortest Among Last 16 Outstanding IOs All, Reads, Writes I/O Interarrival Times All, Reads, Writes Latency All, Reads, Write

vSphere Update

>95% of Applications Match or Exceed Native Performance on VMware Infrastructure
ESX Version
ESX 2 ESX 3
App
s Su
ppor
ted
100% ESX 3.5 ESX 4.0
Overhead
VM CPU
VM Memory
IO
• 30% - 60%
• 1 vCPU
• 3.6 GB
• 20% - 30%
• 2 vCPU
• 800 MBits
• 4 vCPU
• 64 GB
• 100,000 IOPS • 9 GBits
• <2% - 10%
• 8 vCPU
• 255 GB
• >350,000 IOPS • 40 GBits
• <10,000 IOPS • 380 MBits
• 16 GB
• <10% - 20%
Source: VMware Capacity Planner analysis of > 700,000 servers in customer production environments

OS APP
OS APP
Storage
Networking
Virtual Machines
CPU
Memory
64 cores and 1 TB physical RAM Hardware Scale Up
Lowest CPU overhead Hardware Assist Purpose Built Scheduler
Maximum memory efficiency Hardware Assist Page Sharing Ballooning
Wirespeed network access VMXNET3 VMDirectPath I/O
Greater than 350k iops per second Lower than 2 millisecond latency Storage stack optimization
VMDirectPath I/O
Virtual hardware scale out 8-way vSMP and 255 GB of
RAM per VM VM Scale Up
vCompute vStorage vNetwork
Current NEW
ESX
OS APP
OS APP
OS APP
“Speeds and Feeds” Optimization for the Highest Consolidation Ratios

Exchange 2007 on vSphere: SMP Efficiency
0
50
100
150
200
250
300
350
1,000 2,000 4,000 6,000 8,000
95th
Per
cent
ile S
end
Mai
l Lat
ency
(ms)
# of Heavy Users (1,000 users/2-way VM & 2,000 users/4-
way VM)
2 vCPU VM 4 vCPU VM
0
10
20
30
40
50
60
70
80
90
100
1,000 2,000 4,000 6,000 8,000 %
of C
PU u
tiliz
atio
n
# of Heavy Users (1,000 users/2-way VM & 2,000 users/4-
way VM)
2 vCPU VM 4 vCPU VM

Storage Protocols: vSphere versus VI3
0
0.2
0.4
0.6
0.8
1
1.2
NFS SWiSCSI HWiSCSI FC
Rel
ativ
e C
pu C
ost p
er I/
O
ESX 3.5
ESX 4.0

Storage Protocols and Exchange on vSphere
0
100
200
300
400
500
600
700
800
900
Heavy Online Profile
Double Heavy Online Profile
95t
h Pe
rcen
tile
Send
Mai
l Lat
ency
(ms)
Fibre Channel iSCSI NFS
0
10
20
30
40
50
60
70
Heavy Online Profile Double Heavy Online Profile
% C
PU U
tiliz
atio
n
Fibre Channel iSCSI NFS

SQL Server 2005 on vSphere: Efficiency
0
1
2
3
4
5
6
1 2 4 8
Thro
ughp
ut
(Nor
mal
ized
to 1
-CPU
Nat
ive
Res
ult)
Number of Physical or Virtual CPUs
Native ESX4.0

SQL Server 2005: vSphere Features
0.80
0.84
0.88
0.92
0.96
1.00
1.04
1.08
1.12
1.16
1.20
1.24
1.28
Binary Translation (BT)
Hardware-Assisted CPU Virtualization
Hardware-Assisted Memory & CPU
Virtualization
Thro
ughp
ut N
orm
aliz
ed to
BT
0.9
0.95
1
1.05
1.1
1.15
1.2
LSILogic Adapter LSILogic Adapter + improved I/O concurrency
PVSCSI Adapter
Thro
ughp
ut (N
orm
aliz
ed to
LSI
Logi
c A
dapt
er)

Summary
Newer hardware improves virtualization performance Traditional application, storage, networking best practices must be followed Consolidation provides new challenges and opportunities that must be planned for

Performance Resources
The performance community http://communities.vmware.com/community/vmtn/general/performance
Performance web page for white papers http://www.vmware.com/overview/performance
VROOM!—VMware performance blog http://blogs.vmware.com/performance

Backup

Large Pages
Guest/Host Small Large Small Large

Fragmentation

vSphere Thin Provisioning

Virtual Machine Sizing—NUMA
Memory accesses from CPU 0 To Memory 0 is local To Memory 1 is remote Remote access latency >> local
access latency # of vCPUs ≤ # of CPUs / node ESX enables NUMA scheduling If VM MemSize < Node Memory size No remote access penalty
Node 1
CPU 2
CPU 3
Memory 1
Node 0
CPU 0
CPU 1
Memory 0
Remote Memory

Host Configuration: Storage Queues
ESX queues can be modified to increase throughput This can benefit benchmarks
to a single LUN
Rarely required in production systems
Oversized ESX queues on multiple servers can overload array
Kernel latency is a sign that ESX queues should be increased
Guest Queues
ESX Queues
Array Queues

Choose the Right Virtualization Software
Hosted products aren’t designed for meet the most extreme needs ESX demonstrates better
host and VM scaling VMware Server
Windows Server 2003
SQL Apache
Host Operating System
Java
Linux

VMware ESX Compared to VMware Server
Single tile score higher than reference system
0
1
2
3
4
5
6
1 2 3 4
Scor
e
Tiles
VMmark Score
ESX Server

Address Translation Virtual addresses (VA) mapped to machine addresses (MA) via page tables Page table walks are expensive
Translation look-aside buffer (TLB) stores recent mappings and avoids page walks Improvements: Larger pages means more TLB
hits
Hardware assistance to virtual mapping means more efficient page table and TLB maintenance
Machine M
emory
TLB VA MA
Page Tables Page
Page
Page
Page
VA
MA

AMD Hardware-assisted MMU Support (RVI)
0
10
20
30
40
50
60
70
80
90
100
SQL Server DBHammer Citrix Xen App Oracle Swingbench
Perc
enta
ge
RVI BT
Performance Gains of RVI

Hardware Configuration In Action: SAP
100 Mb/s Ethernet
TX: 2.4Mb/s RX: 0.3Mb/s
~100 IO/s
EMC CX3-40 SAN
Windows Server 2008
VMWare ESXi
2 X quad-core AMD “Barcelona” B3 with RVI, 32GB memory
SAP Application Server Unicode PL146
Flat mode + mprotect (false)
MS SQLServer 2005
SAP Benchmark Driver
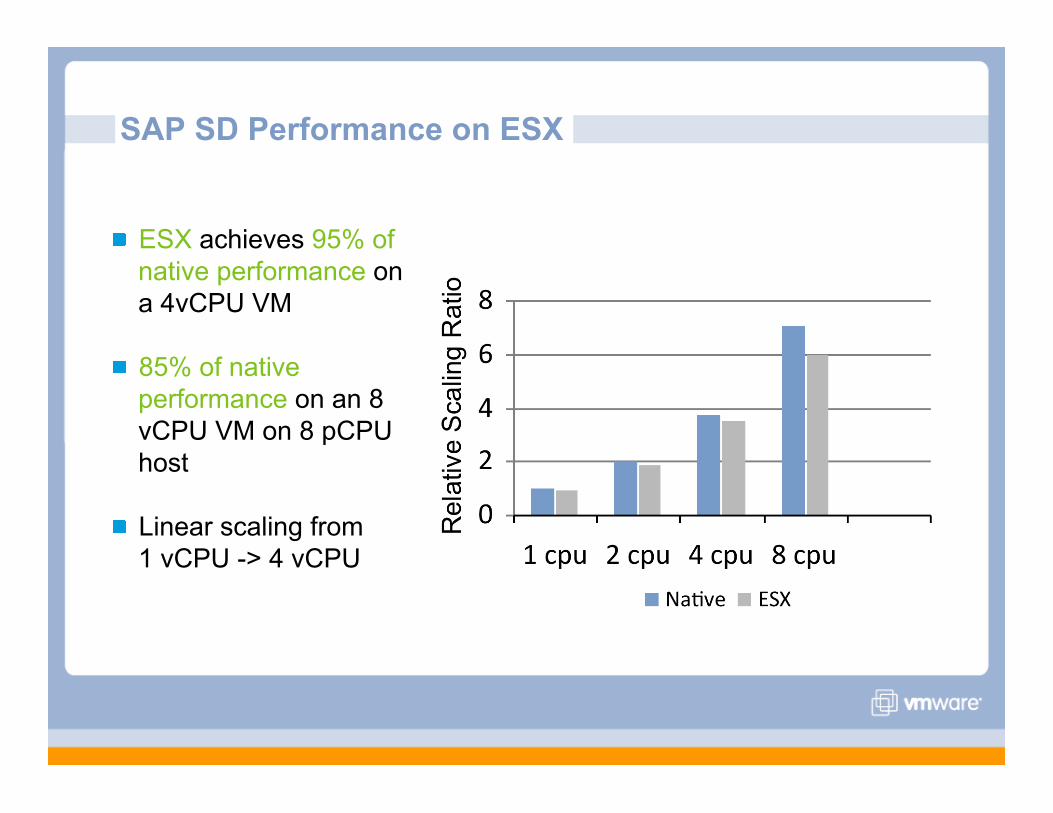
SAP SD Performance on ESX
ESX achieves 95% of native performance on a 4vCPU VM
85% of native performance on an 8 vCPU VM on 8 pCPU host
Linear scaling from 1 vCPU -> 4 vCPU

SAP SD 2-Tier performance on ESX
SAP SD performance sensitive to software configuration and ESX monitor type:
SAP configuration Mode Deployment Recommended
Monitor Type Guest tunable Effect
View Model Production RVI (Default) Large pages H/W assist
reduces MMU overheads
Flat model + mprotect = true Production RVI (Default) Large pages
H/W assist reduces MMU
overheads
*Flat model + mprotect = false
Mostly benchmark SVM (UI Option) Larges pages up
to 12% benefit S/W MMU
benefits up to 5%
* Configuration used in our experiments
In most cases, default H/W MMU provides best results – Experiment with your individual workloads