probabilistic seismic demand models for multi-span highway
TRANSCRIPT
Probabilistic Seismic DemandModels for Multi-Span Highway
Bridges
Kevin Mackie
Bozidar Stojadinovic
University of California, BerkeleyDepartment of Civil and Environmental Engineering &Pacific Earthquake Engineering Research Center
EM 2002 ConferenceColumbia University, NYJune 3-5, 2002
Session:
Seismic Response of Bridges

What is a PSDM?PSDM = Probabilistic Seismic Demand Model
Relationship of seismic Intensity Measures (IM) tostructural Engineering Demand Parameters (EDP)
log(EDP)
log(
IM)

Why a demand model?1.) Quantitative Performance Based Earthquake
Engineering tool for designers of bridges
What is probability of y, given x?
i0 5 10 15 20 25 30 35
-0.1
-0.05
0
0.05
0.1
0.15
t me [sec]
acce
lera
tion
[g] x
+
y
Intensity Measure: x Demand Measure: y

Why a demand model?2.) How do design parameters
affect performance?
Performance
Haz
ard
Performancebetter
Shorter(stiffer)
Taller(flexible)

Why a demand model?3.) Module in Pacific Earthquake Engineering
Research Center (PEER) probabilistic framework
i0 5 10 15 20 25 30 35
-0.1
-0.05
0
0.05
0.1
0.15
t me [sec]
acce
lera
tion
[g]
DemandModel
IntensityMeasures
DemandMeasures
CapacityModel
Hazard Performance
DecisionVariables
This project
PEER Performance based earthquake engineering framework

Probabilistic SeismicDemand Analysis
Æ Definemotions (IM)
Æ Define classof structures(EDP)
Æ Defineanalysismodel
Æ Nonlinearanalysis
Æ Designparametersensitivity
Æ Groundmotion binsensitivity
Æ Residualdependence(M, R)

Seismicity: Ground Motions & IMs• Period Independent Intensity Measures
• Magnitude, Distance, Strong motion duration• Cumulative absolute velocity• Cumulative absolute displacement• Arias intensity• Frequency ratios• RMS acceleration• Characteristic intensity• PGA, PGV, PGD
Ground Motion Bins
5.6
5.8
6.0
6.2
6.4
6.6
6.8
7.0
0.0 10.0 20.0 30.0 40.0 50.0 60.0 70.0
Distance R (km)
SMSR
LMSR LMLR
SMLR
• Period Dependent IntensityMeasures
• Sa, Sv, Sd• Spectral combinations• Sd,inelastic

Demand: Bridges
3-bent
Single bent
2-bent
3-bent stand-alone
Single-columnbents

Demand: EDPs• Local EDPs
• Steel stress & strain• Concrete stress & strain
• Intermediate EDPs• Column curvatureductility• Maximum columnmoment• Plastic rotation• Hysteretic energy
• Global EDPs• Displacement ductility• Drift ratio• Residual displacement index
Single column/benthighway overpasses in
California

OpenSees Bridge Model
Ground level
Soil springs
Abutmentsprings and gaps
Elastic deck
Fiber RC column
Mode 1 - Longitudinal
Mode 3 - VerticalMode 2 - Transverse

Bridge Design Parameters
• L• L/H• rs,long
• Dc/Ds• Abut
span lengthspan to column height ratiocolumn longitudinal reinforcementcolumn to superstructure dimensionsabutment mass/stiffness models
60-180 ft1.2-3.51-4%0.67-1.33various

Extending Optimal PSDMto Multi-bent bridges
100
102
103
Intensity Measure vs Demand Measure (Parameters)
Drift Ratio Longitudinal
s=0.31, 0.30, 0.28, 0.32
L2=1080L2=1440L2=2160L2=2520
Stiffness
Stif
fnes
s
Practical, effective, efficient
Period-dependent IM with Global response parameter
2-bent bridge with abutments

Extending Optimal PSDMto Multi-bent bridges
100
101
102
Intensity Measure vs Demand Measure (Parameters)
Drift Ratio Longitudinal
s=0.34, 0.37, 0.39, 0.38
L2=1080L2=1440L2=2160L2=2520
Stiffness
Con
stan
t int
ensi
ty
Practical, effective, efficient in short period range
Period-independent IM with Global response parameter
2-bent bridge with abutments

SufficiencyMagnitude dependence
Distance dependence
15 20 25 30 35 40 45 50 550.5
1
1.5
2
2.5
3
3.5
4
4.5
Residual Dependence (semilog scale)
Distance (km)
c (*E- 2)=0.04, -0.11, 0.15, 0.63
L2=1080L2=1440L2=2160L2=2520
5.8 5.9 6 6.1 6.2 6.3 6.4 6.5 6.6 6.7 6.80.5
1
1.5
2
2.5
3
3.5
4
4.5
Residual Dependence (semilog scale)
Magnitude
c (*E- 2)=7.46, 11.54, 0.19, -36.89
L2=1080L2=1440L2=2160L2=2520

Bent Configuration Comparison
100
102
103
Intensity Measure vs Demand Measure (Parameters)
Drift Ratio Longitudinal
s=0.30, 0.22, 0.25
bents=1bents=2bents=3
•Longitudinal demand Ú as bents Ò
•Transverse demand approx. same
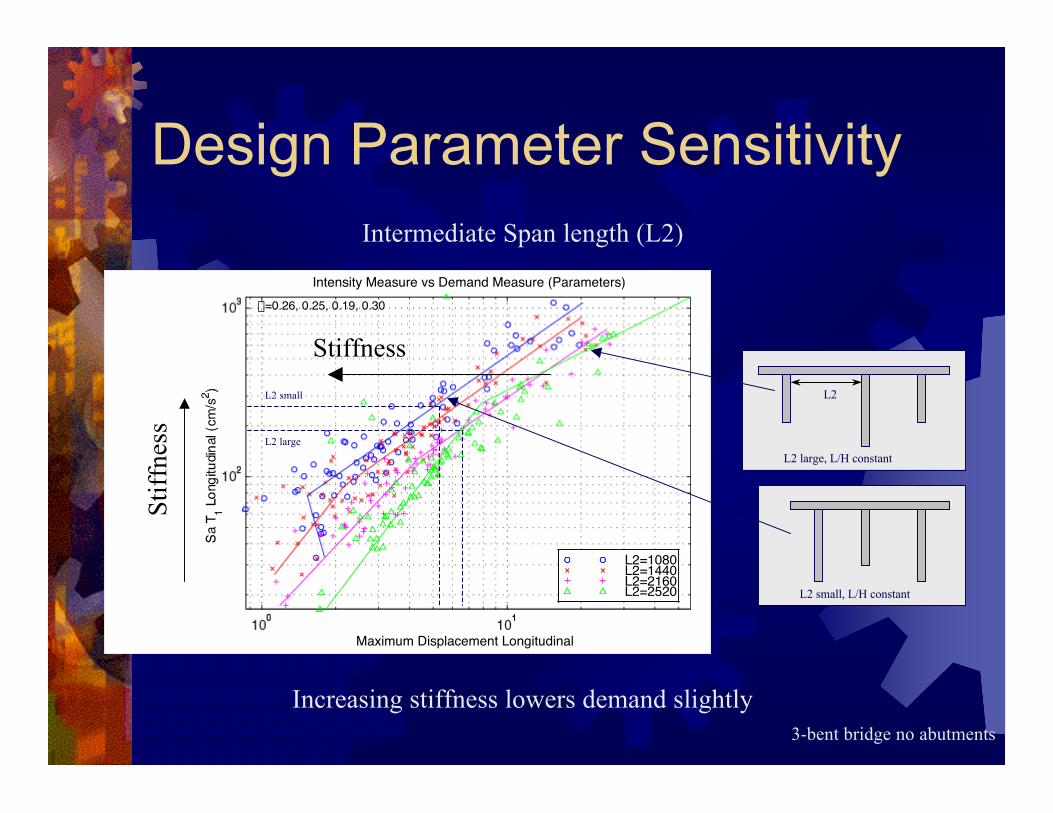
Design Parameter Sensitivity
100 101
102
103
Intensity Measure vs Demand Measure (Parameters)
Maximum Displacement Longitudinal
s=0.26, 0.25, 0.19, 0.30
L2=1080L2=1440L2=2160L2=2520
Stiffness
Stif
fnes
s
Increasing stiffness lowers demand slightly
L2 large
L2 small
Intermediate Span length (L2)
3-bent bridge no abutments
L2 small, L/H constant
L2 large, L/H constant
L2

Stif
fnes
s
Seismicity• Parameter sensitivity to bins• All lines of same color should have same slope at given
intensity• Higher demand for higher magnitude bins
10-1 100102
103
Bin dependence (LMSR -) (LMLR -.) (SMSR --) (SMLR..)
Drift Ratio Longitudinal
Dc/Ds=0.67Dc/Ds=0.75Dc/Ds=1 Dc/Ds=1.3
Column diameter to superstructure ratio (DcDs)
Highmagnitudebins
Lowmagnitudebins
Stiffness

Transverse Irregularity RI*
100
102
103
Intensity Measure vs Demand Measure (Parameters)
Drift Ratio Longitudinal
s=0.32, 0.29, 0.29
irregular=1irregular=2irregular=3
†
RI* =1L
f (x)dx0
L
ÚÊ
Ë Á Á
ˆ
¯ ˜ ˜ *100%
vs pure transverse translation
1st transverse mode shape
No loss ofefficiency with
periodindependent IM

PSDM ExtensionsStructural Demand Hazard Curves
0 0.5 1 1.5 2 2.5 3 3.5 4 4.510-4
10-3
10-2
10-1
100
101Average Structural Demand Hazard Curve
Drift Ratio Longitudinal
Dc/Ds=0.67Dc/Ds=0.75Dc/Ds=1 Dc/Ds=1.3

PSDM Extensions
Æ Maximum post-earthquakefunctionality (trafficload, eg)
Æ Probability ofexceeding a givendamage state(fragility)
Functional EDPs

ConclusionsÆ PSDMs allow designers to see the effects of:Æ seismicityÆ design parameterson seismic performance of a bridge
Æ PSDMs fit into PEER performance-based designframework, Sa(T1)-D optimal PSDM reducesdemand model dispersion
Æ Optimal single-bent models remain optimal formulti-bent
Æ Transverse irregularity (RI*) adequately predictedby Sa(T1)

Thank You!ÆQuestions?
ÆFor more information contact:Æ Kevin Mackie: [email protected]
Æ Boza Stojadinovic: [email protected]
ÆVisithttp://millerbird.ce.berkeley.edu