faculty.bemidjistate.edufaculty.bemidjistate.edu/grichgels/projects/2017 probabili… · web...
TRANSCRIPT

1
ProbabilityGrade 1
Jean Schulz Grygla School, Grygla, [email protected]
Kelly BlairCentral Elementary, Bemidji, [email protected]
Executive SummaryThis is a 10 day First grade math unit on Probability concepts, which
includes coin tossing, tally marks, graphing and data collection and

2
representation through the use of spinners, pennies, dice and hand gestures. This unit meets the following First grade standards:
1.1.1.7 Use counting and comparison skills to create and analyze bar graphs and tally charts.
1.3.2.3 Identify pennies, nickels and dimes; find the value of a group of these coins, up to one dollar.
1.1.1.6 Use words to describe the relative size of numbers. For example: Use the words equal to, not equal to, more than, less than, fewer than, is about, and is nearly to describe numbers.
1.1.2.1 Use words, pictures, objects, length-based models (connecting cubes), numerals and number lines to model and solve addition and subtraction problems in part-part-total, adding to, taking away from and comparing situations.
Since our students do not take the MCA III Assessment, we did not include sample questions, however these objectives could possibly answer some of the questions on the MCA III Assessment. Data Analysis strands are not implemented until Third grade. We designed this unit around activities that can be modified in order to meet the needs of all learning levels. Some lessons are more challenging than others. We teach in rural Minnesota, so we included many projects using real-world connections that students may not be exposed to at home. Different learning environments such as independent, small-group and whole-group have all been included. To complete this unit we incorporated technology, literacy, manipulative and assessment activities.
Table of ContentsDay PageDay 1: Pre-Test/Shape Munch
Game………………………………….4-7
3
Day 2: Coin
Characteristics………………………………………….…………
8-9
Day 3: Penny
Spill………………………………………………………………..10-
12
Day 4: Heads & Tails
Game……………………………………………….13-15
Day 5: Heads & Tails 100
Grid…………………………………………16-18
Day 6: Dice
Probability…………………………………………….………..19-
20
Day 7: Rock, Paper,
Scissors…………………………………………..21-23

4
Day 8: Animals in a
Cage……………………………………………………..……24
Day 9: Snowman
Spinner…………………………………………………..25-26
Day 10: Post-Test/Shape Munch
Game…………………………27-30
Day 1: Pre-Test/Shape Munch Game
Objective: Students will show their knowledge of money concepts, and data collection and representation by completing a pre-test. Assessment meets Standards:
1.1.1.7 Use counting and comparison skills to create and analyze bar graphs and tally charts.
1.3.2.3 Identify pennies, nickels and dimes; find the value of a group of these coins, up to one dollar.
1.1.1.6 Use words to describe the relative size of numbers. For example: Use the words equal to, not equal to, more than, less than, fewer than, is about, and is nearly to describe numbers.
Launch: There will be no launch today as students will need time to complete their pre-test. Explore: The teacher will state the test expectations and show the class how they can complete the test. Some questions will ask students to circle the answer, others will ask students to fill in the blanks.
5
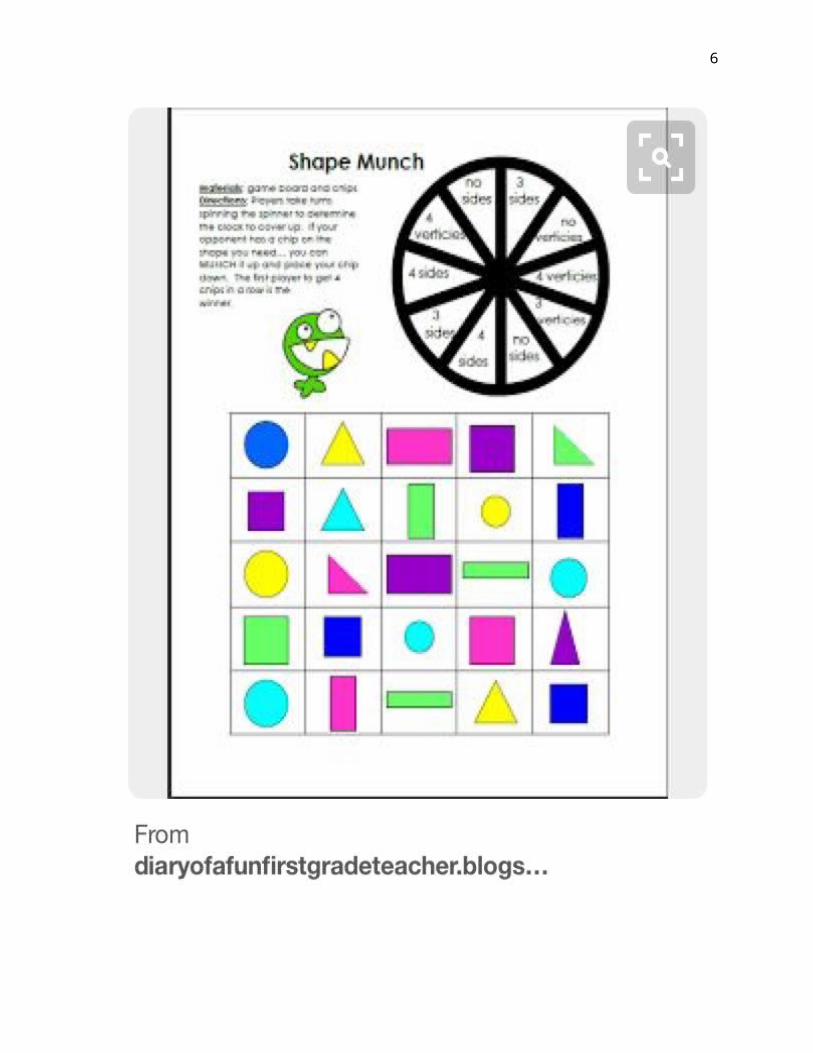
Share/Summarize: Students will take their pre-test showing what they know about money concepts and data collection and representation.Extension: When students finish, they will play a game called “Shape Munch” which has been previously taught. Students will use a paper clip as a spinner to select one vocabulary definition. The student will have to match the vocabulary definition they spun, to a shape that fits that description.
“Shape Munch” is available on TeachersPayTeachers.com for $2.00
6

7
Probability Unit Pre-Test
Name: ______________________________
1. Circle the word:
Heads or Tails Heads or Tails
2. Look at the tally chart: How many times did the penny land on heads? ____How many times did the penny land on tails? _____

8
How many more heads than tails? ______________
3. Look at the bar graph:109
8
7
6
5
4
3
2
1
Heads Tails
How many times did the penny land on heads? __________How many times did the penny land on tails? ___________How many times did they toss the coin? ______________

9
Day 2: Coin CharacteristicsObjective: Students will analyze both sides of a coin and identify specific characteristics on each, such as pictures, symbols, and words. Standards:
1.3.2.3 Identify pennies, nickels and dimes; find the value of a group of these coins, up to one dollar.
Launch: The teacher will play the video “Coins!” By ABCmouse featuring the 4 Cent Gents.
https://www.youtube.com/watch?v=aajLkveG750Explore: The teacher will pass out one penny, nickel, dime and quarter to each student. Students will independently look at each coin and draw conclusions on size, color, pictures, symbols and words. Share: After the teacher collects the coins, he or she will invite the class to sit on the rug. The teacher will put the four coins students analyzed on the doc cam heads up. The teacher will call on students to share what they see. Students will see all coins have a face on one side. The teacher will want to write a list on the board of student’s other findings, such as words or numbers. Next, the teacher will turn over the four coins to the “tails” side. The teacher will again call on students to share what they see. Students will see all coins have a “symbol” on the back. Make sure to note other discoveries.Summarize: The teacher will share with the class that today they will design their own coin. Students will receive a worksheet with two circles for the front and back. Students can draw themselves on the front of the coin for the “face” and use their imagination to design a “symbol” for the back. Students can use words and numbers too! This project can be used on a classroom bulletin board when done.
10
Assessment: Completion of the Coin Design page, including pictures, symbols and words.
Day 3:
Penny Spill

11
Objective: Students will relate coin characteristics with data representations such as tally charts by playing a partner activity that utilizes both skills. Standards:
1.1.1.7 Use counting and comparison skills to create and analyze bar graphs and tally charts.
1.3.2.3 Identify pennies, nickels and dimes; find the value of a group of these coins, up to one dollar.
Launch: The teacher will invite students to the rug in front of the board for a story. The teacher will read the story “Tally-O-Malley” by Stuart Murphy and Cynthia Jabar. “The story is about the Malley family and their trip to the beach. On the way there, the family passes the time with tallying competitions. Let’s read to find out more.” Following the reading, the teacher will ask the students to recall what types of things the Malley family tallied? What does each “tally” represent? What is special about the fifth tally? Would you want to do a tally competition?
Explore: The teacher will show students the two sides of a coin on the doc cam labeled heads and tails. The teacher will remind students of the previous day’s discoveries. Heads is the side with the face. Tails is the side with the symbol. The teacher will then model the game called “Penny Spill.”

12
Heads Tails
Directions:Penny Spill is a partner game where students “spill” 20 pennies out of a cup and record the number of heads and tails they got in their “spill” on a tally chart.
Variations: Students can use 10 pennies with this activity to model partners of 10 during the beginning of the school year.Students can use yellow and red counters with this activity to model the same idea.

13
This recording sheet is available on TeachersPayTeachers.com for $2.50. Otherwise you can create your own.
Share: While students are playing, the teacher will create an excel spreadsheet with a class list column, total heads column, and total tails column. When they are done, students will return to the rug with their recording sheet. The teacher will ask for students to share how many heads and tails they got in their “spill” inputting the numbers on the spreadsheet for the class to see. Once everyone has shared, the teacher will find totals for heads and tails. Summarize: Were there more heads or tails? Do we have an equal chance of getting both? Is there a way to know what you will “spill?”Assessment: Participation during the game and completion of the Penny Spill recording sheet.

14
Day 4: Heads & Tails GameObjective: Students will define and understand the concept of “fair” while playing a heads and tails board game. Standards:
1.1.1.7 Use counting and comparison skills to create and analyze bar graphs and tally charts.
1.3.2.3 Identify pennies, nickels and dimes; find the value of a group of these coins, up to one dollar.
Launch: “Yesterday, we played a game in class called Penny Spill. Remember how we took a cup and “spilled” out 20 pennies and counted how many were heads and how many were tails? Today, we are going to learn a new game that helps us identify heads and tails on a coin. When you are playing the game today, I want you to think about if this game is fair. What do we already know about the word fair? Let’s think. Would it be fair if I gave (insert student name) an extra snack? Would it be fair if I gave everyone an extra snack? Fair is when everyone has an equal chance of winning. At the end of the game, I am going to ask you if you think this game is fair.”Explore: Students will learn how to play the game Heads & Tails.Directions: Students will work in pairs to determine if this game is fair. One student is heads and the other is tails. Each student will start their game pieces on the star. Students will take turns flipping a coin. If the coin lands on heads, the heads player will move their game piece towards the head on the snake. Likewise, if the coin lands on tails, the tails player will move their game piece towards the tail on the snake. The first person to reach the head or tail of the snake wins. Results will be recorded on a bar graph using a crayon.
Heads and Tails

15
10
9
8
7
6
5
4
3
2
1
Heads Tails

16
Teachers may choose to laminate the game board on colored cardstock for many years of use!
Share: Once students have played the game 10 times, they will record their results on a bar graph. Students will tape their bar graph on the board under the corresponding heading “More Heads” or “More Tails.” Students will see who had more heads and who had more tails based on where they placed their paper. Next, the teacher will invite students to sit on the rug in front of the board. The teacher will ask “What did you think of the game?” Each student will share their response. Summarize: Other questions to ask in the circle: How many spaces to the snake’s head? How many spaces to the snake’s tail? Did you take turns being the “tails” player and “heads” player? Do you think this game was fair?Assessment: Participation during the game “Heads & Tails” and sharing.

17
Day 5: Flip a Coin 100 TimesObjective: Students will learn the more trials you do to collect data, the more accurate that data will be. Standards:
1.1.1.1 Use place value to describe whole numbers between 10 and 100 in terms of tens and ones.
1.2.2.3 Use number sense and models of addition and subtraction, such as objects and number lines, to identify the missing number in an equation.
1.3.2.3 Identify pennies, nickels and dimes; find the value of a group of these coins, up to one dollar.
Launch: “We have been learning a lot about collecting data using bar graphs and tally charts. Before we begin today’s lesson, I will need each of you to flip a coin ten times and tell me your results. You can write down your results by writing a list of your outcome. For instance…1. H2. T3. T4. TStudents will flip a coin ten times, count total heads, total tails and bring results to their teacher.The teacher will have a spreadsheet ready with a class list column, total heads column, and total tails column. Student Name: Heads: Tails:
(Add as many rows as needed)Explore: Once the results are totaled from the ten flip experiment, students will cast a vote on whether they think there will be more heads, more tails or equal amount of heads and tails after 100 coin flips. Students will take turns writing a tally on the board under the corresponding heading: Heads, Tails, or Equal.

18
Once the votes are in, students will receive the Flip a Coin 100 Times template. Students will work their way across the 100 grid recording “H” or “T” after each flip. When students have finished 100 flips they are to color each “H” square red and each “T” square blue. Students will then count and total how many heads and how many tails. Students will write their numbers in the number sentence at the bottom of the page. Double check to make sure it adds up to 100!
(Template is also available on TeachersPayTeachers.com for $1.00.)Share: Following the 100 flip experiment, students will report their results to their teacher. The teacher will input the numbers on a spreadsheet, same format as last time, for the whole class to see. Students will begin to notice the more students reported, the closer the heads and tails totals become.

19
Summarize: The teacher will invite the students up to the rug for closure of the lesson. Students will share what they liked and disliked about the activity. Assessment: While in the circle, the teacher will also ask the students to share what they originally voted and if they would change their mind.
This lesson may be done in 2-3 days depending on the group of students.Great activity for the 100th day of school!
Day 6: Dice Probability GameObjective: Children will extend work with making tally charts and explore probability with a single die. MN Math Standards First Grade 1.1.1.7Launch: Show the class a die and talk about how many numbers are on it. Ask the students which number they would roll the most and which number

20
they would roll the least amount of time. Make sure the students understand the meaning of the word least. Record their predictions on the smart board. Explore: Hand out the worksheet and have the students roll the die 30
times and record their numbers using tally marks.
Share: The teacher will show the class their predictions and record the numbers from the record sheet. Students will share their results with the class. Have the students pair up and talk about how their predictions are the same or different than what their chart shows.Summarize: When the students are done sharing with their partner have them go back to their desks and talk about the probability of each number, reviewing equal chance.

21
Everyday Mathematics/McGraw Hill
Day 7: Rock, Paper, ScissorsObjectives: Children practice counting and representing data in tally charts. They answer questions about the data collected. MN Math Standards First Grade 1.1.1.7Launch: Explain to the class that they will learn a game and use tally marks to represent results. Introduce Rock, Paper, Scissors. Some students may not be familiar with this game so demonstrate how to play this game. Have the children play 20 rounds. After each round, the partnership makes a tally mark in the tally chart to indicate the winning gesture.Explore: Pair the students up and have them play the game.

22

23

24
Walk around the room and observe which children are accurately recording the tally marks for the winning gesture.Share: How many times did rock win?How many times did scissor win?How many times did paper win?How many more times did paper win than scissor?How many times did paper and rock win in all?How many times did scissor and paper win in all?Is it likely that the rock will win every round? Why?Will one gesture win more often than the others? Why?Summarize: Talk to the class and explain that if one gesture won more often, then players would always choose it and the game would always end in a tie.
Everyday Mathematics/McGraw Hill
Day 8: Animals in a Cage

25
Objectives: Children will learn something about probability as well as practicing subtraction facts. MN Math Standards First Grade 1.1.2.1Launch: Read the story “Goodnight Gorilla” and talk about how the animals get out of their cages.
Explore: Have the students play “Free the Animal Game”. Put the students in groups of three. See links with printable materials below:
Free the Animals Game: Free the Animals Game Recording Sheet
Share: Students will talk with each other about how many animals they put in their cages and why they chose the cages they did. Talk about strategies they used.Summarize: Make sure that each student understands that finding the difference of the two dice is how they can free animals from the cages and that some numbers might be better to pick than other numbers.
http://mathwire.com/games/datagames.html
Day 9: Snowman Spinner GameObjectives: Students will check the probability of a spinner with equal pieces. MN Math Standard First Grade 1.1.1.6Launch: Read the story “The Biggest, Best Snowman” by Margery Cuvler.

26
Explore: Before playing the game ask students to estimate how many spins they think they will need to collect all the pieces for their snowman. Call on
students to share both their number of spins and why they think that it is a reasonable number. Record their estimations for later.Put students in groups of 3 or 4. Students can use a pencil and paper clip as a spinner. See link below for printable directions, Snowman spinner, and recording sheet templates:
Snowman Probability Game

27
Share: Each student uses a Snowman Probability Recording Sheet and
makes a tally for each spin next to the object. When the student has all of the objects, he/she counts the tallies to find the total number of spins it took to completely dress the snowman. The student records this number on the class line plot. Students will share their predictions and their outcomes.Summarize: When all students have completed their snowmen and added their totals to the line plot, gather students for a data analysis. Ask students to look at the results and look at the predictions. How do they compare? Use statistical measures of median, mode, range or mean, as appropriate for students’ mathematical abilities.
http://www.mathwire.com/

28
Day 10: Post-Test/Shape Munch Game
Objective: Students will show their knowledge of money concepts, and data collection and representation by completing a pre-test. Assessment meets Standards:
1.1.1.7 Use counting and comparison skills to create and analyze bar graphs and tally charts.
1.3.2.3 Identify pennies, nickels and dimes; find the value of a group of these coins, up to one dollar.
1.1.1.6 Use words to describe the relative size of numbers. For example: Use the words equal to, not equal to, more than, less than, fewer than, is about, and is nearly to describe numbers.
Launch: There will be no launch today as students will need time to finish their post-test.Explore: The teacher will restate the test expectations and remind the class how they can complete the test. Some questions will ask students to circle the answer, others will ask students to fill in the blanks. Share/Summarize: Students will take their post-test showing what they have learned about money concepts and data collection and representation.Extension: When students finish, they will replay the game called “Shape Munch” which was played the day of the pre-test. Students will use their new found probability knowledge to identify which “wedges” on the spinner will help them win. Students will notice that some “wedges” on the spinner occur more than once. Students will recall what it means for a game to be “fair.”
Circle: 3 wedges applyRectangle: 4 wedges apply
Square: 4 wedges applyTriangle: 3 wedges apply
“Shape Munch” is available on TeachersPayTeachers.com for $2.00

29
30
Probability Unit Post-Test
Name: ______________________________
4. Circle the word:
Heads or Tails Heads or Tails
5. Look at the tally chart: How many times did the penny land on heads? ____How many times did the penny land on tails? _____

31
How many more heads than tails? ______________
6. Look at the bar graph:109
8
7
6
5
4
3
2
1
Heads Tails
How many times did the penny land on heads? __________How many times did the penny land on tails? ___________How many times did they toss the coin? ______________

32