process description for processing of htgr pebble fuel at srs
TRANSCRIPT

Process Description for Processing of HTGR Pebble Fuel at SRS
E. N. Moore R. H. Jones T. F. Severynse October 2014 SRNL-TR-2014-00209, Rev. 0.
Official Use Only Contains information which may be exempt from public release under the Freedom of Information Act (5 U.S.C.552), exemption number(s) 4 and Category “Commercial/Proprietary”. Approval by the Department of Energy prior to release is required. Reviewed by: T. F. Severynse/SRNL Date: 10 16 14 Guidance If Applicable: N/A

SRNL-TR-2014-00209 Process Description for Processing of HTGR Pebble Fuel at SRS ii October 2014
Official Use Only
DISCLAIMER This information was prepared as an account of work sponsored by an agency of the U.S. Government. Neither the U.S. Government nor any agency thereof, nor any of their employees, makes any warranty, expressed or implied, or assumes any legal liability or responsibility for the accuracy, completeness, or usefulness, of any information, apparatus, product, or process disclosed, or represents that its use would not infringe privately owned rights. References herein to any specific commercial product, process, or service by trade name, trade mark, manufacturer, or otherwise, does not necessarily constitute or imply its endorsement, recommendation, or favoring by the U.S. Government or any agency thereof. The views and opinions of authors expressed herein do not necessarily state or reflect those of the U.S. Government or any agency thereof.

Process Description for SRNL-TR-2014-00209 Processing of HTGR Pebble Fuel at SRS October 2014 iii
Official Use Only
EXECUTIVE SUMMARY
This report provides a description of the four options remaining after the alternatives review process. The description is divided into five sections. Section 1 describes the feed materials. Section 2 provides a functional description. Section 3 provides a description of the proposed equipment and conceptual layout. Section 4 provides a list of major materials and equipment for the process. Section 5 provides material balances. A wide variety of options were initially explored, but the list was reduced to nine options for further consideration (Moore 2014). The nine options were further evaluated and four options selected (Delley 2014) for development of sufficient detail for estimating the cost for placeholder purposes. The four options addressed in this report are as follows:
Option 1. Disposition of All Constituents via High Level Waste System (Figure 5.1)
• This option transfers the cask for storage and transportation of radioactive material (CASTOR) cask from storage to H Canyon, where the inner cans are removed and transferred to an unloading station. The cans are opened, and the pebbles are transferred to the digester for carbon and (where necessary) SiC removal using respectively. Off gas from the digester is treated to remove Cs, Sr, and entrained salt.
• After digestion is complete, the salt is decanted and the kernels, containing a small amount of salt, are drained into a can designed for storage or insertion in the 10-well canyon dissolver insert for dissolution. The salt is allowing the salt to be reused. The decant step includes filtration of the salt, with the collected solids flushed back into the digester with the salt. (Spent salt that can no longer be regenerated is drained into a can designed for immersion into a washing vessel for salt dissolution.) The filtrate, containing up to 12% of the U and residual quantities of minor actinides, is combined with the dissolver solution and blended with sufficient quantities of poisons (or depleted uranium) to meet liquid waste acceptance criteria. The down blended solution is neutralized and transferred to the waste tanks, using existing waste transfer infrastructure, for processing into high level waste (HLW) glass and saltstone.
• Process areas utilized to support this option include the Hot Shop or Swimming Pool (section 3H, 4H) for can opening and fuel unloading, and a major portion of at least one process cell (5H) for carbon digestion equipment and another process for the off-gas system. Existing canyon equipment (dissolvers, waste evaporators) will be used for kernel processing. Kernel processing could be concurrent with kernel recovery, or deferred to a separate campaign by providing interim storage (in a canyon cell) for the separated kernels.
Option 2. Dissolve and Separate Uranium for Disposition as Low Level Waste (LLW)
• This option receives and processes the fuel pebbles for dissolution as described for option 1. In this option, the dissolver solution is adjusted and fed to solvent extraction for separation and purification of the uranium to meet low level waste acceptance criteria. The product uranium solution is down blended to < 10% fissile (233U + 235U) with DU solution, and poisons (e.g. Gd) are added to increase the allowable package loading. The resultant solution is then mixed with
(b)(3), (4)
(b)(3), (4)

SRNL-TR-2014-00209 Process Description for Processing of HTGR Pebble Fuel at SRS iv October 2014
Official Use Only
grout in a stainless steel vessel. After curing, the vessel is placed in a CASTOR cask for onsite or offsite disposal.
• This option requires a supply of DU solution for blending, using existing equipment provided for the low enriched uranium (LEU) blend down program using natural uranium. It also requires a new facility and equipment for uranium solution grouting.
Option 2T. Dissolve and Separate Uranium and Thorium for Disposition as Low Level Waste
• This option is similar to option 2, but recovers both the uranium and the thorium for grouting and disposal as LLW.
Option 6. Recover Kernels for Disposal via Melt and Dilute
• This option provides a cask unloading and digestion system similar to Option 1, but installed in L-Area with one-half the capacity. The kernels, with some salt, produced in digestion are processed though the melt and dilute process (Adams 2000), where the dried kernels are blended with LEU or DU (if required to satisfy safeguards requirements), then combined with aluminum and magnesium metal to produce an alloy that is cast into an ingot. The ingots (4.2” diameter x 47” high) can be loaded into canisters that can be processed (dried, inerted, welded) and placed in a pad-mounted dry storage cask as previously proposed for L-Basin fuel (SRNL 2012). The salt waste is treated using a process demonstrated in the SRS tank farms for sufficient removal of radionuclides to meet low-level waste requirements. Because of the reliance on inter-area shipments for liquid waste disposition, the option requires a high salt reuse factor of at least ten to one.
The following table provides a table of waste volume for the various options. See material balances (Section 5.0) for more details and a list of assumptions affecting the material balances. The most significant assumptions that could radically impact the balance include the successfully demonstrating the salt digestion process with a ten-to-one salt re-use, selecting of a suitable off-gas system (DWPF off-gas system assumed), avoiding of a wet process to separate the salt and kernels, and proving the remote operability of the various process operations. Some significant opportunities that are not addressed, but that could improve the balance are the demonstration of the vapor digestion process and more continuous processes. The values for the AVR only case are shown only for Option 1 for comparison purposes. See documents SRNL-TR-2014-00214 and Appendix F, SRNL-RP-2014-00213, for details on other options considered in selecting four options to be addressed in this report.

Process Description for SRNL-TR-2014-00209 Processing of HTGR Pebble Fuel at SRS October 2014 v
Official Use Only
Table ES-1 Waste Volume Summary
THTR+AVR AVR
Waste Form Option 1 Option 2 Option 2T Option 6 Option 1 Percent
HLW solution from Dissolving (gallons) 2.02E+05 2.08E+05 2.08E+05 None 1.15E+05 57.0% HLW solution from Salt Processing (gallons) 4.03E+05 4.79E+05 4.79E+05 4.03E+05 1.61E+05 39.9% Saltstone Grout (gallons) 1.45E+06 1.65E+06 1.65E+06 9.68E+05 6.62E+05 45.6% HLW canisters 101 32 15 None 31 30.6% SNF canisters 82 LLW equipment waste (cubic feet) 6.69E+04 7.89E+03 7.89E+03 6.69E+04 2.28E+04 34.1% LLW grout in CASTOR (cubic feet) 6.69E+04 6.69E+04
Tons NO2/year (post scrubber) 25.9 25.9 25.9 11.8 9.3 35.7%

SRNL-TR-2014-00209 Process Description for Processing of HTGR Pebble Fuel at SRS vi October 2014
Official Use Only
(This page intentionally left blank)

Process Description for SRNL-TR-2014-00209 Processing of HTGR Pebble Fuel at SRS October 2014 vii
Official Use Only
CONTENTS
EXECUTIVE SUMMARY ......................................................................................................................... iii
ACRONYMS .............................................................................................................................................. xii
1.0 Feed Materials .................................................................................................................................... 1 1.1 Feed Materials .......................................................................................................................... 1 1.2 Radionuclide Content by Category .......................................................................................... 3 1.3 Packaging ................................................................................................................................. 7 1.4 Radiation .................................................................................................................................. 9 1.5 Nuclear Criticality Safety ....................................................................................................... 11
2.0 H-Area Options ................................................................................................................................ 14 2.1 Functional Description and Sizing Basis ............................................................................... 14 2.2 Equipment Summary and Layout........................................................................................... 31
3.0 L Area Option ................................................................................................................................... 37 3.1 Functional Description and Sizing Basis- L Area .................................................................. 37 3.2 Equipment Summary and Layout........................................................................................... 46
4.0 Process Equipment Material and Equipment (M&E) Lists .............................................................. 55 4.1 Approach ................................................................................................................................ 55 4.2 M&E Lists .............................................................................................................................. 55
5.0 Material Balances ............................................................................................................................. 62 5.1 Material Balance Assumptions .............................................................................................. 62 5.2 Option 1 Balances .................................................................................................................. 64 5.3 Option 2 Balances .................................................................................................................. 72 5.4 Option 2T Balances ................................................................................................................ 77 5.5 Option 6 Balances .................................................................................................................. 82 5.6 Option 1 Balances (AVR Fuel Only) ..................................................................................... 89
6.0 References ........................................................................................................................................ 94

SRNL-TR-2014-00209 Process Description for Processing of HTGR Pebble Fuel at SRS viii October 2014
Official Use Only
FIGURES Figure 1.1 CASTOR Cask ............................................................................................................................ 8
Figure 1.2 CASTOR Cask Internal Canister ................................................................................................. 9
Figure 1.3 Concrete Thickness vs. Shielding .............................................................................................. 10
Figure 1.5 Optimal Moderation .................................................................................................................. 12
Figure 1.6 Simplified Model ....................................................................................................................... 13
Figure 2.1 H-Area Options - Functional Breakdown .................................................................................. 15
Figure 2.2 Concentration versus Time in Digester (one pebble test) .......................................................... 18
Figure 2.3 Phase Diagram ........................................................................................................................... 18
Figure 2.4 Interim-23 Flowsheet ................................................................................................................. 24
Figure 2.5 Interim-23 Flowsheet (continued) ............................................................................................. 25
Figure 2.6. WSB Cementation Flowsheet ................................................................................................... 26
Figure 2.7 Proposed Emplacement Configuration with Cross-Section (left) and Plan (right).................... 29
Figure 2.8 DWPF Off-gas Schematic ......................................................................................................... 29
Figure 2.9 DWPF Melter Off-gas System Balance ..................................................................................... 30
Figure 2.10 Proposed Digester Off-gas System Balance ............................................................................ 31
Figure 2.11 Simplified view of Process ...................................................................................................... 32
Figure 2.12 Swimming Pool, Bundle Storage, and Hot Shop ..................................................................... 33
Figure 2.13 Layout of Hot Canyon Cell Section 5 ..................................................................................... 34
Figure 2.14 Elevation View of Hot Canyon Cell Section 5 ........................................................................ 34
Figure 2.15 Layout of Off-gas System in Warm Canyon ........................................................................... 35
Figure 2.16 Cement System Needed for Options 2 and 2T ........................................................................ 36
Figure 3.1 L Area Option-Functional Breakdown ...................................................................................... 37
Figure 3.2 Concentration versus Time in Digester (one pebble test) .......................................................... 40
Figure 3.3 Al-Th-U Phase Diagram ............................................................................................................ 42
Figure 3.4 Crossflow Filter ......................................................................................................................... 44
Figure 3.5 Melt and Dilute Demo Schematic ............................................................................................. 46
Figure 3.6 Simplified View of Process ....................................................................................................... 47
Figure 3.7 Dry Transfer System .................................................................................................................. 48
Figure 3.8 L Area Cell Layout- Elevation .................................................................................................. 49
Figure 3.9 L Area Cell Layout - Upper Level Plan View ........................................................................... 50
Figure 3.10 L Area Cell Layout - Lower Level Plan View ........................................................................ 50
Figure 3.11 L Area Cell Equipment Layout ............................................................................................... 51
Figure 3.12 L Area Cell View above Cell Covers ...................................................................................... 52

Process Description for SRNL-TR-2014-00209 Processing of HTGR Pebble Fuel at SRS October 2014 ix
Official Use Only
Figure 3.13 MCO Dry Storage Canister ..................................................................................................... 53
Figure 3.14 Dry Storage Overpacks ............................................................................................................ 54
Figure 5.1 Option 1 Process Flow ............................................................................................................... 65
Figure 5.2 Option 2 Process Flow ............................................................................................................... 73
Figure 5.3 Option 2T Process Flow ............................................................................................................ 78
Figure 5.4 Option 6 ..................................................................................................................................... 83
Figure 5.5 Option 1 Process Flow- AVR Only Uses Same Flowsheet ....................................................... 90
TABLES
Table ES-1 Waste Volume Summary ........................................................................................................... v
Table 1.1 AVR Fuel Variant Codes .............................................................................................................. 1
Table 1.2 Summary of AVR and THTR Fuel Details by Process Category ................................................. 2
Table 1.3 Comparison of the Radionuclide Content in Fuel ......................................................................... 4
Table 1.4 Radionuclide Breakdown (Part 1) ................................................................................................. 5
Table 1.5 Radionuclide Breakdown (Part 2) ................................................................................................. 6
Table 1.6 Radionuclide Breakdown (Part 3) ................................................................................................. 7
Table 1.7 Dose Rate for AVR Cans .............................................................................................................. 9
Table 1.8 Dose Rate for Two Digester Tanks ............................................................................................. 10
Table 1.9 Dose Rates for Freshly Separated Uranium Blended to 10% U-233+U-235 Enrichment .......... 11
Table 2.1 Sludge Batch Schedule and Blend Capacity ............................................................................... 22
Table 4.1 H Canyon M&E List (Part 1) ...................................................................................................... 56
Table 4.2 H Canyon M&E List (Part 2) ...................................................................................................... 57
Table 4.3 H Canyon Option 2 or 2T Additional M&E List ........................................................................ 58
Table 4.4 L Area Option 6 M&E List (Part 1) ............................................................................................ 59
Table 4.5 L Area Option 6 M&E List (Part 2) ............................................................................................ 60
Table 4.6 L Area Option 6 M&E List (Part 3) ............................................................................................ 61
Table 4.7 Approximate Instrument List ...................................................................................................... 62
Table 5.1 Option 1 Material Balance – 10:1 Recycle- Baseline ................................................................. 66
Table 5.2 Option 1 Material Balance –No Recycle .................................................................................... 67
Table 5.3 Option 1 Material Balance –40:1 Recycle .................................................................................. 68
Table 5.4 Option 1 Material Balance –10:1 Reuse with Minimal (5%) Acid Loss .................................... 69
Table 5.5 Option 1 Material Balance –Radionuclide Mass by Stream ....................................................... 70
Table 5.6 Option 1 Material Balance –Radionuclide Curie Content by Stream ......................................... 71
Table 5.7 Option 2 Material Balance – 10:1 Recycle- Baseline ................................................................. 74

SRNL-TR-2014-00209 Process Description for Processing of HTGR Pebble Fuel at SRS x October 2014
Official Use Only
Table 5.8 Option 2 Material Balance –Radionuclide Mass by Stream ....................................................... 75
Table 5.9 Option 2 Material Balance –Radionuclide Curie Content by Stream ......................................... 76
Table 5.10 Option 2T Material Balance – 10:1 Recycle- Baseline ............................................................. 79
Table 5.11 Option 2T Material Balance –Radionuclide Mass by Stream ................................................... 80
Table 5.12 Option 2T Material Balance –Radionuclide Curie Content by Stream ..................................... 81
Table 5.13 Option 6 Material Balance – 10:1 Recycle- Baseline ............................................................... 84
Table 5.14 Option 6 Material Balance – 40:1 Reuse and Minimal Acid (5%) acid Loss ........................... 85
Table 5.15 Option 6 Material Balance –Radionuclide Mass by Stream ..................................................... 86
Table 5.16 Option 6 Material Balance –Radionuclide Curie Content by Stream ....................................... 87
Table 5.17 Salient Saltstone Limits ............................................................................................................ 88
Table 5.18 Option 1 (AVR Only) Material Balance – 10:1 Recycle- Baseline .......................................... 91
Table 5.19 Option 1 (AVR Only) Material Balance –Radionuclide Mass by Stream ................................ 92
Table 5.20 Option 1 (AVR Only) Material Balance –Radionuclide Curie Content by Stream .................. 93

Process Description for SRNL-TR-2014-00209 Processing of HTGR Pebble Fuel at SRS October 2014 xi
Official Use Only
(This page intentionally left blank)

SRNL-TR-2014-00209 Process Description for Processing of HTGR Pebble Fuel at SRS xii October 2014
Official Use Only
ACRONYMS AVR Arbeitsgemeinschaft Versuchreaktor ANN Aluminum Nitrate Nonahydrate ARP Actinide Removal Process BISO Bi-isotropic CASTOR Cask for Storage and Transportation of Radioactive Material CST Crystalline Silicotitinate DF Decontamination Factor DOT Department of Transportation DTS Dry Transfer System DWPF Defense Waste Processing Facility FIMA Fissions per Initial Metal Atom HEPA High-Efficiency Particulate Air HEU Highly Enriched Uranium HLW High Level Waste HTGR High Temperature Gas-Cooled Reactor IAEA International Atomic Energy Agency kg Kilogram LEU Low Enriched Uranium LWR Light Water Reactor M&E Material and Equipment MCO Multi-Canister Overpack MST Monosodium Titinate MT Metric Tone MTU Metric Tonne Uranium NNSS Nevada National Security Site SAS Steam Atomizing Scrubber SNM Special Nuclear Material SRNL Savannah River National Laboratory STS Shielded Transfer System TBD To Be Determined Th Thorium THTR Thorium Hochtemperaturreacktor TRISO Tri-isotropic U Uranium WCS Waste Controlled Specialist

Process Description for SRNL-TR-2014-00209 Processing of HTGR Pebble Fuel at SRS October 2014 1
Official Use Only
1.0 Feed Materials 1.1 Feed Materials
The intention of this section is to provide a brief overview of the characterization of the feeds into process categories. It is not intended to provide a detailed overview of the pebble fuel design features, which is well documented in several reports (e.g.,Verfondern 2007). A typical pebble is about 60 mm in diameter. The average density of the carbon, for THTR (Thorium Hochtemperaturreacktor) fuel for example, is 1.72, close to the density
has an ambient density of 2.26, but at the operating temperature the density approaches 1.7 or so). This is a generalization since the salt is actually comprised of a variety of sodium forms. The THTR kernels when free from the graphite matrix are typically 400 microns in diameter and have a density of 9.1, which would cause them to sink in the molten salt. The Arbeitsgemeinschaft Versuchreaktor (AVR) fuel is more varied, with kernel diameters typically around 500 microns, but ranging from 200 to 600 microns in diameter. The lowest level of classification is by the fuel variant codes. The following table (Table 1.1) shows typical data available from the Verfondern report that provides details for these categories.
Table 1.1 AVR Fuel Variant Codes
A summary of these data broken down into the twelve AVR categories and the one THTR category is provided in Table 1.2. These codes are grouped into twelve AVR characterization categories by Pohl (Pohl 2012) with additional data on the pebbles from Verfondern. Categories denoted by an * indicate those where categorization could be either A or C due to possible mixing.
(b)(3)(4)

SRNL-TR-2014-00209 Process Description for Processing of HTGR Pebble Fuel at SRS 2 October 2014
Official Use Only
Table 1.2 Summary of AVR and THTR Fuel Details by Process Category
Note 1: Categories 1.4 and 2.3 fuel were removed from the reactor late, but are included in Category C, which is more similar to these pebbles.

Process Description for SRNL-TR-2014-00209 Processing of HTGR Pebble Fuel at SRS October 2014 3
Official Use Only
The process category shown in Table 1.2 is assigned for the purposes of this study. This process category groups the materials into categories that share some common features and which can be linked back to the shipping containers. Were additional data available from Germany showing a more detailed crosswalk between the AVR categories and the shipping containers, a more detailed process grouping could be made. The numbers of pebbles for each category along with other key percentages in grams or percentages are noted. The percent fissions per initial metal atom (fima) is proportional to burn-up, and a complete definition is outside the scope of this summary. The carbon (C) mass in grams is estimated based on the pebble data provided in the lower portion of the table assuming the average carbon is that calculated by subtracting the oxides from the midpoint between the minimum and maximum reported values of the total mass. A matrix showing the breakdown of fuels at a summary level into bi-isotropic (BISO) and tri-isotropic (TRISO) forms is also provided. TRISO fuels have a SiC coating layer and BISO fuels do not. This summary is simplified for conceptual purposes. See the Verfondern report for precise details. For the purpose of this study, a value of 195 grams of C and 2.25 grams of SiC (for TRISO fuel) is assumed to be present with each pebble. The sintering temperature is as high as 1950 degrees C for the TRISO fuel, and slightly lower for the majority of the AVR fuels. The process categories used in this study are as follows:
Category A is comprised of LEU pebbles or HEU pebbles mixed with LEU pebbles in the shipping containers. With some exceptions, this category was the last fuel to be pulled from the reactor and is a TRISO fuel type.a Category B is comprised of HEU fuel that is BISO like the THTR fuel, but has a large proportion of carbide versus oxide fuel forms. It was pulled from the reactor early in the life. Although AVR and THTR fuels are similar, they differ in a number of ways, e.g., AVR fuels were prototypes and are often carbide fuel forms. For this reason, the table shows this category broken down into AVR-B and THTR-B. Category C is comprised of a wide variety of research fuels which, as a rule, were pulled out of the reactor in the middle of the reactor operating life. Although not all the fuel types are TRISO, insufficient data are available to sort the BISO from the TRISO, so pending additional details from Germany, these are all assumed to be TRISO fuel, which requires more complex processing.
1.2 Radionuclide Content by Category Table 1.3 shows a comparison between the accountability (or shipping) data that are available at the cask level with the projected radionuclide content based on various reports projecting the radionuclide content in time. The mass values are in grams. The left hand table shows the estimates of radionuclides based on the roll-up of the 12 AVR and one THTR categories. The data from AVR are adjusted to 2013 based on estimates provided by Pohl (2012). The THTR data are derived from a report in German (Niephaus 1999), which assumed a 5.3% fima (fissions in initial mass of actinides) level to match the U-235 accountability value with that estimated by the decay code. The THTR data were after ten years of cooling. The 2013 levels for the THTR fuel were estimated by Javier Reyes-Jimenez (email). The “shipping” or accountability values are taken from an independent sum of data for the various casks (see AVR 2011 and THTR 2013). The categories and data match closely enough for conceptual purposes to support the current study. a Category 3.1 fuel was taken out of the reactor early and is grouped in the category with other LEU fuel. Categories 1.4 and 2.3
fuel were removed from the reactor late, but are included in Category C, which is more similar to these pebbles. These switches also allow closer alignment of the inventory estimates based on categories and accountability data.

SRNL-TR-2014-00209 Process Description for Processing of HTGR Pebble Fuel at SRS 4 October 2014
Official Use Only
Table 1.3 Comparison of the Radionuclide Content in Fuel
Tables 1.4 through 1.6 show a breakdown by radionuclide for these four categories and the overall summary. Also included in the tables is an estimate of the portioning of these elements between the salt, digested kernels, and off-gas based on data extracted from an earlier draft of SRNL-STI-2014-00266 (Pierce 2014). Data are not currently available for the off-gas from kernel dissolution, so the off-gas data should be seen as an incomplete estimate. In many cases, as the design matures, many of these radionuclides could be trapped for disposal as solid waste. The “Max/Avg” values show the ratio of the maximum category divided by the average of the categories.

Process Description for SRNL-TR-2014-00209 Processing of HTGR Pebble Fuel at SRS October 2014 5
Official Use Only
Table 1.4 Radionuclide Breakdown (Part 1)

SRNL-TR-2014-00209 Process Description for Processing of HTGR Pebble Fuel at SRS 6 October 2014
Official Use Only
Table 1.5 Radionuclide Breakdown (Part 2)

Process Description for SRNL-TR-2014-00209 Processing of HTGR Pebble Fuel at SRS October 2014 7
Official Use Only
Table 1.6 Radionuclide Breakdown (Part 3)
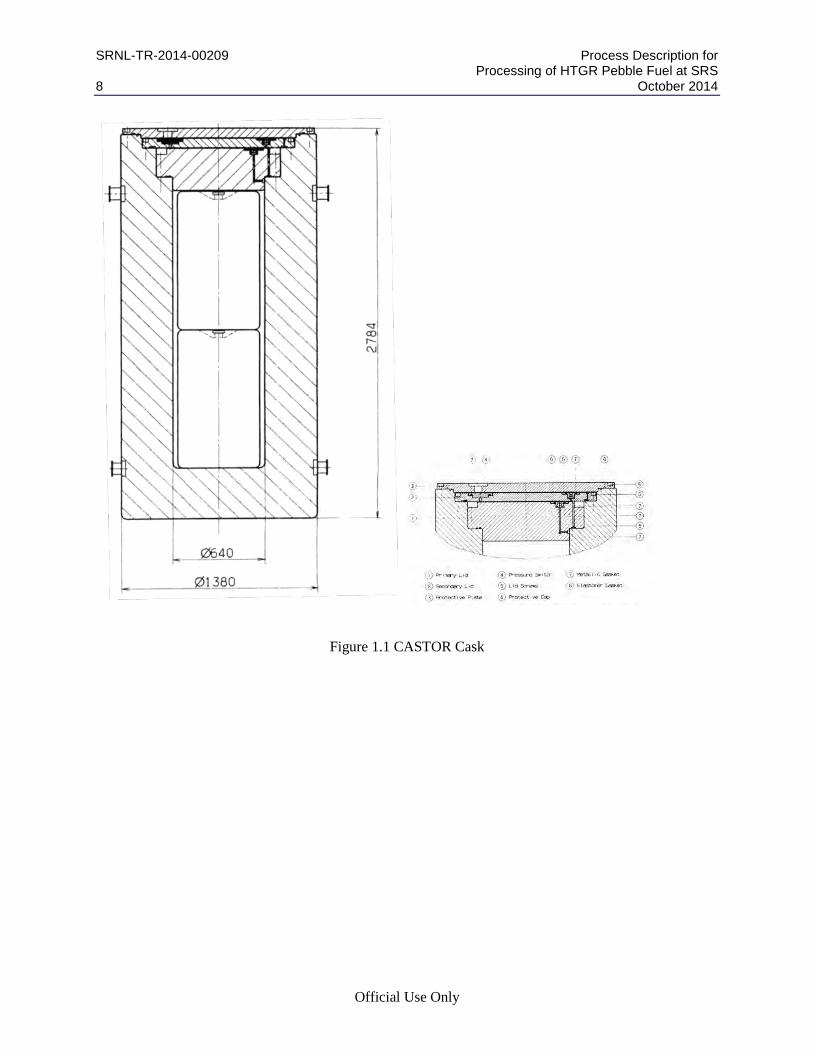
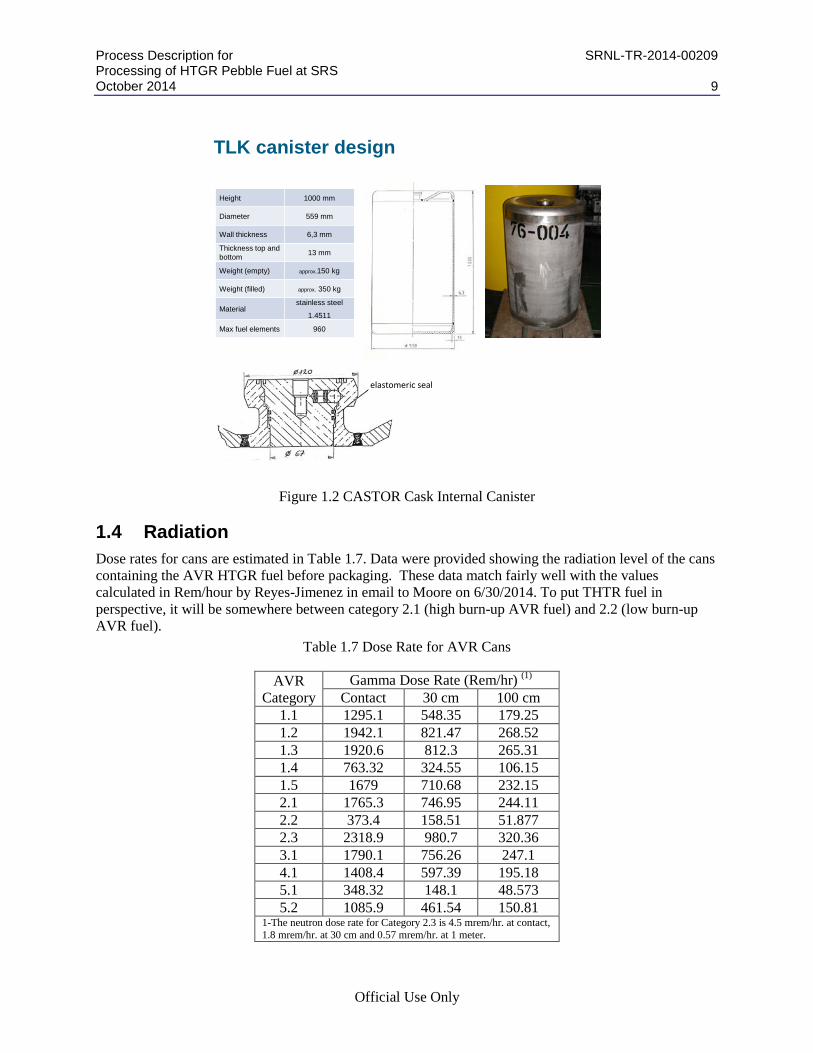
1.3 Packaging The used fuel pebbles are shipped in CASTOR THTR/AVR casks. The casks weigh about 25 MT, and the AVR casks contain about 1900 pebbles in two canisters, while the THTR fuel is contained in a single longer can within the cask. A simplified drawing of the cask showing two AVR fuel cans inside (without impact limiters shown) is provided in Figure 1.1. The pictorial on the right side of Figure 1.1 shows the sealing system (Theenhaus). A simplified drawing of an AVR fuel can, designated a TLK canister, is shown in Figure 1.2. The pictorial at the bottom of Figure 1.2 shows the pintle used for lifting the can and the sealing system for the can.
SRNL-TR-2014-00209 Process Description for Processing of HTGR Pebble Fuel at SRS 8 October 2014
Official Use Only
Figure 1.1 CASTOR Cask
Process Description for SRNL-TR-2014-00209 Processing of HTGR Pebble Fuel at SRS October 2014 9
Official Use Only
Figure 1.2 CASTOR Cask Internal Canister
1.4 Radiation Dose rates for cans are estimated in Table 1.7. Data were provided showing the radiation level of the cans containing the AVR HTGR fuel before packaging. These data match fairly well with the values calculated in Rem/hour by Reyes-Jimenez in email to Moore on 6/30/2014. To put THTR fuel in perspective, it will be somewhere between category 2.1 (high burn-up AVR fuel) and 2.2 (low burn-up AVR fuel).
Table 1.7 Dose Rate for AVR Cans
AVR Category
Gamma Dose Rate (Rem/hr) (1) Contact 30 cm 100 cm
1.1 1295.1 548.35 179.25 1.2 1942.1 821.47 268.52 1.3 1920.6 812.3 265.31 1.4 763.32 324.55 106.15 1.5 1679 710.68 232.15 2.1 1765.3 746.95 244.11 2.2 373.4 158.51 51.877 2.3 2318.9 980.7 320.36 3.1 1790.1 756.26 247.1 4.1 1408.4 597.39 195.18 5.1 348.32 148.1 48.573 5.2 1085.9 461.54 150.81
1-The neutron dose rate for Category 2.3 is 4.5 mrem/hr. at contact, 1.8 mrem/hr. at 30 cm and 0.57 mrem/hr. at 1 meter.
TLK canister design
Height 1000 mm
Diameter 559 mm
Wall thickness 6,3 mm
Thickness top and bottom 13 mm
Weight (empty) approx.150 kg
Weight (filled) approx. 350 kg
Materialstainless steel
1.4511
Max fuel elements 960
elastomeric seal

SRNL-TR-2014-00209 Process Description for Processing of HTGR Pebble Fuel at SRS 10 October 2014
Official Use Only
Shielding needed for pebbles is illustrated in Figure 1.3. These estimates are based on data contained in an email from Reyes-Jimenez to Moore, 7/2/2014. The charts show that 2 feet or more of concrete will be required for shielding. The AVR 2.3 fuel is the worst fuel for dose, but it is limited in quantity.
Figure 1.3 Concrete Thickness vs. Shielding
The digester radiation dose is estimated in Table 1.8, based on data extracted from an email from Reyes-Jimenez to Moore, 7/9/2014. The table lists dose rates from two digesters for the following two cases; Case 1) source is uniformly distributed throughout the entire digester volume and, Case 2) the kernels or source is at the bottom of the digester, the salt is on top. For Case 2 the detector locations are at the source elevation. The dose rate at contact increased for the concentrated source at the bottom, whereas, when the source is distributed the contact dose rate is lower.
Table 1.8 Dose Rate for Two Digester Tanks
Detectors
Digester Case 1- Uniform source distribution (Rem/hr.) AVR-A AVR-B AVR-C THTR
1 (center) 35 39.5 53.7 26.1 2 (1 m) 20.78 23.47 31.89 15.5
3 (contact) 163.72 185.6 252 122.6 4 (1m from one
digester) 26.09
29.43 39.9
19.44
Detector at Source Elevation
Digester Case 2- Source concentrated at the bottom (Rem/hr.), detector at the source elevation.
1 19.35 22.5 30.3 14.85 2 10.62 12.4 16.6 8.13 3 1109 1284.7 1734 846 4 14.92 17.4 23.4 11.4
The dose for oxide after separation builds up rapidly with time as shown in Table 1.9 and Figure 1.4 [Email from Reyes-Jimenez to Moore, 9/10/ 2014]. The table compares the dose for the worst case fuel (AVR Category 2.3) and the average fuel, were all the fuel perfectly blended. The table calculates the dose rates from one kilogram of uranium of AVR Category 2.3 fuel and one kilogram of the average fuel (THTR and AVR), assuming the uranium source is enclosed in the same stainless steel container as described below. The dose rates listed in Table 1.9 are at contact and at 30 cm from the source. These dose rates would apply only if the freshly extracted uranium was handled in close proximity to personnel, which is very unlikely. Furthermore, the “one kg uranium model does not include shielding; the mass of uranium is enclosed by small cylindrical stainless steel container 3” in diameter, and 2.5” tall, 0.2 mm
1.E+00
1.E+01
1.E+02
1.E+03
1.E+04
1.E+05
0 0.5 1 1.5 2 2.5
Cont
act D
ose
Rate
(mre
m/h
r)
Concrete wall Thickness (feet)
Concrete Wall for AVR option 2 3 and Average; 2000 pebbles
AVR Average
AVR Option 2.3
1.E+00
1.E+01
1.E+02
1.E+03
1.E+04
0 0.5 1 1.5 2 2.530
cm
Dos
e Ra
te (m
rem
/hr)
Concrete wall Thickness (feet)
Concrete Wall for AVR option 2 3 and Average; 2000 pebbles
AVR Average
AVR option 2.3

Process Description for SRNL-TR-2014-00209 Processing of HTGR Pebble Fuel at SRS October 2014 11
Official Use Only
thick.” The LEU content assumes blending with DU to <10%U-233+U235. See calculation notes (Reyes-Jimenes 2014) for additional details.
Table 1.9 Dose Rates for Freshly Separated Uranium Blended to 10% U-233+U-235 Enrichment
Decay and buildup
(Days from Separation)
AVR 2.3 Average of AVR Plus THTR
Contact (mrem/hr.) at 30 cm (mrem/hr.)
Contact (mrem/hr.)
at 30 cm (mrem/hr.)
0.1 3.34E+01 4.88E-01 1.76E+00 2.54E-02 1 6.93E+01 1.09E+00 3.67E+00 5.72E-02 3 5.57E+02 9.45E+00 1.54E+01 2.56E-01
10 6.02E+03 1.01E+02 1.14E+02 1.90E+00 30 2.66E+04 4.49E+02 4.59E+02 7.71E+00 90 9.37E+04 1.58E+03 1.52E+03 2.57E+01
Figure 1.4 Dose Rate from Blended LEU Separated from AVR Category 2.3 Fuel versus Time
1.5 Nuclear Criticality Safety The feasibility of high temperature gas-cooled reactor (HTGR) carbon digestion has been studied from a criticality safety perspective. The following assumptions and text were provided in the preliminary conceptual criticality safety analysis (Williamson 2014): 1. Carbon digestion will consist of 1,000 pebbles at a time. 2. Each pebble contains 200 g C, 1 g U, 10 g Th. 3. Each pebble has a beginning of life enrichment of 95% U-235. 3 d. 4. 5. The tank will hold a solution volume of 1.3 m and has a total volume of 1.6 m3.
1.E-01
1.E+00
1.E+01
1.E+02
1.E+03
1.E+04
1.E+05
0 20 40 60 80 100
Dos
e Ra
te (m
rem
/hr)
Time (days)
Revised AVR2.3 I kg of UO3 Time dependent dose rate (mrem/hr)
30 cmContact
(b)(3), (4)(b)(3), (4)

SRNL-TR-2014-00209 Process Description for Processing of HTGR Pebble Fuel at SRS 12 October 2014
Official Use Only
6. Tank diameter is 3.5’ and the height is 6’. 7. Up to 500 g U-233 may be present. The first configuration that was analyzed was a homogeneous mixture of U, Th, C, and . The keff of this configuration is very, very low (<0.1). This is reasonable since there is no hydrogen in this configuration, and the overall U-235 concentration is low (<1 g U-235/L). Although carbon is a good moderator, there is not enough U-235 or C in this size system to approach criticality. The second configuration that was analyzed was when the kernels were exposed and collected on the bottom of the tank. If the slab of kernels is thin enough, criticality is not possible. For a U-
/water system, this thickness is 4.9 cm (ANS 8.1). For this analysis, a minimum slab thickness of 5 cm (~2") was assumed. This is to maximize the U-235 concentration while still allowing some interstitial space for moderators like C and H. The keff of this configuration is still very, very low (<0.2). Next, the optimal H/X ratio was evaluated based on the concentrated mixture of U-235, Th, C, ,
and H in the 5 cm slab on the bottom of the tank. The optimal moderation was found to be at H/X ≈ 3000. The keff of the system at this optimal moderation is ~0.35. When H/X < 3000, the system is undermoderated, and when H/X > 3000, the system is overmoderated. The low keff at optimal moderation indicates that there is no amount of hydrogen that can make the system go critical.
Figure 1.5 Optimal Moderation
The geometry of the bottom of the tank was also evaluated. For this part of the analysis, the tank was assumed to have a truncated cone-shaped bottom. The following dimensions were assumed: 1. Bottom diameter of cone: 8” 2. Height of cone: 24” 3. Top diameter of cone: 3.5’ (same diameter as the tank) The volume of concentrated kernels was kept the same as in the 5 cm slab case. This case was also evaluated at the optimal moderation of H/X ≈ 3000. In the picture below (Figure 1.6), the pink area represents the concentrated U, Th, C, H, mixture. The blue area represents the same
(b)(3)(4)
(b)(3)(4)(b)(3)(4)
(b)(3)(4)(b)(3)(4)
(b)(3)(4)

Process Description for SRNL-TR-2014-00209 Processing of HTGR Pebble Fuel at SRS October 2014 13
Official Use Only
mixture, but without U (since all the U is assumed to accumulate in the bottom of the cone). The green area represents one foot of water reflection outside the tank, and the yellow area represents three feet of concrete reflection.
Figure 1.6 Simplified Model
The keff of this configuration is ~0.53. This indicates that a conical bottom tank is more reactive than a flat bottom tank, however, the keff is still very low, and a conical bottom tank should be safe from a criticality perspective. The amount of U-235 entrained in the molten salt was also evaluated. Assuming 10 kg of entrained U-235 in 1.6 m3 of solution, the keff of the system is ~0.63. This also assumes optimal hydrogen moderation, and that the kernels are accumulated in the bottom of the cone. This indicates that up to 10 kg of entrained U-235 are subcritical and can safely accumulate in the molten salt. Lastly, additional U-233 was added to the system, since much of this fuel will contain U-233. All analysis in this evaluation assumes beginning of life U-235 values. Even though it is not possible to simultaneously have beginning of life U-235 values and end of life U-233 values that is what is conservatively assumed for this analysis. The U-233 mass is assumed to be 500 grams, in addition to the 1,000 g HEU at 95% enrichment. When 500 g U-233 is added to the concentrated, optimally moderated

SRNL-TR-2014-00209 Process Description for Processing of HTGR Pebble Fuel at SRS 14 October 2014
Official Use Only
mixture at the bottom of the cone, keff is ~0.79. This is considered a bounding condition, but yet keff is still sufficiently low to not pose a criticality concern. There are several areas for further analysis as the HTGR project continues. The effect of temperature needs to be studied since the temperature reactivity coefficients of a carbon-moderated system are different than those usually encountered at SRS and carbon digestion will occur at a high temperature. Also, all intermediate configurations of the kernels accumulating in the bottom of the tank need to be analyzed to ensure that the most reactive configurations have been analyzed. In conclusion, a criticality accident during carbon digestion is unlikely and may indeed be not credible. A complete, peer-reviewed criticality analysis is needed before operations commence. If desired, in order to mitigate any potential risk caused by uncertainty in the criticality analysis, the project team could opt to use geometrically-favorable tanks. However, it is unlikely that geometrically-favorable tanks are needed to prevent a criticality accident.
2.0 H-Area Options 2.1 Functional Description and Sizing Basis The required process can be broken down into functions and sub-functions as shown in Figure 2.1. The blue-lined functions are common to Options 1, 2, and 2T. The red-lined functions are common only to Options 2 and 2T. For cost estimating purposes only, the description assumes the salt-digestion process in a batch process with a salt reuse factor of ten. On the one hand, these assumptions may change as salt-digestion development and the gas-digestion process matures. On the other hand, many of the critical assumptions such as a ten to one salt reuse require further development to support the assumed design.

Process Description for SRNL-TR-2014-00209 Processing of HTGR Pebble Fuel at SRS October 2014 15
Official Use Only
Figure 2.1 H-Area Options - Functional Breakdown
A brief description of each major sub-function follows. The throughput goal of the H-Area Option is 1,000 pebbles per day. Unload Cask: Unload Cask and Move Can: The CASTOR cask will be brought into the H-Canyon railroad tunnel and unloaded using the existing Canyon crane. In this function, the cask is moved into the railroad well airlock by rail car, where the protective lid and the outer cask lid are unbolted and set aside. The inner shielding lid is unbolted but left in place. The cask is then moved into the H-Canyon railroad well. Using the hot Canyon crane, the shield plug is removed and set aside. A grapple on the hot Canyon crane is used to remove each can, one at a time, to a can staging rack located in the Hot Shop. Lag storage is provided for of up to four 1,000 capacity pebble cans or two 1,900 capacity pebble cans. The can is later moved to and placed into a can cutting station. The process is sized to process up to 1,000 pebbles a day, i.e., about 1 cask containing 2,000 pebbles will be handled every other day. For details of unique equipment employed in Germany for handling and opening the casks, see Handling Equipment for Unloading CASTOR THTR/AVR Casks (WTI/90/13).

SRNL-TR-2014-00209 Process Description for Processing of HTGR Pebble Fuel at SRS 16 October 2014
Official Use Only
Assay Can: Each Assay Can will be assayed (confirmatory) using two perpendicular collimated LaBr3 detectors designed into the can staging rack. The purpose of the measurement is to ascertain the radiation spectrum and to compare it with that anticipated based on radiation burn-up calculations. This information will help assure that what is being processed is what was anticipated, and to facilitate process control. The reading could serve as a leg of a multiple leg contingency strategy for nuclear safety control. Dock Can and Cut Off Can Top: The can will be moved by the hot Canyon crane (or possibly fixed automation) and docked into position in a cradle with a cutting device. The top of the can will be removed using the cutting device. The severed lid is then removed using the hot Canyon crane and grapple and set aside for later packaging in preparation for disposal. Dump Pebbles: The can cutting devise will be designed to invert the open can to empty the pebbles into a pebble hopper. The pebble hopper is sized for the maximum load of 1,900 pebbles from one large THTR can. Batch Pebbles: A batch size quantity of pebbles will be metered out of the pebble hopper into a portable pebble bucket. The pebble bucket will be moved to the digester system by the hot Canyon crane for charging to the digester. The pebble bucket collects 500 pebbles, which is the target daily throughput for each digester. Package Waste: Waste cans (i.e. empty fuel cans) and severed lids will be moved by the hot Canyon crane to the railroad tunnel and packaged into a LLW container. Provisions to assay and clean the cans could be needed (TBD), but are not assumed in the estimate. It is assumed that a contamination level for this waste will be established as the first cans are processed to verify that they meet LLW disposal criteria. Maintenance Station: The Swimming Pool will be modified to enable maintenance of process equipment such as the can cutter on the can cutting device. Two robotic arms will be provided to help maintain the equipment. Digest Pebbles: Move Batch: The pebble bucket is moved to one of the digesters and docked into position on the charging hopper using the hot Canyon crane. The H-Canyon system has two digesters. This will give a nominal capacity of 1,000 pebbles per day. Assuming 75% attainment and 95% loading (cans typically have 950 pebbles not 1,000 pebbles), digestion would take 3.5 years. Charge Digester: The digester is charged with the entire batch of 500 pebbles, or alternately the pebbles could be metered into the digester (TBD). The digesters are made of Inconel. Each vessel will be located within an annular heat shield with appropriate resistance heaters contained in crane-removable quadrants. The use of inductive heating will be explored as the design progresses. The digestion system will be installed on a removable frame so that the entire assembly can be moved to the maintenance station for repair or decontamination as required. The bottom section of the digester will be funnel shaped with an annular space for collecting kernels in a geometrically favorable manner. The rest of the digester would not be geometrically favorable and would require mass control of inputs and outputs for nuclear criticality safety. The top section would have heated fins to reduce carryover of salt and graphite and prevent buildup of salts in the upper region of the vessel. The vessel will be designed with a removable basket, which can be removed for inspection, or when in place can be fed from the pebble charging hopper using fixed automation
(b)(3), (4)

Process Description for SRNL-TR-2014-00209 Processing of HTGR Pebble Fuel at SRS October 2014 17
Official Use Only
The normal process batch would involve 500 pebbles, each with 195 g carbon, with a target processing
for lost salt or replacement of spent salt. As the pebbles are
digested, their volume is reduced, and eventually the kernels leave the basket and settle in the bottom annular zone. Some of the fission products and a small portion of the uranium are carried over to the salt. A substantial fraction (about 8%) of the salt and some carbon fines (about 1.6%) carryover into the scrubber system. This carryover estimate is based C operations, so the carryover should be
(b)(3), (4)(b)(3), (4)
(b)(3), (4)
(b)(3), (4)
(b)(3), (4)(b)(3), (4)
(b)(3)(4)

SRNL-TR-2014-00209 Process Description for Processing of HTGR Pebble Fuel at SRS 18 October 2014
Official Use Only
Figure 2.2 Concentration versus Time in Digester (one pebble test)
Figure 2.3 Phase Diagram
(b)(3), (4)
(b)(3), (4)

Process Description for SRNL-TR-2014-00209 Processing of HTGR Pebble Fuel at SRS October 2014 19
Official Use Only
Decant Salt: After digestion is complete, the majority of the salt is transferred to a salt transfer tank by vacuum through a filter. Any solids collected on the filter are drained back into the digester when the salt is recharged to the digester. The design goal is to leave less than 10 liters of salt with the kernels in the digester. The transfer is through a sloped line with a removable/replaceable filter. The filter would trap any undissolved solids including carbon fines. Any solids trapped on the filter will be transferred back into the digester when the transfer is complete as the decanted salt is returned to the digester. Since the receiving vessel is higher than the salt level in the digester, the salt will be reused by simply gravity draining it back into the digester, and in so doing flushing back any solids on the filter. Freeze plugs in the salt transfer tank drain lines control the flow of salt. Regenerate Salt and Drain Spent Salt: The salt will be regenerated
This regeneration is done in either the salt transfer tank or the digester as required. If the salt cannot be reused, e.g., Cs buildup is too high; it is drained into a salt can designed for ease of salt dissolution. A circular turntable positioned under the salt transfer tank drain provides storage for up to six spent salt cans. Flow of spent salt into the spent salt cans is controlled by freeze plugs in the salt transfer tank drain lines. Recent data (Pierce 2014) indicates that it may be necessary to to achieve optimal regeneration. Another approach would be to find (through further testing) an optional temperature that would allow regeneration as the digestion takes place. Were continuous regeneration to prove viable, the reactor design could be simplified and a more continuous process utilized. The net regeneration reactions (Pierce 2014) for various forms of carbon are assumed to be as follows:
Drain Kernels: The kernels with some salt (e.g., less than 10 liters) that have collected in the bottom annular portion of the digester are drained into a can (called a K/S can) located in a housing on a turntable positioned under the digester. Prior to draining the kernels, the housing containing the can is raised to seal against the bottom of the digester. Once the filled can has cooled to the desired temperature (TBD), the can is lowered. The salt is held in place in the digester and drained though a freeze plug containing salt, which is heated or cooled to seal or open. The assumed dimensions of the K/S can are 5” dia. x 3’ high. The can is made of dissolvable carbon steel and is sized to fit in the Canyon dissolver insert. Note that the kernels are drained every other day so that the K/S can would have a nominal uranium content of 1 kg (typically the content for 1,000 pebbles), to optimize the efficiency of the dissolver. The K/S can, therefore, contains kernels from a total of nominally 1,000 pebbles. This provision also helps to minimize the usage of the hot Canyon crane. Prepare Digester: Upon an acceptable material balance (discussed later), the digester cycle is started over. This may require adding make-up salt to offset salt lost to the off-gas system or drained out with the kernels. Separate Kernels: Seal K/S Can: The turntable under the digester is rotated to position the K/S can in the sealing position where a can-sealing device is either lowered or moved horizontally into place. The K/S can is sealed with
(b)(3), (4)
(b)(3), (4)
(b)(3), (4)
(b)(3), (4)

SRNL-TR-2014-00209 Process Description for Processing of HTGR Pebble Fuel at SRS 20 October 2014
Official Use Only
a steel lid to keep material from spilling during transport and to facilitate lifting by the crane. A dedicated station with fixed automation is located on the turntable for this function. Assay K/S Can: The turntable is again rotated, and the can is moved under an active-coincidence-neutron counter, which is lowered into place. The counter conceptually is 1’ wider on both sides than the can. The height of the assay device is well over double that required for measurement alone since a calibration source is located within an upper chamber, where it is lowered into position to provide a measured reference before each actual measurement. A removable shield plug (via fixed automation) separates the two chambers. These operations are all done with fixed automation. When the measurement is complete, the assay device is raised back above the can. Move K/S Can: The sealed and assayed K/S can is then moved by the hot Canyon crane to either a storage position or to the dissolver for charging. Store: A processing option to avoid bearing the entire operating cost of the Canyon involves running the digestion operations for some period of time without impacting other Canyon missions. To support this option, storage for 2/3 of the kernel cans is required. One approach will be to store the cans in bundles in racks in the bundle storage area of the hot Canyon. For the kernel in salt approach described above only two cans could be stored in a bundle. With rack spacing at 8-9” about ½ a Canyon section will be required for storage. Note: One concern with storage is that it would impact the ability to close the inventory balance around the digesters, possibly requiring more frequent cleanouts with associated production downtime. The assay device mitigates against this concern, but the precision of this device is not fully understood at this time. Further, the safety of storage of the kernels or salt and kernels must also be evaluated. It is assumed that in the kernel storage cases that the salt will be processed as it is generated. This means that the uranium lost to the salt will be disposed as waste in the other options. Dissolve Kernels: Prepare Dissolver, Charge Dissolver and Dissolve Kernels: The large Canyon dissolvers have inserts which allow up to three K/S cans with up to 1 kg of uranium per can. There are significant differences between the fuel previously demonstrated and the HTGR used fuel, which is much more burned-up and is an oxide. It has carbides and silicides and is high-fired to 1,950 degrees C. Up to three cans, each containing a kg or so of uranium will be charged to the dissolver with one can per well. The dissolver solution should be 12M HNO3, 0.1M KF, and a small quantity of aluminum nitrate nonahydrate (ANN). The dissolution cycle time is currently unknown, but could be as long as 4 days (TBD). After each dissolution batch, the wells will be probed to verify that the K/S can has dissolved. Upon successful probe results, additional charges will be added, maintaining the concentration of uranium below 3.8 g/l. When another charge cannot be added without exceeding the concentration limit, the solution is transferred and sampled. These sample results are also used to maintain a balance around the digestion process. If the dissolution time is as long as anticipated (4 days), it would take over 3 years with two dissolvers to process all the kernels from the HTGR used fuel. If the dissolution can be done in 2 days or so, then the dissolution could be completed in a year and a half. The expected equation for dissolution in high acid is shown below (Kessinger 2002).
UO2+4HNO3-> UO2(NO3)2+2NO2+2H2O Opportunity: An activity critical to scoping the dissolver impact is an SRNL test with actual high-fired fuels using the proposed Canyon flowsheet. The risk is that a third dissolver could be needed. Since a

Process Description for SRNL-TR-2014-00209 Processing of HTGR Pebble Fuel at SRS October 2014 21
Official Use Only
third dissolver is being considered for other Canyon missions as well, it may be prudent to cost the installation of the dissolver as a risk mitigation issue. Study of the dissolution flowsheet could possibly also reduce corrosion, which could be severe with this high a level of fluoride and acid. Further, since some of these fuels have carbide rather than oxide fuel forms, some work is required to develop a flowsheet to adequately dissolve the various forms of uranium and thorium and uranium-thorium oxides and carbides. The processing of the dissolved solution is dealt with in the discussion of the waste processing function, so as to rightly explain the differences between Options 1, 2, and 2T in one place. Treat Salt: Dissolve Salt: Salt is dissolved in a salt washer. The washer has the ability to pump a spray down on the spent salt cans and agitate solution to facilitate dissolution of the salt. Dissolution is with slightly acidified water or scrubber solution, with additional acid metered in to ensure controlled dissolution
. To minimize waste, excessive acid levels are avoided. The spent salt cans are reused after the salt is removed. A six thousand liter vessel should be adequate for the salt from a 500 pebble digester. Since the salt is regenerated and reused, the salt washing process will be operated intermittently. Were salt reuse less than anticipated, the wash tank should have some excess capacity. To minimize waste volume, maximum dissolution with the off-gas scrubber solution is desired. Sample: The waste solution containing the dissolved salt is transferred to another existing Canyon vessel and sampled. If uranium content in the salt is too high, processing through solvent extraction is an Option only in Options 2 and 2T. Preliminary data indicates as much as 12% of the uranium could end up in the salt. Liquid HLW Processing (varies for each option): Dispose of Dissolver Solution: In Option 1, all of the dissolver solution is transferred for disposal to the liquid HLW system. In Options 2 and 2T the dissolver solution is processed through solvent extraction. The neutralization of salt solution (Options 1, 2 and 2T) and the concentration of uranium and thorium in the dissolver solution (Option 1 only) will impact the volume of liquid HLW to be disposed. These two issues are discussed below.
Th/U Disposal (Option 1): The resultant solution is transferred, manganese is added, and the solution is again sampled prior to neutralization. Previous data indicates that dilution to somewhere between 0.05M
(b)(3), (4)
(b)(3)(4)
SRNL-TR-2014-00209 Process Description for Processing of HTGR Pebble Fuel at SRS 22 October 2014
Official Use Only
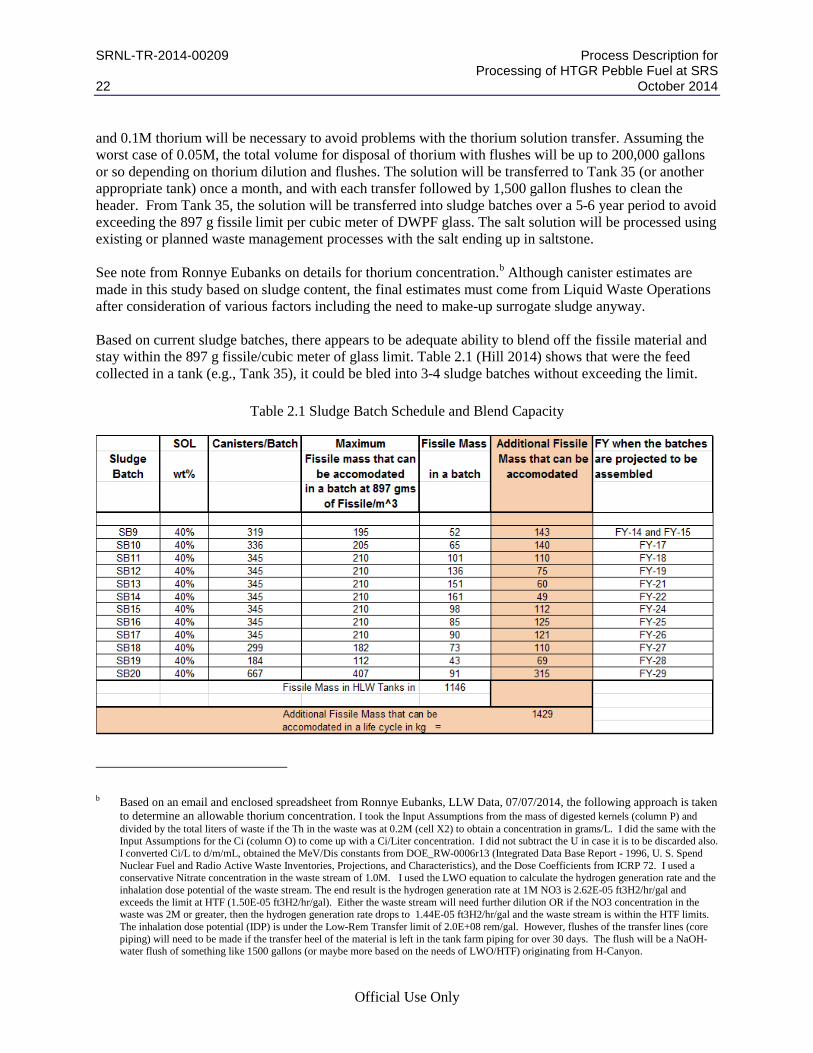
and 0.1M thorium will be necessary to avoid problems with the thorium solution transfer. Assuming the worst case of 0.05M, the total volume for disposal of thorium with flushes will be up to 200,000 gallons or so depending on thorium dilution and flushes. The solution will be transferred to Tank 35 (or another appropriate tank) once a month, and with each transfer followed by 1,500 gallon flushes to clean the header. From Tank 35, the solution will be transferred into sludge batches over a 5-6 year period to avoid exceeding the 897 g fissile limit per cubic meter of DWPF glass. The salt solution will be processed using existing or planned waste management processes with the salt ending up in saltstone. See note from Ronnye Eubanks on details for thorium concentration.b Although canister estimates are made in this study based on sludge content, the final estimates must come from Liquid Waste Operations after consideration of various factors including the need to make-up surrogate sludge anyway. Based on current sludge batches, there appears to be adequate ability to blend off the fissile material and stay within the 897 g fissile/cubic meter of glass limit. Table 2.1 (Hill 2014) shows that were the feed collected in a tank (e.g., Tank 35), it could be bled into 3-4 sludge batches without exceeding the limit.
Table 2.1 Sludge Batch Schedule and Blend Capacity
b Based on an email and enclosed spreadsheet from Ronnye Eubanks, LLW Data, 07/07/2014, the following approach is taken
to determine an allowable thorium concentration. I took the Input Assumptions from the mass of digested kernels (column P) and divided by the total liters of waste if the Th in the waste was at 0.2M (cell X2) to obtain a concentration in grams/L. I did the same with the Input Assumptions for the Ci (column O) to come up with a Ci/Liter concentration. I did not subtract the U in case it is to be discarded also. I converted Ci/L to d/m/mL, obtained the MeV/Dis constants from DOE_RW-0006r13 (Integrated Data Base Report - 1996, U. S. Spend Nuclear Fuel and Radio Active Waste Inventories, Projections, and Characteristics), and the Dose Coefficients from ICRP 72. I used a conservative Nitrate concentration in the waste stream of 1.0M. I used the LWO equation to calculate the hydrogen generation rate and the inhalation dose potential of the waste stream. The end result is the hydrogen generation rate at 1M NO3 is 2.62E-05 ft3H2/hr/gal and exceeds the limit at HTF (1.50E-05 ft3H2/hr/gal). Either the waste stream will need further dilution OR if the NO3 concentration in the waste was 2M or greater, then the hydrogen generation rate drops to 1.44E-05 ft3H2/hr/gal and the waste stream is within the HTF limits. The inhalation dose potential (IDP) is under the Low-Rem Transfer limit of 2.0E+08 rem/gal. However, flushes of the transfer lines (core piping) will need to be made if the transfer heel of the material is left in the tank farm piping for over 30 days. The flush will be a NaOH-water flush of something like 1500 gallons (or maybe more based on the needs of LWO/HTF) originating from H-Canyon.

Process Description for SRNL-TR-2014-00209 Processing of HTGR Pebble Fuel at SRS October 2014 23
Official Use Only
For Option 2, the contribution of the salt and thorium to the overall liquid HLW volume as compared to Option 2T will be essentially unchanged with any difference resulting from some additional ANN and acid added, which is generated in solvent extraction. Dissolver Solution Processing (Options 2 and 2T): Solvent Extraction: In Option 2, after dissolution, the acid would have to be reduced as required to match the proven “Interim-23” flowsheet, demonstrated in the 60s (Karakker 1960 and Dupont 1966). The solution will be processed through solvent extraction using the solvent TBP concentration of the existing H-Canyon HM process, which should yield a slightly poorer separation of uranium from thorium than previously demonstrated. The uranium stream will be further processed in the B bank to remove additional TRU and tramp fission products. The rejected stream, including the Th, Pu, fission products, etc., will be processed for disposal to the liquid HLW system as previously discussed. The volume of liquid HLW will be governed by the thorium and salt concentration as in Option 1. The uranium stream will be converted to grout or oxide for disposal as LLW as discussed in the waste treatment function. A similar flowsheet, but with a higher solvent concentration, was used in the past for separate out both uranium and thorium. This modified flowsheet would be used in Option 2T.
(b)(3), (4)

SRNL-TR-2014-00209 Process Description for Processing of HTGR Pebble Fuel at SRS 24 October 2014
Official Use Only
Figure 2.4 Interim-23 Flowsheet
(b)(3), (4)

Process Description for SRNL-TR-2014-00209 Processing of HTGR Pebble Fuel at SRS October 2014 25
Official Use Only
Figure 2.5 Interim-23 Flowsheet (continued)
Blend-down Uranium: The uranium (Option 2) and the uranium/thorium (Option 2T) stream is blended down using existing blend-down equipment with DU at 0.3% U-235, provided in tank cars at 400 g/l. This dilution would take place in existing blend-down tankage, located in the outside facilities of H-Canyon. The resultant solution would end up in Tank E1-1. The uranium concentration being fed to the stabilization operation will be up to 200 grams per liter prior to neutralization. It is assumed that the uranium will be blended down to less than 10% U-233+U235, but blending this low may not be required. It is further assumed that the maximum fissile content allowed per LLW storage container is around 1.1 kg. This is higher than allowed by the existing E-Area performance assessment (PA) and would require a special study to confirm the adequacy of this approach for nuclear criticality safety control. Further study is required to determine if lower blend-down levels will be required for offsite disposal options. As discussed in Section 1.4, the dose rate of the freshly separated uranium stream quickly rises to levels that prohibit contact handling and processing of the material; therefore, blending operations must be completed in a timely manner to allow adequate time for further downstream processing and handling prior to disposal.
(b)(3), (4)

SRNL-TR-2014-00209 Process Description for Processing of HTGR Pebble Fuel at SRS 26 October 2014
Official Use Only
Cementation: Options 2 and 2T assume the purified U and U/Th respectively are grouted for disposal as LLW. The resultant grout associated with cementing 1 kg of uranium (pre-blended mass) is a few hundred liters, with a slightly higher volume in Option 2T due to the thorium. The WSB cementation system is used as the design basis; however, the resultant container will be sized to fit inside a CASTOR cask, rather than use a 55-gallon drum as now planned in WSB. It is assumed that the exiting blend-down tankage will be used to blend uranium solution from H-Canyon with 400 g/l DU solution to make 200 g/l feed for the cementation system. The resultant solution will be sent to a new cementation system with a one container per day capacity. The cementation capability will require a caustic supply system, a mixing system, and a vent system. A schematic of the mixing and cementation system is shown in Figure 2.6 (from M-M5-F-2857). A brief description of the required systems follows the schematic. See the Material and Equipment list in Section 4.0 for a list of major equipment associated with the cementation system.
Figure 2.6. WSB Cementation Flowsheet (from M-M5-F-2857)
A caustic supply system with provisions to connect to a portable caustic supply tank is required. The system will have two caustic supply pumps, a 1,000 gallon caustic supply tank with agitator, and two caustic metering pumps. A mixing system will provide needed equipment to supply neutralized and mixed solution to the cementation system. It consists of two cement head tanks (See HCMT-TK-001) and an agitated 600 gallon uranium solution feed tank (see HAW-TK-006). The vessels and cement station are vented through a 5,000 gallon overflow/vent tank. The cementation system consists of two cementation stations as described in M-SPP-F-00233. Each cementation system is supplied by a conveyor bearing up to 6 pre-loaded containers with disposable

Process Description for SRNL-TR-2014-00209 Processing of HTGR Pebble Fuel at SRS October 2014 27
Official Use Only
agitators. Similarly, a conveyor system provides lag and curing capability for up to 8 containers containing cemented uranium or uranium/thorium. A minimum curing time of 24 hours is required. A decon station is provided in case a container requires decontamination. Feed and product conveyor systems will be required. The cementation station is provided with an exhaust system with one stage of local high-efficiency particulate air (HEPA) filtration. An off-gas system consists of a condenser supplied with chilled water (20 gpm), two banks of HEPA filters each with two HEPA filters (two stages), and two exhaust fans rated at 100 scfm total capacity. The condenser drains to an overflow/vent tank. The system exhaust will be connected to the existing 292-H exhaust system. As discussed in Section 1.4, the dose rate of the freshly separated uranium stream quickly rises to levels that prohibit contact handling and processing of the material; therefore, cementation operations must be completed in a timely manner to allow adequate time for further downstream handling and disposal. Cemented Uranium Disposal: The preliminary evaluation of the feasibility of disposing of the cemented uranium (Option 2) or the cemented uranium/thorium (Option 2T) in E-Area was documented in a note from Harley to Moore, 7/8/2014 (Harley 2014). This note indicates that the uranium would not be suitable for disposal in E-Area based on existing PA limits. Preliminary discussion with the Nevada National Security Site (NNSS) and Waste Control Specialists (WCS) indicates that at this time, it is not feasible to dispose of the cemented uranium at either of these sites, but it is believed that the issue could be worked if desired over the next several years. Shipment to either the NNSS or WCS would require a Type B package (Solum 2014). Although the certification has lapsed, the CASTOR cask is a Type B package. Whether shipped or not, for shielding purposes, the CASTOR cask will be used for either interim storage or disposal of the uranium.
EU Disposal Evaluation
The following is a summary of feasibility evaluations for disposal of approximately 1 metric ton of enriched uranium (~30% U-235 & ~10% U-233). This evaluation considers disposal facility radiological performance assessment and nuclear criticality. This review does not address termination of safeguards for this material that will also need to be addressed prior to disposal on or off site.
Disposal in E-Area
Disposal of this material at SRS exceeds the current E-Area radiological performance assessment (PA) and would challenge the current nuclear criticality safety evaluation (NCSE). Both the PA and NCSE for E-Area can be modified to increase applicable limiting criteria with revised assumptions/inputs for waste forms, chemistry, packaging, revised disposal unit designs, etc. The scope, cost and potential benefits of these new evaluations cannot be provided at this time. The review did not review disposal of the 0.72 weight percent blend since this does not appear to be practical due to the large quantity of uranium blend. The review of the disposal impacts for a uranium blend at < 10% enrichment against the current PA resulted in the following observations:
• Were the material disposed in slit trenches, disposal is limited by the current PA primarily for Np-237, U-234, and U-235. Where as few as 349 packages @ 100 FGE/package (fissile gram equivalent/package) are required to reach the disposal inventory limit for a slit trench footprint.

SRNL-TR-2014-00209 Process Description for Processing of HTGR Pebble Fuel at SRS 28 October 2014
Official Use Only
• Were the material disposed to Low Activity and Intermediate Level Vaults, the disposal will be limited by the PA primarily for U-232 where as few as 677 packages @ 100 FGE/drum are required to reach the disposal inventory limit for the vaults. In addition, the existing limits do not allow disposal with more than 100 gram FGE per container.
Disposal at Off Site Facilities
The feasibility of disposal of these materials was discussed with the Nevada National Security Site (NNSS) and Waste Controlled Specialists, LLC (WCS). Neither facility will be a practical disposal option based on their existing/pending criteria. WCS is limited by special nuclear material facility inventories outside of a disposal unit and NNSS is limited due to U-233 acceptance issues under existing administrative policies. Both facilities believe these issues can be successfully managed in the next few years. Once these issues are addressed, both facilities could accept this material for disposal provided the waste package offered for disposal complies with Department of Transportation (DOT) regulations, i.e. – if DOT compliant for shipment then these criteria would support compliant disposal configurations for waste form and nuclear criticality controls. For budgetary estimates only, current (FY2014) WCS disposal fees only will be ~$6,500/m3 based on final disposal volume. This cost does not include: program certification, packaging, transportation, and any other Site cost.
The initial evaluation by solid waste personnel that determined the existing E-Area PA was exceeded by elements like U-234 was confirmed by Larry Hamm (Hamm 2014) of the Savannah River National Laboratory. Hamm stated that both the ground water and non-ground water limits (e.g., violations by resident intruder) were outside the limits of the PA, with the latter being exceeded more often by up to factor of 10. He believes the latter could be dealt with through an additional engineering feature such as a grout cap. Hamm completed a preliminary review and documented his results.c His scoping analyses “suggest that German-Fuel can be disposed of in E-Area within a single disposal unit (here assumed to be a Component-in-Grout unit).” Hamm explored a conceptual approach for SRS disposal of the waste in the CASTOR casks in a low level waste disposal unit in E-Area through revision of the PA. His study found that on-site disposal is feasible, but would require a PA revision and revised criticality safety controls. He did not specifically address the fissile inventory issue or the combined uranium-thorium fuel disposal case (Option 2T). Although he did not specifically include the CASTOR casks as metal barriers in the analysis, he believes taking some credit for the barriers would help manage risks. The analyses did take credit for the cementation of the uranium and specifically explored the use of the unused CIG-2 (Component-in-Grout) storage unit and considered compliance with the 1,000 year dose and 10,000 year peak dose limits. Figure 2.7 (left figure) shows a vertical cross section of the proposed emplacement configuration with three casks surrounded by 2 feet of grout. Grout degradation was not addressed. Figure 2.7 (right figure) shows the casks arranged in 3x22 matrices and occupying about a third of the single disposal unit CIG-2. He found that the projected Sum-of-Fractions (SOF) value for selected nuclide parents are less than one for both a 1,000 year and a 10,000 year compliance period. On the other hand, the wet climate of South Carolina is not an ideal burial site for uranium, which with its daughters will slowly leach over time. For this reason, options for offsite disposal should seriously be considered were this option selected.
c Larry Hamm, Preliminary Results and Ideas on On-Site Disposal of LLW Processed German-Fuel in E-Area, July 2014.

Process Description for SRNL-TR-2014-00209 Processing of HTGR Pebble Fuel at SRS October 2014 29
Official Use Only
Figure 2.7 Proposed Emplacement Configuration with Cross-Section (left) and Plan (right)
Handle Off Gas: The off-gas system is similar in concept to that used in DWPF (DWPF 1982) as shown in Figure 2.8, but would not have to have as high a decontamination factor (DF).
Figure 2.8 DWPF Off-gas Schematic
The overall scrubber system will be designed to attain a DF of 20,000 (this is the DWPF design DF; the DF for the digestion off-gas system could be lower) or so on any particulate, remove salt and cesium and graphite carryover, and remove up to of .
Any particles leaving the furnace are maintained at an adequate velocity by line sizing to minimize particulate collection. The gas stream with particulate is then passed through a quencher, which discharges to a
x (ft)
y(ft
)
0 100 200
0
100
200
300
400
500
600
(b)(3), (4) (b)(3), (4) (b)(3)(4)
SRNL-TR-2014-00209 Process Description for Processing of HTGR Pebble Fuel at SRS 30 October 2014
Official Use Only
condensate tank. The off gas from the condensate tank is then treated with a steam atomizing scrubber (SAS) with a cyclone separator to remove condensate and particulates. Note that a design option is to replace the steam atomized scrubber with a packed bed l. The gas stream then passes through a condenser and a high efficiency mist eliminator (HEME) filter to remove excess moisture and particulates. The gas stream is then vented via a steam jet with the off gas passing through a counter-current barometric condenser to remove the water. Given the lower flowrate for one digester versus two, the off-gas system equipment should be sized for about 1/2 the flow on the front and 1/3 the flow on the backend as designed for in DWPF. These estimates are approximate. See the simplified diagrams below (Figures 2.9 and 2.10) for anticipated flows assuming a 14 hour digestion cycle and including the off gas from two digesters. For comparative purposes, the flows for the DWPF melter off-gas system and the proposed digester off-gas system are shown. The flow rates are somewhat confusing since air is pulled into the systems to make-up for water vapor collapsing and to provide excess capacity to deal with surges. Figure 2.9 shows a simplified and abstracted view of the DWPF flows and the Figure 2.10 posits the reduced flows for the digester system.
Figure 2.9 DWPF Melter Off-gas System Balance
(b)(3), (4)
(b)(3)(4)
Process Description for SRNL-TR-2014-00209 Processing of HTGR Pebble Fuel at SRS October 2014 31
Official Use Only
Figure 2.10 Proposed Digester Off-gas System Balance
The proposed approach does not fully deal with carbon fines that could be carried out of the digester by escaping gas. In principle, the fines could be collected on a filter contained within a jumper as the off-gas solution circulates. The jumper could be removed from service when it becomes plugged. The jumper internals including the captured particulates could then be dried and the jumper disposed of as LLW. The problem with this solution is the large volume of waste (many such filter jumpers) and issues associated with disposal of graphite particulates as LLW. A better solution is to design the off-gas system to return these fines to the digester. Some engineering development is required to develop this optimal approach. Although a SAS (steam atomized scrubber) is shown for conceptual purposes, a better solution would be to employ a packed spray column to
scale down of their demonstration indicates a 1’ diameter foot column with 2
meters of bed height would be adequate to remove up to . Such a column could occupy about the same floor space as the SAS system with its cyclone.
2.2 Equipment Summary and Layout Figure 2.11 shows a simplified schematic of the above-mentioned processes. Where equipment is a downscaled version of an existing design, e.g., the SAS, a schematic shows a simplified view of the DWPF equipment. The various types of process materials are color coded. The equipment has been previously explained; hence, this section focuses on describing the layout of conceptual arrangement of the equipment.
(b)(3), (4)
(b)(3), (4)
(b)(3)(4)

SRNL-TR-2014-00209 Process Description for Processing of HTGR Pebble Fuel at SRS 32 October 2014
Official Use Only
Figure 2.11 Simplified view of Process
The arrangement of the equipment in the H-Canyon cells is conceptual at this point. The layout is discussed as equipment flows from South to North in the Hot Canyon. Figure 2.12 shows the layout for the bundle storage area, the maintenance area (using Swimming Pool), and the unloading area (assuming installation in the Hot Shop). In section 3, a bundle storage rack for storage of kernels cans will be installed. The Swimming Pool would he upgraded with a two-arm manipulator to allow maintenance of equipment. The can unloading station has equipment to open the cans and load the pebbles into a pebble batching device.

Process Description for SRNL-TR-2014-00209 Processing of HTGR Pebble Fuel at SRS October 2014 33
Official Use Only
Figure 2.12 Swimming Pool, Bundle Storage, and Hot Shop
The main process is installed in section 5 as shown in Figure 2.13. This requires relocation of an existing resin digestion vessel and installation of two digesters with associated transfer tanks, washer, and beginning of the off-gas system. The resin tank is relocated to section 5.1 via a new tank. The two digesters are located in sections 5.1 and 5.3, sharing a common salt turntable, fed from the salt transfer tanks associated with each system. Each digester system has its own pebble feeder, salt transfer tank, and kernel handling turntable. In section 5.4 the salt wash tank and the initial off-gas condensate tank is located. Ideally, the off-gas system will be located closer to the equipment, but because of space constraints some of the off-gas system had to be placed in the warm Canyon.

SRNL-TR-2014-00209 Process Description for Processing of HTGR Pebble Fuel at SRS 34 October 2014
Official Use Only
Figure 2.13 Layout of Hot Canyon Cell Section 5
Figure 2.14 shows a simplified elevation view (not to scale) with the kernel turntable under each digester and the salt transfer tank for each system located above the digester. When the salt is spent, it is drained into a salt can, on a salt turntable, and then loaded into the salt washer.
Figure 2.14 Elevation View of Hot Canyon Cell Section 5
The rest of the off-gas system is located in the warm Canyon as shown in Figure 2.15. Having to split the off-gas system due to space limitations resulted in additional tanks. The steam atomized scrubber is fed
OGCT1
SealPot

Process Description for SRNL-TR-2014-00209 Processing of HTGR Pebble Fuel at SRS October 2014 35
Official Use Only
by one tank, and the final tank supports the off-gas vent jet with its barometric condenser to remove excess water. A backups jet and consider are also located on this tank. The jet discharges to the Canyon vessel vent system. These tanks are shown larger than actually needed, so the equipment would fit is less space. However, it may be necessary to replace the SAS with a packed spray column (TBD). This system is different than that in DWPF since it uses a steam jet to create a vacuum rather than HEPA filtered exhaust system.
Figure 2.15 Layout of Off-gas System in Warm Canyon
The conceptual arrangement (Figure 2.16) for the two cementation stations needed in Options 2 and 2T will be similar to that shown on P-PEF-02684, requiring a 60’x85’ enclosed area. A similar space either above or beside this system will be required to house the feed and vent tanks with the required building exhaust system. The building is a simple pre-fabricated facility.
(b)(3)(4)
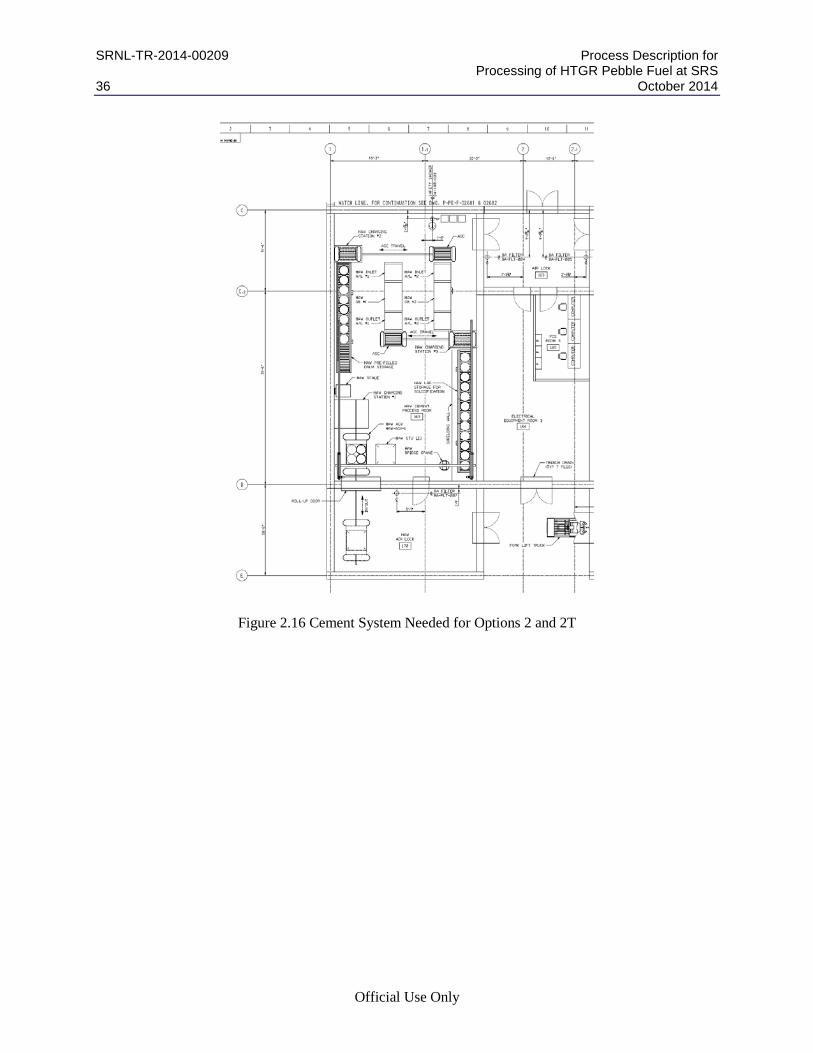
SRNL-TR-2014-00209 Process Description for Processing of HTGR Pebble Fuel at SRS 36 October 2014
Official Use Only
Figure 2.16 Cement System Needed for Options 2 and 2T

Process Description for SRNL-TR-2014-00209 Processing of HTGR Pebble Fuel at SRS October 2014 37
Official Use Only
3.0 L Area Option 3.1 Functional Description and Sizing Basis- L Area Figure 3.1 shows a break down of functions and sub-functions for the L Area option. The L Area Option was studied assuming melt and dilute, but could be modified for other options such as can-in-canister, etc. Time did not permit evaluation of all options, so the melt and dilute option was chosen as a credible case for bounding purposes. The melt and dilute option was once an approved NEPA disposition for aluminum clad used fuel, but this ruling was reversed in a 2013 Amended Record of Decision (ROD).
Figure 3.1 L Area Option-Functional Breakdown
A brief description of each major sub-function follows. Many of these sub-functions, especially those associated with pebble digestion, are very similar if not identical to those required for the H-Canyon options. The description of the applicable H-canyon sub-functions provides more detail than that provided here (see Section 2.1). The overall capacity goal of the L Area system is ½ that of H-Canyon, but given the space constraints and limited duplicate pieces of equipment, the throughput would likely not exceed 40% of the H-Area throughput.

SRNL-TR-2014-00209 Process Description for Processing of HTGR Pebble Fuel at SRS 38 October 2014
Official Use Only
Unload Cask: Unload Cask: The CASTOR cask will be brought into the Stack Area of Building 105-L and unloaded using the existing Stack Area crane. A new shielded dry transfer system (DTS) will be required with appropriate hoist adaptors for mating to the inner container. In the stack area the protective lid and outer cask lid are unbolted and set aside by the crane. After sampling for contamination, the inner shield lid is unbolted and set aside by the crane. The shielded DTS is positioned over and docked to the cask. Aided with a camera, the grapple on the DTS hoist is engaged with the inner fuel can and the can pulled into the shielded DTS. The DTS is equipped with a shielded bottom cover, which is engaged to capture the can. The top is installed on the DTS. The DTS bearing the fuel can will be lowered onto a special dolly and moved to the Purification wing where the pebble digestion and melt and dilute processes are located. The facility is sized to process up to 500 pebbles a day, i.e., about 1 cask containing 2,000 pebbles will be handled each week. Move Can: The dolly bearing the DTS is moved adjacent to the unloading cell transfer device. The can is rotated as required and mated with the cell transfer device. The can is then loaded into the cell, and docked into position in a receiving device, and the DTS with dolly returned for reuse. Once received in the unloading cell, the can is rotated into the vertical position. Lag storage for two 1,000 pebble cans or one 2,000 pebble can per week is assumed. For details of unique equipment employed in Germany for handling and opening the casks, see Handling Equipment for Unloading Castor THTR/AVR Casks, WTI/90/13. Assay Can: Each Assay Can will be assayed (confirmatory) using two perpendicular collimated LaBr3 detectors designed into the can staging rack. The purpose of the measurement is to ascertain the radiation spectrum and to compare it with that anticipated based on radiation burn-up calculations. This information will help assure that what is being processed is what was anticipated, to facilitate process control. It could serve as a leg of a multiple leg contingency strategy for nuclear safety control. Dock Can and Cut Off Can Top: The can will be moved by the cell crane and docked into position in a cradle with a cutting device. The top of the can will be removed using the cutting device. The severed lid is then removed using the cell crane and grapple and set aside for later packaging in preparation for disposal. Dump Pebbles: The can cutting device will be designed to invert the open can to empty the pebbles into a pebble hopper. The pebble hopper is sized for the maximum load of 2,000 pebbles from one large THTR can. Batch Pebbles: A batch size (500 pebbles) quantity of pebbles will be metered out of the pebble hopper into a portable pebble bucket. The pebble bucket will be moved to the digester system for charging to the digester. The pebble bucket collects 500 pebbles, which is the target daily throughput. Lag Storage: Lag storage is provided for staging up to four 1,000 pebble cans (full or empty) or two 2,000 pebble cans. Package Waste: Waste (i.e. empty fuel cans) and severed lids will be moved by the cell crane to the waste staging area and placed into a LLW container. When allowed, the shield door will be opened and the waste removed. Maintenance Station: A movable maintenance station, with a two-arm manipulator, is located within the cell and can be relocated to allow access to equipment or to maintain equipment.

Process Description for SRNL-TR-2014-00209 Processing of HTGR Pebble Fuel at SRS October 2014 39
Official Use Only
Digest Pebbles: Move Batch: The pebble bucket is moved to the digester and docked into position on the charging hopper using the cell crane. Charge Digester. The digester is charged with the entire batch of 500 pebbles, or alternatively the pebbles could be metered into the digester (TBD). The digester is essentially the same as that described for use in H-Canyon (see Section 2.1). Add Salt
With pebbles and salt, a nominal working volume of over 1.1
cubic meters is required, which means a vessel 2.5’ wide by 12’ tall should provide adequate room for the contents with vapor space above and a conical annular section in the lower portion of the vessel to collect the pebbles in a geometrically favorable geometry. There is no known design reason at this time that the vessel could not be larger in diameter and shorter if required by design considerations. Heat-up Digester and Digest Pebbles: The digester is heated to for the prescribed number of hours (7-14 hours, assume 14 hours). The system must have adequate heating and cooling provisions to complete a batch in 24 hours. Figure 3.2 shows how the composition of the salt changes as the reaction proceeds.d
d Bob Pierce, SRNL-STI-2013-00598.
(b)(3), (4)
(b)(3), (4)

SRNL-TR-2014-00209 Process Description for Processing of HTGR Pebble Fuel at SRS 40 October 2014
Official Use Only
Figure 3.2 Concentration versus Time in Digester (one pebble test)
of the salt is transferred to a salt transfer tank by vacuum through a filter. Any solids collected on the filter are drained back into the digester when the salt is recharged to the digester. The design goal is to leave less than 10 liters of salt with the kernels in the digester. Regenerate Salt and Drain Spent Salt: The salt will be regenerated with
This regeneration is done in either the salt transfer tank or the digester as required. If the salt cannot be reused, e.g., Cs buildup is too high; it is drained into a salt can designed for ease of salt dissolution. A horizontal, shuttle-based salt can storage array allows for storage of up to three salt cans. Due to the smaller volume tankage, the L Area system would require the capability to batch out the salt into multiple salt transfer devices. The viability of the L Area approach depends on a high salt reuse rate, since the salt handling capability is limiting. Drain Kernels: The kernels with some salt (e.g., less than 10 liters) that have collected in the bottom annular portion of the digester are drained into a can (called a K/S can) located in a housing on a turntable positioned under the digester. Prior to draining the kernels, the housing containing the can is raised to seal against the bottom of the digester. Once the can has cooled to the desired temperature (TBD), the can is lowered. The salt is held in place in the digester and drained though a freeze plug containing salt which is heated or cooled to seal or open. The assumed dimensions of the K/S can are 5” dia. x 3’ high. The K/S can in the L Area option would contain the kernels associated with 500 pebbles. Prepare Digester: Upon an acceptable material balance (discussed later), the digester cycle is started over.
(b)(3), (4)
(b)(3), (4)
(b)(3), (4)

Process Description for SRNL-TR-2014-00209 Processing of HTGR Pebble Fuel at SRS October 2014 41
Official Use Only
Separate Kernels: Seal K/S can: The turntable under the digester is rotated to position the K/S can in the sealing position, where a can-sealing device either lowered or moved horizontally into place. The K/S can bearing the kernels with a small amount of salt is constructed of aluminum which will dissolve in the alloying furnace. It is sealed with an aluminum lid using the MAGNEFORM® process to keep material from spilling during transport and to facilitate lifting by the crane. A dedicated station with fixed automation is located on the turntable for this function. Assay K/S Can: The turntable is again rotated and the can is moved under an active-coincidence-neutron counter, which is lowered into place. The counter conceptually is 1’ wider than the can on both sides. The assay device is well over double the height since a calibration source is located within an upper chamber, where it is lowered into position to provide a measured reference before each actual measurement. A removable shield plug (via fixed automation) separates the two chambers. When the measurement is complete, the assay device is raised back above the can. Move K/S Can: The sealed and assayed K/S can is then moved by the cell crane to the alloy station charge makeup station. There it is either placed in a lag storage position or directly inserted into the next furnace charge. Alloy Kernels: Prepare Charge: The furnace crucible will either be a reusable alloy or a graphite crucible. Graphite could be reprocessed in the digester if this is required. Reuse of graphite to the extent practical is planned. The charge step requires the addition of depleted uranium metal or LEU fuel to dilute the U-233 and U-235 content to less than 10% by weight (TBD). It requires the addition of aluminum or aluminum fuel to provide at least 4 mass units of aluminum per mass unit of uranium plus thorium. A higher ratio will be required for uranium-only or thorium-only fuels. It is anticipated that at least half the blend-down uranium and half the aluminum could be obtained through use of existing LEU or high-aluminum HEU fuel. Preliminary calculations indicate that use of existing fuels for this purpose would add 40 more canisters, but would eliminate a net 100 canisters from the final L Area dry storage needs. The DU needs could also be met through use of existing NU or DU scrap from around the DOE complex. It is assumed that any fuel used will be in a slug form and would not require any size reduction to fit into the crucible. These feeds are introduced into the cell via the same entry method as the pebble cans are introduced. The size of the ingot is designed to match the nominal batch size of elements from 500 average pebbles. To match this, the slugs would have to be approximately 4.2” in diameter and 47” or so inches tall. These dimensions are approximate. The material balance and projected canisters for this operation listed in Section 5.5 assume fresh aluminum and DU, since this calculation is an important reference to consider as the actual list of feeds is established. The basis for the aluminum addition ratio is based on a ternary diagram shown in Figure 3.3 (Bobeck 1956). Based on the referenced report (ISC-832) with 80 weight percent aluminum, mixtures of uranium and thorium ranging from 2.5% thorium and 17.5% uranium up to 12.5% thorium and 7.5% uranium would have a melting point of around 636 to 643 degrees C without adjustment for other elements. The average anticipated feed stream after adjusting for downblended uranium will be close to the latter of these concentrations. Although the solution would melt at these temperatures, the melt and dilute process, as developed in the late 90s, proposed operation at 850 degrees C “to provide sufficient super heat to adequately dissolve the uranium diluent and minimize volatilization of some fission products.” (Peacock 1999)

SRNL-TR-2014-00209 Process Description for Processing of HTGR Pebble Fuel at SRS 42 October 2014
Official Use Only
Figure 3.3 Al-Th-U Phase Diagram
More work is needed to characterize the oxide reduction operations, particularly with regard to any Cs/Sr. Earlier studies with reducing uranium oxide found that although aluminum would theoretically reduce the oxide, a small quantity (stated at 5% at 850 degrees C) of Ca will be needed to carry out the reaction in a practical time period (Peacock 1999). Charge Furnace: The furnace charge is located on a cross carriage that moves under the furnace. Lifts located at the charge makeup station, the furnace, or the charge breakout station provide for the ability to raise a charge in any of these locations, freeing the conveyor for movement. Once under the furnace, the charge is raised into place, where a plate under the charge is sealed (water cooled) for the duration of the furnace operation. Calcium and or magnesium metal in a pre-sealed aluminum can or as an integral part of a master aluminum alloy is also added to reduce the oxides. Although aluminum could reduce the oxide over time, calcium is added in small amounts to provide enough energy to enable the reduction in a reasonable period of time. Form Alloy: The charge is melted at up to 850 degrees C (TBD), although the eutectic is around 650 degrees C. The 850 degree C temperature was chosen since this was the temperature historically used at SRS for aluminum alloy processing. This operation forms the thorium-uranium-aluminum alloy, that when cooled takes the shape of the crucible. There should be adequate contraction to allow for easy removal of the resultant slug from the crucible. Any salt present should break down to sodium oxide liberating The oxides from the reduction operation should be suspended in the alloy since their densities are not much different than that of the alloy. There may be some slag, which will be recycled into the next batch. Breakout Slug: The resultant slug formed is sized to match existing aluminum alloy slugs, with its diameter fitting within an L-bundle (<5”). For process efficiency, the length of the slug will be 47” so that two rows of slugs can fit within a 100”deep SNF canister working design height. The crucible will be raised by a lift to mate with the dumper. The dumper would then rotate and dump the slug into a fixed position for the next operation. The length of the slug is sized to correspond with the nominal batch size to avoid splitting batches. Remove Slug: Fixed automation would move the slug from a fixed position in the breakout station and drop the slug down a chute, which passes through the pipe gallery, into a shielded can-out station on the other side of the pipe gallery. The slug would slide into a fixed position for the can-out operation.
(b)(3), (4)

Process Description for SRNL-TR-2014-00209 Processing of HTGR Pebble Fuel at SRS October 2014 43
Official Use Only
Can-out Slug: A bagless transfer device (possibly using friction stir welding- development required) is used to transfer the slug into a tight-fitting aluminum containment sleeve. The canned slug is separated from the stub and moved by fixed automation into a 14 well storage basket located in a shielded transfer device. Dry Storage: Load Basket: Once the storage basket is filled, the shield lid is placed on the shielded transfer device which is located on a dolly, and the dolly is then moved by a dumbwaiter to the main level. The dolly is then moved to the Stack Area. Load MCO: In the stack area, the overhead crane is used to unload the basket from the shielded transfer device and to load the basket into the Multi-Canister Overpack (MCO) canister. The MCO canister will be designed to hold 28 slugs (47”) tall in two layers. Each layer will have its own basket. The reason a shorter slug is not used is that slug size approximates the alloy resulting from a typical batch. Seal MCO: When the MCO canister is full it is sealed and leak tested. It is then moved via a dolly to a dry concrete storage overpack, where it is loaded into the overpack via the Stack Area crane. A mounting hardware assembly is located above the overpack during loading to facilitate loading the overpack and mated up with the shielded transfer canister. Dry Store MCO: Up to 5 MCO canisters, each 2’ dia. x10’ high, will be stored within each concrete overpack. A pad upon which the overpacks rest is large enough for 81 canisters without using existing fuel for blenddown or 120 canisters if blending with existing high aluminum LEU and HEU fuels. Treat Salt: Dissolve Salt: Salt is dissolved in a salt washer. The washer has the ability to pump a spray down on the spent salt cans and agitate solution to facilitate dissolution of the salt. Dissolution is with slightly acidified water or scrubber solution, with additional acid metered in to ensure controlled dissolution of any sodium carbonate solids, releasing To minimize waste, excessive acid levels are avoided. The spent salt cans are reused after the salt is removed. A six thousand liter vessel should be adequate for the salt from a 500 pebble digester. Since the salt is regenerated and reused, the salt washing process would be operated intermittently. This option assumes sufficient reuse of salt to limit the average volume of solution to less than ~4,000 liters a week to avoid having more than one LR-56 that requires handling per week (see Transfer to LR-56 below). It is assumed that some engineering provision (TBD) would allow partitioning of the salt into small enough portions to feed the washer in order to avoid bottlenecks in the salt treatment process. Treat Salt: The salt treatment process is patterned after that demonstrated in the proven Actinide Removal Process (ARP). The process was modified based on consultation with David Hobbs to address the unique issues associated with the HTGR fuel waste. The salt solution and any excess scrubber solution, which should be slightly acidic from either the scrubber or the salt dissolution, is neutralized and treated with 0.4 g/l monosodium titanate (MST), filtered to removed loaded MST solids, and the processed through a column loaded with 60 wt.% crystalline silicotitanate (CST) on a zirconium-based substrate (Hobbs 2010 and Taylor-Pashow 2014). The use of CST in a column is necessary to load cesium, which is which is not absorbed well on MST, in a concentrated form (assuming 3.7 mg Cs/g CST loading).e Actual choice and selection of titanates would require further study, but the use of CST and MST are assumed pending this e Telephone call with David Hobbs 9/18/2014 to define CST loading assumptions.
(b)(3), (4)
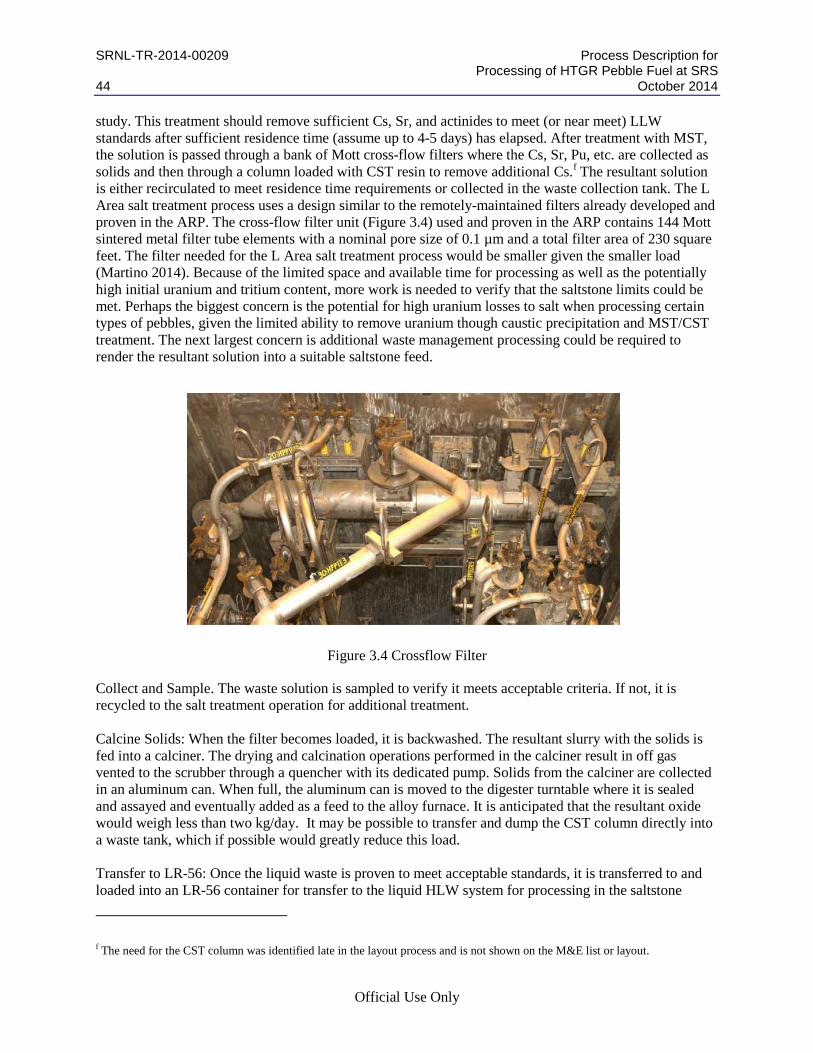
SRNL-TR-2014-00209 Process Description for Processing of HTGR Pebble Fuel at SRS 44 October 2014
Official Use Only
study. This treatment should remove sufficient Cs, Sr, and actinides to meet (or near meet) LLW standards after sufficient residence time (assume up to 4-5 days) has elapsed. After treatment with MST, the solution is passed through a bank of Mott cross-flow filters where the Cs, Sr, Pu, etc. are collected as solids and then through a column loaded with CST resin to remove additional Cs.f The resultant solution is either recirculated to meet residence time requirements or collected in the waste collection tank. The L Area salt treatment process uses a design similar to the remotely-maintained filters already developed and proven in the ARP. The cross-flow filter unit (Figure 3.4) used and proven in the ARP contains 144 Mott sintered metal filter tube elements with a nominal pore size of 0.1 µm and a total filter area of 230 square feet. The filter needed for the L Area salt treatment process would be smaller given the smaller load (Martino 2014). Because of the limited space and available time for processing as well as the potentially high initial uranium and tritium content, more work is needed to verify that the saltstone limits could be met. Perhaps the biggest concern is the potential for high uranium losses to salt when processing certain types of pebbles, given the limited ability to remove uranium though caustic precipitation and MST/CST treatment. The next largest concern is additional waste management processing could be required to render the resultant solution into a suitable saltstone feed.
Figure 3.4 Crossflow Filter
Collect and Sample. The waste solution is sampled to verify it meets acceptable criteria. If not, it is recycled to the salt treatment operation for additional treatment. Calcine Solids: When the filter becomes loaded, it is backwashed. The resultant slurry with the solids is fed into a calciner. The drying and calcination operations performed in the calciner result in off gas vented to the scrubber through a quencher with its dedicated pump. Solids from the calciner are collected in an aluminum can. When full, the aluminum can is moved to the digester turntable where it is sealed and assayed and eventually added as a feed to the alloy furnace. It is anticipated that the resultant oxide would weigh less than two kg/day. It may be possible to transfer and dump the CST column directly into a waste tank, which if possible would greatly reduce this load. Transfer to LR-56: Once the liquid waste is proven to meet acceptable standards, it is transferred to and loaded into an LR-56 container for transfer to the liquid HLW system for processing in the saltstone
f The need for the CST column was identified late in the layout process and is not shown on the M&E list or layout.

Process Description for SRNL-TR-2014-00209 Processing of HTGR Pebble Fuel at SRS October 2014 45
Official Use Only
process. A new receiving station would be required to transfer the contents of the LR-56 into the feed to the saltstone process. Handle Off Gas: Handle Off Gas from Digester: The off-gas system is the same in concept as that described for Option 1. The overall scrubber system is designed to attain a DF of 20,000 on any particulate, remove salt and cesium and graphite carryover, and remove up to 67%
Any particles leaving the furnace are maintained at an adequate velocity by line sizing to minimize particulate collection. The gas stream with particulates is then passed through a quencher, which discharges to a condensate tank. The off gas from the condensate tank is then treated with a steam atomizing scrubber with a cyclone separator to remove particulates. Note that a design option is to replace the steam atomized scrubber with a packed bed (TBD if needed ). The gas stream then passes through a condenser and a HEME filter to remove excess moisture and particulates. The gas stream is then heated and passed through a HEPA filter and exhauster located outside the cell on the lower level. See description for Option 1 for more details. See discussion provided for the H-Area options for the basis for the scaling assumptions for the L Area off-gas system. Given the lower flowrate for one digester versus two, the off-gas system equipment should be sized for about 1/3 the flow on the front and ¼ the flow on the backend as designed for in DWPF. These estimates are approximate. Although one digestion would generate ½ the off gas of two, additional off gas capacity would be needed for the additional options such as alloying. Handle Off Gas from Alloy Furnace: Any cesium liberated as off gas would be trapped on either the primary or secondary zeolite absorber beds. When an absorber bed is spent, it is dumped into a batching hopper and incrementally added into subsequent alloy batches so as to entrain the Cs into the alloy. Note: this process requires demonstration. The silicon present in the zeolite would slightly raise the melting point of the alloy, but the resultant alloy should melt at less than 850 degrees C. The off gas passing through the absorber beds is pulled by an air jet into the scrubber via a small quencher device. The quencher requires a dedicated pump to recirculate scrubber solution to drive the quencher. The resultant off gas follows the same path as that of the digester off gas. The gas stream flow for the alloy furnace is small relative to the off gas from the digester. A zeolite 4A adsorption bed (two in series) was used in the earlier melt and dilute demo to capture volatile cesium, about 22% of cesium was captured on the bed (Duncan 2000). Of this 22%, 16% was found on the bed and 8% was found plated out in the piping. The off-gas system used in the pilot demonstration is shown in Figure 3.5. The assumed loading of zeolite is 4.43 weight percent cesium and 1.68 weight percent Sr (Kim 2003). For the purposes of this study, it is assumed that the zeolite would be recycled back into subsequent melts, resulting in the addition of a few hundred grams of Cs-laden zeolite per day being added to about 60 or so kg of Al, U, and Th being processed daily. Since the Zeolite is essentially mostly Si, Al, and Na, it can be incorporated into the melt. The sodium oxide would not be reduced by the calcium and would remain as an oxide in the melt. The silica content of the kernels is bounded by the previous melt-and-dilute studies, which addressed silicide fuel forms. Of course some of the Cs would volatilize in subsequent runs, but the net effect would be incorporation of the Cs into the melt while increasing alloy mass by only a few tenths of a percent by weight. Opportunity: Further design should consider eliminating the absorber and use the scrubber to remove the cesium as it does for the digester.
(b)(3)(4)
(b)(3)(4)

SRNL-TR-2014-00209 Process Description for Processing of HTGR Pebble Fuel at SRS 46 October 2014
Official Use Only
Figure 3.5 Melt and Dilute Demo Schematic
3.2 Equipment Summary and Layout Figure 3.6 shows a simplified schematic of the above-mentioned processes. Where equipment is a downscaled version of an existing equipment design, e.g., the SAS, a schematic shows a simplified view of the equipment. The various types of process materials are color coded. The equipment has been explained above.

Process Description for SRNL-TR-2014-00209 Processing of HTGR Pebble Fuel at SRS October 2014 47
Official Use Only
Figure 3.6 Simplified View of Process
The cask unloading would take place using the existing, large Stack Area crane. The cask, located on a low-boy platform is moved into the Stack Area and located under the Stack Area crane. The protective lid and the outer lid is removed and checked for contamination. A mating plate is located above the cask and a new shielded transfer system (STS) is placed above the cask and docked to the mating plate. The can is raised from the cask and into the STS. The STS has a closing shutter door to capture the can. Figure 3.7 shows a pictorial of a similar dry transfer system (DTS) for conceptual understanding. The shielded transfer system is located on a dolly in the horizontal position and moved to the new process cell, located in the Purification wing.

SRNL-TR-2014-00209 Process Description for Processing of HTGR Pebble Fuel at SRS 48 October 2014
Official Use Only
Figure 3.7 Dry Transfer System
This process equipment will be located in the L Area Purification hot-cell facility. Figure 3.8 depicts an elevation view of the proposed layout in the Purification Cell. The facility now has an overhead crane serving two cells. The crane capacity should be adequate. An elevation view of the proposed modifications and equipment is shown in the following figure. The existing hot-cell would require significant modification. These modifications include removing the existing floor and piping in the existing two cells, creating a cell space equivalent in height to the existing Canyon cells. In addition, two other cells will be created by installing new walls and removing a section of the floor. This design change would require building a new truckwell, while leaving an area for waste staging and removal behind a shield wall when the new shield door is opened. The result is to create four cells: an unloading cell, a digester and salt wash cell, an off-gas and solution handling cell, and an alloying furnace cell. As previously discussed, cans are removed from casks in the Stack Area (in another part of the 105-L building) and moved for introduction into the new unloading cell through use of a shielded transfer system with dolly. Once cans are in the cell, the cans are opened and the pebbles batched in the unloading (can opening) cell. The pebbles will be processed through the digester, with the resultant salt being treated in the off-gas and solution handling cell. The resultant kernels from digestion are alloyed in the alloy furnace, and canned out via a can-out capability located in the adjacent lower level of the building. Removal of waste and failed equipment is accomplished by staging and removing the waste in the waste staging area.

Process Description for SRNL-TR-2014-00209 Processing of HTGR Pebble Fuel at SRS October 2014 49
Official Use Only
Figure 3.8 L Area Cell Layout- Elevation
Figures 3.9 and 3.10 shows a simplified plan view of the upper and lower levels of the cell. The control room, located on the second level, provides a means to view the cells through two glass-shield windows. The pipe chase on the lower level will be converted to dual use: serving as a pipe chase connecting the cells, and providing a means to exhaust the air from the bottom of each cell.
Alloy FurnaceSystem
Offgasand
Solution Handling
Digester and Salt Dissolver
Waste Staging
Can OpeningNew
Truckwell
Shield Door
TransferCan
Elevation +13
Elevation +29
Elevation -13’ 10”

SRNL-TR-2014-00209 Process Description for Processing of HTGR Pebble Fuel at SRS 50 October 2014
Official Use Only
Figure 3.9 L Area Cell Layout - Upper Level Plan View
Figure 3.10 L Area Cell Layout - Lower Level Plan View
Figure 3.11 shows a more-detailed layout of the equipment in the cells. The equipment may have to be downsized to fit since there is little free room left after fitting in equipment to support a 500 pebble per day capability.
Control Room
Alloy Furnace System
Offgasand
Solution Handling
Digester and Salt Dissolver
Waste Laydown
CanOpening
Slug Canout
Alloy FurnaceSystem
Offgasand
Solution Handling
Digester and Salt Dissolver
H&V Fans and
Filter
Dumb-waiter
Air Plenum and Pipe Chase
Lag
Note: Close for shielding. Leave air exhaustand seal other penetrations. Typical
Note: Slug Shute

Process Description for SRNL-TR-2014-00209 Processing of HTGR Pebble Fuel at SRS October 2014 51
Official Use Only
Figure 3.11 L Area Cell Equipment Layout
Figure 3.12 provides a simplified view of the cells, with cell covers installed with an above-cell maintenance capability. Cold feed will be located outside.
11’6” 16’3” 11’9” 7’5”
Filter
CalcinerCan
Receiver
CanStorage
Salt Washer
Salt Treatment
SAS
OffgasCondensate
Collection tank (OGCT)
Collection Tank
Waste Hold
Kernel & U Can Storage
Charge Preparation
Absorber
Charge Breakout
Alloy Load-out
Alloy Furnace
Can-Out Station
Carriage
Lift
QuencherCondenser
HEME
Heater
Salt Lag
DigesterTurntable
Salt Hold
KernelCans
Lid CuttingSta ion
Pebble DumpingStation
Lid LaydownStation
PebbleBucket
CanUnloading
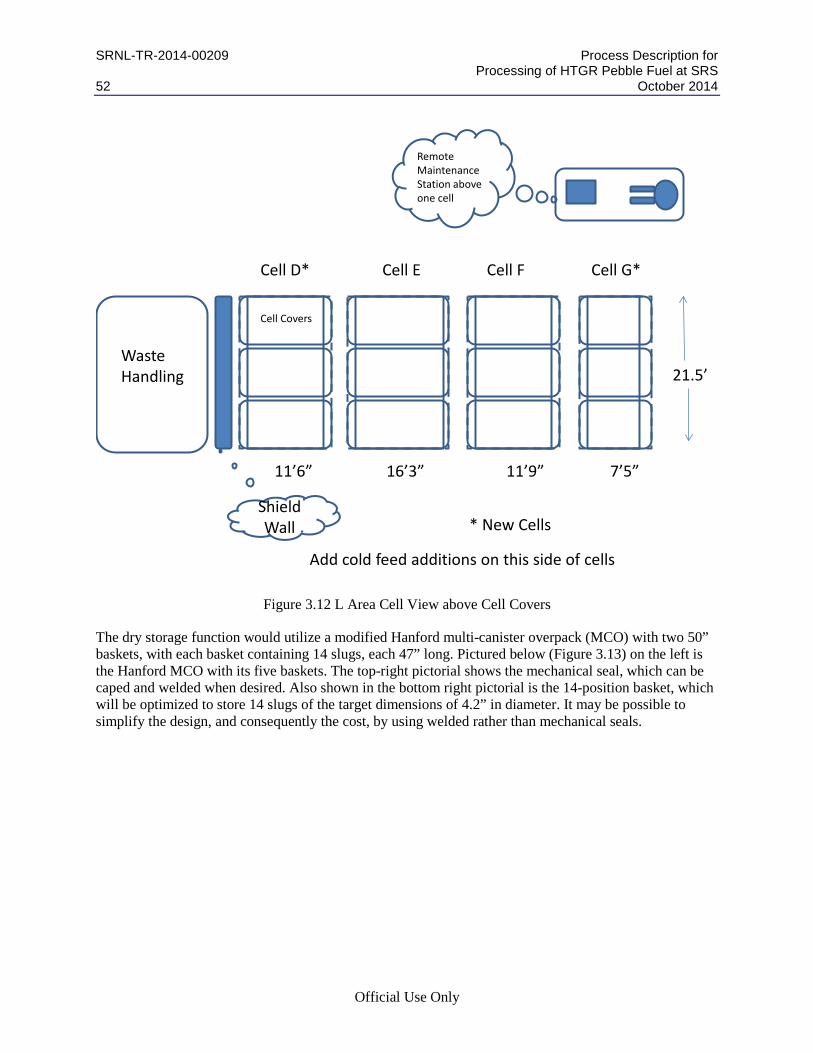
SRNL-TR-2014-00209 Process Description for Processing of HTGR Pebble Fuel at SRS 52 October 2014
Official Use Only
Figure 3.12 L Area Cell View above Cell Covers
The dry storage function would utilize a modified Hanford multi-canister overpack (MCO) with two 50” baskets, with each basket containing 14 slugs, each 47” long. Pictured below (Figure 3.13) on the left is the Hanford MCO with its five baskets. The top-right pictorial shows the mechanical seal, which can be caped and welded when desired. Also shown in the bottom right pictorial is the 14-position basket, which will be optimized to store 14 slugs of the target dimensions of 4.2” in diameter. It may be possible to simplify the design, and consequently the cost, by using welded rather than mechanical seals.
11’6” 16’3” 11’9” 7’5”
Cell Covers
Shield Wall
Waste Handling 21.5’
Cell E Cell F Cell G*Cell D*
* New Cells
Remote Maintenance Station above one cell
Add cold feed additions on this side of cells

Process Description for SRNL-TR-2014-00209 Processing of HTGR Pebble Fuel at SRS October 2014 53
Official Use Only
Figure 3.13 MCO Dry Storage Canister
The MCO will be loaded with two baskets using a shielded basket transfer device in reverse of how the can was originally removed from the cask. The full MCO will be loaded into one of 5 positions within a dry storage overpack, located on a pad. In Figure 3.14, shown below (left) is an MCO within a shielded transfer system docked on an adapter. Shown to the right is the concrete overpack (bottom) with a pictorial (above) showing an adaptor plate used to mount the adaptor and allow transfer into the MCO into the overpack. For more details see the 2012 Dry Storage Study report (Moore 2012, McConnell 2012).
4.875"
1/16"
3/8" Plate
22.9"
Drain Tube

SRNL-TR-2014-00209 Process Description for Processing of HTGR Pebble Fuel at SRS 54 October 2014
Official Use Only
Figure 3.14 Dry Storage Overpacks
H&V system upgrades: The most significant support system upgrade will be to add a sand filter, fans, and stack to exhaust the process cell. It is estimated, based on 4 air changes per hour in the cell and 2 air changes per hour in the rooms that the required ventilation load for the new cell area will be about 20,000 scfm. Based on the design of the Building 235-F sand filter, built in the 80s, the required sand filter and exhaust system would look something like the 235-F sand filter. Other significant scope items include the following:
• New truck-unloading station • Shielded truck bay door • LR-56 loading station in new truckwell • LR-56 unloading station into Tank 50 with a 15’x50’ truckwell • Cold feed building and tanks per the M&E list • D&D costs • Concrete and building modifications, etc. • Sump liners and cell covers • Install new shield windows • Install shield roll-away door
Because of the preliminary nature of the design, a parametric method was used to estimate the extent of these upgrades. Substantial upgrades to the L Area services will be required to support the new process. See final section of this report for details.

Process Description for SRNL-TR-2014-00209 Processing of HTGR Pebble Fuel at SRS October 2014 55
Official Use Only
4.0 Process Equipment Material and Equipment (M&E) Lists 4.1 Approach The following tables provide a listing of the major pieces of equipment. The equipment list for the off-gas system was taken from a scaled down version of the Defense Waste Processing Facility (DWPF) off-gas equipment. The rest of the systems were approximated based on the conceptual equipment for each system as previously discussed.
4.2 M&E Lists Tables 4.1 and 4.2 provide a brief description with approximate size and number of vessels for the H Canyon Option 1 layout. For each piece of equipment, the approximate outer dimensions, outer surface area, and number of pieces is provided. Table 4.3 provides a brief description with approximate size and number of vessels for the additional equipment needed for the H Canyon Option 2 layout. For each piece of equipment, the approximate outer dimensions, outer surface area, and number of pieces is provided. Options 2 and 2T require the equipment from Tables 4.1, 4.2 and 4.3. Tables 4.4, 4.5 and 4.6 provide a brief description with approximate size and number of vessels for the L Area Option 6 layout. For each piece of equipment, the approximate outer dimensions, outer surface area, and number of pieces is provided. Table 4.7 provides a summary of the approximate instrument count based on a scaling approximation from the DWPF off-gas instrument list. The estimates are approximate at best. The list does not include dry storage instruments, which are dealt with as packages in the M&E list.
SRNL-TR-2014-00209 Process Description for Processing of HTGR Pebble Fuel at SRS 56 October 2014
Official Use Only
Table 4.1 H Canyon M&E List (Part 1)
(b)(3), (4)

Process Description for SRNL-TR-2014-00209 Processing of HTGR Pebble Fuel at SRS October 2014 57
Official Use Only
Table 4.2 H Canyon M&E List (Part 2)
(b)(3), (4)

SRNL-TR-2014-00209 Process Description for Processing of HTGR Pebble Fuel at SRS 58 October 2014
Official Use Only
Table 4.3 H Canyon Option 2 or 2T Additional M&E List
(b)(3), (4)

Process Description for SRNL-TR-2014-00209 Processing of HTGR Pebble Fuel at SRS October 2014 59
Official Use Only
Table 4.4 L Area Option 6 M&E List (Part 1)
(b)(3), (4)

SRNL-TR-2014-00209 Process Description for Processing of HTGR Pebble Fuel at SRS 60 October 2014
Official Use Only
Table 4.5 L Area Option 6 M&E List (Part 2)
(b)(3), (4)

Process Description for SRNL-TR-2014-00209 Processing of HTGR Pebble Fuel at SRS October 2014 61
Official Use Only
Table 4.6 L Area Option 6 M&E List (Part 3)
(b)(3), (4)

SRNL-TR-2014-00209 Process Description for Processing of HTGR Pebble Fuel at SRS 62 October 2014
Official Use Only
Table 4.7 Approximate Instrument List
5.0 Material Balances 5.1 Material Balance Assumptions The following assumptions were made to complete a high level material balance for the various options being considered.
• The balances show the overall totals for processing all 920,000 pebbles. To convert the balance to a daily throughput divide by 920, assuming the target throughput of 1,000 pebbles a day. For hourly estimates, assume the process is batch and takes place over 14 hours.
• The balance only shows the streams as a snapshot, not carrying all the ins and outs to arrive at the estimate for that point in the flowsheet.
• The salt estimates were scaled from a draft material balance of the digestion portion of the process from Bob Pierce.g The splits into salt and kernel streams were derived from SRNL-STI-2014-00266 and other documents, with assistance from Pierce’s spreadsheet notes.
• Assume the salt for off gas losses and regeneration.
• To simplify the balance the salt content is carried . • Assume • an average of 2.25 grams of SiC for TRISO fuel and that 20% of the THTR+AVR pebbles or
67% of the AVR pebbles would require TRISO treatment. TRISO fuel can have up to 3 grams SiC per pebble.
• Assume for TRISO fuel. • Assume off-gas scrubbing removes using solution to
ensure removal efficiency. Removal efficiency could be as high as 67% if required. • . • The salt reuse ratio and acid regeneration efficiency were set up as variables. The baseline
flowsheet assumes 10:1 salt reuse and . It is highly likely that the
g R. A. Pierce, Digestion of Irradiated HTGR Fuel Kernels, SRNL-STI-2003-00266, June 2013. R. A. Pierce, Digestion of
Graphite Based Materials, SRNL-STI.2013-00392, July 2013.R. A. Pierce, Digestion of Components in HTGR Fuel, SRNL-STI-2012-00748, December 2012.
(b)(3), (4)
(b)(3), (4)(b)(3), (4) (b)(3), (4)
(b)(3), (4)
(b)(3)(4)
(b)(3)(4)

Process Description for SRNL-TR-2014-00209 Processing of HTGR Pebble Fuel at SRS October 2014 63
Official Use Only
regeneration efficiency would be much higher, but data were not available for this report, so the bounding value of 70% is based on the only available data from a similar operation.
• The balance shows the overall average values for the sum of the AVR and THTR feed categories. Mass values are in kilograms.
• The balances assume the viability of a salt-kernel separation technology using gravity settling and decanting of the salt. An allowance of 20 kg of salt is assumed to remain with the kernels.
• The volume of salt solution is based on the salt content at further limited by solution volume considerations. It is assumed this could be concentrated if required in H-Area options using the LAW evaporator.
• The dissolver solution assumes 12 M HNO3 and 0.1M KF with enough ANN added after dissolution to complex the fluoride. Assume 3.8 grams per liter for uranium.
• Assume thorium dilution to 0.05M for processed waste plus 18 flushes. Or, do not exceed 4.5 M NaNO3.
• Assume 70% of the aluminum partitions to salt and 30% partitions to sludge. • The uranium is assumed to be poisoned before disposal by the addition of 27 mass units of Mn
per FGE. • The salt and kernel streams are shown separately but could be combined to some degree as
allowed by the balance of salt and acid. • The saltstone volume was estimated by simply multiplying the gallons to the waste tanks by 2.24.
This factor was derived from waste generation reports. In reality, it would depend on the salt content and a number of other factors.
• The number of DWPF canisters is a hypothetical value based strictly on the mass added to the sludge without consideration for the fissile limits or specific batching recipes that might have to add surrogate sludge anyway. The math assumes 500 kg of oxide allowed per canister.
• The amount of Ferrous Sulfamate is based on 3 times the Pu moles. (Per discussion with R. Eubanks)
• Assume use of WSB cementation flowsheet. Assume 25 liters volume per kg of uranium. Assume volume doubles for Option 2T.
• Assume 3 kg for tall foodpack cans. This should bound the weight, and not limit design in any way. Actual weight should be much less.
• Assume 4 mass units aluminum per mass unit of thorium plus uranium for melt and dilute. Assume slugs sized to 4.2”D x 47” tall to minimize impacts on process efficiency. Assume Cs/Sr stays with slug, except for 22% Cs captured by zeolite. Assume return of cesium laced zeolite to subsequent alloys.
• Assume DF of 1E4 for plutonium and americium in solvent extraction. • Assume 400 g/liter DU available with 0.3% U-235 for blend down in options 2 and 2T. • Assume 1.1 kg of FGE per CASTOR cask to not preclude offsite shipment. Further work is
needed to verify suitability of this limit for disposal either on or off-site. • Assume safeguards termination where required upon meeting 10% U-233+U235. • See write-up for other option specific details and assumptions. • Ignore Fe, Ni, Cr from corrosion. • Ignore other non-radioactive constituents in pebbles. More study needed to define these elements
since they are not all computed in radionuclide estimates based on decay. • For Options 2 and 2T, the uranium in the salt waste (about 12%) is carried with the LLW stream.
More study is needed on the economic tradeoff of separating out this small amount of uranium and the tradeoff may be dependent upon the salt-reuse ratio. For bounding purposes, the material balance assumed ¼ of the solution is selectively processed, and that the solution could be chosen
(b)(3), (4)

SRNL-TR-2014-00209 Process Description for Processing of HTGR Pebble Fuel at SRS 64 October 2014
Official Use Only
to re-direct the maximum amount of uranium for the least volume of solution. It is likely that the uranium losses would simply be disposed as HLW. If so, the DWPF canisters would go up, but the HLW volume would go down.
• For CST and MST treatment for Option 6, assume 0.4 g/l MST and assume use of CST loaded at 60 weight % in a zirconia based matrix in a polishing column located after filtration removal of loaded-MST solids. Assuming cesium loading of CST to 3.7 mg/g of CST. MST concentration would increase with salt recycle to account for higher levels of strontium and actinides. A residence time of at least 48 hours is assumed required. Although inclusion of CST into melt is assumed in material balance, an alternative approach would be to dispose of the spent CST resin directly to a waste tank. More study of the feasibility and practicality of this approach is warranted.
5.2 Option 1 Balances The following pictorial shows the process flow for Option 1 with the key material balance points indicated by numbered stars.
Option 1 material balances include balances showing the impact of no salt reuse, 10:1 salt reuse (baseline), and 40:1 salt reuse, as well as showing the impact of higher acid efficiency. The general pattern is to provide the balances for the non-radioactive materials, followed by balances showing radionuclides in kilograms and curies. All data are for the entire program (AVR+THTR) fuel.

Process Description for SRNL-TR-2014-00209 Processing of HTGR Pebble Fuel at SRS October 2014 65
Official Use Only
Figure 5.1 Option 1 Process Flow
(b)(3), (4)

SRNL-TR-2014-00209 Process Description for Processing of HTGR Pebble Fuel at SRS 66 October 2014
Official Use Only
Table 5.1 Option 1 Material Balance – 10:1 Recycle- Baseline
(b)(3), (4)

Process Description for SRNL-TR-2014-00209 Processing of HTGR Pebble Fuel at SRS October 2014 67
Official Use Only
Table 5.2 Option 1 Material Balance –No Recycle
(b)(3), (4)

SRNL-TR-2014-00209 Process Description for Processing of HTGR Pebble Fuel at SRS 68 October 2014
Official Use Only
Table 5.3 Option 1 Material Balance –40:1 Recycle
(b)(3), (4)

Process Description for SRNL-TR-2014-00209 Processing of HTGR Pebble Fuel at SRS October 2014 69
Official Use Only
Table 5.4 Option 1 Material Balance –10:1 Reuse with Minimal (5%) Acid Loss
(b)(3), (4)
SRNL-TR-2014-00209 Process Description for Processing of HTGR Pebble Fuel at SRS 70 October 2014
Official Use Only
Table 5.5 Option 1 Material Balance –Radionuclide Mass by Stream
(b)(3), (4)

Process Description for SRNL-TR-2014-00209 Processing of HTGR Pebble Fuel at SRS October 2014 71
Official Use Only
Table 5.6 Option 1 Material Balance –Radionuclide Curie Content by Stream
(b)(3), (4)

SRNL-TR-2014-00209 Process Description for Processing of HTGR Pebble Fuel at SRS 72 September 2014
Official Use Only
5.3 Option 2 Balances The following pictorial shows the process flow for Option 2 with the key material balance points indicated by numbered stars.

Process Description for SRNL-TR-2014-00209 Processing of HTGR Pebble Fuel at SRS October 2014 73
Official Use Only
Figure 5.2 Option 2 Process Flow
(b)(3), (4)

SRNL-TR-2014-00209 Process Description for Processing of HTGR Pebble Fuel at SRS 74 October 2014
Official Use Only
Table 5.7 Option 2 Material Balance – 10:1 Recycle- Baseline
(b)(3), (4)
Process Description for SRNL-TR-2014-00209 Processing of HTGR Pebble Fuel at SRS October 2014 75
Official Use Only
Table 5.8 Option 2 Material Balance –Radionuclide Mass by Stream
(b)(3), (4)

SRNL-TR-2014-00209 Process Description for Processing of HTGR Pebble Fuel at SRS 76 October 2014
Official Use Only
Table 5.9 Option 2 Material Balance –Radionuclide Curie Content by Stream
(b)(3), (4)

Process Description for SRNL-TR-2014-00209 Processing of HTGR Pebble Fuel at SRS October 2014 77
Official Use Only
5.4 Option 2T Balances The following pictorial shows the process flow for Option 2T with the key material balance points indicated by numbered stars.

SRNL-TR-2014-00209 Process Description for Processing of HTGR Pebble Fuel at SRS 78 October 2014
Official Use Only
Figure 5.3 Option 2T Process Flow
(b)(3), (4)

Process Description for SRNL-TR-2014-00209 Processing of HTGR Pebble Fuel at SRS October 2014 79
Official Use Only
Table 5 10 Option 2T Material Balance – 10:1 Recycle- Baseline
(b)(3), (4)

SRNL-TR-2014-00209 Process Description for Processing of HTGR Pebble Fuel at SRS 80 October 2014
Official Use Only
Table 5.11 Option 2T Material Balance –Radionuclide Mass by Stream
(b)(3), (4)

Process Description for SRNL-TR-2014-00209 Processing of HTGR Pebble Fuel at SRS October 2014 81
Official Use Only
Table 5.12 Option 2T Material Balance –Radionuclide Curie Content by Stream
(b)(3), (4)

SRNL-TR-2014-00209 Process Description for Processing of HTGR Pebble Fuel at SRS 82 October 2014
Official Use Only
5.5 Option 6 Balances The following pictorial shows the process flow for Option 6 with the key material balance points indicated by numbered stars. The variation named Option 6.1 because Option 6 in the study.
Salt cleanup values are placeholders and assume a DF (decontamination factor) of 11 for Cs, 20 for Sr, 50 for U, 20 for Np, and100 for Pu, Am, and Cm. Work is needed to establish the required DF as well as to verify the DF can be achieved. The DF for uranium of 50 is calculated for a 10:1 salt reuse assuming a 35 DF from caustic precipitation (given that the concentration is about 35 times the solubility of uranium in 1-2 M caustic solution) and a DF of 1.5 or more from MST/CST treatment. Although the DFs for actinides can be over 1,000 by caustic precipitation, due to low concentrations, the caustic precipitation is limited. These DF estimates were derived from SRNL-TR-2014-00204h with allowances for caustic precipitation DFs based on concentration.
The balances assume use of DU at 0.3% U-235 and Al for blending. A valuable option, not shown, would be to use existing, high-aluminum aluminum-clad fuel to blend with. The variation would result in more canisters for the HTGR fuel, but could save up to 100 canisters that would eventually be required for disposal of existing L-Basin fuels.
Table 5:13 shows the baseline 10:1 salt reuse material balance. Table 5.14 shows an ideal case assuming as much as 40:1 salt reuse and minimal acid losses. Such a case would make L Area more feasible. Tables 5.15 and 5.16 show the balance by radionuclide in kilograms and curies. Table 5.17 shows salient Saltstone acceptance limits. As the salt reuse factor goes up, it become increasingly harder to meet these limits. At 10:1 salt reuse, the limits are met with the exception of U-235, where more work is needed to establish a better measure of uranium losses to salt and a possibly improved DF through caustic precipitation and MST/CST treatment.
h K.M.L Taylor-Pashow and D. T. Hobbs, “Demonstration of Fuel and Fission product recovery from HTGR Reactor Fuel
Processing Salt,” SRNL-TR-2014-00204, September 2014.
Process Description for SRNL-TR-2014-00209 Processing of HTGR Pebble Fuel at SRS October 2014 83
Official Use Only
Figure 5.4 Option 6
(b)(3), (4)

SRNL-TR-2014-00209 Process Description for Processing of HTGR Pebble Fuel at SRS 84 October 2014
Official Use Only
Table 5.13 Option 6 Material Balance – 10:1 Recycle- Baseline
(b)(3), (4)

Process Description for SRNL-TR-2014-00209 Processing of HTGR Pebble Fuel at SRS October 2014 85
Official Use Only
Table 5.14 Option 6 Material Balance – 40:1 Reuse and Minimal Acid (5%) acid Loss
(b)(3), (4)

SRNL-TR-2014-00209 Process Description for Processing of HTGR Pebble Fuel at SRS 86 October 2014
Official Use Only
Table 5.15 Option 6 Material Balance –Radionuclide Mass by Stream
(b)(3), (4)

Process Description for SRNL-TR-2014-00209 Processing of HTGR Pebble Fuel at SRS October 2014 87
Official Use Only
Table 5.16 Option 6 Material Balance –Radionuclide Curie Content by Stream
(b)(3), (4)
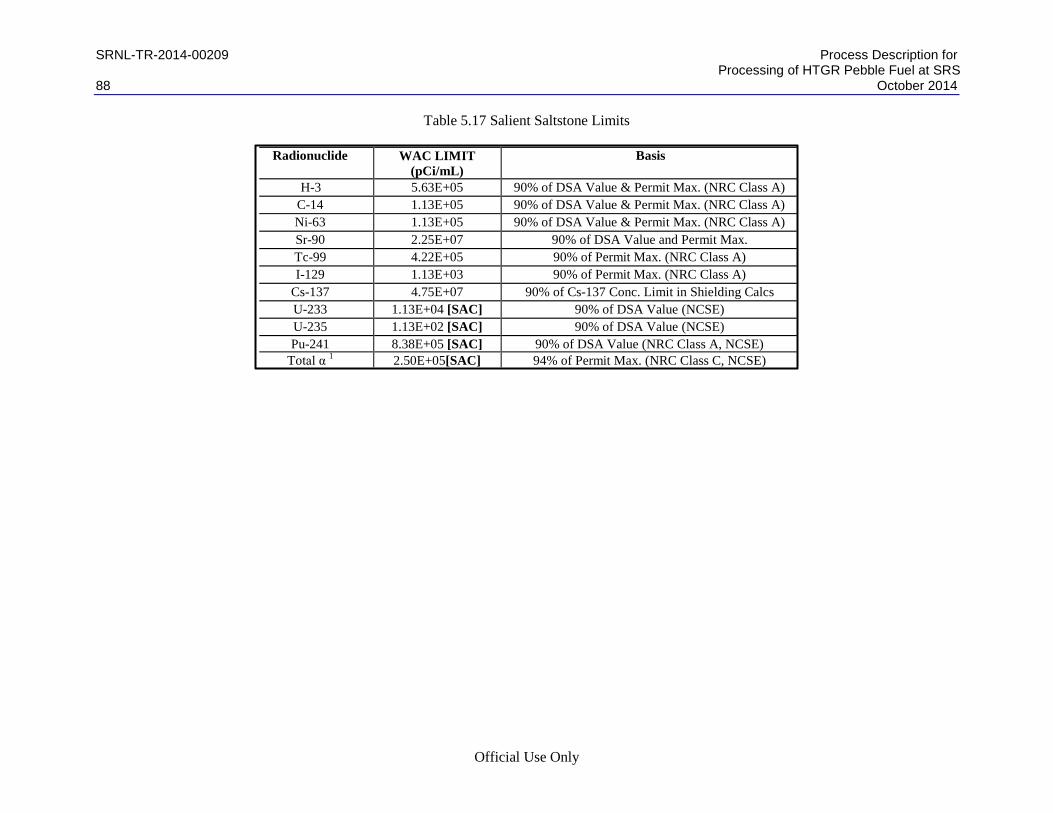
SRNL-TR-2014-00209 Process Description for Processing of HTGR Pebble Fuel at SRS 88 October 2014
Official Use Only
Table 5.17 Salient Saltstone Limits
Radionuclide WAC LIMIT (pCi/mL)
Basis
H-3 5.63E+05 90% of DSA Value & Permit Max. (NRC Class A) C-14 1.13E+05 90% of DSA Value & Permit Max. (NRC Class A) Ni-63 1.13E+05 90% of DSA Value & Permit Max. (NRC Class A) Sr-90 2.25E+07 90% of DSA Value and Permit Max. Tc-99 4.22E+05 90% of Permit Max. (NRC Class A) I-129 1.13E+03 90% of Permit Max. (NRC Class A)
Cs-137 4.75E+07 90% of Cs-137 Conc. Limit in Shielding Calcs U-233 1.13E+04 [SAC] 90% of DSA Value (NCSE) U-235 1.13E+02 [SAC] 90% of DSA Value (NCSE) Pu-241 8.38E+05 [SAC] 90% of DSA Value (NRC Class A, NCSE)
Total α 1 2.50E+05[SAC] 94% of Permit Max. (NRC Class C, NCSE)
Process Description for SRNL-TR-2014-00209 Processing of HTGR Pebble Fuel at SRS October 2014 89
Official Use Only
5.6 Option 1 Balances (AVR Fuel Only) The following pictorial shows the process flow for Option 1 with the key material balance points indicated by numbered stars.
Option 1 material balances for the AVR only case show the impact of the 10:1 salt reuse (baseline) case.

SRNL-TR-2014-00209 Process Description for Processing of HTGR Pebble Fuel at SRS 90 October 2014
Official Use Only
Figure 5.5 Option 1 Process Flow- AVR Only Uses Same Flowsheet
(b)(3), (4)

Process Description for SRNL-TR-2014-00209 Processing of HTGR Pebble Fuel at SRS October 2014 91
Official Use Only
Table 5.18 Option 1 (AVR Only) Material Balance – 10:1 Recycle- Baseline
(b)(3), (4)
SRNL-TR-2014-00209 Process Description for Processing of HTGR Pebble Fuel at SRS 92 October 2014
Official Use Only
Table 5.19 Option 1 (AVR Only) Material Balance –Radionuclide Mass by Stream
(b)(3), (4)

Process Description for SRNL-TR-2014-00209 Processing of HTGR Pebble Fuel at SRS October 2014 93
Official Use Only
Table 5.20 Option 1 (AVR Only) Material Balance –Radionuclide Curie Content by Stream
(b)(3), (4)

SRNL-TR-2014-00209 Process Description for Processing of HTGR Pebble Fuel at SRS 94 October 2014
Official Use Only
6.0 References Adams 2000 Adams, T.M., H.B. Peacock. and R.L. Sindelar, The Melt-Dilute Disposition
Option for 233U, WSRC-MS-2000-00199 (December 1999).
AVR 2011 Nuclear Inventory of AVR-Casks from Forschungszentrums Jülich, Daten aus dem Kernmaterialbuchungssystem KBKS des Forschungszentrums (July 31, 2011).
Bobeck 1956 ISC-832, Gene E. Bobeck and H. A. Wilhelm, Alloys of Aluminum, Thorium and Uranium (December 1956).
Delley 2014 Delley, A. O., Feasibility and Alternatives for Receipt, Storage, and Processing of HTGR Pebble Fuel at SRS, SRNL-TR-2014-00213, September 2014).
Duncan 2000 Duncan, et al, Off-gas System Development for the Melt-Dilute Treatment of Aluminum-Based Spent Nuclear Fuel, WSRC-MS-2000-002000 (2000).
DWPF 1982 Basic Data Report – Defense Waste Processing Facility Sludge Plant – Savannah River Plant 200-S Area (U), Revision 9, DPSP 80-1033 (September 1982).
Eubanks 2014 Email from Eubanks, R. to E. N. Moore, LLW Data (July 7, 2014). Hamm 2014 Hamm, L. L., Preliminary Results and Ideas on On-Site Disposal of LLW
Processed German-Fuel in E-Area (July 2014). Harley 2014 Email from Harley, John to E. N. Moore EU Waste Disposal (July 8, 2014). Hill 2014 Email from Hill, Peter to Edwin Moore, R-19 Fissile Data (June 19, 2014). Hobbs 2010 Hobbs, D. T., Properties and Uses of Sodium Titanates and Peroxotitanates
(December 10, 2010). Karraker 1960 Karraker, D. G., Processing Thorium Fuel, 221-H-LIB-F-71-004 (October
18, 1960). Kessinger 2002 Kessinger, G. F. and M. C. Thompson, Dissolution of Dresden Reactor Fuel,
WSRC-TR-2002-00448 (2002). Kim 2003 Kim J. K., et al, Immobilization of Molten LiCl Waste Using Zeolite A,
Proceedings of the Korean Radioactive Waste Society Fall (2003). Martino 2014 Martino, C. J., et al, SRNL-STI-2013-00700, Actinide Removal Process
Sample Analysis, Chemical Modeling and Filtration Evaluation, Revision 0, (June 2014).
McConnell 2012 McConnell, S.A., Back End Fuel Cycle Demonstration Conceptual Strategy Document, M-ESR-L-00056 (September 2012).
M-M5-F-2857 F-Area Waste Solidification Building High Activity Waste System process Flow Diagram, Revision 2, M-M5-F-2857.
Moore 2012 Moore, E.N., MD-G-ESR-G-00018, Rev 1, Backend Fuel Cycle Demonstration, Strategic Cost Analysis (October 2012).
Moore 2014 Moore, E.N., Process Description for Processing of HTGR Pebble Fuel at SRS, SRNL-STI-2014-2009 (September 2014).
M-SPP-F-00233 Cementation Mixing System, Revision 2, M-SPP-F-00233 (February 19, 2009).

Process Description for SRNL-TR-2014-00209 Processing of HTGR Pebble Fuel at SRS October 2014 95
Official Use Only
Nielhaus 1999 Jül-3734, Dieter Niephaus, Referenzkonzept zur direkten Endlagerung von abgebrannten HTR-Brennelementen in CASTOR THTR/AVR Transport- und Lagerbehältern ( November 1999).
Paiva 1998 de Paiva, J. L., and G. C. Kachan, “Modeling and Simulation of a Packed Column for NOx Absorption with Hydrogen Peroxide,” Ind. Eng. Chem. Res.(1998), 37, 609-614.
Peacock 1999 Peacock, H. B., et al, Melt-Dilute Treatment of Spent Nuclear Fuel Assemblies from Research and Test Reactors, WSRC-MS-99-00751 (1999).
Pierce 2012a Pierce, R.A., et al, SRNL-STI-2012-00748, Digestion of Components in HTGR Fuel (December 5-6, 2012).
Pierce 2013a Pierce, R.A., et al, SRNL-STI-2013-00392, Digestion of Graphite Based Materials (July 2013).
Pierce 2013b Pierce, R.A., et al, SRNL-STI-2013-00598, Digestion of Graphite-Based Fuel Materials: HTGR Pebble Digestion (September 2013).
Pierce 2014 Pierce, R.A., et al, SRNL-STI-2014-00266, Digestion of Irradiated HTGR Fuel Kernels, Revision 0 (June 2014).
Pohl 2012 Pohl, Peter, Final Repository Related CASTOR Documentation: Determination of the Nuclide Inventory of the AVR Fuel Elements According to a Reference Fuel Element Method, E-19758 (January 9, 2012).
Pohl 2014 Pohl, Peter, Final Repository Related CASTOR Documentation: Expansion of the Nuclide Tables of the Reference Fuel Elements to Include Decay Data and Consideration of Further Steps, E-20095 (March 30, 2014).
P-PE-F-02684 F-Area Waste Solidification Building Equipment Location Cementation Area First Level Floor Plan, Revision 2, P-PE-F-02684.
Reyes-Jimenez 2014 Reyes-Jimenez, J., Dose Rates from AVR and THTR HTGR Spent Fuel from the Federal Republic of Germany, N-CLC-H-00882 (August 13, 2014).
Reyes-Jimenez Email Email from Javier Reyes-Jimenez to Edwin Moore, AVR Dose Rates Cases 1.1 and 1.2 Adjusted, June 30, 2014. Email from Javier Reyes-Jimenez to Edwin Moore, Dose Rates AVR Options, June 30, 2014.Email from Javier Reyes-Jimenez to Edwin Moore, Dose Rates for AVR Option 2.3, July 2, 2014. Email from Javier Reyes-Jimenez to Edwin Moore, Dose Rates from 2 Digesters, July 9, 2014.Email from Javier Reyes-Jimenez to Edwin Moore, Gamma Dose Contributors Per Nuclide, June 30, 2014. Email from Reyes-Jimenez to Moore (July 10, 2014).
Schlea 1965 Schlea, C. S. 200-Area Technical manual Iterim-23 Processing of Irradiated Thorium, DPSTM-200H-INT23 (January 1965).
Solum 2014 Solum, Christian to John Harley, Calculation Note (July 8, 2014).
Taylor-Pashow 2014 Taylor-Pashow, K.M.L. and D.T. Hobbs, “Demonstration of Fuel and Fission Product Recovery from HTGR Reactor Fuel Processing Salt”, SRNL-TR-2014-00204 (September 2014).
Theenhaus Theenhaus, R., et al, Preparation, Loading and Storage of CASTOR THTR/AVR Casks for Spent Fuel Elements – Part of the Decommissioning of the High Temperature Reactor AVR.

SRNL-TR-2014-00209 Process Description for Processing of HTGR Pebble Fuel at SRS 96 October 2014
Official Use Only
THTR Fuel THTR Fuel, Castor THTR/AVR in Ahaus (6-19-2013). Verfondern 2007 Verfondern, K., RAPHAEL-0705-D-BF1.2, European Data on HTR Fuel
Characterization (May 2007). Williamson 2014 Williamson, B. M., “HTGR Carbon Digestion Preliminary Criticality Analysis,”
email (August 19, 2014). WTI/90/13 Handling Equipment for Unloading CASTOR THTR/AVR Casks, Draft,
WTI/90/13 (November 2013).