produced by - fife tourism partnership
TRANSCRIPT

Kingdom of Fife - 2016
Economic Impact of Tourism
Produced by:
Destination Research Sergi Jarques, Director

2016
Average length stay (nights x trip) 4.13
Spend x overnight trip 302.35£
Spend x night 73.23£
Spend x day trip 25.77£
Economic Impact of Tourism Kingdom of Fife and districts - 2016 2
652,000
Overseas staying nights
Overseas staying spendUK staying spend
1,469,000 1,223,000
UK staying trips
508,000
Overseas staying trips
144,000
UK staying nights
87,000,000 110,134,000
Percentage of all employment
9%
Total Tourism Value
£565,990,000
Full time equivalent jobs
8,600
Total actual tourism related employment
11,568
£152,883,000
£32,992,000
7,830,000
Total staying nights
2,692,000
Associated spend
Total staying spend
Total day trip spend
Total day trips
Total staying trips
Total number of trips (day & staying)
8,482,000
£197,134,000
£201,749,971
Total visitor spendAdjustments made to avoid double-
counting (e.g. spending on retail and
catering at attractions or
accommodation, or travel spend taking at
the origin of the trip.
£413,107,000
Indirect / induced spend
Economic Impact of Tourism – Headline Figures Kingdom of Fife - 2016
Includes maintenance spending
on second homes, boats and
static vans as well as additional
household spending due to
people coming to stay with them.

Economic Impact of Tourism Kingdom of Fife and districts - 2016 3
14%
33%31%
10%
12%
Breakdown of expenditure
Accommodation
Shopping
Food and drink
Entertainment
Travel
82%
18%
Type of Accommodation
PaidAccommodation
Friends / relatives/ second homes
72%
20%
8%
Type of employment
Direct (tourism industries)
Indirect
Induced
54%
15%
27%
4%
Trips by Purpose
Holiday
Business
Friends / relatives
Other
Study
Jan feb Mar Apr May Jun Jul Aug Sep Oct Nov Dec
Hotels 44% 54% 57% 70% 66% 77% 76% 80% 73% 70% 55% 43%
Guest Houses - B&Bs 6% 35% 25% 40% 67% 63% 59% 71% 82% 57% 45% 15%
0%10%20%30%40%50%60%70%80%90%
100%
Kingdom of Fife - Net Room Occupancy - Serviced Accommodation
Jan feb Mar Apr May Jun Jul Aug Sep Oct Nov Dec
Self Catering Accomm. 10% 32% 22% 46% 29% 57% 57% 71% 64% 52% 18% 17%
0%10%20%30%40%50%60%70%80%90%
100%
Kingdom of Fife - Net Unit Occupancy - Self Catering Accommodation

Contents
Volume of Tourism 5
Staying Visitors - Accommodation Type 6
Trips by Accommodation 6
Nights by Accommodation 6
Spend by Accommodation Type 6
Staying Visitors - Purpose of Trip 7
7
7
7
Day Visitors 7
7
Value of Tourism 8
Expenditure Associated With Trips 9
9
9
10
10
10
Employment 11
12
Full time equivalent 12
Estimated actual jobs 12
Indirect & Induced Employment 12
Full time equivalent 12
Estimated actual jobs 12
Total Jobs 13
Full time equivalent 13
Estimated actual jobs 13
Headline figures 14
Full district breakdown 15
Appendix I - Cambridge Model - Methodology
Economic Impact of Tourism Kingdom of Fife and districts - 2016 4
Nights by Purpose
Direct Expenditure Associated with Trips
Other expenditure associated with tourism activity
Direct Turnover Derived From Trip Expenditure
Spend by Purpose
Trips and Spend by Urban, Rural and Coastal Area
Supplier and Income Induced Turnover
Total Local Business Turnover Supported by Tourism Activity
Direct
Trips by Purpose

Economic Impact of Tourism Kingdom of Fife and districts - 2016 5
Volume of Tourism
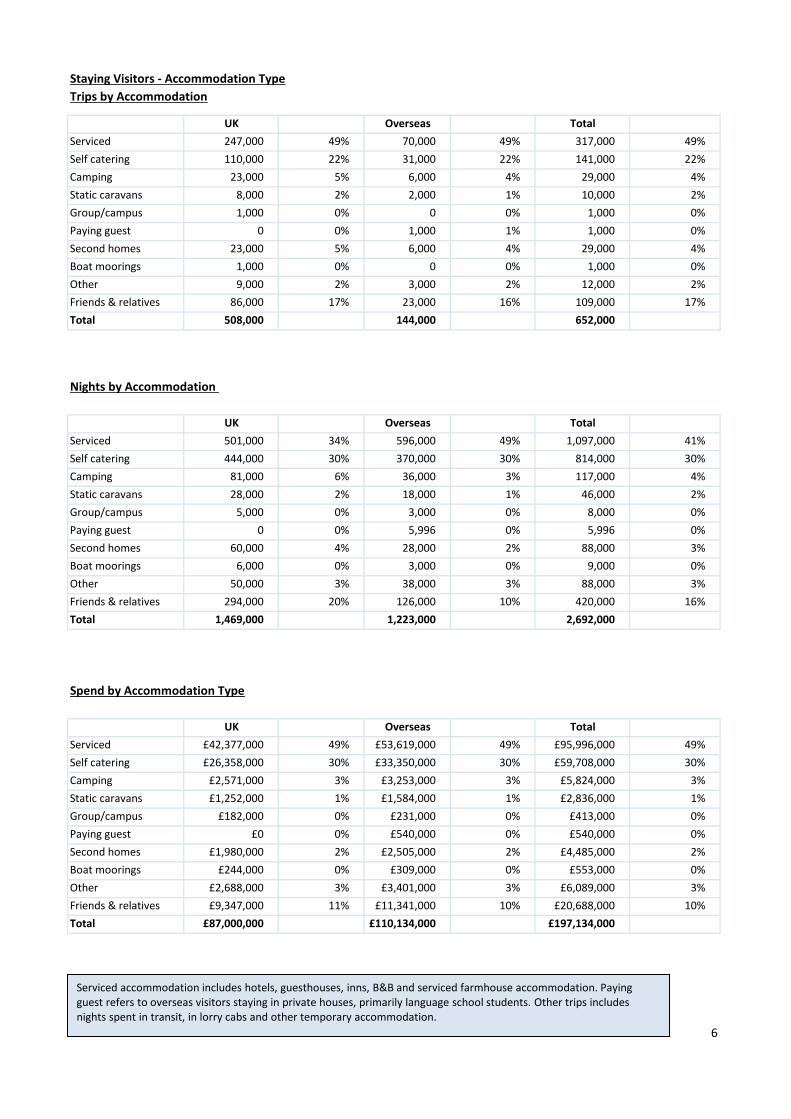
Staying Visitors - Accommodation Type
Trips by Accommodation
UK Overseas Total
247,000 49% 70,000 49% 317,000 49%
110,000 22% 31,000 22% 141,000 22%
23,000 5% 6,000 4% 29,000 4%
8,000 2% 2,000 1% 10,000 2%
1,000 0% 0 0% 1,000 0%
0 0% 1,000 1% 1,000 0%
23,000 5% 6,000 4% 29,000 4%
1,000 0% 0 0% 1,000 0%
9,000 2% 3,000 2% 12,000 2%
86,000 17% 23,000 16% 109,000 17%
Total 508,000 144,000 652,000
Nights by Accommodation
UK Overseas Total
501,000 34% 596,000 49% 1,097,000 41%
444,000 30% 370,000 30% 814,000 30%
81,000 6% 36,000 3% 117,000 4%
28,000 2% 18,000 1% 46,000 2%
5,000 0% 3,000 0% 8,000 0%
0 0% 5,996 0% 5,996 0%
60,000 4% 28,000 2% 88,000 3%
6,000 0% 3,000 0% 9,000 0%
50,000 3% 38,000 3% 88,000 3%
294,000 20% 126,000 10% 420,000 16%
Total 1,469,000 1,223,000 2,692,000
Spend by Accommodation Type
UK Overseas Total
£42,377,000 49% £53,619,000 49% £95,996,000 49%
£26,358,000 30% £33,350,000 30% £59,708,000 30%
£2,571,000 3% £3,253,000 3% £5,824,000 3%
£1,252,000 1% £1,584,000 1% £2,836,000 1%
£182,000 0% £231,000 0% £413,000 0%
£0 0% £540,000 0% £540,000 0%
£1,980,000 2% £2,505,000 2% £4,485,000 2%
£244,000 0% £309,000 0% £553,000 0%
£2,688,000 3% £3,401,000 3% £6,089,000 3%
£9,347,000 11% £11,341,000 10% £20,688,000 10%
Total £87,000,000 £110,134,000 £197,134,000
6
Other
Friends & relatives
Camping
Static caravans
Group/campus
Paying guest
Second homes
Boat moorings
Other
Friends & relatives
Serviced
Self catering
Camping
Static caravans
Group/campus
Paying guest
Second homes
Boat moorings
Other
Friends & relatives
Serviced
Self catering
Camping
Static caravans
Group/campus
Paying guest
Second homes
Boat moorings
Serviced
Self catering
Serviced accommodation includes hotels, guesthouses, inns, B&B and serviced farmhouse accommodation. Paying guest refers to overseas visitors staying in private houses, primarily language school students. Other trips includes nights spent in transit, in lorry cabs and other temporary accommodation.

Staying Visitors - Purpose of Trip
270,000 53% 82,000 57% 352,000 54%
85,000 17% 14,000 10% 99,000 15%
137,000 27% 41,000 28% 178,000 27%
16,000 3% 6,000 4% 22,000 3%
0 0% 1,000 1% 1,000 0%
Total 508,000 144,000 652,000
741,000 50% 363,000 30% 1,104,000 41%
140,000 10% 74,000 6% 214,000 8%
578,000 39% 259,000 21% 837,000 31%
10,000 1% 301,000 25% 311,000 12%
0 0% 227,000 19% 227,000 8%
Total 1,469,000 1,223,000 2,692,000
£44,212,000 51% £65,717,000 60% £109,929,000 56%
£14,265,000 16% £4,022,000 4% £18,287,000 9%
£27,572,000 32% £16,237,000 15% £43,809,000 22%
£951,000 1% £16,305,000 15% £17,256,000 9%
£0 0% £7,854,000 7% £7,854,000 4%
Total £87,000,000 £110,134,000 £197,134,000
Spend x trip
Leisure 3,132,000 40% £77,040,000 38% £24.60
VFR 2,237,000 29% £35,306,000 18% £15.78
Eating Out 895,000 11% £24,210,000 12% £27.05
Events 895,000 11% £23,680,000 12% £26.46
Shopping 671,000 9% £41,359,000 21% £61.64
Total 2016 7,830,000 £201,595,000
Economic Impact of Tourism Kingdom of Fife and districts - 2016 7
Trips Spend
Day Visitors
Trips and Spend by Urban, Rural and Coastal Area
Holiday
Business
Friends & relatives
Other
Study
Spend by Purpose
UK Overseas Total
Total
Holiday
Business
Friends & relatives
Other
Study
Study
Nights by Purpose
UK Overseas
Overseas Total
Holiday
Business
Friends & relatives
Other
Trips by Purpose
UK

Economic Impact of Tourism Kingdom of Fife and districts - 2016 8
Value of Tourism

Expenditure Associated with Trips:
Accomm. Shopping Food and Drink Attractions Travel Total
£23,913,000 £11,697,000 £23,153,000 £9,978,000 £18,259,000 £87,000,000
£33,156,000 £32,088,000 £23,077,000 £11,870,000 £9,943,000 £110,134,000
£57,069,000 £43,785,000 £46,230,000 £21,848,000 £28,202,000 £197,134,000
29% 22% 23% 11% 14% 100%
£0 £88,742,000 £74,876,000 £19,412,000 £18,719,000 £201,749,000
0% 44% 37% 10% 9% 100%
Total £57,069,000 £132,527,000 £121,106,000 £41,260,000 £46,921,000 £398,883,000
14% 33% 30% 10% 12% 100%
Boats Static vans
£960,000 £1,908,000
Economic Impact of Tourism Kingdom of Fife and districts - 2016 9
£3,354,000 £26,770,000 £32,992,000
Other expenditure associated with tourism activity
Other expenditure associated with tourism activity - Estimated spend
Second homes Friends & relatives Total
Total Staying (%)
Total Day Visitors
Total Day Visitors
%
Direct Expenditure Associated with Trips
UK Tourists
Overseas tourists
Total Staying
Spend on second homes is assumed to be an average of £2,000 on rates, maintenance, and replacement of furniture and fittings. Spend on boats assumed to be an average of £2,000 on berthing charges, servicing and maintenance and upgrading of equipment. Static van spend arises in the case of vans purchased by the owner and used as a second home. Expenditure is incurred in site fees, utility charges and other spending and is estimated at £2,000. Additional spending is incurred by friends and relatives as a result of people coming to stay with them. A cost of £175 per visit has been assumed based on national research for social
0%
10%
20%
30%
40%29%
22% 23%
11% 14%
Breakdown of expenditure
Total Staying (%)
0%
20%
40%
60%44%
37%
10%9%
Breakdown of expenditure
Total Day Visitors

Total Direct
Total
Total Value
Economic Impact of Tourism Kingdom of Fife and districts - 2016 10
£318,906,000 £247,084,000 £565,990,000
Direct £218,844,000 £194,263,000 £413,107,000
Indirect £100,062,000 £52,821,000 £152,883,000
Total Local Business Turnover Supported by Tourism Activity – Value of Tourism
Staying Visitor Day Visitors Total
£100,062,000 £52,821,000 £152,883,000
Income induced £35,737,000 £7,650,000 £43,387,000
Indirect spend £57,727,000 £45,171,000 £102,898,000
Non trip spending £6,598,000 £0 £6,598,000
Supplier and Income Induced Turnover
Staying Visitor Day Visitors Total
£218,844,000 £194,263,000 £413,107,000
Non-trip spend £32,992,000 £0 £32,992,000
Transport £16,921,000 £11,231,000 £28,152,000
Catering £44,843,000 £72,630,000 £117,473,000
Attractions £22,748,000 £21,049,000 £43,797,000
Accommodation £57,993,000 £1,498,000 £59,491,000
Retail £43,347,000 £87,855,000 £131,202,000
Direct Turnover Derived From Trip Expenditure
Staying Visitor Day Visitors Total
Business turnover arises as a result of tourist spending, from the purchase of supplies and services locally by businesses in receipt of visitor spending and as a result of the spending of wages in businesses by employees whose jobs are directly or indirectly supported by tourism spending.
Adjustments have been made to recognise that some spending on retail and food and drink will fall within attractions or accommodation establishments. It is assumed that 40% of travel spend will take place at the origin of the trip rather than at the destination.
Income induced spending arises from expenditure by employees whose jobs are supported by tourism spend.

Economic Impact of Tourism Kingdom of Fife and districts - 2016 11
Employment

956 30% 25 1% 980 17%
431 13% 873 34% 1,304 23%
789 24% 1,277 50% 2,066 36%
319 10% 295 12% 615 11%
115 4% 77 3% 192 3%
611 19% 0 0% 611 11%
Total FTE 3,221 2,548 5,768
1,414 31% 37 1% 1,451 17%
646 14% 1,310 35% 1,957 23%
1,183 26% 1,916 51% 3,099 37%
450 10% 416 11% 867 10%
163 4% 108 3% 271 3%
697 15% 0 0% 697 8%
Total Actual 4,553 3,787 8,340
Indirect & Induced Employment
Total FTE
Total Actual
Economic Impact of Tourism Kingdom of Fife and districts - 2016 12
2,112 1,115 3,228
Indirect jobs 1,358 954 2,312
Induced jobs 754 162 916
Estimated actual jobs
Staying Visitor Day Visitors Total
1,853 978 2,831
Indirect jobs 1,191 837 2,028
Induced jobs 662 142 803
Catering
Entertainment
Transport
Non-trip spend
Full time equivalent (FTE)
Staying Visitor Day Visitors Total
Estimated actual jobs
Staying Visitor Day Visitor Total
Accommodation
Retailing
Accommodation
Retailing
Catering
Entertainment
Transport
Non-trip spend
Employment
Direct employment
Full time equivalent (FTE)
Staying Visitor Day Visitor Total
The model generates estimates of full time equivalent jobs based on visitor spending. The total number of ‘actual’ jobs will be higher when part time and seasonal working is taken into account. Conversion of full time equivalent jobs into actual jobs relies on information from business surveys in the sectors receiving

Total Jobs
3,221 63% 2,548 72% 5,768 67%
1,191 23% 837 24% 2,028 24%
662 13% 142 4% 803 9%
Total FTE 5,074 3,526 8,600
4,553 68% 3,787 77% 8,340 72%
1,358 20% 954 19% 2,312 20%
754 11% 162 3% 916 8%
Total Actual 6,665 4,902 11,568
Tourism Jobs as a Percentage of Total Employment
Total
Total employed 91%
Tourism jobs 9%
Economic Impact of Tourism Kingdom of Fife and districts - 2016 13
Proportion all jobs 5% 4% 9%
Total
Total employed 135,000 135,000 135,000
Tourism jobs 6,665 4,902 11,568
Direct
Indirect
Induced
Staying Visitor Day visitors
Direct
Indirect
Induced
Estimated actual jobs
Staying Visitor Day Visitor Total
Full time equivalent (FTE)
Staying Visitor Day Visitor Total
Actual jobs are estimated from surveys of relevant businesses at locations in England and take account of part time and seasonal working.
91%
9%
Tourism Jobs as a Percentage of Total Employment
Total employed
Tourism jobs

The key 2016 results of the Economic Impact Assessment are:
8.5 million trips were undertaken in the area
7.8 million day trips
0.7 million overnight visits
2.7 million nights in the area as a result of overnight trips
£399 million spent by tourists during their visit to the area
£33 million spent on average in the local economy each month.
£197 million generated by overnight visits
£202 million generated from irregular day trips.
£566 million spent in the local area as result of tourism, taking into account multiplier effects.
11,568 jobs supported, both for local residents from those living nearby.
8,340 tourism jobs directly supported
3,228 non-tourism related jobs supported linked to multiplier spend from tourism.
Key DOMESTIC overnight tourism results
0.5 million overnight visits
1.5 million nights in the area as a result of overnight trips
2.9 nights per trip
£87 million spent by tourists during their visit to the area
£171 spend per trip
£59 spend per night
£7 million spent on average in the local economy each month.
Key OVERSEAS overnight tourism results
0.1 million overnight visits
1.2 million nights in the area as a result of overnight trips
8.5 nights per trip
£110 million spent by tourists during their visit to the area
£765 spend per trip
£90 spend per night
£9 million spent on average in the local economy each month.
Economic Impact of Tourism Kingdom of Fife and districts - 2016 14
Economic Impact of Tourism – Headline Figures Kingdom of Fife - 2016

Comparative data
St Andrews Dunfermline Kirkcaldy
North East
Fife Fife Council
UK trips 167,000 103,000 108,000 129,000 508,000
Overseas trips 47,500 28,800 30,800 36,200 144,000
Total trips 214,500 131,800 138,800 165,200 652,000
UK nights 465,000 270,000 319,000 411,000 1,469,000
Overseas nights 400,000 227,000 248,000 326,000 1,223,000
total nights 865,000 497,000 567,000 737,000 2,692,000
UK spend £29,802,000 £16,287,000 £17,571,000 £23,185,000 £87,000,000
Overseas spend £35,976,000 £20,431,000 £22,355,000 £29,331,000 £110,134,000
Total spend £65,778,000 £36,718,000 £39,926,000 £52,516,000 £197,134,000
Tourism day visits 2,505,000 2,067,000 1,965,000 1,295,000 7,830,000
Day visit spend £66,183,000 £53,559,000 £52,343,000 £30,393,000 £201,749,971
Total direct £131,961,000 £90,277,000 £92,269,000 £82,909,000 £398,883,971
Other Direct Spend £3,695,000 £10,008,000 £11,922,000 £7,159,000 £32,992,000
Indirect impacts £38,624,000 £20,819,000 £29,425,000 £17,880,000 £152,883,000
Total Value £168,288,000 £116,843,000 £129,267,000 £103,027,000 £565,990,000
FTE employment 2,505 1,726 1,945 1,567 8,600
Actual jobs 3,446 2,363 2,621 2,159 11,568
% of employment 47% 4% 4% 10% 9%
Economic Impact of Tourism Kingdom of Fife and districts - 2016 15
2,719,500
2,198,800
2,103,800
1,460,200
St Andrews
Dunfermline
Kirkcaldy
North East Fife
Total Trips by District
£168,288,000
£116,843,000
£129,267,000
£103,027,000
St Andrews
Dunfermline
Kirkcaldy
North East Fife
Total Spend by District

St Andrews
Average length stay (nights x trip) 4.03
Spend x overnight trip 306.66£
Spend x night 76.04£
Spend x day trip 26.42£
Economic Impact of Tourism Kingdom of Fife and districts - 2016 16
Total actual tourism related employment
3,446
Adjustments made to avoid double-
counting (e.g. spending on retail and
catering at attractions or
accommodation, or travel spend taking at
the origin of the trip.
Total visitor spend
£131,961,000
Indirect / induced spend
£38,624,000
Total Tourism Value
£170,585,000
Full time equivalent jobs
2,505
£65,778,000
UK staying spend Overseas staying spend
£29,802,000 £35,976,000
Total day trip spend
Associated spend £66,183,000
£3,695,000
167,000 47,500
Total staying nights
865,000
UK staying nights Overseas staying nights
465,000 400,000
Total staying spend
Economic Impact of Tourism – Headline Figures St Andrews
Total number of trips (day & staying)
2,719,500
Total staying trips
214,500
Total day trips
UK staying trips Overseas staying trips 2,505,000
Includes maintenance spending on
second homes, boats and static
vans as well as additional
household spending due to
people coming to stay with them.
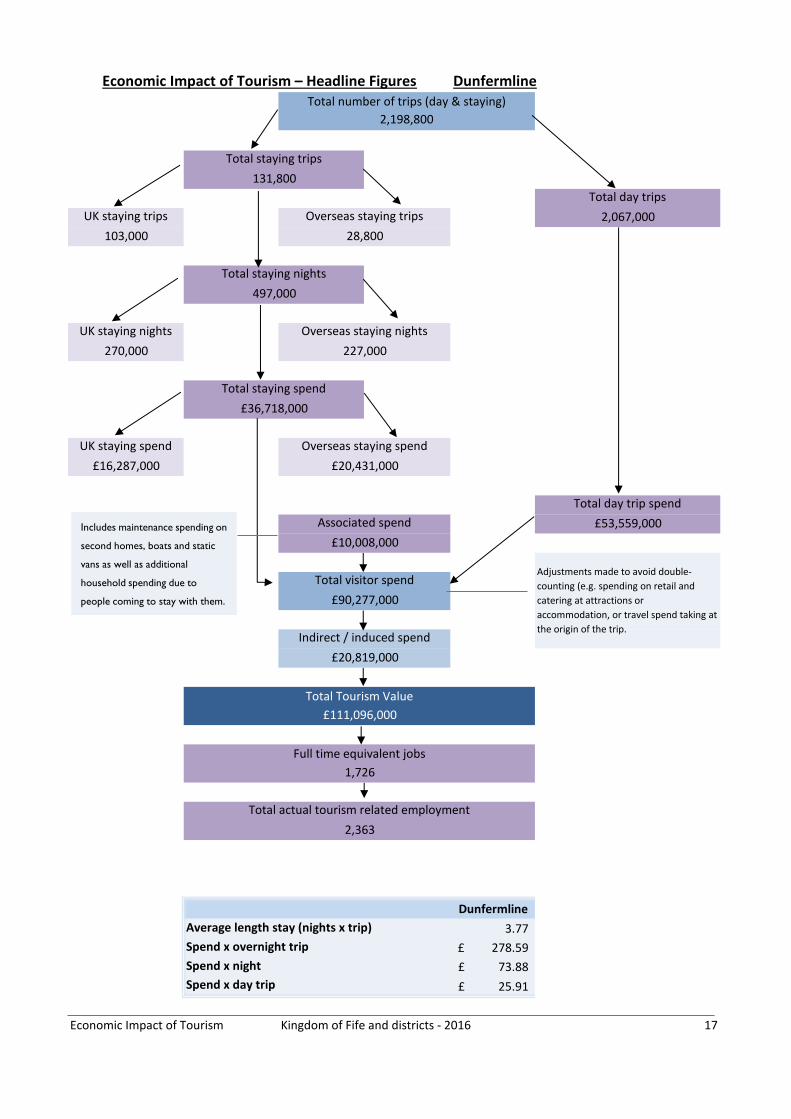
Dunfermline
Average length stay (nights x trip) 3.77
Spend x overnight trip 278.59£
Spend x night 73.88£
Spend x day trip 25.91£
Economic Impact of Tourism Kingdom of Fife and districts - 2016 17
£20,819,000
Total Tourism Value
£111,096,000
Full time equivalent jobs
1,726
Total actual tourism related employment
2,363
£16,287,000 £20,431,000
Total day trip spend
Associated spend £53,559,000
£10,008,000
Adjustments made to avoid double-
counting (e.g. spending on retail and
catering at attractions or
accommodation, or travel spend taking at
the origin of the trip.
Total visitor spend
£90,277,000
Indirect / induced spend
Total staying nights
497,000
UK staying nights Overseas staying nights
270,000 227,000
Total staying spend
£36,718,000
UK staying spend Overseas staying spend
2,198,800
Total staying trips
131,800
Total day trips
UK staying trips Overseas staying trips 2,067,000
103,000 28,800
Economic Impact of Tourism – Headline Figures DunfermlineTotal number of trips (day & staying)
Includes maintenance spending on
second homes, boats and static
vans as well as additional
household spending due to
people coming to stay with them.

Kirkcaldy
Average length stay (nights x trip) 4.09
Spend x overnight trip 287.65£
Spend x night 70.42£
Spend x day trip 26.64£
Economic Impact of Tourism Kingdom of Fife and districts - 2016 18
Total actual tourism related employment
2,621
£39,926,000
Economic Impact of Tourism – Headline Figures Kirkcaldy
Total number of trips (day & staying)
Adjustments made to avoid double-
counting (e.g. spending on retail and
catering at attractions or
accommodation, or travel spend taking at
the origin of the trip.
Total visitor spend
£92,269,000
Indirect / induced spend
£29,425,000
Total Tourism Value
£121,694,000
Full time equivalent jobs
1,945
UK staying spend Overseas staying spend
£17,571,000 £22,355,000
Total day trip spend
Associated spend £52,343,000
£11,922,000
108,000 30,800
Total staying nights
567,000
UK staying nights Overseas staying nights
319,000 248,000
Total staying spend
2,103,800
Total staying trips
138,800
Total day trips
UK staying trips Overseas staying trips 1,965,000
Includes maintenance spending on
second homes, boats and static
vans as well as additional
household spending due to
people coming to stay with them.

Average length stay (nights x trip) 4.46
Spend x overnight trip 317.89£
Spend x night 71.26£
Spend x day trip 23.47£
Economic Impact of Tourism Kingdom of Fife and districts - 2016 19
Total day trips
1,295,000
North East Fife
£17,880,000
Total Tourism Value
£100,789,000
Full time equivalent jobs
1,567
Total actual tourism related employment
2,159
Total staying nights
737,000
£23,185,000 £29,331,000
Total day trip spend
Associated spend £30,393,000
£7,159,000
Adjustments made to avoid double-
counting (e.g. spending on retail and
catering at attractions or
accommodation, or travel spend taking at
the origin of the trip.
Total visitor spend
£82,909,000
Indirect / induced spend
UK staying nights Overseas staying nights
411,000 326,000
Total staying spend
£52,516,000
UK staying spend Overseas staying spend
1,460,200
Total staying trips
165,200
UK staying trips Overseas staying trips
129,000 36,200
Economic Impact of Tourism – Headline Figures North East Fife
Total number of trips (day & staying)
Includes maintenance spending on
second homes, boats and static
vans as well as additional
household spending due to
people coming to stay with them.

Economic Impact of Tourism Kingdom of Fife and districts - 2016 20
Appendix I - Introduction about Cambridge Model
This report examines the volume and value of tourism and the impact of that expenditure on the local economy. The figures were derived using the Cambridge Economic Impact Model and the research was undertaken by Destination Research.
The model utilises information from national tourism surveys and regionally based data held by Destination Research. It distributes regional activity as measured in those surveys to local areas using ‘drivers’ such as the accommodation stock and occupancy which influence the distribution of tourism activity at local level.
Limitations of the Model
The methodology and accuracy of the above sources varies. The results of the model should therefore be regarded as estimates which are indicative of the scale and importance of visitor activity in the local area. It is important to note that in the national tourism surveys the sample sizes for each area changes year on year. This is as a result of the random probability nature of the methodology. As such, the results of the Cambridge Model are best viewed as a snapshot in time and we would caution against year-on-year comparisons.
It should be noted that the model cannot take into account any leakage of expenditure from tourists taking day trips out of the area in which they are staying. While it is assumed that these may broadly balance each other in many areas, in locations receiving significant numbers of day visitors from London, there is likely to be an underestimate in relation to the number of overseas day visitors staying in holiday accommodation in London.
Whilst it is important to be aware of these issues, we are confident that the estimates we have produced are as reliable as is practically possible within the constraints of the information available.
RoundingAll figures used in this report have been rounded. In some tables there may therefore be a slight discrepancy between totals and sub totals.
Data sourcesThe main national surveys used as data sources in stage one include:• Great Britain Tourism Survey (GBTS) - information on tourism activity by GB residents;• International Passenger Survey (IPS) information on overseas visitors to the United Kingdom;• Day Visits in the annual Great Britain Day Visitor Survey using information on visits lasting
more than 3 hours and taken on an irregular basis
These surveys provide information down to a regional level. In order to disaggregate data to a local level the following information sources are used:
• Records of known local accommodation stock held by Destination Research;• VisitEngland's surveys of Visits to Attractions, which provide data on the number of visitors to
individual tourist attractions ;• Mid-2016 estimates of resident population as based on the 2011 Census of Population;• Selected data from the 2011 Census of Employment;• Selected data on the countryside and coast including, national designations and length of the
coastline.

Economic Impact of Tourism Kingdom of Fife and districts - 2016 21
Staying Visitors
The GBTS provides information on the total number of trips to the region and the relative proportions using different types of accommodation. By matching these figures to the supply of such accommodation, the regional average number of trips per bedspace or unit of accommodation can be derived. The IPS provides information on the total number of trips by overseas visitors to the region.
Day Visitors
Information on day trips at the regional level is available from the Day Visits in Great Britain survey. The survey includes all leisure-related trips from home. It should be noted that a large proportion are local trips made by people resident in the locality. The model uses information from the survey to estimate the number of longer day trips (defined as those lasting at least 3 hours and involving travel of more than 20 miles) and irregular trips lasting more than 3 hours.
Impact of tourism expenditure
This section examines the impact of the tourism expenditure in terms of the direct, indirect and induced expenditure as well as an estimate of the actual jobs (both direct and indirect) supported by tourism expenditure in the district.
The GBTS, IPS and Day Visits to Great Britain survey data on the breakdown of visitor spending.The impact of this initial round of expenditure will be subsequently increased by multiplier effects. These arise from the purchase of supplies and services by the businesses in receipt of visitor expenditure (indirect impacts), and by the income induced-effects arising from the spending of wages by employees in the first round of business and in subsequent expenditure in supplier business (induced impacts).
The New Earnings Survey which provides information on wage levels by industry sector and region; An internal business database which includes data on the structure of business expenditure, local linkages and multiplier ratios drawn from a wide range of business and economic studies carried out by Geoff Broom Associates, PA Cambridge Economic Consultants and others. By applying the breakdown to the estimates of visitor spending, the model generates estimates of total direct spending.
Evidence from national studies suggests that some minor adjustments are required to match visitor spend to business turnover – for example, some expenditure on food and drink actually takes place in inns and hotels that fall in the accommodation sector and within attractions. More significantly, expenditure on travel costs associated with individual trips is equally likely to take place at the origin of the trip as the destination. Therefore the model assumes that only 40% of travel expenditure accrues to the destination area.
Number of full time job equivalents
Having identified the value of turnover generated by visitor spending, it is possible to estimate the employment associated with that spending. Wages for staff and drawings for the proprietors will absorb a proportion of that turnover. By applying these proportions to the overall additional turnover in each sector, the amount of money absorbed by employment costs can be calculated.

Economic Impact of Tourism Kingdom of Fife and districts - 2016 22
The New Earnings Survey provides data from which the average costs by business sector, adjusted to take account of regional differences, can be calculated. After allowing for additional costs such as National Insurance and pension costs, an average employment cost per full time equivalent job can be estimated. The number of such jobs in the local area can then be estimated by dividing the amount of business expenditure on wages and drawings by the average employment cost per job.
Number of Actual Jobs
The model generates estimates of full time equivalent jobs based on visitor spending. However, the total number of actual jobs will be higher when part time and seasonal working is taken into account. The full time equivalent jobs arising directly from visitor spending are converted into actual jobs using information from business surveys in the sectors receiving visitor spending. In general, the conversion factor varies around 1.5 in those sectors.
The indirect and induced jobs arise across a much wider range of employment sectors. Therefore, the average 1.16 for all sectors based on Census of Employment data has been used to convert full time equivalent jobs in this sector to actual jobs.
The employment estimates generated by the model include both self employed and employed people supported by visitor expenditure. The model also includes an estimate of the additional jobs arising in the attractions sector, which are not related to visitor expenditure. However, the numbers do not include other tourism-related employment such as jobs in local authorities arising from their tourism functions, e.g. tourist information staff, additional public health, parks and gardens, public conveniences, maintenance sections and jobs arising from capital investment in tourism facilities.

Produced by:
Registered in England No. 9096970 VAT Registration No. GB 192 3576 85
45 Colchester RoadManningtreeCO11 2BA
Sergi JarquesDirectorTel: 01206 392528info@destinationresearch.co.ukwww.destinationresearch.co.uk