product development management product development manageme… · for new product development and...
TRANSCRIPT

Tourism Product Development
Management
Author: Bill Wright B.Com. MBA
Copyright 1994

2
LEARNING OUTCOMES
Learning Outcome 1
Propose a product development plan for a selected town, suburb, city or region.
Assessment Criteria
1.1 Discuss the key strengths and weaknesses of existing inventory/infrastructure of a given town, suburb, city or region, taking into account the following factors:
• natural and built attractions
• activities for seeing, doing and learning
• accommodation
• access
• ancillary infrastructure and services
1.2 Complete a visitation analysis for the abovementioned area, taking into account the following factors:
• past visitation statistics (given timeframe)
• rates of growth and reasons for same
• projections (including assumptions) for next five years
• graphical representation of past statistics and projections
• possible ways to stimulate visitation.
1.3 Complete a visitor analysis for the area, include the following factors:
• study recent visitor surveys
• prepare a quantitative profile of visitors
• prepare a qualitative profile of visitors
1.4 Evaluate the existing town and/or regional planning policies and proposals.
1.5 Prepare a product development plan for the area and include the following factors:

3
• SWOT analysis
• an identity statement defining the desired future character of the area
• key issues, problems and opportunities
• the development priorities.
Content
1.1 Inventory Analysis
• this section will outline how an analysis of key strengths and weaknesses of existing inventory/infrastructure for a town, suburb, city or region can be undertaken
• Class Exercise 1 (say 30 mins) “Town Character”
Choose a town or city close to you and discuss one or more of the following topics
• describe its unique character or appeal as a tourism destination
• select one area for analysis eg a precinct
• describe its “desired future character
• does the city or town have any world class tourism assets?
• does the city or town have any tourism assets that have an edge over those of comparable towns or cities?
• list 3 assets that could be classified as strengths
• list 3 weaknesses
• discuss one major new product opportunity
• the key items in a tourism inventory analysis are:-
• attractions
• natural
• man-made
• resorts
• restaurants & hospitality venues
• entertainment facilities events
• convention facilities
• sporting facilities and events
• parks and gardens
• cultural facilities
• interpretation centres
• escorted tours
• activities
• seeing
• doing
• learning
• accommodation

4
• hotel & motels
• flats, units & apartments
• bed & breakfast, home stay, farm stay
• caravan parks & camping
• access
• air
• sea
• rail (trains & trams)
• road
• ancillary services & infrastructure
• public works
• water
• sewer
• power
• streets, street-scaping
• area beautification
• signage
• area management
• conveniences
• picnic & camping facilities
• public services
• information
• interpretation
• laws & regulations
• planning & zoning
• promotion
• garbage collection
• security
• human resources / education
• private works
• site availability
• site development
• retail & commercial facilities
• private services
• travel agency
• medical / hospital
• consulting & training
• analysts may prefer not to use a check-list approach and simply list and describe each tourism asset as they come to it, albeit classified by type and/or priority
• the advantage of a check list is that it forces you to re-think the obvious eg a cursory investigation may ignore a parkland but that same park may have tremendous potential with significant redevelopment including lakes, trails and new activities.
• Class Exercise No. 2 (say 30 minutes)

5
• Distribute Handout 1.1 “Regional Tourism Study”
• Explain that this handout will be used in this module to support learning and to assist students approach Assignment 1.
• Distribute and explain Assignment 1 (noting that learners will not be able to choose an area already discussed in depth in class exercises)
• Lead learners through a quick scan of the content of Handout 1.1 (say 3 mins)
• with reference to the town or city referred to in Exercise 1 discuss the need for a similar study along the lines of
• paragraphs 1 & 2 (desired study objectives and desired outcomes)
• Stage 2 - Tourism inventory analysis
• Stage 4 - Infrastructure and environmental analysis
1.1 Visitation Analysis
• Class Exercise 3 (say 20 mins)
• What facts can we recall about visitation for the abovementioned area (used in Exercise 1), and in particular
• past visitation statistics ( for say the last 3 years)
• rates of growth and reasons for same
• projections (including assumptions) for next five years
• graphical representation of past statistics and projections
• possible ways to stimulate visitation.
• name 3 attractions and estimate the annual visitation to each attraction.
• market statistics
• we must gather long-term history about the market and graph industry sales. Ideally the graph should start from when the first product in the industry was released because we are trying to measure product life cycle and to see where we are right now on the cycle. We should not be satisfied with just the last 5 years because 5 years of history is not long for trend analysis to be able to predict the next 5 years

6
• not all long-term sales curves are “S” shaped and even if they are, some might small or flat while others are large and tall indicating strong market penetration over a long period of time
• we must be able to explain the shape of the curve in terms of the underlying determinants of demand and major competitive events like innovation etc
• the next step is to project the market into the future for at least the next 5 years. Will the curve go up, down or sideways? What will the rate of growth be? This can be tried first of all using charting or mathematical techniques but whatever shape is decided it must be explained and justified with assumptions about the underlying determinants of demand.
• having done this exercise for the total market we then try it also by segment. It may well be that some segments are showing strong growth while others are dying. Thus there may be a collection of product life cycles underpinning the one for the total market.
• once we are clear about the shape and direction of the product life cycle and our current position on it we can design strategic responses for new product development and other elements of the marketing mix and corporate strategy
• market statistics can be gathered from government and/or industry sources. If the statistics are deficient then action should be taken at the government and/or industry levels to correct this situation. World best practice demands this standard of market intelligence not only to remain competitive but for survival.
• Class Exercise 4 (say 60 mins)
• refer to the section “Stage 2 - Tourism market analysis” of Handout 1.1 “Regional Tourism Planning Study”
• refer also to Handout 1.2 “Far North & Coober Pedy Market Assessment”
• discuss the theory of this material and its possible application or relevance to the area discussed in previous exercises.
• segmentation and target market analysis
• the essence of marketing is to find customers (consumers), understand their needs and tailor the organisations offerings to match those needs, maximising customer satisfaction
• because customers are different we try to divide the market into meaningful groups. This process is called segmentation. Segments may

7
be chosen on the basis of demographic, geographic, psychographic or behavioural attributes
• market segmentation is a strategy designed to allocate marketing resources to defined segments
• defining the segments is often a multi-step process, eg we might first divide the market up by origin (and focus on Japan), then that segment by location (and focus on Tokyo), then that segment by occupation and sex (and focus on female office ladies), then by age (and focus on 25-35 year olds).
• alternatively we might segment first on the basis of benefits sought eg a snack food market might be divided up into those primarily seeking nutrition benefits, taste benefits, social benefits and diet benefits. Segmentation could then proceed to sub-divide and describe on the basis of demographic, geographic, psychographic and behavioural characteristics.
• part or all of a chosen segment is then chosen for targeting purposes. This is referred to as a target market. Whatever the basis for segmentation this target market must then be fully described in the above terms. eg the 25-35 office lady segment in Tokyo must be satisfactorily described in geographic, demographic, psychographic and behavioural terms. We need a full quantitative and qualitative description of this target market if we are to properly understand them and ensure that our marketing mix satisfies their needs as well as or better than the competition.
• we know we have an adequate target market profile when we can answer questions like
• who are our customers (or potential customers)?
• why do they buy?
• what communication objectives and process should we use to reach them?
• what is their decision-making process?
1.2 Visitor analysis
• Class Exercise 5 (say 60 mins)
For the selected area used in previous exercises
• discuss the nature, availability and usefulness of recent visitor surveys
• what kinds of visitors are attracted to the area

8
• list and prioritise 5 visitor segments
• for the top two segments attempt a quantitative profile of these visitors
• describe, compare and contrast the qualitative profiles of two visitor segments listed above (needs, motivation, likes and dislikes, behaviour, satisfaction etc)
• refer to the following sections contained in Handout 1.1 “Regional Tourism Planning Study”.
• “Stage 2 - Analyse existing consumer & trade research”
• “Stage 2 - New consumer & trade research - focus groups”
• “Stage 4 - Target market evaluation”
• Discuss the theory of these sections and their possible application or relevance to the area discussed in previous exercises.
1.3 Town and regional planning
• Class Exercise 6 (say 30 minutes)
• Discuss Handout 1.4 “Tourism Planning - A Discussion about Goals”
• How relevant is this to goals for the town or city previously discussed
• economists, land-use planners and other strategists (mining, aboriginal, pastoral, tourism etc) all engage in planning which will impact on product
• at a regional and town level, local government and State authorities have produced a large body of planning principles, zoning plans, design guidelines and constraints etc and tourism planners must understand and consider these as part of product planning. Key issues to investigate are:-
• objectives and principles of these plans
• zoning statements of “desired future character”, permitted uses, prohibited uses and consent uses
• design restrictions concerning height, site coverage, plot ratio, set backs, landscaping and materials etc
• heritage listings and protection requirements
• environmental impact assessment requirements
• at a regional and State level there might be economic development plans. These usually refer to tourism and should also be studied.
• more tourism-aware communities are become involved in community based tourism planning, often feeding into local government and regional tourism strategies. Agreement may have already been reached at the community and local tourism operator level on such issues as
• need for a tourism zone
• need for tourism development action projects for specific development sites and types of attractions etc
• need for enhancement of unique heritage and conservation areas

9
• need for improved visitation and identity
• need to boost the sale of locally made products, income and profitability
• need for increased employment
• increased utilisation and value of community assets
• increased awareness and education concerning local history, lifestyle and culture
• all town and regional planning concerns the physical, economic and social environment. It is often extremely helpful to remember these dimensions in all aspects of tourism product planning.
• Class Exercise 7 (say 15 mins)
• refer to the following sections of Handout 1.1 “Regional Tourism Planning Study”
• “Stage 2 - Existing strategy research - economic development”
• “Stage 2 - Existing strategy research - environmental and development planning”
• discuss the theory of these sections and their possible application or relevance to the area discussed in previous exercises.
1.4 Prepare a product development plan for the area and include the following
factors:
• SWOT analysis
• this topic has already been dealt with in CMTR 3 Product Development Co-ordination and revised material is now presented in question and answer format to facilitate class discussion.
• Class exercise 8 (say 60 mins)
• What does SWOT mean?
• SWOT means strengths, weaknesses, opportunities and strengths.
• Why is it used?
• to help formulate strategy by matching an organisation’s (or area’s) strengths and weaknesses to the opportunities and threats in its environment.
• Opportunities and strengths are to be capitalised on and threats and weaknesses met and accommodated
• When is it used?

10
• in an initial brainstorming exercise to start a planning process, particularly as it affords an opportunity for everyone to be involved
• at the end of a detailed “situation analysis” stage
• during strategy determining “portfolio analysis”
• What is its scope?
• can be applied to
• part of an organisation (eg product, product group, department, geographic area, function, business unit)
• the organisation as a whole
• a competitor
• an industry
• an area such as a destination, precinct, town, region or country.
• wide ranging across all areas and issues
• focussed in terms of already identified key factors for success or key result areas
• What approach should be followed?
• using SWOT headings
• discuss Handout 1.5a “Organisational SWOT Example”
• discuss Handout 1.5b “Area SWOT Example”
• using other headings and then conclude for each heading whether there is an opportunity, threat, strength or weakness (discuss Handout 1.5c “Integrated SWOT Example”)
• using a rating system with pre-determined headings where points are allocated for the organisation or area, and even for each key competitor. Factors can be weighted and an overall score established. (discuss Handout 1.5d “Destination Rating Profile”). The key issue here is establishing the standard for a perfect score.

11
• What are opportunities and threats?
Factors operating in the macro-environment and industry that will (or might) impact favourably or unfavourably on the organisation or area and over which it has little or no control.
• What are strengths and weaknesses?
• factors derived from an absolute (compared to consumer needs) and competitive assessment during “situation analysis” (particularly from financial, planning and organisation analysis)
• sometimes referred to as competitive advantages and disadvantages. In this sense they are relative strengths and weaknesses (areas where we doing better or worse than our competitors)
• results that follow from asking .....”what do we need to do to do well”, “have we got those things” and “are we doing them better than the competition”?
• strengths provide defences against attack, springboards for offensive action, power-bases for increased bargaining power in buying and selling
• weaknesses open up areas of vulnerability to attack
• How can SWOT factors be linked?
Discuss Handout 1.5e “Linked SWOT Example”
• identity statement
• this defines the existing and desired future character of the area
• ties in with image. Image is the face that is presented. Identity is the real thing. Great care should be taken not to unduly overstate image above the real identity. This will only lead to consumer dissatisfaction.
• care should also be taken to define and shape identity
• identity is what helps establish uniqueness
• an identity statement for an area or a product is part of the concept and provides great impetus to communication effectiveness in the planning and operational stages and to all development and marketing effort.
• key issues
• these will emerge during the situation and SWOT analysis stages

12
• an issue is a cue for a problem or opportunity that must be defined and addressed. The issues prompt the problem-solving process.
• try to develop pro-active responses to issues rather than re-active. Sometimes threats are opportunities in disguise (eg the can manufacturer that diversified into waste management)
• the quality of our response often greatly influences competitiveness
• key external issues must be managed like projects
• development priorities
• these may now be apparent from
• inventory analysis
• market analysis (visitation and visitor)
• other relevant plans by external organisations
• SWOT analysis
• clarification of identity
• distillation of key issues
• there may still be room for creative product innovation on an individual or group basis
• Class Exercise 9 (say 60 mins)
• refer to the following sections of Handout 1.1 “Regional Tourism Planning Study”
• “Stage 2 - Competitor analysis”
• “Stage 2 - preliminary situation and SWOT analysis
• “Stage 4 - Final situation and SWOT analysis”
• “Stage 4 - Product portfolio and positioning analysis”
• “Stage 4 - Strategic alliance strategies”
• “Stage 5 - Draft strategy definition”
• “Stage 5 - Draft marketing plan definition””
• “Stage 5 - Product package evaluation - retail & wholesale”
13
• “Stage 5 - Draft strategy report preparation”
• “Stage 7 - New packages - consumer research”
• “Stage 7 - New packages - trade research”
• “Stage 7 - New packages - test marketing”
• discuss the theory of these sections and their possible application or relevance to the area discussed in previous exercises.
Learning Outcome 2
Propose a product development plan for an existing or proposed tour operator for a selected town, suburb, city or region.
Assessment Criteria
2.1 Evaluate product development options for the area including an assessment for each of the following:
• past and projected demand patterns;
• past and projected competitor activity;
• target market visitor profiles;
• opportunities for packaging and networking;
• preliminary costs and income.
2.2 Review existing corporate business and marketing plan parameters, taking into account compatibility with the following:
• business mission;
• business objectives and strategies;
• business capabilities;
• financial budgets.
2.3 Select or reject product concepts, using the following processes:
• listing, weighting and scoring using relevant evaluation criteria;
• summarising the main advantages and disadvantages of each proposal (option);

14
• choosing the best proposal (option);
• deciding the optimum course of action, staging and timing.
2.4 Formulate a management report designed to secure senior management approval for the project including manually prepared budgets for cost, time and quality.
Content
2.1 Screening product development options for an area
• Class Exercise 10 (say 30 mins)
• list some product options for the area discussed in Learning Outcome 1 (use Handouts 1.1 & 1.2 if necessary)
• include a natural attraction, a man-made attraction, a tour product (Handout 2.1 “3 Day Bus Tour - 40 pax” may be used as the product to concentrate class discussion on) and an accommodation product.
• outline the steps that will be followed in this learning outcome to prepare learners for class discussion (and Assignment 2). Explain that during the presentation of each step time will be allocated for a short discussion about how the theory might be applied in practice.
• past and projected demand patterns.
• As discussed in learning outcome 1
• Include consumer research results (if any) on
• the strength of consumer acceptance and buying intentions of your own existing product and competitive product offerings
• prospective preliminary consumer reactions to prospective changes in product and other marketing mix variables
• an understanding of benefits in terms of stated needs and underlying psychological needs
• past and projected competitor activity.
The marketing information system must include surveillance of key competitor
• marketing mix strategies and financial performance
• products as revealed by
• brochures
• actual product held for analysis (or inspected)

15
• features and benefits analysis
• value analysis
• competitive comparison should be systematic. Each feature offered, whether it be functional or aesthetic, must be assessed in terms of its reason for existence.
• each component part of the whole product has to be justified. What is it there for? What value (part of the overall price) might consumers place on this part?
• might there be a better way of providing value by decreasing the contribution some components make to the overall product and shifting the cost saved into other features? Value analysis is a technique that applies the decision-making process to the fundamentals of design.
• value for money comparisons. Higher prices must be justified in terms of perceived strengths (by the consumer) in distribution, promotion, image, reputation etc
• retail and wholesale price information (preferably copies of price lists)
• promotion details (sales force deployment, advertising, promotion, public relations etc)
• details concerning distribution (key wholesalers, retailers and agents)
• financial reports (credit information, annual reports, newspaper reviews etc)
• this information must be supplemented with
• consumer research measuring consumer attitudes to competitive offerings (product, price, promotion and distribution)
• comparative strengths and weaknesses analysis with own marketing mix variables (preferably with a rating system approach)
• distributor research of attitudes concerning relative strengths and weaknesses, particularly in terms of perceptions about consumer needs and satisfaction.
• target market visitor profiles
As discussed in Learning outcome 1
• opportunities for packaging and networking

16
As discussed in Learning outcome 1
• preliminary costs and income
Alternative ideas and concepts need to be screened loosely at first by asking such questions as
• assuming it worked, how big would the market be?
• what might incremental income be?
• what might incremental costs be?
• would it satisfy our pre-determined minimum return on investment?
• how great is the risk?
2.2 Relate concepts to existing corporate business and marketing plans
Similar material is presented in “Product Development Co-ordination” and “Business Plan Management” and is provided here to alert training providers to this fact and to provide a foundation for class discussion. Where it is obvious that these concepts need to be presented or revised then this should be done by application to the product concept being examined in class discussion.
• business mission
• this is a component of the business planning process under the heading “Vision” (Where do we want to go?)
• A mission statement defines the organisation’s role and its basic reason for existence and helps establish vision, direction and scope and also provides an image of the desired future character of the business in the future
• It includes a business definition in product and marketing terms which defines the scope of operations. An important aspect to consider is if the business definition is too wide in scope (beyond our resource capability) or too narrow (and we might miss opportunities)?
• It addresses the following questions
• “Who are our customers?”
• “Why do they buy?”
• “What benefits do they derive from our products and services?”
• “What products, services and technologies are we involved with?”

17
• “How are we unique?”
• “What sets us apart from the competition?”
• Some tourist organisations are part of a cluster eg in one city there might be a tourist development agency, a convention marketing agency, a convention centre, a city council interested in tourism etc. In these cases it will be helpful to explore the roles of each to ensure the role of your organisation fits and there is no duplication etc
• Class Exercise 11 (say 30 minutes)
• Distribute and discuss Handout 2.2 “Product Concept Screening Check-list”.
• Relate this check-list to a selected product concept relevant to the area discussed in previous exercises.
• Objectives
• These are estimates of desired future results
• Linked to assumptions (eg assuming the market for 3 star accommodation decreases by 10% next year our objective for room occupancy is 75%)
• Quantitative objectives (by time and extent) include market share, industry ranking, sales growth, sales (quantity and value), new technology and product introduction, return on investment, liquidity, security etc. Sales can be broken down by products, industries, markets, countries, territories and types
• Qualitative objectives might include statements about environmental and social responsibility, continuity of effective management and image
• Objectives without resources are delusions
• Conceived and developed upwards and downwards
• Revise business definition and mission statement
• strategies
• this component is part of the business planning process under the heading of “direction” (How and when are we going to get there?)
• Strategies are major courses of action that give significant leverage to the achievement of objectives

18
• Strategies provide guidelines for the development of organisational design. In this sense it is a common rule that strategy precedes structure.
• The strategy process is sometimes described as looking
• First at what we might do
• Then at what we can do
• Then at what we must do
• And lastly at what we will do
• Strategies are often translated into key programs and projects and usually involve
• Changing the thrust of the business
• A high level of risk
• Higher and longer term commitment of resources
• Higher level of management co-ordination
• The value of the concept of strategy is that top management will focus appropriate time on the broad courses of action, the master-strokes, that will, because of their scope and leverage on objectives, will capture the imagination of the management team and clarify the whole business planning process. Otherwise proposed actions of strategic importance will get lost in the myriad of plans, tasks and issues. There has to be a sense of priority.
• Each proposal for improving performance should be screened as to its % impact on net profit and ROI and a priority list developed accordingly
• Successful strategies are not an automatic by-product of detailed business planning processes but result from managers who can out-think, out-plan and out-play their competitors, always thinking and acting about “the 3 C’s”, customers, competitors and company
• Finding customers and meeting their needs
• Developing competitive advantage
• Building on existing strengths
• Gap closing strategies
• What does gap-closing mean? A gap is the difference between the objectives desired for future performance and the level that is

19
likely to be reached if the existing momentum of the business is sustained without a major change in direction or resource allocation eg “Our objective is to achieve an ROI of 20% by the end of Year 3. On our present course we might achieve 10%. Even if we fine tune our plans and budgets we won’t be able to close that 10% gap.”
• Gap-closing refers to the art of re-defining strategy to find new ways of doing business to reach desired objectives by emphasising strategic thinking. The greater the gap, the greater the challenge for strategic management.
• In many Australian business situations the old ways of doing business are not working and in many cases survival is at stake. Hence the quest for new ways, new directions in business planning and re-structuring.
• There are six alternative ways (growth strategies) to close the gap
• Improve current momentum by fine-tuning existing products , markets and processes
• Radical internal improvements eg re-structuring to achieve greater decentralisation, flatter organisational structures and greater commitment through contractual arrangements
• Improve market penetration with existing products into existing segments
• Develop new markets (ie entering new market segments)
• Develop new products
• Diversification
• The last four of these growth strategies are often described in table form. Such a table is called a “product/market matrix”, a “growth matrix” or a “growth grid”. Presentation of this grid can be a useful aid for stimulating discussion and providing a systematic framework for analysis because it forces management to consider all the possibilities and to get “outside the square” of traditional organisational thinking.

20
MARKET P R O D U C T
PRESENT NEW
PRESENT
Market Penetration
New Product
Development
NEW
New Market Development
Diversification
• New product and new market development could be in related or
unrelated areas and so an extra row and column could be inserted into the matrix.
• the key criteria for evaluating gap-closing strategies are
• Consistency with the external environment
• Consistency with the internal environment (capability)
• Availability of required resources
• Risk
• Timing
• Market penetration strategies
Involves new ways for existing products in existing segments. These strategies are less risky than new markets and new products and are attractive because they build on strength and experience.
• Stimulate industry demand
• Co-operative industry research and promotion, particularly in the initial stages of the product life cycle (market saturation or penetration curve)
• Market leadership initiatives to demonstrate new ways to stimulate customer usage of the product (these can also help win market share)
21
• Increase the unit size for purchase eg. increasing the size of the package for a product or a organising a package deal for a tourism product or incentives to increase length of stay
• Increase market awareness and the frequency of purchase through price incentives, free coupons, off-season pricing, customer loyalty clubs and promotions
• Reduce product life through planned obsolescence eg reduce product quality to encourage replacement purchase or in the case of tourism activities reduce continuous market offerings to less frequent events
• Find new uses for the product eg
• Eucalyptus oil use extended from massage to inhalation
• Extending the use of a TV monitor for computer games
• Extending passive museum displays of early farming implements into demonstrations at farm holiday locations and/or agricultural festivals
• Win market share from competing products, destinations, towns and regions by improving the marketing mix to support existing product
• Better communication, product positioning, brand identification, image and identity by clarifying role, uniqueness and product benefits
• More effective promotion (sales force, advertising, PR and promotions)
• Price reduction and volume incentives eg price advantages for regular users and families
• Improve profitability from existing customers
• Identify most profitable segments and concentrate resources on them
• More focussed promotion (eg more selective sales prospecting, more targeted advertising and direct mail) and distribution (eg targeted agents or wholesalers) to these segments
• Maximise contribution by trading volume for price increases
22
• Value adding involving adding product and/or service benefits where the incremental price provides a much higher margin eg existing product gross profit mark-up is 50% but we increase the price by $20 where it only cost $10 to provide the new benefits resulting in 100% mark-up in incremental terms.
• Market penetration strategies
Involves new ways for existing products in new segments.
• Enter or open up new geographical segments - regional, interstate or overseas through licence agreements, joint ventures, new agents, new offices, servicing from the home office
• Enter or open up other demographic, psychographic and behavioural segments by
• Using new distribution channels eg
• Retail outlets for home use of computer hardware and software (extended from commercial distributors for office use)
• Marketing holidays through the Internet and compact disks
• Advertising in new media to reach new segments
• Raising price to attract prestige buyers in higher segments
• Lowering price to attract price conscious buyers in lower segments
• Offering try before you buy sample promotions to non-users
• Finding new uses for new users eg promoting a farm for farm holidays
• Product development strategies
• Product enhancements
• “Facelifts” involving aesthetic changes to maintain product image and newness/freshness
• New features and activities to encourage re-purchase and repeat visitation from existing segments

23
• Extended new features to appeal to new segments eg extra facilities for children to tap the family market
• New products
• Fundamental upgrades to existing products eg
• A major overhaul of the function and aesthetics of an existing product involving new materials, new components, new packaging
• Major renovations and re-building programmes
• Extension of the product line eg
• New products at the top end and bottom end of the product line to increase sales and protect existing products from competitive threats
• Land acquisition of adjoining sites for increased accommodation and/or activities
• Developing new product lines that complement the existing product line
• Major new products eg resort, theme park, tourist village
• Diversification strategies
To illustrate these strategies assume we are running a business as a tour bus operator.
• Vertical integration
• Forwards (towards the customer) - eg we could start up or buy a business such as a tour wholesaler, travel agency, restaurant, retail outlet or even a finance company to help facilitate sales
• Backwards (towards the supplier) - eg we could start up or buy a motor repair workshop, a bus body-building and assembly factory or a fuel distribution outlet.
• Horizontal integration - involves starting up similar businesses under different brand names or buying competitors eg taking over another bus operator
• Capitalising on existing field strengths. For a business selling products through a strong distribution or sales-force network there is an opportunity to sell other different products using these strengths. Eg our bus operator might have strong contacts with

24
tour wholesalers and decide to promote (for a commission) other tourism products through this network with package deals etc
• Capitalising on financial and/or management and/or locational strengths by starting up or buying a completely different business
• business capabilities
As discussed in Learning outcome 1 in the topic “SWOT Analysis”
• financial budgets
Corporate financial budgets need to be examined to clarify normal cost and profitability parameters
2.3 Selecting product concepts
• product positioning analysis
Similar material is presented in CMTR3 Product Development Co-ordination and SMTR 6 Business Plan Management and is provided here to alert training providers to this fact and to provide a foundation for class discussion. Where it is obvious that these concepts need to be presented or revised then this should be done by application to the product concept being examined in class discussion.
Positioning involves a matching process between positions sought in the market place (target markets) and positions in the industry product line. It involves linking rationally thought out positions on the demand side (which is called “consumer positioning”) and on the supply side (which is called “competitive positioning”)
• competitive positioning
• the industry product line can be segmented in several ways
• by size categories
• by price categories
• by type of material (or functional approach) categories
• by feature categories
• by benefits (consumer need categories)
• the object of this sort of analysis is to determine our competitive position on the supply side to see if there is a prima facie case for changing our product line, by filling gaps and/or adding to the depth and width of our product line. The analysis should show

25
areas where we are competitively strong or weak and areas of competitive opportunities or threats.
• one approach in competitive positioning is to use the “top-of-mind” position of an industry leader as a frame of reference for product development and comparative advertising eg “Jamaica...the Hawaii of the south”, “7-Up...the un-cola”, “Brand X....more space than Brand Y”
• sometimes in tourism we are constrained by the type of product we have and do not have a great deal of freedom to identify market gaps and design product to suit eg we might have a seaside location with a unique character that would be destroyed by a “Disneyland” or high-rise hotel product even if we believed the market potential was there for such products
• the final step in competitive positioning is to communicate product benefits to the target market by comparing them with the competition.
• consumer positioning
• we have already said that market segmentation and targeting seeks to conserve and optimise resource allocation by directing marketing effort to defined segments.
• products must be positioned to match defined target markets by communicating product benefits to meet the already identified needs of these target markets.
• consumer positioning associates the product with needs in a specific or general way
• specifically, by seeking to establish direct links between consumer benefits and product features
• or generally, by establishing an appealing image or setting that suggests that benefits sought will be matched by the features offered
• positioning helps build brand identity and “top-of-mind” positions in the consumers mind. These positions can be established on the basis of real benefits offered or by imagery and symbolism.
• consumer analysis of perceptions of brands or products can help define our current consumer position and desired future position. This is done by a process known as “perceptual mapping”. Consumers are asked in a research setting to rate products on the basis of benefits eg food products might be

26
rated using the following scales... nutritious, natural, requires little preparation, good for snacks, economical, good to serve guests, good tasting, low calorie. Cluster analysis groups these responses and a map is then drawn to show brand positions in terms of benefit categories.
• sometimes two dimensional scaling using two selected attributes can help map positions eg
• in the map below we could place Queensland in segment 2 and perhaps South Australia in segment 3. South Australia would like to position itself in segment 1, a “boutique” segment to position itself competitively against the “mass-market” segment 1.
High differentiation
1 2
Low High
Volume 3 4 Volume
Low differentiation
• in the map of the car market below we could place Mercedes and Rolls Royce in segment 1, BMW and Porsche in segment 2, Magna and Commodore in segment 3 and Torana and Honda in segment 4.
High class and pride of ownership
1 2
Conservative Fun
Older appeal 3 4 Younger appeal
Practical, affordable, economical
other scaling for tourism might be high price/low price and high experiential/low experiential etc
• Portfolio analysis

27
Similar material is presented in CMTR3 Product Development Co-ordination and SMTR 6 Business Plan Management and is provided here to alert training providers to this fact and to provide a foundation for class discussion. Where it is obvious that these concepts need to be presented or revised then this should be done by application to the product concept being examined in class discussion.
• Portfolio analysis is an analytical and prioritising process for comparing a collection (portfolio) of different businesses and/or product groups and allocating resources between them according to their fit with markets and organisational capability in order to maximise future profit potential.
• It borrows thinking from the stock market where investors have a portfolio of shares in different companies
• It is a logical extension of SWOT analysis and could be completed in part at that stage of business planning, certainly as far as existing businesses are concerned.
• It is designed to avoid problems of an unbalanced portfolio such as
• Poor profits, cash flow and growth through having too many losers ( a losing problem)
• Management indigestion and cash flow pressure resulting from excessive growth through having too many winners (a winning problem)
• Boston Consulting Group Grid
• Products, product groups or strategic business units are placed on a grid consisting of four categories…stars, cash cows, question marks and dogs
• Strategic business units (SBU’s) are areas of the organisation which can be grouped together according to a common strategic factor eg locational centres, customer groups or technology areas (inc product groups )

28
• A grid is developed with growth rate on the vertical axis and relative market share on the horizontal axis
Growth Rate Market Share
HIGH LOW
HIGH
Stars
Question Marks ?
LOW
Cash Cows
Dogs
Stars - high growth, high share, need funds, best profit potential
Cash Cows - low growth, high share, generate funds, already profitable
Question Marks - high growth, low share, need funds, discontinue if share can’t be increased
Dogs - low growth, low share, need funds, candidates for divesting
• Surplus operating funds from “cash cows” and divestment funds from “dogs” should be used to support the “question marks”.
• Be careful not to over-invest in “cash cows” when they are in the mature stage of the product life cycle
• Before divestment of “dogs” takes place
• An “out-of-pocket” analysis should be done to answer the question “what profit contribution would stop and what overheads could be avoided?”
• Unavoidable fixed costs would have to be spread over the remaining product groups or SBU’s

29
• The final divestment analysis would have to consider
• The amount of management resources that are committed to maintaining the “dog” and whether a higher return on management time might be generated in other areas
• The risk of bad consumer experiences with the “dog” affecting other products
• Portfolio analysis assumes that products have a long-term growth curve (product life cycle). Products start off in the early stages as question marks, perhaps then enjoy faster growth as stars, become cash cows which must be milked the growth slows down and as market maturity is reached and then dogs as the market enters long-term decline
• McKinsey Product Portfolio Grid
• Developed in association with General Electric
• Related to the SWOT Analysis because it looks at the external and the internal environments
• Uses more market criteria than market growth including industry/market size and growth and factors concerning market quality, supply and competitive structure, industry profitability and other aspects of the external environment.
• Refer to Handout 2.3a “Market Attractiveness Check-List”).
• Uses more organisational capability criteria than market share including SBU or product group size and growth, relative market share and position, margins and profitability, manufacturing and technological position, strengths & weaknesses, image, pollution and human resource capability. It is important that the factors selected for analysis are of industry significance and could just as easily apply to any competitor. However, the scoring system is based on relative advantage.
• Refer to Handout 2.3b “Competitive Advantage Check-List”).
• The McKinsey grid analysis will suggest some generic strategies that might be explored based on conclusions whether
we should build, hold or harvest, terms which are almost self-explanatory but which will be explained later.

30
Market
Attractiveness
Relative Competitive Advantage
LOW MEDIUM HIGH
HIGH
Hold
Build
Build
MEDIUM
Harvest
Hold
Build
LOW
Harvest
Harvest
Hold
• The position on the grid for each SBU or product group is plotted using the % scores obtained from the check-list analyses
• Scoring is by % . Low means 0-33%, medium 34%-67%, high 68%-100%
• It might be more helpful to construct the grid with 10 rows and 10 columns so that each may be labelled 10%, 20% 30% etc
• Any SBU or product group falling into the “build” zones of
the grid are attractive for investment and growth strategies.
• The objective is to sustain the competitive advantages and competitive position and ride the market wave
• Tactically we would build on strengths and overcome weaknesses and try to erect barriers to market entry
• Cash flow might be weak in the short-term but would be expected to strengthen in the medium to long term
• Attractiveness depends on taking a longer term view hence medium to long term planning is essential

31
• Any SBU or product group falling into the “harvest” zones
of the grid are attractive for milking or divestment
strategies.
• The objective is short term cash flow
• Tactically we concentrate on rationalisation, productivity, re-structuring etc to build cash flow
• Any SBU or product group falling into the “hold” zones of
the grid are attractive for selective strategies.
• Top left grid position (high attractiveness, low advantage). Here we must choose between selling out or continuing to invest)
• Middle grid position (medium attractiveness and advantage). Here we should consolidate and develop a contingency plan to invest or sell with clear decision points linked to future changes in attractiveness and/or advantage.
• Bottom right position on the grid (low attractiveness and high advantage). Here we must hold our position for milking with offensive and defensive strategies.
• The concept of “synergy”
• Synergy occurs where, through a combination of business activities, the results are greater than the total would have been if each were pursued individually with separate organisations.
• The concept is often expressed as “2 + 2 = 5” where the combined return is greater than the sum of the individual parts. Eg
• In military terms a cavalry unit and an infantry unit working together might achieve more than both units working separately. Unity creating greater strength
• Two similar organisations merge and rationalise their overhead structure producing significant savings and/or greater market strength
• Two organisations spend $1m each on research and development. One has a strong brand and the other doesn’t. Both companies merge. Apart from rationalisation savings now the full $2m spent in R & D will enjoy the benefits of brand strength.

32
• Sometimes the promise does not live up to the reality. An organisation might pursue a takeover target on the basis of planned rationalisation to get a 2 + 2 = 5 effect but the takeover underestimates the human resource issues, complications arise during implementation and the result becomes 2 + 2 = 3.
• After the generic strategies have been identified we must look for synergy between the selected strategies. The strengths in one area might help and therefore add weight to the case for another SBU or product group eg
• In production or operating
• In research and development
• In brand identity
• In distribution
• SWOT analysis verification
• The exploration for synergy uses the SWOT analysis also as a reference point
• Although the generic strategies selected from the portfolio analysis are refined by synergy analysis they still need to be verified against the situational realities revealed by the SWOT analysis, particularly in reference to the key factors for success in the industry and long term trends identified in the external analysis
• Expression in marketing strategy
• The selected strategies have to be translated into marketing terms for implementation purposes otherwise they will remain as theories without application.
• This is the interface between business planning and marketing planning for organisations with more than one product group and/or business unit
• Each product group and SBU needs a marketing strategy as a basis for a marketing plan. Strategy precedes detailed planning in all areas.
• The “build” generic strategy (risk-accepting investment and growth strategies)
• Segmentation - new segments

33
• Positioning - brand proliferation, re-positioning
• Differentiation - facelifting and major upgrades
• Pricing - offensive and defensive
• Promotion - targeted, brand-building, active
• Distribution - expanding penetration/coverage
• The “harvest” generic strategy (risk-avoiding milking or divestment strategies)
• Segmentation - concentration on key areas
• Positioning - consistent
• Differentiation - productivity rationalisation
• Pricing - discourage price drift
• Promotion - decrease awareness promotion
• Distribution - concentrate and start culling
• The “hold” generic strategy (risk-limiting selective strategies)
• Segmentation - consolidate/defend key segments
• Positioning - clarify communication
• Differentiation - specialisation and rationalisation
• Pricing - more aggressive
• Promotion - concentration and strengthen brand
• Distribution - more selective
• Competitive response analysis
• The last step in portfolio analysis before we finally select our strategic priorities is, like in warfare or chess, to assess the likely competitor reactions to the chosen strategies.
• Where the situation warrants, it may be helpful to conduct a portfolio analysis for each key competitor as a basis for considering moves and counter-moves

34
• Role-playing may be beneficial where one player moves and then the other with both explaining their reactions to the others’ move and the rationale for their own moves.
• remaining steps in the problem-solving process
The design and development process follows the problem-solving process in that we start off with an initial appreciation, then formulate the objectives (define the problem), then evaluate the alternative design approaches, choose the best design strategy and plan the necessary activities and resources, then implement and review performance. Key steps for product planning include:-
• listing, weighting and scoring using relevant evaluation criteria
• summarising the main advantages and disadvantages of each proposal (option)
• choosing the best proposal (option)
• deciding the optimum course of action, staging and timing
• feasibility analysis
• The new product development process was discussed in CMTR 3 Product Development Co-ordination and is presented here in summary form. It usually involves 8 stages, namely Idea Generation, Preliminary Screening, Design Brief, Preliminary Business Analysis, Development, Final Business Analysis, Market Testing, Commercialisation.
• “Idea Generation” and “ Preliminary Screening” concepts have been applied in the sections above. Screening is often assisted with a rating form (sometimes called an “evaluation matrix” or “rating profile”) which lists criteria in rows with a rating scale in columns. The rows might include the headings in Handout 2.2 or be along the lines of the functional headings used in Handout 2.3c “Evaluation Matrix Criteria”
• “Design Briefs” are used when significant development is anticipated. Too many products and projects either start off without a clear brief or at the other extreme start off with a pre-conceived design (sometimes copied) or a far too detailed specification both of which leave little or no room for design creativity
• The purpose of the design brief is to set broad parameters to guide the design process and to establish criteria for design evaluation. Product designers, architects, engineers and other professionals should not commence design without an agreed design brief. Furthermore, management should never accept a sketch design or detailed perspective’s and site plans etc before the design brief is completed.

35
• Design briefs should be driven primarily by market and finance considerations and should include the following components:-
• Strategic guidelines eg
• is this a facelift or are we looking for innovation?
• is significant innovation desired?
• what quality and leadership standards might apply?
• do we have to use existing tooling?
• is there a concept brief?
• Operational guidelines eg
• expected sales release or opening date?
• estimated volume per annum? (this might influence the process technology and materials used)
• what assumptions should we make about market product life?
• is the volume associated with other products in the product line relevant?
• do we need a cost constraint eg it should cost no more than....?
• is service a critical factor?
• who is the product being designed for? What consumer research do we have about the target market (prospective users)?
• Functional guidelines eg
• what are the prime functions (features providing to user benefits) and secondary functions?
• what psychological needs are relevant?
• how important is it to “look good” versus “perform well”?
• Competitive guidelines eg
• who do we have to be “better than”?

36
• can we set competitively based quantified standards in prime functional performance areas?
• The design brief provides the objectives and background for the designer to follow. The designer then considers alternative concepts or design strategies, analysing each before they are discarded, and then presents the recommended design approach to management. The recommendation has to be justified and the designer should also be required to explain alternatives considered but rejected. This is to guard against shallow and/or non-creative design thinking.
• Management should assess the design against the criteria contained in the brief and complete a financial appraisal.
• Management must not be unduly swayed by high-powered professional presentations and concentrate on content more than style at this stage. They must remain objective and ensure that the design strategy provides the best fit to organisational and consumer requirements.
• “Preliminary Business Analysis” includes
• marketing assessment
• design assessment
• comparison with design brief
• may include matrix analysis (including scoring and rating).
• product life cycle assumptions
• size, structure and behaviour of the target market
• intended consumer and competitive positioning
• sales, market share and profit goals sought
• intended price, distribution strategy and marketing budget
• long-run profit goals and probable marketing mix strategy over time
• financial assessment
• evaluate income, cost and funds projections
• evaluate financial returns and risks
• human resource assessment

37
• “Development” for new products that have reached this stage covers project planning, detailed drawing, materials selection, materials specification and costing, process technology, methods engineering, tooling, prototype development and testing, competitive comparisons, definition of resource requirements and final costing
• for a building or property development projects this stage includes developed designs (from the sketch designs in response to the design brief), project planning, detailed drawing, materials selection, materials specification and costing, engineering and construction technology, methods engineering, model development and concept testing, competitive comparisons, definition of resource requirements and final costing
• “Final Business Evaluation” follows the approach set for the preliminary business evaluation. A final “evaluation matrix” or “rating profile” (see above) might also be completed at this stage, which includes scoring and weighting. This stage assumes all the justification, quotations, agreements, costing, pricing etc has been put in place to such an extent that firm contracts and other arrangements will follow smoothly after approval to the final feasibility study is given, without any surprises.
• after approval all planning assumptions, income, costs, funds and time estimates etc should be locked into business plans, marketing plans and most importantly, budgets. The same figures used for approval must be used for performance evaluation. A common error is for projects to be approved with one set of figures and assumptions and different ones are used later on for planning and budgeting.
• “Market Testing”. In some cases it is possible to test a restricted version of the product with the market before sales release involving exposure of the product for consumer and/or trade research. For example with the first production run of a new product, with a mocked-up motel unit off-site for an accommodation project before construction on site commences. In other cases a test market sales release might be held to minimise risk, to resolve unanswered questions or perhaps just to fine-tune the major sales release eg a test market product release in one area or capital city , release of Stage 1 of a development project, preferably with a contingency plan if things don’t go according to plan
• “Commercialisation”. This is the last stage but there is still plenty of room for failure to occur through unforeseen events and if consumer and trade responses fall below expectations. The implementation plan for marketing and operations must be thorough. The monitoring plan must detect variations to expectations in key pre-determined areas eg competitive responses. The organisation must be prepared to cut its losses in the event of poor performance. There is an old saying the first loss is the cheapest loss. If you persevere in hope in spite of commercial

38
realities the losses are usually far greater than those you would have had if you had the courage to get out when the first signs of failure started to show. Often it is wise to have a contingency plan eg alternative use of all or part of the facilities, a quick sale rather than a “distressed” sale, sale of part of the project to a joint-venture partner who has strengths to overcome the imminent problems, suspend and shelve the project until more favourable conditions occur.
If the product or project is going to plan then it has to be managed through the product life cycle stages. In the introduction stage profits may be low or negative, competitors few and promotion should focus on developing market awareness. In the growth stage sales will start to climb, new competitors will probably enter, prices should probably be maintained, profit margins will peak and growth should be sustained by manipulating the marketing mix. The maturity stage presents the greatest challenge for marketing to be prepared to pursue market modification (find new buyers for the product), pursue product modification (change product characteristics such as quality, features and style to attract new users and/or more usage), pursue marketing mix modification (altering one or more elements of the marketing mix). In the decline stage the main tasks are to identify weak products, determine marketing strategies ( abandon part or all of the market or devise continuation, concentration or harvesting strategies) and to drop or sell the product.
2.4 Formulate a management report
• this is designed to secure senior management approval for the project
• it should include
• an executive summary (prepare this last, say 1 page)
• rationale for the project
• development stages and time plan
• implementation staging and responsibility summary (detail to be covered in Leaning Outcome 3)
• a manually prepared budget
• Class Exercise 12 (say 30 mins)
Discuss a management outline report for the product chosen above.

39
Learning Outcome 3
Design an implementation plan for the nominated tourism product, using a simple computerised project management package.
Assessment Criteria
3.1 Propose a selected computer package based on the following factors:
• brochure inspection;
• on screen tutorial;
• study of manuals.
3.2 Prepare inputs for the nominated project, include the following:
• detailed activity list and priorities;
• input resource requirements.
3.3 Prepare a management report containing the following factors:
• analysis and presentation of the computer output;
• integration with the previously approved management report including comments on the planning variations for time, cost and quality;
• a clear briefing on the organisational, individual and project team responsibilities for the project.
Content
3.1 Computerised project management
• on-site computer resources
• the aim of this learning outcome is to develop awareness of computerised project management packages and a basic level of skill in activity entry, time scheduling and resource allocation. The more complex aspects of these packages should be avoided.
• the preferred software is Microsoft Project. Learning providers are encouraged to organise access to a computer resource room where Microsoft Project has been installed.

40
• the version used for these notes is Microsoft 4.
• a more detailed coverage of project management using Microsoft 4 is included in learning module STR7 Project Co-ordination.
• brochure inspection
• before the Learning Outcome commences learners are required to visit a software dealer and obtain brochures (and demonstration disks if possible) of at least 2 project management packages, one of which must be Microsoft Project
• this is required as preparation for class discussion and for Assignment 3.
• copies of a wide range of brochures might be held to facilitate class discussion
• on screen tutorial
• to be explained and followed in the computer resource room
• study of manuals
• manuals to be provided in computer resource room
• manuals and selected “how to” books are to be made available in learning resource centres
3.2 Inputs for the nominated project
• detailed activity list
• set up the file with
• the start date (File, Summary Information)
• the timescale (Format, Timescale), say major timescale in months and minor timescale in weeks
• enter the activities for the project selected in Learning Outcome 2 (say Handout 2.1 “3 Day Bus Tour”). It will help if learners work on the same abbreviated list of say 2 stages and no more than say 20 activities.
• note that an example of an activity list is contained in Handout 1.1. In this project the activity headings were entered in Microsoft Project 4. The detailed descriptions were of course not entered. Learners should be encouraged to make manual notes in point form in the same way of the detailed work to be done, to guide the planning and implementation process and to help provide realistic time and resource commitments.

41
• make the first line “Total Project” then indent the second line for “Stage 1”, then enter Stage 1 activities, then enter a line for “Stage 2” and enter Stage 2 activities etc
• enter “duration’s” at the same time and watch the “Gantt chart” on the right of the screen grow.
• practice adding, deleting and indenting activities
• input resource requirements
• establish resources using Insert-Resources menu or Resource Assignment icon.
• enter resource initials on work sheet eg JS for John Smith, or HB,JS for Harry Smith & John Smith
• use the menu selection “View-Resources” to check for overloading etc
• PERT analysis
• very often in practice you will be asked for a “critical path” for your project. This can be displayed using separate colours and fonts in the Gantt view and also in the PERT view.
• look at the menu selection “View-PERT Chart” and consider what this chart is telling you about your project
• it is helpful to revise the theory of PERT analysis. PERT stands for planning (P) evaluation (E) and review (R) technique (T) and helps determine priorities within a project and between projects
• PERT analysis grew out of simple Gantt charting which showed lines
for each activity without connections. Instead PERT shows a plan systematically as a network of activity lines or steps to be carried out simultaneously to achieve programme objectives for time, cost and quality.
• It identifies the “critical path” which is the longest time path through the network and the most critical chain of activities to be managed. Other activities will therefore have some time slack if they are not included on the critical path
• The network defines events, activities, constraints and resource use
• Where the activities are familiar, time estimations are more certain and pre-determined standards based on prior experience can be used (eg building and construction)
42
• The technique for time estimation in conditions of uncertainty where pre-determined time standards for activities are not available is worth studying
• Optimistic (say 5 months)
• Realistic, most likely (say 7 months)
• Pessimistic (say 15 months)
• Allocate probability weights to each eg say a factor of 1 to optimistic and pessimistic and 4 to realistic (which is the same as saying .16 .16 and .66 respectively)
• The expected average (mean) time is 5 + (4 x 7) + 15 which is 48 months divided by 6 ( weights 1 + 4 + 1) equals 8 months
• The level of uncertainty is measured by standard deviation
• The maximum range of the probability distribution lies between the optimistic and pessimistic estimates which is 10 months.
• Divide this by the sum of the weights, 10 divided by 6 equals 1.67 months
• Compare this with the mean to measure the level of uncertainty, 1.67 compared to 8. This is useful for comparing with expected or tolerable levels of uncertainty. The higher the level of uncertainty the greater the need for management.
• The latest date for completion for the whole project or programme is determined and then, by working backwards along the critical path using the activity times (see above) the latest completion dates are determined for each event. Critical events have no slack because there expected and latest completion dates are the same. Other non-critical activities will have slack (that is, their expected date occurs before the latest completion date) and will need less management attention.
• PERT budgeted and actual costs are calculated for PERT activities by allocating appropriate cost codes
• Much of the value of PERT is in the initial planning stages and so it represents a valuable planning tool even without its significant control benefits
3.1 Management report

43
• analysis of the computer output
• make sure there is no overloading of resources
• try “View-Resources”, “View-Calendar”, “View-Reports” in order to review your project and make any necessary changes
• presentation of the computer output
• practice printing different “views” on your screen (use “Print Preview” before-hand)
• integration with the previously approved management report
• discuss how the printed output integrates with the management report discussed in Learning Outcome 2
• discuss how the computer program might cope with reporting on costs, actual times and variations (skills development in this area is not required)
• human resources
Discuss how a project team for this project might be assembled, briefed, activated, measured and managed.
Learning Outcome 4
Propose a management audit of planning and implementation processes and performance for a selected, completed major tourism development project (eg. a resort or hotel).
Assessment Criteria
4.1 Review the business planning rationale for the project.
4.2 Review the product planning process from concept to final decision including the following factors:
• concept clarification and validation;
• design brief;
• evaluation procedure for alternatives;
• rationale for selected alternative;
• environmental impact analysis.
4.3 Review the implementation plan for time, cost, quality and contract documentation.

44
4.4 Prepare a post completion appraisal based on interviews with the key players listed below:
• client(s);
• financier(s);
• planning authority;
• town planning consultant;
• developer;
• project manager;
• builder;
• architect;
• engineer.
4.5 Review the project team-work effectiveness in relation to:
• the overall success of the project;
• processes used to deal with key issues;
• planning and implementation roles and outcomes.
Content
• Introduction
• this learning outcome requires application of the concepts discussed in Learning Outcomes 1,2 & 3 to a major hotel or resort project.
• as such, most learning activity will be conducted away from the class-room during Assignment 4.
• a small amount of input should be provided
• on environmental impact assessment
• on feed-back after the assignments have been completed and assessed under the following headings
• Business Planning Review
• Product Planning Process
• Implementation Plan
• Post Completion Appraisal
• Project Team-Work Effectiveness
• Environmental Impact Assessment

45
• this will no doubt have been presented in other modules and so a brief presentation only is made
• Class Exercise 13 (say 120 mins)
• discuss Handout 4a “Check-list of environmental factors for tourist developments”
• discuss the relationship between Handout 4a and Handout 4b “Site Selection Criteria for Tourist Developments”
• discuss Handout 4c "Needs and roles for environmentally sensitive tourism developments”
Learning Outcome 5
Discuss the major aspects required for feasibility approval of a proposed major tourism development project.
Assessment Criteria
5.1 Analyse the marketing rationale for the project, taking into account the following:
• target market definition;
• target visitor profiles;
• supporting market research;
• proposed market research;
• location and site selection.
5.2 Estimate the level of community support, taking into account the following factors:
• existing community based tourism planning procedures;
• content and value analysis of community attitudes of project supporters;
• content and value analysis of community attitudes of project antagonists;
• analysis of planning authority policies and requirements;
• content and value analysis of political party interests;
• analysis of developers pro-active strategies.
5.3 Analyse the concept approval process, taking into account the following factors:

46
• economic impact criteria used;
• environmental impact criteria used;
• effectiveness of negotiating process including steps to reconcile economic versus environmental issues;
• developer economics.
5.4 Justify the developer’s plan for planning and feasibility approval.
Content
• introduction
• this learning outcome requires application of the concepts discussed in Learning Outcomes 1,2,3 & 4 to a major tourism development project.
• as such, most learning activity will be conducted away from the class-room during Assignment 5.
• a small amount of input should be provided on
• the level of community support
• the concept approval process
• on feed-back after the assignments have been completed and assessed under the following headings
• the marketing rationale for the project
• target market definition
• target visitor profiles
• supporting market research
• proposed market research
• location and site selection.
• the level of community support
• the concept approval process
• learning materials for this section include
• Handout 5a “Enrico’s Investments”. Part of this case study is used in SMTR 6 Business Plan Management. It has been expanded in this learning module to include more details related to the proposed Barossa resort development.
• Handout 5b “Enrico’s Barossa Retreat” is a spread-sheet for the proposed resort development that integrates with Handout 5a.

47
• “The Hotel Development Process” by Tony South in pages 161-181 of the publication edited by James Blackwell, 1988, The Tourism & Hospitality Industry”, International Magazine Services. This publication is now out of print and so this article (or any other article in these Blackwell books) may be freely copied.
• the level of community support
• existing community based tourism planning procedures
• many communities are now considering a pro-active approach to town planning based on “micro” approaches. Workshop activity helps define the desired future character of the town or area and alternative development proposals and strategies are then considered
• community leaders ensure that the local tourism operators explain their views and co-operative efforts
• this process is harnessed by local government “physical planners”
• the community then proceeds to ensure that appropriate promotion and investment attraction strategies are put in place.
• a most innovative model for community based tourism planning is set out in “Community Tourism Action Plan Manual”, Province of Alberta, Canada. These manuals are provided to local communities and the contents consist of
• Book1 - Introduction. This poses and explains several basic questions for communities to address
• what is tourism?
• where do we fit in?
• who benefits?
• who doesn’t benefit?
• is it for us?
• Book 2 - Organisation. This book has two main purposes
• It asks communities to consider whether they want to encourage tourism locally

48
• It explains how they can organise to do it. It gives direction on developing a tourism policy and establishing a tourism action committee.
• Book 3 - Process. This focuses on developing a tourism action plan in a step-by-step “how to do it” way including
• what a tourism action plan is
• the role of the action committee in the planning process
• present and potential tourism markets
• tourism assets and concerns
• tourism goals and objectives
• tourism action steps
• local government and public involvement
• tourism action plan implementation procedures
• review procedures
• Book 4 - Appendices. Includes background information to help with the plan and a sample plan to illustrate the process.
• Worksheets. This contains blank charts and work-sheets to help get started.
• Guidelines and Application Forms
• content and value analysis of political party interests and community attitudes of project supporters and antagonists
• the project concept often has to be “sold”. Just as we have a marketing plan to introduce and manage a product so to we must have a marketing plan in other key areas eg
• an investment attraction or funding plan
• a “communications” strategy and plan to secure agreement from key players (politicians, councillors, lobby organisations etc)
• the keys to effectively “market” a proposal to external key players are targeting, research, policy analysis and lobbying.

49
• effective policy analysis, development and resolution requires definition and rationalisation of underlying logic. Foundational to all policy analysis is the question of needs and values. We must be able to reasonably present the justification for our position and to be able to challenge the pre-suppositions of other’s in order to explore win/win solutions.
• the process for developing an argument (policy development) is as follows:-
• Question: Pose a question “Should we..........”
• Policy or action: What should we do? Develop a policy statement “We should.....”
• Observations: Why? What do we know? Define the “facts” supporting the policy “Because.........”
• Value judgments: So what? What does it mean? Describe the underlying value judgments “and because
we value or believe........”
• Assumptions: Why does it mean that? State your underlying assumptions “and we believe this because
we are assuming .............”
• Identification: Examine the whole argument to see if it makes sense. Can you identify with it? What are the opposing views? Try to identify with an opposing view and develop a similar type of argument
• SWOT Analysis: Examine the two views and pick out the strengths of each
• Resolution: With these strengths try to develop a more comprehensive and inclusive policy statement and support for it. As a last resort try the qualified proposal “We should do that unless..........or on condition
that......”
• try analysing positions in depth eg
• I want a tourism qualification. Why? For promotion. Why do you believe that? I’ve seen that people with advanced qualifications in tourism get promoted. Why
do you want to be promoted? To increase my standard of living and to develop my full potential. So what, why
those values? Well I believe that’s the way it is, and that’s the way it should be.....we are born to become the best we can, we must capitalise on our opportunities.

50
• I believe workers have a right to know their company’s goals. Why? Because it increases their ability to have control over their lives. So what? They have a right to know and a right to control. Why should they have these
rights? Because it helps develop maturity and moral responsibility and that is the essence of who we are. We ought to be morally responsible and be able to make choices. Its part of growing up and enjoying life to the full etc
• Class Exercise 14 (30 mins)
• divide the group into two for a debate
• the proposition is that “a high-rise observation tower on top of the mountain overlooking the city is a good thing, particularly because part of the income will help support environmental management”
• the subject matter should relate only to environmental issues including environmental impact vs visitor enjoyment of the environment
• analysis of planning authority policies and requirements
• local planning authorities normally have general objectives as well as objectives for specific zones
• general objectives often provide a useful “umbrella” for tourism development eg
• “shopping centres should be properly located to serve the day to day needs of the permanent and holiday populations”
• “facilities for tourists and holiday-makers are to be encouraged in appropriate locations”
• “developments that improve the environment, heritage or exiting character are to be encouraged”
• progressive councils have “tourism commercial” or “tourism development zones”.
• most councils permit a wide range of tourism uses under other zone headings.
• some planning authorities have precedence over local government. eg in watershed zones. These authorities often have

51
lengthy planning requirements that must be considered and satisfied. Their plans are often based on lengthy studies of regional strategy covering a wide range of objectives (including tourism) and management requirements necessary to achieve these objectives.
• analysis of developers pro-active strategies
• Developers more and more now accept that protection of certain environments is a commercial concern
• Developers' responsibilities
• Flora and fauna: clearance and damage, exotic species, fire risks, wildlife movement, wildlife destruction
• Biodiversity: loss or change of habitat, species loss, sensitivity to climatic change
• Soil: loss of productivity, erosion, compaction, contamination
• Air, noise and water: exhaust, electricity, noise, diversion of water, sewage
• Waste production: litter and solid waste, sewage, chemicals.
• Energy use: transport, services, construction.
• Cultural: loss of sites, loss of identity.
• New lessons for developers
• in the early development stages identify the key concerns likely to be raised by the local community, environmental bodies and the local competition. Being forewarned is to be forearmed and this allows the developer to proactively seek solutions to issues before they become problems.
• make sure that plans submitted are seen as concepts which need discussion and refinement. Do not pre-empt the solution. Do not identify your preferred outcome too soon.
• identify those areas where compromise is possible and those where compromise will have a major and detrimental impact on returns.
• start environmental studies early to have the facts ready for discussion and to avoid misconceptions being perceived as “reality”.
• know where to draw the line...strength, honesty and clear articulation. Silence and lack of information can be taken as arrogance and lack of concern for the community.
• identify responsibilities for development approvals
• developers would prefer to work with one co-ordinating agency in each State who would have the responsibility of guiding and assisting the developments through the approval process.

52
• the concept approval process
• developer approval
• much wasted time, effort and resources can be avoided by the simple process of concept screening. This has been dealt with before as part of the new product development process.
• for major projects, particularly those with a significant environmental impact, the concept screening should include
• mission / purpose / role / identity statement
• target market criteria
• financial criteria
• strategic criteria (market attractiveness, capability etc)
• economic impact criteria
• environmental impact criteria
• Class Exercise 15 (20 mins)
• discuss the following case incident
• a developer has just purchased a small tropical island and instructs her architect to prepare detailed plans for a resort on the island. After an overseas study tour the architect has prepared detailed drawings for a high rise hotel to cater for the international market. The developer requests further research. The main conclusions of this research are that firstly, the design will not cater for the target market (which would prefer a low-rise village style development) and secondly, that significant opposition to a high rise approach is expected from the Australian Conservation Foundation and the State Opposition. A national TV reporter has just contacted the developer seeking comment.
• planning approval
• this topic has been discussed above
• again, there is no point preparing detailed management plans and designs for presentation to planning approval authorities if the concept is flawed

53
• developers seek to have the ground rules clearly established before too many resources are committed. There is benefit too for the decision criteria to be followed to be established before-hand.
• the problem in the public approval process is that the matters are often very complex with very few able to take an overall view.
• one attempt to reconcile views at a concept stage has been developed by the author called “MEESIA”....a Matrix for Economic, Environmental and Social Impact Assessment. This would allow major projects to be selected and compared.
• Class Exercise 16 (say 30 mins)
• Discuss Handout 5c (“Meesia”) and try to apply the rating system to a major controversial project, choosing the key factors and allocating section and overall weights.
• Discuss the desirability and likelihood of all parties agreeing and committing to the factors and weights at the concept stage on the basis that approval in principle will be given for an score of at least 7.
• whilst we can’t easily imagine such a process being adopted in that form by all parties, it does at least attempt to make the process more objective. The essence of the process is however essential........all interested parties should weigh in with their views and give unconditional or conditional approval at the concept stage.........and in so doing the decision-making criteria can be established and adhered to.
• some attempts might need to be made at negotiation, particularly in reconciling economic and environmental views. The challenge is...how can we make developers more environmentally and socially conscious and how can we make environmentalists interested and concerned about the economic issues.
• final project justification
• for feasibility approval
Class Exercise 17 (say 30 mins)
Prepare an “executive summary” of the main points that hypothetically might be used to justify the development of “Enrico’s Barossa Valley Resort” as far as management and investors are concerned.

54
• for planning approval
Class Exercise 18 (say 30 mins)
Prepare an “executive summary” of the main points that hypothetically might be used to justify the development of “Enrico’s Barossa Valley Resort” as far as the following groups are concerned.
• the local community
• the local tourism industry
• regional and State tourism and economic development authorities
• a well organised State-wide conservation lobby concerned about destruction of the rural environment and the “carrying capacity” of natural areas used to support major tourist attractions

55
Assignment 1 (refers to learning outcome 1)
Propose a product development plan for a selected town, suburb, city or region.
1. Discuss the key strengths and weaknesses of existing inventory/infrastructure of a given town, suburb, city or region, taking into account the following factors:
• natural and built attractions
• activities for seeing, doing and learning
• accommodation
• access
• ancillary infrastructure and services 2. Complete a visitation analysis for the abovementioned area, taking into account the following factors:
• past visitation statistics (given timeframe)
• rates of growth and reasons for same
• projections (including assumptions) for next five years
• graphical representation of past statistics and projections
• possible ways to stimulate visitation. 3. Complete a visitor analysis for the area, include the following factors:
• study recent visitor surveys
• prepare a quantitative profile of visitors
• prepare a qualitative profile of visitors 4. Evaluate the existing town and/or regional planning policies and proposals. 5. Prepare a product development plan for the area and include the following ........ factors:
• SWOT analysis
• an identity statement defining the desired future character of the area
• key issues, problems and opportunities
• the development priorities
Group Assignments
This assignment may be completed individually or by groups of 2-5 learners. The content will vary according to group size as follows:-
Each topic should be no more than 2000 words. Individual Any one (1) topic from topics 1-5. (maximum size 2000 words) 2 learners Any two (2) topic from topics 1-5. (maximum size 4000 words) 3 learners Any three (3) topic from topics 1-5. (maximum size 6000 words) 4 learners Any four (4) topic from topics 1-5. (maximum size 8000 words) 5 learners All five (5) topics. (maximum size 10000 words)

56
Assignment 2 (refers to learning outcome 2) Propose a product development plan for an existing or proposed tour operator for a selected (from assignment 1) town, suburb, city or region. 1. Evaluate product development options for the area including an assessment for
each of the following:
• past and projected demand patterns;
• past and projected competitor activity;
• target market visitor profiles;
• opportunities for packaging and networking;
• preliminary costs and income. 2. Review existing corporate business and marketing plan parameters, taking into
account compatibility with the following:
• business mission;
• business objectives and strategies;
• business capabilities;
• financial budgets. 3. Select or reject product concepts, using the following processes:
• listing, weighting and scoring using relevant evaluation criteria;
• summarising the main advantages and disadvantages of each proposal (option);
• choosing the best proposal (option);
• deciding the optimum course of action, staging and timing. 4. Formulate a management report designed to secure senior management approval
for the project including manually prepared budgets for cost, time and quality.
Group Assignments
This assignment may be completed individually or by groups of 2-5 learners. The content will vary according to group size as follows:-
Each topic should be no more than 2000 words. Individual Topic 1 only. (maximum size 2000 words) 2 learners Topics 3 & 4 only. (maximum size 4000 words) 3 learners Topics 1, 3 & 4. (maximum size 6000 words) 4 learners All four (4) topics from topics 1-4. (maximum size 8000 words) 5 learners All four (4) topics from topics 1-4. (maximum size 10000 words) The management report should be 4000 words instead of 2000 words.

57
Assignment 3 (refers to learning outcome 3) Design an implementation plan for the nominated tourism product (in assignment 2), using a simple computerised project management package.
This assignment may be prepared individually or in a group but assignment submission s must be presented individually as originals and duplication of content and style is to be avoided. Maximum presentation length is 4000 words.
1. Propose a selected computer package based on the following factors:
• brochure inspection;
• on screen tutorial;
• study of manuals.
2. Prepare inputs for the nominated project, include the following:
• detailed activity list and priorities;
• input resource requirements.
3. Prepare a management report containing the following factors:
• analysis and presentation of the computer output;
• integration with the previously approved management report including comments on the planning variations for time, cost and quality;
• a clear briefing on the organisational, individual and project team responsibilities for the project.

58
Assignment 4 (refer learning outcome 4)
Propose a management audit of planning and implementation processes and performance for a selected, completed major tourism development project (e.g. a resort or hotel). 1. Review the business planning rationale for the project. 2. Review the product planning process from concept to final decision including the following factors:
• concept clarification and validation;
• design brief;
• evaluation procedure for alternatives;
• rationale for selected alternative;
• environmental impact analysis. 3. Review the implementation plan for time, cost, quality and contract
documentation. 4. Prepare a post completion appraisal based on interviews with the key players
listed below:
• client(s);
• financier(s);
• planning authority;
• town planning consultant;
• developer;
• project manager;
• builder;
• architect;
• engineer. 5. Review the project team-work effectiveness in relation to:
• the overall success of the project;
• processes used to deal with key issues;
• planning and implementation roles and outcomes.
Group Assignments
This assignment may be completed individually or by groups of 2-5 learners. The content will vary according to group size as follows:-
Each topic should be no more than 2000 words. Individual Topic 2. (maximum size 2000 words) 2 learners Topics 1 & 2. (maximum size 4000 words) 3 learners Topics 1, 2 & 3. (maximum size 6000 words) 4 learners Topics 1, 2, 3, & 4. (maximum size 8000 words) 5 learners Topics 1 - 5. (maximum size 10000 words)

59
Assignment 5 (refers to learning outcome 5)
Discuss the major aspects required for feasibility approval of a proposed major tourism development project. 1. Analyse the marketing rationale for the project, taking into account the following:
• target market definition;
• target visitor profiles;
• supporting market research;
• proposed market research;
• location and site selection. 2. Estimate the level of community support, taking into account the following factors:
• existing community based tourism planning procedures;
• content and value analysis of community attitudes of project supporters;
• content and value analysis of community attitudes of project antagonists;
• analysis of planning authority policies and requirements;
• content and value analysis of political party interests;
• analysis of developers pro-active strategies. 3. Analyse the concept approval process, taking into account the following ............ factors:
• economic impact criteria used;
• environmental impact criteria used;
• effectiveness of negotiating process including steps to reconcile economic versus environmental issues;
• developer economics. 4. Justify the developer’s plan for planning and feasibility approval.
Group Assignments
This assignment may be completed individually or by groups of 2-5 learners. The content will vary according to group size as follows:-
Each topic should be no more than 2000 words. Individual Topic 1. (maximum size 2000 words) 2 learners Topics 1 & 2. (maximum size 4000 words) 3 learners Topics 1, 2 & 3. (maximum size 6000 words) 4 learners Topics 1, 2, 3, & 4. (maximum size 8000 words) 5 learners Topics 1 - 4. (maximum size 10000 words, which includes an extra 2000 words for an overall summary)

60
EXAMINATION
WAGON’S HO!
A well known media personality, Mick Dundee, has regular “bush tucker” spots on a TV travel show. He has developed a strong personal following and there have even been some “feelers” for his involvement in overseas TV through some large networks. One of his dreams however has always been to lead outback horse and wagon adventure tours. He is able to gain exclusive access (in return for a 5% royalty) to aboriginal lands through a childhood aboriginal friend who is now chairman of the community council. The area contains not only the most remote aboriginal settlements in Australia which are still involved in traditional hunting and food-gathering, but also the most beautiful country with majestic mountain ranges, wide rock-strewn river-beds, deep billabongs and lush semi-tropical vegetation. Fortunately a network of old tracks exists to the major spots of interest as a result of past mining activities. Mick approached you for some ideas. You are a tourism consultant and your first step was to summarise (after much discussion) the product concept, which now follows. Wagons Ho! Is to provide a soft adventure holiday using four-wheeled wagons, each pulled by two Clydesdale horses. Each wagon would carry four adult passengers or two adults and three children plus driver. Each wagon would be fully equipped with quality camping equipment to provide maximum comfort and enjoyment. The wagon concept would provide a new way to experience the Australian bush and capture the pioneering spirit as families and/or groups trek leisurely along bush tracks, through forests and over grassy open spaces at a pace slow enough to relax and really experience the natural beauty of the Australian environment. Groups would leave on a Friday night from a country town base, travel via 4 wheel drive coach to the “The Homestead” (a restored shearing shed and shearers quarters built in the 1860s) and overnight there. Next morning the wagons would be hitched up (with everyone taking part) together with a string of horses for those that want to tag-along or to combine horse-riding with wagon travel. From there to “Dreaming Rocks”, about 14 kilometres away, along a track that follows and regularly crosses a river-bed. The river flows for about 6 months of the year but is normally low enough to cross. This is excellent camping country and well off the beaten tourist track. Next day the wagons trek to “Billy Goat Lagoon” to camp, finishing up mid to late afternoon in plenty of time for traditional campfire ceremonies involving aboriginals at a nearby camp. Arrangements are in place to use local aboriginal custodians as tour guides for the extended treks through a Conservation Park for up to five days. These venture up to 20 kilometres into the Park, which consists of rocky ridges, fertile valleys with large red gums and golden wattles. Camping within the confines of the Park had been arranged at Stags Camp, an outback oasis. There is a short climb to the top of Goose Hill for a magnificent view of the surrounding countryside and an old chrysoprase mining site.
Prepare a short management report summarising what the consultant’s next product
development steps might be.

61
REGIONAL TOURISM PLANNING STUDY HANDOUT 1.1
OUTBACK SA (Author, Bill Wright)
I. Desired Study Objectives
The outback region in the Far North of South Australia has great potential for domestic and international tourism. It is one of the most important tourism regions in the State containing many unique natural features with great potential for the emerging eco-tourism, nature-based travel and special interest markets.
There are a number of development initiatives required if the region is to achieve its tourism potential focussing on improving visitation, yield, product and infrastructure.
Specific objectives for the study to achieve these aims have been set as follows:-
• To identify development opportunities for new and upgraded products and packages particularly for eco-tourism and special interest tourism
• To encourage sustainable tourism development that reflects and reinforces the character, culture and natural features of the region
• To identify existing barriers to successful tourism development and to identify solutions
• To determine the tourism opportunities that would maximise the use of the existing infrastructure within the region, particularly major settlements
• To devise strategies which should encourage private sector investment in tourism development within the region.
• To provide a direction for the preparation of business and marketing plans
II. Desired Outcomes
In order to give expression to these objectives the following outcomes are anticipated:-
• Specific product packages for sale and distribution to the retail and wholesale markets to be trialed in major domestic and international markets with assistance from the South Australian Tourism Commission;
• Detailed marketing and strategic directions for the development of tourism in the Northern Tourism Marketing Board area;
• An action plan to address the major tourism product and infrastructure gaps;

62
• Identification of the infrastructure required to support investment and to provide for and manage the impact of visitors;
• Objectives and strategies to achieve economic and environmental sustainability;
• An implementation strategy that identifies the program of works and actions, organisational responsibilities and timelines;
• Draft guidelines for tourism development in the region.
III. Required Study Program
The study program should be developed around eight stages. Estimated times are shown for each activity and stage.
Study Hours
· Stage 1 - Briefing July 1995 24
· Stage 2 - Research July/August 1995 268
· Stage 3 - Public Consultation August/September 1995 105
· Stage 4 - Strategic Analysis August-September 1995 82
· Stage 5 - Draft Strategy September/October 1995 190
· Stage 6 - Public Review November/December 1996 163
· Stage 7 - Market Validation December 1995 - January 1996 186
· Stage 8 - Final Strategy January 1996 66
STAGE 1 - BRIEFING
3 activities, total 24 estimated study hours.
Steering Committee Meeting 1 - Briefing (say 6 study hours)
• The structure for membership of the steering committee is one member of the eco-tourism project Steering Committee, two representatives selected by the Regional Marketing Board, one representative from the Department of Environment and Natural Resources and one representatives from the Tourism Commission who should chair the Committee.
• Finalise all details of the project with the Steering Committee prior to commencing the project
• Receive the latest documentation on tourism marketing strategy prepared by the Commission and the Regional Marketing Board.

63
• Discuss the study program in general terms and note any key factors in terms of priorities, content and process that need to be added or varied, particularly for Stage 2.
Industry organisation briefing (say 16 study hours)
Each of the above organisations is to be visited
• to receive any further strategy, planning and budgeting documentation prepared by them.
• to discuss organisation structure and relevant job descriptions
• to discuss a list of key contacts and industry members for database preparation.
• to discuss the study program and steps involving their organisation
Public notification (say 2 study hours)
• The public consultation process is detailed under Stage 3 and Stage 6 headings below.
• Appropriate letters and advertisements should be prepared notifying industry members and the general public about a series of meetings to be held in various locations during the public consultation phase.
• It is recognised that communication is a key component in the study and all publicity material should be designed not only to inform but also to enthuse the target audience.
STAGE 2 - RESEARCH
14 activities, total 198 estimated study hours.
Computer data base - references & contacts (say 40 study hours)
• A computerised database should be established for both references and contacts.
• All the existing reference material and documentation relevant to the study should need to be perused and catalogued.
• Contact information (e.g. name, address and other details) should need to be recorded for each relevant individual and organisation, to ensure the widest possible reach for communication material and for survey questionnaires. .
Tourism market analysis (say 20 study hours)

64
• All relevant statistical and market reports should be studied and evaluated in order to get a clear picture of market profiles, trends, segments, competitive behaviour and problem and opportunity areas.
• A summary of market information gaps should also be prepared.
Analyse existing consumer & trade research (say 20 study hours)
• Relevant quantitative and qualitative surveys should be studied including relevant overseas material relating to eco-tourism and nature-based tourism, etc.
• Information gaps relevant to the project area should also be identified.
New consumer & trade research - focus groups (say 40 study hours)
• From a planning and marketing point of view the identification and satisfaction of consumer needs is paramount.
• The study must allow for some additional consumer and trade market research, by way of interview, to explore motivations and the range and depth of consumer attitudes concerning image and product preference, particularly for the interstate and overseas traveller.
• Some of this research should be carried out in key destination areas and some in the nearest capital cities.
• Should a more detailed survey be considered necessary in the future, this must be outlined in the strategy recommendations.
Tourism inventory analysis (say 40 study hours)
• A comprehensive tourism inventory analysis is required for each product and location category with cross-references to the target markets served and visitation and yield being generated.
• Objectively assess the natural and built features of the area to determine cultural, heritage and eco-tourism opportunities.
• Consequent development concepts must be studied in line with traveller trends, heritage and ecological interpretation and visitor management.
• Proposed projects (mooted or approved) should also be examined and conceptually screened as to their fit with existing target marketing and product strategy documentation.
• Where a reasonable prima facie case exists for their inclusion, additional development concepts should be noted.
Existing strategy research - tourism (say 5 study hours)

65
• All the relevant planning documentation, performance indicators and trends which might affect the region must be researched and considered at this point and input into the process for joint understanding and evaluation.
Existing strategy research - economic development (say 5 study hours)
• Some economic development workshop and planning activity has already been conducted in the region and the results should be studied as part of the process.
• In addition State and regional economic strategy plans must also be analysed.
Existing strategy research - environmental & development planning (say 20 study
hours)
• A full environmental audit is not anticipated
• Instead there must be a focus on the key issues for sensitive areas (including carrying capacities) as well as for the project area as a whole.
• Part of this assessment should include the management and funding considerations for environmental protection and upgrading and appropriate policies and objectives for land use planning and zoning. It is anticipated that the "user pay" issue should emerge during the public consultation phase and a full understanding of the costs involved is essential.
• Particular attention should be given to the definition of desired future characters for key tourism zones and to principles for guiding planning and development in these areas.
Industry organisation research (say 12 study hours)
• It will be necessary to re-visit the industry organisations mentioned in Stage 1 (and others) to be fully informed about what has been done in the past and what is planned for the future.
• An assessment of the effectiveness of each organisation in terms of performance achievement against objectives and goals and perception about the organisation's standing and credibility among organisation members ( perhaps using survey techniques) should be made.
Competitor analysis (say 10 study hours)
• A comparison should be made of the project area’s strengths and weaknesses relative to other regional and interstate competitive locations in order to help develop a unique competitive product offering.
• The opportunities for developing a co-operative approach with adjoining areas in order to expand the market further must also be considered.
Issue research (say 10 study hours)

66
• The study of documentation in previous steps, along with further research, interviews and discussions should help generate a list of issues which can be defined and analysed for later use, particularly in preparation for workshop activity.
• Care should be taken not to pre-empt the rights and opportunity for workshop attendees to brainstorm and develop their own issue statements. However, prior preparation should help workshop facilitation..
Preliminary situation and SWOT Analysis (say 20 study hours)
• A situation analysis should be prepared by distilling the analyses prepared in the previous steps including:-
• a summary of the market situation from the marketing analysis by looking at the demand and supply situation and history
• the underlying determinants of demand should be listed and weighted for the total market and for each important segment.
• on the supply side, a summary of the major factors at work including competitive positioning, investment attraction, infrastructure funding and industry organisation structure and effectiveness.
• three scenarios of future demand (optimistic, realistic and pessimistic) with relevant assumptions.
• A preliminary SWOT analysis should be prepared listing in a preliminary fashion the relevant strengths, weaknesses, opportunities and threats for the area for potential use during the public consultation phase, again without pre-empting the attendees right and opportunity to participate in a "clean sheet" SWOT analysis, and later in a survey to validate SWOT conclusions.
Stage 2 report - progress & plan (say 20 study hours)
• Report to summarise activities, key points and remaining work.
• Position papers may be necessary.
Steering Committee Meeting 2 - review (say 6 study hours)
To review the progress report and endorse the plan for the next stage.
STAGE 3 - PUBLIC CONSULTATION
5 activities, total 105 estimated study hours.
• A series of both regional and special interest workshops should be conducted to canvass views about the project and particularly attitudes as to
• whether tourism is seen in a positive or negative light

67
• the mix of tourism and in particular to eco- and cultural tourism
• issues that need to be addressed by the region to ensure that it can increase and control tourism visitation growth
• These issues and ideas should then be considered within a clear business planning framework to arrive at groups of issues, goals and strategies and prioritisation of these into clear actions
• Stakeholders' to be invited should include tourism operators, members of the community in general, local government, (both within, and adjacent to, the area) local or regional development authorities, standing members of State and Federal government, academic institutions, tourist associations, farmers and other resource associations, retailers, commence, banking, etc. parks and local government bodies etc
Key stakeholder workshops (say 9 study hours)
• Separate workshops for key industry members should precede the public workshop.
• It may be necessary also to hold additional workshops with industry groups after the public workshop process to take the findings to a greater depth.
• Discussion and debate on identity / image, key problem and opportunity areas, priorities and alternative strategy definition must be encouraged.
• As the draft strategy develops we should be trying to stimulate the awareness, interest and motivation of the key players to see themselves taking ownership of the plan and process after the study is completed.
• In a sense, we should be marketing the study itself while it is being completed and also examining first-hand the way each organisation works and the need for changes to these organisation structures to drive the process better for the long term.
Public consultation workshops (say 40 study hours)
• This is a key step in the project and essential for community ownership and commitment. The workshop process is a medium not only for input but for establishing communication links and promoting the study.
• In each workshop there should be ample opportunity to discuss strengths, weaknesses, opportunities, threats, existing character, desired future character, community values and concerns, etc.
• Emerging from the discussion should be the identification of key issues.
• Some demographic analysis of the residential population in each area should be completed and any existing social analyses at the local level should be examined.

68
• It is to be expected that issues concerning sustainability will need to be properly addressed and discussed in an objective way in order to help resolve the economic and environmental concerns of the local and wider community.
• If these issues can be identified early enough it may be possible to manage their development and resolution in a way suitable to most people without risking the progress of the study through subjectively based opposition which falls outside the ambit of commonly agreed, desired and sustainable outcomes.
• Strategies for communication and key player involvement should be designed to avoid these risks while at the same time building a positive and creative climate to ensure widespread acceptance and effective follow-through to attain the agreed objectives.
• The nexus between the community's physical resources and the ability of its human resources to respond to the challenges of growth that lie ahead must be recognised.
Issue validation survey (SPSS) (say 30 study hours)
• The issues identified during the industry and public workshops should be defined and presented in questionnaire format afterwards for distribution to the attendees in order to gain a more thorough and objective assessment of attitudes.
• Some of the industry and public participants may not have been properly informed as to the breadth and depth of the issues involved and might value an opportunity to provide additional input in a properly structured and presented way.
• Completed questionnaires should be processed using SPSS software (Statistical Package for Social Sciences) and the frequency and cross-tabulation responses presented accordingly.
Stage 3 report - progress & plan (say 20 study hours)
• A progress report for this stage summarising the activities undertaken and the points to be highlighted together with details of the work plan for the following stage should be prepared and provided to the Steering Committee.
• Part of this progress report might need to be released in the form of position papers to a select wider group for feedback to the Steering Committee, particularly on critical issues, and to help to more effectively plan the remaining stages.
Steering Committee Meeting 3 - review (say 6 study hours)
• Report to summarise activities, key points and remaining work.
• Position papers may be necessary.
STAGE 4 - STRATEGIC ANALYSIS

69
10 activities, total 96 estimated study hours.
Final situation and SWOT analysis (say 5 study hours)
• This should follow a similar process to the preliminary situation and SWOT analysis but should incorporate the findings from the workshops and questionnaires.
• Questions concerning key situational facts and SWOT issues should be included in the questionnaire.
Target market evaluation (say 7 study hours)
• The target market identification and evaluation should flow from the preceding market research.
• Each target market proposed should be screened first using appropriate market selection criteria.
• Target markets that are successfully screened should then be fully described in both qualitative and quantitative terms to facilitate the development of the draft strategy and draft marketing plan.
Infrastructure & environmental analysis (say 5 study hours)
• This does not include product.
• Included are those community assets that help the tourist access the product, e.g. information distribution points, signage, transport, roads, air routes, public facilities, etc. This is traditionally the province of Local, State and Federal government.
• The environmental analysis should summarise the key environmental concerns and priorities identified in earlier steps.
Product portfolio & positioning analysis (say 15 study hours)
• This should be the first attempt to map the market in terms of product fit to target market categories in a comprehensive way.
• The aim should be to identify gaps and niches based on an analysis of the problems and opportunities evident from the matrix analysis.
• Positional strategies that build on strength, overcome weaknesses and establish a clear and identifiable position in competitive and consumer terms should then be developed.
• All development strategies and levels of development should then be properly defined for the next step.

70
• Product packages should be defined as part of this step in a format for later validation.
Alternative scenario definition (say 4 study hours)
• Alternative scenarios based on proposals and levels from the previous step together with the alternatives of future demand, (e.g. optimistic, realistic and pessimistic) should be prepared.
• Each scenario should be described fully together with consequences and impact.
Strategic alliance strategies (say 4 study hours)
• The opportunities to forge alliances with adjoining regions and States should be defined.
• A range of alternatives should be suggested but not analysed in any depth on the basis of negotiations, etc.
• This activity would follow as part of the strategy once the strategy plan is approved.
Investment attraction strategies (say 6 study hours)
• A key to the "yield" aim is to demonstrate existing and potential profitability for operators, developers and investors.
• An investment attraction planning outline should be loosely defined to tie in with the product portfolio suggestions of an earlier step.
Cost benefit analysis (say 10 study hours)
• It should be important to have a descriptive assessment of the costs and benefits of tourism to the community to help in the public review process by clearly defining the economic value of tourism.
• A clear answer to the question "Why tourism?" must be provided.
Stage 4 report - progress & plan (say 20 study hours)
• Report to summarise activities, key points and remaining work.
• Position papers may be necessary.
Steering Committee Meeting 4 - review (say 6 study hours)
To review the progress report and endorse the plan for the next stage
STAGE 5 - DRAFT STRATEGY
8 activities, total 210 estimated study hours.

71
Draft strategy definition (say 18 study hours)
• The draft strategy should be developed from the preceding research, consultation and analysis and should be subsequently modified during the public review and market validation stages.
• The overall strategy should represent a general action plan for applying resources to meet major objectives. Emphasis is on the word 'general'. We define strategy as being a broad course of action designed to gain significant leverage on the achievement of the objectives. A strategy is a way forward, an alternative route in a range of alternative routes to the objective as a destination. It is this feature that distinguishes a strategy from a detailed action plan.
• We are seeking proposals bold in character and vision, broad in scope, of major importance, of a break-through nature ,and preferably achievable with the lowest level of resource input.
• The following questions must be answered in respect to each of the proposed strategies:
Communicability
• is the proposed strategy "identifiable" and "understandable" for the stakeholders?
External fit
• is the proposed strategy consistent with State tourism strategy, the natural environment and market opportunities?
Internal fit
• is the proposed strategy consistent with industry strengths, objectives, policies, resources and values?
• note, each product and market development proposal should be screened as to its impact on the objectives
Risk
• does the proposed strategy achieve minimal risk with maximum yield consistent with resources and prospects?
Alternatives
• has the proposed strategy resulted from a process of objective analysis and incorporate maximum application of imagination and creativity?
• does it respond to defined problems and opportunities?

72
• has there been a careful appraisal and comparison with other alternatives to help establish the key factors for success?
Quantification
• is the proposed strategy measurable in terms of time (not be open ended) and performance?
• can identifiable outcomes and performance parameters be set?
Continuity
• should the proposed strategy be conducive for continual review and planning?
• A series of benchmark review points should be recommended over the next five years, to monitor progress and to facilitate change if necessary, in order to ensure the best continuing outcomes, particularly having in mind that possible changes in key players and personnel in the region.
Draft marketing plan definition (say 40 study hours)
• This should be drawn up to create and promote the identity, image or profile of the area immediately and to work in with product development and projected visitation growth over the 10 year period.
• It should clearly identify target markets and aim very precisely for these, in all recommendations given.
• It should cover the complete marketing mix, not only the traditional positional advertising and promotion, but co-operative opportunities presented through State and Federal tourism agencies, through large hotel, airline or coach companies and through packaging suggestions to inbound operators and wholesalers.
Financial & funding evaluation (say 20 study hours)
• All the major proposals should be individually costed and recommendations concerning their fundability and source of funding should be provided to the best of our ability in the time available.
Product package evaluation - retail, wholesale (say 20 study hours)
• The product packages identified in the "product - portfolio" step should then be tested at a retail and wholesale level to measure immediate reactions and likely product strength.
Draft Strategy report preparation (say 60 study hours)
• This is where the research, public consultation and strategic analysis comes together in one report. The headings for this report might follow the steps in this
73
consultancy schedule with provision of course for objectives and the strategies identified.
• The challenge however is to prepare the report in an easy to follow manner. Whatever format is chosen, answers to the following questions must be provided:
Appreciation
• Where are we now?
• Where have we come from? (inc. current situation and SWOT analysis, past performance review)
Aim
• Where do we want to go and why? (inc. mission / role, general aims, direction, objectives, goals);
Alternatives
• Which ways might we go? (inc. alternative strategies and impact analyses);
Analysis
• Which ways can we go?
Decide
• Which way should we go and why.
Plan
• What, how, who, when, where (action plan and budget);
Organise
• What resources are required (inc. human, physical and financial)
• What are the key roles and responsibilities in the industry organisation structure?;
Staffing
• Who are the key players?
• How well does the existing human resource base and organisation structure measure up to the plan requirements?
• What needs are there for education, training, motivation and development?

74
• Is human resource development / service a key strategy?;
Direction
• Who is in charge?
• Who should be in charge?
• How is the government / private sector partnership going to work?;
Control
• What controls are necessary for the allocation of funds and to review, correct, re-plan and re-budget?.
Stage 5 report - progress & plan (say 20 study hours)
• Report to summarise activities, key points and remaining work.
• Position papers may be necessary.
Steering Committee Meeting 5 - endorsement (say 6 study hours)
To review the progress report and endorse the plan for the next stage
Publicity for public review process (say 6 study hours)
A notice advising of the following public review process should be prepared for insertion into local papers and direct mailed to those on the database.
STAGE 6 - PUBLIC REVIEW
8 activities, total 148 estimated study hours.
Public dissemination & exhibitions (say 15 study hours)
• Copies of the draft strategy would be made available for inspection and comment.
• It may be necessary to establish a "drop in" information area in local government offices in each key local area with suitable display material to provide information about the draft strategy and to help obtain additional comment.
Public workshops (say 40 study hours)
A further opportunity for industry and the public to come together and develop a consensus together.
Public attitude survey (Delphi )- prepare & send (say 30 study hours)
An essential follow-up. Participants in the workshops should be invited to participate in an iterative Delphi process to determine strength of feeling for the various issues raised.

75
Public attitude survey (Delphi) - analysis (say 40 study hours)
This involves processing an analysis of the Delphi generated feedback.
Public attitude study (Delphi) - client review (say 6 study hours)
• The attitude study results would be essential for the framing and acceptance of the draft strategy.
• All stakeholders should have had the widest possible opportunity to express their views in the most systematic and objective way available.
• This should provide some additional comfort to policy makers and legislators. The study should help minimise the risks and maximise the chances for success for the strategy.
Amendments to draft strategy (say 6 study hours)
The attitude study should probably generate opportunities to tune the strategy up further in terms of the desired aims and objectives.
Stage 6 report - progress & plan (say 20 study hours)
• Report to summarise activities, key points and remaining work.
• Position papers may be necessary.
Steering Committee Meeting 6 - review (say 6 study hours)
To review the progress report and endorse the plan for the next stage
STAGE 7 - MARKET VALIDATION
5 activities, total 186 estimated study hours.
New packages - consumer research (say 40 study hours)
• Several small focus groups would be organised just to test immediate reaction and attitude strength to the key development proposals.
• This is not meant to be an exhaustive consumer research study but just to point the way for a wider exercise as part of the implementation work to follow the launch of the new strategy.
New packages - trade research (say 40 study hours)
• This is an essential step. The package must excite the trade and be seen as commercially viable for them.
• Small focus groups may be used but most of the work in this step should be carried out by executive interview.

76
New packages - test marketing (say 80 study hours)
• This step needs to be more fully defined in conjunction with the State tourism authority and depends very much on what findings can be presented.
• The duration for this step should depend also on the test objectives, e.g. if we are looking for a sales response then the duration would be a lot longer. If, however, the test objective is primarily to generate a favourable response to a commercially formatted package (rather than a concept) then this duration would be appropriate.
Stage 7 report - progress & plan (say 20 study hours)
• Report to summarise activities, key points and remaining work.
• Position papers may be necessary.
Steering Committee Meeting 7 - review (say 6 study hours)
To review the progress report and endorse the plan for the next stage.
STAGE 8 - FINAL STRATEGY
3 activities, total 66 estimated study hours.
Final Tourism Strategy - preparation (say 30 study hours)
Final Marketing Plan - preparation (say 30 study hours)
Steering Committee Meeting 8 - endorsement (say 6 study hours)

77
FAR NORTH & COOBER PEDY TOURISM MARKET ASSESSMENT HANDOUT 1.2 (Author Bill Wright)
I. TOURISM IN SOUTH AUSTRALIA
• Between 1985 and 1992 tourism has shown steady growth with an annual average rate of increase of around 2% in the number of visitors to South Australia
• Between 1985 and 1992 the number of international visitors to South Australia grew by 10% pa. while visitor nights grew by 3% pa.
• Overall, the tourism growth achieved by SA reflects national trends of tourism growth. SA has achieved marginally better growth rates as a consequence of the success of some specific special events
• Tourism is an industry with considerable potential for future growth. At an international level the World Tourism Organisation forecasts that
• international tourist arrivals will increase world wide, at an average annual rate of 4.2% during the 1990s
• for the Asia / Oceania Region the annual average rate of growth in tourist arrivals will be over 8%
• Australia is well placed to capture a significant share of this market
• SA is positioned to capture emerging markets with its range of tourism opportunities emphasising close to nature, wildlife and aboriginal cultural experiences.
II. COOBER PEDY PRODUCT
A. Identity / Image
Coober Pedy is in the Far North (Outback) region and provides a distinct opal and outback experience that has found favour with Australian and overseas tourists alike.
South Australia is the opal capital of the world with 95% of the world’s opal being mined in this State. Visitors have a strong interest in opal and there are even opal experiences in the City of Adelaide where visitors can see opal shops, opal manufacturing and videos on opal mining and opal-field lifestyles.
The whole Far North Region offers a large number of scenic, cultural and heritage related attractions with a unique natural landscape, outback lifestyle and significant Aboriginal and European heritage.
Whilst Coober Pedy is a well known opal mining area, it has great strategic significance as a gateway and hub for the Outback, and could in time be compared with Alice Springs in character, albeit on a smaller scale.

78
It certainly will provide a key focus for tourists seeking Aboriginal contact, culture and experience. Coober Pedy has a large Aboriginal population, who with training and community involvement, could become a valuable tourism asset. Furthermore, many Aboriginals live in bush settings quite close by on nearby cattle stations.
Far North tourism has increased considerably with improved accessibility now that the Stuart Highway has been bituminised and also because of an increasing trend for outback/adventure holidays.
2.2 Seasonal Nature
The prime season for holiday visitation is traditionally the winter months (May to October) when the weather provides ideal holiday conditions. This applies to tourists using the Far North as a destination or as a stopover for travellers on their way Further North.
Reflecting this, the peak accommodation occupancy month in the Far North is August (57.4%) with the period May-September exceeding the yearly average (approximately 40%). The worst month is February (25%). In the five-year period 1984-1989 the highest occupancy was in July 1987 with 65.1% and the lowest 19.5% in January 1985.
Caravan parks in the Far North achieve an annual occupancy in the vicinity of 17% which is about the South Australian average.
2.3 Accommodation
In 1992/93 there were 9 accommodation establishments providing 363 rooms. These establishments sold 47,650 nights with an average occupancy of 35.9%, which is comparable to other S.A. country areas.
3. COOBER PEDY VISITOR SURVEY
A visitor survey was carried out by the Office of Tourism Industry Development on behalf of the Coober Pedy Retail Business and Tourism Association. It was conducted in 1993 during August and September and represents strong confirmation for new product development in Coober Pedy.
Some of the highlights of this survey are as follows:
Visitor origin
15.5% of the sample were from overseas and half the sample came from Victoria, New South Wales and ACT. Visitors from Adelaide were 15% of the sample.

79
Visitor Nights
56% stayed one night, 31% two nights and 12% for longer periods.
Activities undertaken
The statistics allow for multiple responses. 77% visited opal mines / displays, 59% visited an underground home, 50% took a town tour, 48% purchased opal, 44% went opal noodling and 30% visited the Breakaways.
Activities enjoyed
46% found visiting opal mines / displays particularly enjoyable, 27% liked the town tour and 20% liked opal noodling. Generally speaking, these percentage responses indicate that there are many opportunities for improvement.
Activities would have liked
This data provides the strongest possible confirmation for recent Coober Pedy new product proposals. Its importance must be stressed. It confirms the South Australian tourism strategy favouring gateway, Aboriginal, ecotourism concepts.
New product proposals should include;
• higher activity for opal mining than just noodling and passive visits to opal mines;
• high contact with Aboriginals, particularly in authentic settings.
Product profile
The visitors agreed that Coober Pedy provided a really different lifestyle (87%), was educational (78%), was not an over-developed place (77%), had lots of things to see and do (75%), loved the wide open spaces (65%) and was the experience of a lifetime (64%). Of some concern however, is that 63% agreed that they would only want to visit Coober Pedy for a day or two. This highlights the need to strengthen the product to encourage a longer stay.
Mode of travel
53% travelled by normal passenger car, 10% by coach, 29% by 4- wheel drive and 1.5% by aeroplane. The high 4-wheel drive percentage augurs well for “tagalong” tours. The low aeroplane percentage would suggest an opportunity, particularly with strong growth rates for Coober Pedy tourism.
Recommend Visit
97% would recommend a visit to Coober Pedy.

80
Satisfaction
71% rated “Range of things to see and do” as good but there were concerns about the quality and value of accommodation and tourism information, etc. There is obvious room for improvement here
Opal Expenditure
The average (mean) expenditure for the sample group was $107. The most common (median) expenditure was $4 and the maximum expenditure $8,500 by one tourist.
4. COOBER PEDY VISITATION
4.1 Domestic
The domestic statistics are collected from the Domestic Tourism Monitor (DTM). Figures earlier than 1988 are not comparable with more recent statistics and therefore the Office of Tourism Industry Development recommends their exclusion. They have provided the following figures:
Visits Visitor Nights
1988/89 50,000 143,000
1989/90 64,000 173,000
1990/91 47,000 133,000
1991/92 52,000 135,000
1992/93 37,000 73,000
The Office of Tourism Industry Development cautions us in the interpretation and use of these figures with the following note: “At the 95%
confidence limit a survey estimate of 50,000 visits is associated with
confidence limits of plus or minus 60%”. The reason for this cautionary note is that these statistics are based on samples and are therefore not reliable. For example, the figure for 1992/93 could easily be plus or minus 22,000 ie. it could be as high as 60,000.
In these circumstances, averaging the visitation statistics over the 5-year period would be more appropriate. The average number of visits over the 5-year period is 50,000 visits per annum and the average number of visitor nights is 130,000. On average, therefore, visitors are staying 2.6 nights.
4.2 Competitive Positioning
As far as competitive positioning for domestic visitation is concerned the figures for number of visits for 1988/89 indicate that Coober Pedy ranked higher than many other towns, however but could not match many of these towns in terms of number of visitor nights. The obvious conclusion from the 1989 statistics was that Coober Pedy had to increase the length of stay of visitors by providing other experiences for tourists. The average nights stay in 1989 was 2.86 nights.
The figures for 1992/93 are more sobering with 37,000 visits, 73,000 visitor nights and an average nights stay of 1.97 nights. By comparison, Coober

81
Pedy visitation seems to have slipped compared with 1988/89 and with other locations. This could indicate statistical error and / or a higher dependence on the state of the economy or even “fear” because of recent backpacker murders.
1988/89 1988/89 1992/93 1992/93
Visits Visitor Nights Visits Visitor Nights
Coober Pedy 50,000 143,000 37,000 73,000 Pt Lincoln 48,000 324,000 46,000 213,000 Glenelg 47,000 275,000 66,000 230,000 Whyalla 45,000 173,000 92,000 394,000 Loxton 44,000 70,000 35,000 103,000 Robe 42,000 181,000 46,000 172,000 Moonta 38,000 77,000 28,000 83,000 Berri 35,000 71,000 40,000 111,000 Clare 35,000 135,000 33,000 108,000
Source: Domestic Tourism Monitor (DTM)
Note 1: The source of the above estimates is the DTM. The data refers to only
domestic visits and nights for persons 14 years and over.
Note 2: Because the DTM is based on a sample survey, caution needs to be
exercised in the way data are used. This particularly applies to data for small
regions / towns.
4.3 International Visitation
Figures are available from the International Visitor Survey (IVS).
In 1989 overseas visits to Coober Pedy (including daytrippers) reached 61,600 (placing domestic and overseas visitation on an equal footing for that year) with 25% of all incoming overseas tourists including Coober Pedy on their itinerary.
By 1992, however, this figure had fallen to 17%, most likely because of the concerns about backpacker safety or alternatively a weakening in South Australian tourism marketing relative to other States (see following figures):

82
INTERNATIONAL VISITATION TO S.A.
1989 1992
Adelaide 91% 222,000 90% 206,600 Barossa Valley 45% 109,900 40% 91,100 Adelaide Hills 43% 104,000 33% 76,100 Victor Harbor 26% 62,300 19% 44,000
COOBER PEDY 25% 61,600 17% 39,900 Hahndorf 24% 58,500 23% 52,900 Cleland Wild Life Park 22% 52,600 14% 31,200 River Murray 20% 48,100 14% 33,100 Mt Gambier 13% 32,400 11% 26,000 Kangaroo Island 12% 29,800 13% 30,800 Flinders Ranges 12% 29,700 11% 24,100 Clare Valley 10% 24,100 7% 15,700 Port Lincoln 4% 9,300 3% 7,100
Note 1: These visitation statistics include “day trippers”, ie. those people
visiting a location without staying overnight. This should be realised when
making comparisons between these statistics and those in paragraph 4.1
above.
Note 2: These figures are contained in the International Visitor Survey
(IVS) and are based on sample data for persons 15 years and over and
should be interpreted with caution on a year by year basis but should be
reasonably reliable when “smoothed” .
The level of overseas visitation to Coober Pedy is comparable to Cleland Wild Life Park, Victor Harbor, Hahndorf and the Adelaide Casino.
The main generating areas of visitors coming to Australia are Europe, Canada, UK & Ireland, USA, Japan, Asia and New Zealand.
Twice as many USA visitors visit the Barossa Valley compared with Coober Pedy, but Coober Pedy is as popular as the River Murray and Victor Harbor. The Japanese like the Adelaide Hills, particularly Cleland Wild Life Park and Hahndorf and find Coober Pedy as popular as the Barossa Valley and Victor Harbor. Visitors from other parts of Asia have a stronger preference to see the Barossa Valley than the Japanese or the Americans and are more disposed to see the Adelaide Hills. People from Hong Kong find Coober Pedy very attractive as do also the Europeans.

83
5. FAR NORTH VISITATION
5.1 Total Visitation
When we combine the statistics referred to below for domestic and international visitation the total picture is as follows:
No. of Visits
Domestic International Total Av.% Inc. pa
1985/86 73,000 8,400 81,400
1986/87 103,000 14,800 117,800 44.7%
1987/88 103,000 22,000 125,000 23.9%
1988/89 130,000 28,900 158,900 25.0%
1989/90 175,000 45,200 220,200 28.2%
1990/91 143,000 42,100 185,100 17.9%
1991/92 165,000 39,800 204,800 16.6%
1992/93 130,000 39,600 169,600 11.1%
Average growth pa.
Over 7 years 8.6% 24.8% 11.1%
Number of Visitor Nights
Domestic International Total Av.% Inc. pa
1985/86 288,000 27,000 315,000
1986/87 375,000 31,000 406,000 28.9%
1987/88 536,000 32,000 568,000 34.3%
1988/89 471,000 33,000 504,000 17.0%
1989/90 646,000 101,000 747,000 24.1%
1990/91 368,200 120,000 488,200 9.2%
1991/92 516,000 173,000 689,000 13.9%
1992/93 451,000 181,650 632,650 10.5%
Average growth pa.
Over 7 years 6.6% 31.3% 10.5%
The total visitation figures over the 7-year period 1985/86 - 1992/93 have shown an average rate of growth of 11.1% pa. The domestic component average rate of growth (see figures below) has been 8.6% pa. whilst international visitation has averaged 24.8% pa. Irrespective of the year to year fluctuations, which are probably caused by the business cycle and perhaps “fear” because of backpacker murders, there is a strong undercurrent of growth. The same is true for visitor nights which over the 7 year period have shown an average rate of growth of 10.5% pa. (domestic 6.6% pa., international 31.3% pa.).
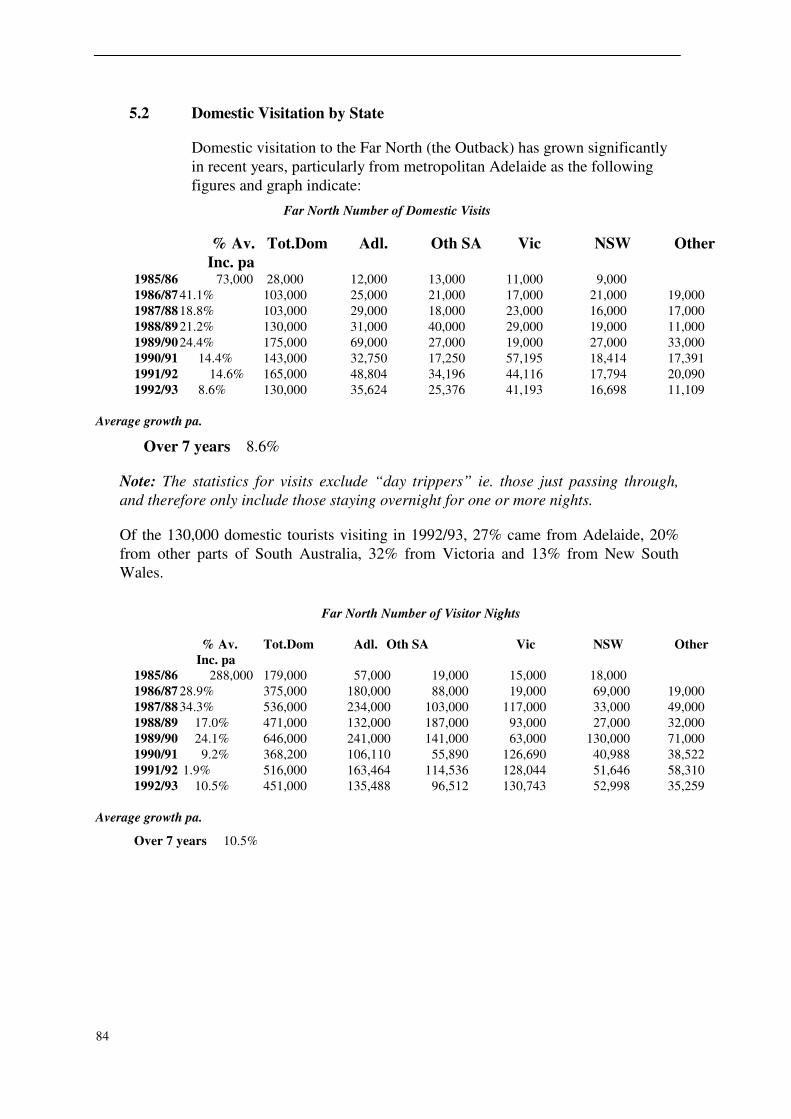
84
5.2 Domestic Visitation by State
Domestic visitation to the Far North (the Outback) has grown significantly in recent years, particularly from metropolitan Adelaide as the following figures and graph indicate:
Far North Number of Domestic Visits
% Av. Tot.Dom Adl. Oth SA Vic NSW Other
Inc. pa 1985/86 73,000 28,000 12,000 13,000 11,000 9,000
1986/87 41.1% 103,000 25,000 21,000 17,000 21,000 19,000
1987/88 18.8% 103,000 29,000 18,000 23,000 16,000 17,000
1988/89 21.2% 130,000 31,000 40,000 29,000 19,000 11,000
1989/90 24.4% 175,000 69,000 27,000 19,000 27,000 33,000
1990/91 14.4% 143,000 32,750 17,250 57,195 18,414 17,391
1991/92 14.6% 165,000 48,804 34,196 44,116 17,794 20,090
1992/93 8.6% 130,000 35,624 25,376 41,193 16,698 11,109
Average growth pa.
Over 7 years 8.6%
Note: The statistics for visits exclude “day trippers” ie. those just passing through,
and therefore only include those staying overnight for one or more nights.
Of the 130,000 domestic tourists visiting in 1992/93, 27% came from Adelaide, 20% from other parts of South Australia, 32% from Victoria and 13% from New South Wales.
Far North Number of Visitor Nights
% Av. Tot.Dom Adl. Oth SA Vic NSW Other Inc. pa
1985/86 288,000 179,000 57,000 19,000 15,000 18,000
1986/87 28.9% 375,000 180,000 88,000 19,000 69,000 19,000
1987/88 34.3% 536,000 234,000 103,000 117,000 33,000 49,000
1988/89 17.0% 471,000 132,000 187,000 93,000 27,000 32,000
1989/90 24.1% 646,000 241,000 141,000 63,000 130,000 71,000
1990/91 9.2% 368,200 106,110 55,890 126,690 40,988 38,522
1991/92 1.9% 516,000 163,464 114,536 128,044 51,646 58,310
1992/93 10.5% 451,000 135,488 96,512 130,743 52,998 35,259
Average growth pa.
Over 7 years 10.5%

85
5.3 Overseas visitation
Overseas visitation to the Far North (the Outback) has also grown significantly:
No. of Visits % Av. No. of Visitor % Av.
Inc. pa Nights Inc. pa 1985 8,400 27,000
1986 14,800 76.2% 31,000 14.8%
1987 22,000 (est) 61.8% 32,000 (est) 8.9%
1988 28,900 51.0% 33,000 6.9%
1989 45,200 52.3% 101,000 39.1%
1990 42,100 38.0% 120,000 34.8%
1991 39,800 29.5% 173,000 36.3%
1992 39,600 24.8% 181,650 31.3%
Average 7 years: 24.8% 31.3%
Note: The statistics for visits exclude “day trippers” ie. those just passing
through, and therefore only include those staying overnight for one or more
nights.
5.4 Coober Pedy Share of Far North Visitation
When we compare the Far North and Coober Pedy visitation statistics, we are able to form conclusions about market share. When we compare the 1988/89 figure of 130,000 domestic tourists visiting the Far North with the 50,000 visiting Coober Pedy the market share percentage is 38%. In 1992/93 the relevant figures are 175,000 Far North visits and 37,000 for Coober Pedy making a market share of Far North visitation at 21%. Care should be taken however by placing too much reliance on the year by year figures when making comparisons. A more reliable conclusion would be to say that over those years an indicative range of 25-35% might be appropriate.
5.5 Survey preferences
Tourism South Australia reports that in a recent sample survey 45% of 191 respondents who visited the Far North (without going to the Flinders Ranges) said that Coober Pedy provided the greatest interest of all Far North attractions. Another group of 230 separate respondents who visited both the Far North and the Flinders Ranges rated Coober Pedy at 27% compared with Wilpena Pound 39%. The next highest ratings for this group were Dalhousie Springs / Mt Dare, Lake Eyre, Oodnadatta Track with 11% - 12% each.
In the overall survey of 757 respondents (which included the 191 and 230 respondents mentioned above as well as 336 who only went to the Flinders Ranges), Coober Pedy rated 20% compared with Wilpena 31%, confirming that it has considerable pulling power.

86
6. FUTURE POTENTIAL
There is considerable potential to develop domestic tourism visitation to Coober Pedy particularly when the State’s promotional strategy emphasising Adelaide as a gateway to the Outback picks up pace and when Aboriginal tourism and ecotourism are more strongly promoted.
Furthermore, there should be a major campaign to increase length of stay by providing stronger attractions and more activities for tourists. Whilst in 1989 Coober Pedy had 38% of Far North visits, it only had 30% of Far North visitor nights. The average night’s stay in Coober Pedy in 1988/89 was 2.9 nights compared with Adelaide 4.2, Glenelg 5.8 and Pt Lincoln 6.8. By 1992/93 the average nights had fallen to 1.97 (37,000 visits to Coober Pedy compared with 73,000 visitor nights) again, underlining the need for a major campaign to reverse this situation (providing the figures are right) and increase the average nights stay to at least 3.0.
Target marketing for Coober Pedy should also include rail passengers enjoying the Ghan Experience. With improved infrastructure at the siding near Mabel Creek Station, improved tourism transport to Coober Pedy, co-operation from Australian National and co-ordinated development and promotion, many more tourists could gain a combined mining town experience along with authentic Aboriginal contact at Mabel Creek Station. Uluru and Alice Springs do not offer a mining experience whereas Coober Pedy does.
There has been strong growth in international tourism in Australia in recent years and the Bureau of Tourism Research is forecasting an average 8% pa. growth to the year 2000. This rate of growth is lower than that experienced in recent years due to a world economic slow-down, escalating Australian travel costs and the absence of key events. Japan is a strong growth market since Australia only attracts 4% of all Japanese travellers, but their average stay is only 5 nights. Coober Pedy would need to tap a longer staying segment of this market to benefit from the strong growth expected from Japan.
The outlook for S.A. tourism activity over the next 10 years is promising. International visitation will continue to increase with improved air accessibility, new product, increased awareness and continued marketing overseas.
Whilst there are some very healthy signs suggesting strong growth there will obviously be limits and constraints to growth, not the least of which will be the carrying capacity of the Coober Pedy township and surrounding environs. The Far North also suffers from the normal problems of distance and lack of facilities. In some towns there are inadequate facilities for tourists, e.g. conveniences, communication and shopping and there is a need for higher standards.
There is a need to improve tourism resources, the quality of visitor experience and length of stay, not only for first time visitors, but also for repeat visitors. This will require an intensified marketing effort to selected target markets, particularly to raise the level of awareness with prospective tourists.

87
There is also a need to improve marketing planning at the grass roots level, particularly through co-operative activity in planning, product development and promotion.
Also on the downside, Australian economic conditions may tend to dampen tourism and S.A. will have to fight harder to win the domestic tourism dollar in an increasingly competitive market. The key is to provide tourism product and services that match consumer needs.
Market research needs to be intensified to ensure that operators understand the main markets and translate tourist needs and preferences into saleable product, without impairing the existing character of the product which is serving so well to attract tourists.
The Coober Pedy product has a good fit with the S.A. tourism product strategy. This strategy emphasises priority themes, particularly experiences that are natural and adventurous, and which provide learning experiences and opportunities to see wildlife in its natural habitat. Coober Pedy should be able to build on its existing strength as a “top of mind” attraction for visitor generation.
7. FORECASTS
7.1 Disclaimer
The information contained in these forecasts is provided in good faith and is derived from sources believed to be reliable and accurate. Readers of this report are advised that the author does not accept any liability for these forecasts. The statements contained herein are of a preliminary nature and are subject to market fluctuations, both nationally and internationally, as well as the capability of tourism operators to effectively manage their operations.
7.2 Far North Forecasting Assumptions
Great care should be taken in forecasts and the following figures are preliminary estimates based more on arithmetical projection rather than a fundamental study of supply and demand which would be necessary for a more reliable study.
Attached are some calculations suggesting what we consider are to be reasonable projections based on the following assumptions:
• that the average rate of growth over the last 7 years (1986/93) period will be sustained due to the product strength and market attractiveness of Coober Pedy and the Far North;
• normal business cycle activity is excluded;
• that Coober Pedy and the Far North will be able to manage the growth and provide a carrying capacity in terms of infrastructure, community acceptance and complementary product;
• increased room occupancy but constant length of stay (say 2.5 nights).

88
7.3 Far North Forecasts
Our projections for the Far North region are as follows:
Current Position
1992/93 1995 2000
No. of visits
• Domestic 130,000 153,000 231,000
• International 39,600 62,000 187,000
Total 169,600 215,000 418,000
No. of visitor nights
• Domestic 451,000 513,000 706,000
• International 181,650 313,000 1,222,000
Total 632,650 826,000 1,928,000 No. of guest rooms 363 363 420 No. of room nights sold 47,650 55,000 80,000 Room occupancy rate 36% 42% 52%
We have assumed that the current level of occupancy of 36% will increase. We have allowed for a 2% increase per annum starting at 40% occupancy for 1994. We have also allowed for the average rate of growth for the last 7 years for room nights sold to be sustained at 7.6%. The existing number of rooms is 363 and we expect this will be sustained through to 1995 whilst occupancies rise to 42%.
These forecasts have been prepared on the basis of sustaining the average rate of growth for the last 7 years through until the end of the century without any allowance for business cycle activity or any other variables. Extreme care should be taken with their interpretation and use. In our opinion, however, they can be used as a basis for preparing an optimistic forecast for Coober Pedy tourism.
A more fundamental study of supply and demand variables would be required in order to produce more reliable forecasts for major investment decision making, e.g. for new hotels, airports, etc. Such a study should also include a longer history of visitation statistics and comparisons with similar locations. The key question is “Where are we on the product life-cycle?”. We suspect that the Far North is about to enter a period of higher growth because of its fit with the State’s tourism strategy / promotional campaigns and the strong world trends towards ecotourism.

89
7.4 Coober Pedy Forecasts
We do not consider the Coober Pedy statistics to be reliable enough for forecasting purposes. Rather, we would prefer to work on the basis of the Far North statistics and projections using estimates for market share of Coober Pedy to total Far North. Our estimates are as follows:
Current Position 1995 2000 1992/93 Total
Total No. of Visits
• Domestic say 50,000
• International say 10,000
• Total 60,000
• Assume 25% Share of Far North 54,000 105,000
• Assume 30% Share of Far North 65,000 125,000
• Assume 35% Share of Far North 75,000 146,000
No. of Visitor Nights
• Domestic say 130,000
• International say 20,000
• Total 150,000
• Assume 25% Share of Far North 207,000 482,000
• Assume 30% Share of Far North 248,000 578,000
• Assume 35% Share of Far North 289,000 675,000
No. of Room Nights Sold
• Assume 25% Share of Far North 14,000 20,000
• Assume 30% Share of Far North 16,000 24,000
• Assume 35% Share of Far North 19,000 28,000
Our major conclusion is that there is a distinct chance that, based on visitation rates experienced over the last 7 years, visitation could double in Coober Pedy by the Year 2000.
These statistics are only for visits staying overnight. Overseas day tripper visitation would be additional. In the current position for 1992/93 we have estimated overseas visitors overnighting at 10,000 based on a 25% share of 1992 overnighters 39,600. Remember that the International Visitor Survey (IVS) shows that 40,000-60,000 overseas visitors include Coober Pedy on

90
their itinerary; this is equivalent to the total number of domestic visitors. Very few of the domestic visitors will pass through without staying overnight. We can conclude therefore that for every one overseas visitor staying overnight possibly five are passing through. This represents an excellent target market opportunity through a combination of improved product development and promotion. In short, the tourism outlook for Coober Pedy through to the end of the century is bright.

91
TOURISM PLANNING HANDOUT 1.4
A DISCUSSION ABOUT GOALS
1. NATIONAL GOALS - USA
Source: Mill & Morrison, 1985 “The Tourist System”, Prentice Hall
• Economic
• full employment
• economic growth with minimum inflation
• reduced international trade deficits
• balanced national transportation system
• Energy
• energy conservation
• economic viability of small business
• Social
• urban re-vitalisation
• consumer protection
• equal opportunity
• improved physical and mental health
• equitable taxation
• Government
• improved operation of the Federal Government
• minimum regulation of private industry
• Environment
• environmental protection
• judicious use of natural resources
• preservation of national heritage resources
• International

92
• improved international goodwill
1. TOURISM GOALS - USA
Source: Mill & Morrison, 1985 “The Tourist System”, Prentice Hall
Against this backdrop of national interests tourism goals can be developed along four lines: - economic, consumer, national resource/environmental and government operations.
• Economic
• optimise the contribution of tourism and recreation to economic prosperity
• full employment
• regional economic development
• improved international balance of payments.
• Consumer
• opportunity and benefits of travel and recreation accessible to residents and visitors
• to contribute to the personal growth and education of the population and to encourage their appreciation of the geography, history and ethnic diversity of the nation
• to encourage free and welcome entry of foreigners.
• Environmental and National Resource
• to protect and preserve the historical and cultural foundations of the nation as a living part of community life and development and to ensure future generations have an opportunity to enjoy the rich heritage of the nation
• to ensure the compatibility of tourism, recreational and activity policies with other national interests in energy, environment and judicious use of natural resources.
• Government Operations
• harmonise Federal activities supporting tourism and recreation
• support public and the public and private sector, leadership role.
3. NATIONAL TOURISM GOALS - AUSTRALIA

93
Source: DASETT, 1991
• Economic
To optimise the tourism industry’s contribution to national income, employment, growth and the balance of payments by creating a favourable environment for industry development
• Environmental
To provide for sustainable tourism development by encouraging responsible planning and management practices consistent with the conservation of our natural and cultural heritage
• Social
To enhance access to quality tourism experiences and ensure favourable social outcomes of tourism by diversifying the product base, raising industry standards and protecting the public interest
• Support
To ensure the provision of adequate promotional, planning, co-ordination, research and statistical support to assist the industry’s development.
3. UNITED NATIONS
UN Conference on the human environment listed 4 quality of life needs:
• Improvement of human settlements and health
• Development and use of fresh water, land and energy resources.
• Harmonising development goals and social and cultural values with environmental quality objectives
• Protection of living resources and of the ocean, and avoidance of inadvertent climate modification.
5. THE CHASE FOR COMPETITIVE ADVANTAGE
Source: Michael Porter, "The Competitive Advantage of Nations" (Free Press).
• Porter says that nations exist to give their peoples a rising standard of living. This depends above all on continual gains in productivity provided only by individual firms that search constantly for fresh sources of competitive advantage
• Contrast Michael Porter's approach with a traditional economic view that comparative advantage is essentially tied up with the idea that a nation's wealth depends on it's ability to exploit natural or human resources of which it has a relative abundance. In Australia's case the lucky country post war strategy

94
emphasised agriculture, mining, etc.
• Porter, however, argues that comparative advantage is not something inherited, it is created. In his 4 year study of 8 countries: the US, Japan, Sweden, Switzerland, West Germany, Britain, Italy and South Korea, Porter concluded that a nation's international success depends upon it's ability to upgrade it's advantages to the next level of technology and productivity. He argues that Japan's success is not due to it's management or government planning but mostly to intense domestic competition in it's export industries. He argues that the fundamental lesson for nations is that the quiet life is an enemy of competitive advantage.
• Porter say Japan is the nation best prepared to compete in the global economy. The answer is to create competition.
6. ALTERNATIVE VALUE SYSTEMS OR WORLD VIEWS
Focus A B C D E HI-TECH MOSTLY MIXED MOSTLY LO-TECH HI-TECH LO-TECH 1. ECONOMY Core Values Consumption Conservation Quantity Quality Product Life Limited Long Production - Scale Mass Craft (small is beautiful) - Food Factory Stored Trade World Wide Bartering Growth High Steady state Investment Capital Labour intensive intensive Unemployment High Nil 2. ECOLOGY Management Ineffective Effective Energy use High Low Pollution High Low Re-cycling Little or none High Concern for Nature Alienated Integrated Science & Technology Dominating Serving 3. COMMUNITY Settlement City Village Family Scattered Communal Culture Disintegrating Preserved Motivation to work Income Satisfaction Dependence on others High Self sufficient Recreation Separated Integrated with work 4. GOVERNMENT Politics Consensus Democratic Organisation Centralised Decentralised 5. PLANNING & DECISION-MAKING Complex Simple Multi-Disciplinary Common Sense Relative/Pragmatic Stable/Principled

95
HANDOUT 1.5a
AN ORGANISATIONAL SWOT EXAMPLE
Strengths
• Strong capability for servicing the seniors market (80% rating compared to Competitor A 65%)
• Locational advantages provide an opportunity to build image
Weaknesses
• Poor networking arrangements which leave us vulnerable to industry rationalisation
• No CEO succession plan
Opportunities
• Aging population offers opportunity to build on strength in products for senior citizens
Threats
• Declining household formation threatens appliance demand

96
AREA SWOT EXAMPLE HANDOUT 1.5b The purpose of this SWOT analysis is to identify key factors for success relevant to site selection and the definition and evaluation of alternative development concepts. For example an understanding of ‘strengths’ for an area will help ensure that a proposed development builds on these strengths and will be in harmony with the unique character for the area under consideration.
A hypothetical country town called Powelltown, South Australia
Strengths
• Located within a short driving distance of Adelaide (less than 45 minutes) and close to the McLaren Vale winery area;
• Situated on high traffic routes to other tourist destinations in the Fleurieu Peninsula - leads to a concept of ‘Gateway to the Fleurieu’;
• An appealing township countryside which provides a sense of arrival, within a forested surrounding which displays seasonal contrast;
• A name which is easy to use in promotional activity eg ‘everything points to, ‘hub concept for attractions in all directions’, and already has high awareness;
• Existing township facilities and nearby tourism attractions;
• A close-knit and supportive local community;
• Substantial existing businesses and a diverse agricultural base;
• Strong Mt Lofty Ranges and water catchment area planning.
Weaknesses
• Township currently lacks a cohesive tourism identity - a fragmented collection of attractions in a region you drive through on the way to somewhere else;
• Competing with established tourism destinations within the region eg Victor Harbor, Goolwa, McLaren Vale.
Opportunities
• Expanding population base in the southern areas of Adelaide;
• Located adjacent to planned major developments ie the proposed Southern Freeway, Wirrina Cove redevelopment;
• Tie together the existing attraction base;
• To become a centre for the promotion of farm based tourism in the region;
• Link in with current tourism activity in the McLaren Vale and Fleurieu Peninsula areas;
• Capitalise on road alignment for better town and attraction signage;
• The potential for an appropriate major tourism attraction for Powelltown on the basis of the size of the existing tourism flows to the Fleurieu Peninsula and the traffic flows through Powelltown.
Threats
• Loss of quaint township character through poor urban planning and uncoordinated development.

97
INTEGRATED SWOT EXAMPLE HANDOUT 1.5c
Situation analysis conclusions:-
• From the demographic analysis
• Longer life expectancies might mean more new product opportunities in the senior citizen segment (opportunity)
• A lower birth or household formation rate will eventually lead to lower new home building and appliance demand (threat)
• From the supply and competitive analysis
• There is a risk of new firms entering the industry or of existing firms combining and rationalising (threat and an opportunity)
• From the demand analysis
• Our markets were declining or that we are vulnerable to substitute products (threats)
• In the financial analysis we may have concluded that
• borrowing capacity (strength)
• credit management (strength)
• liquidity and profitability (weaknesses)
• planning and budgeting processes (weaknesses)
• In the organisational analysis we might have concluded that
• Strong capability for serving the senior citizens market (strength)
• Locational advantages provide an opportunity to build image (strength)
• Strong distribution channels (strength)
• Poor networking arrangements which leave us vulnerable to industry rationalisation (weakness)
• No CEO succession plan (weakness)
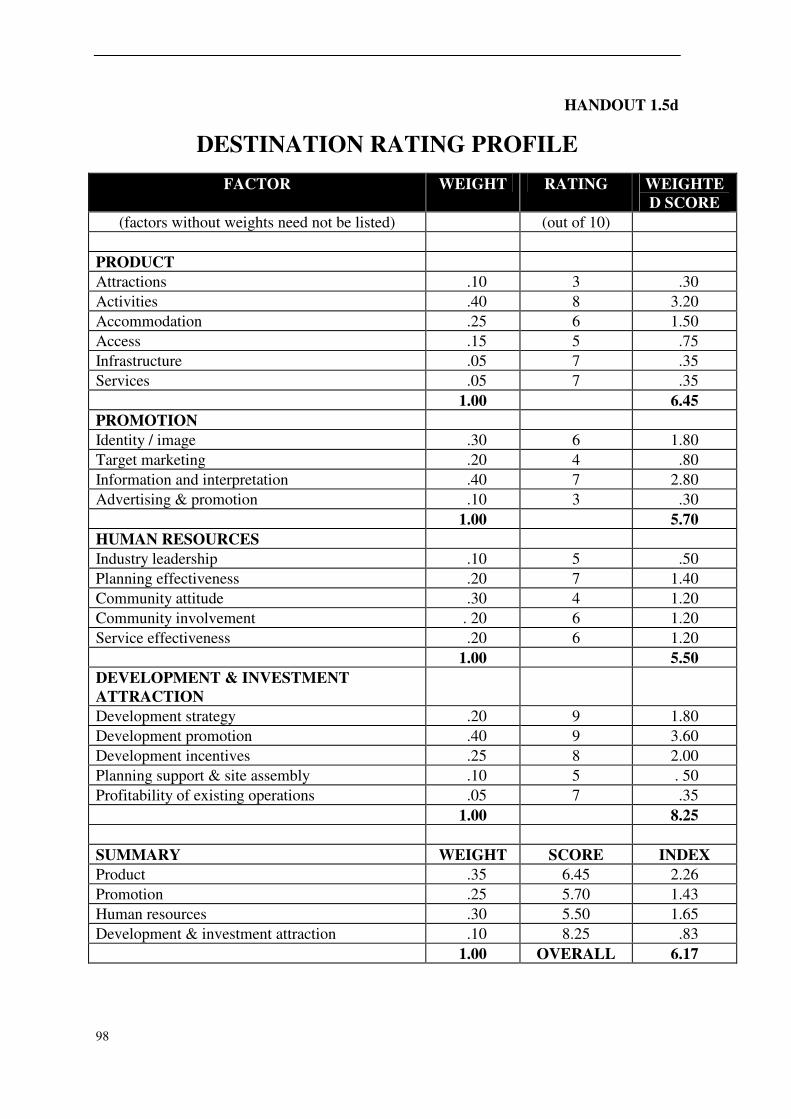
98
HANDOUT 1.5d
DESTINATION RATING PROFILE
FACTOR WEIGHT RATING WEIGHTE
D SCORE
(factors without weights need not be listed) (out of 10)
PRODUCT
Attractions .10 3 .30
Activities .40 8 3.20
Accommodation .25 6 1.50
Access .15 5 .75
Infrastructure .05 7 .35
Services .05 7 .35
1.00 6.45
PROMOTION
Identity / image .30 6 1.80
Target marketing .20 4 .80
Information and interpretation .40 7 2.80
Advertising & promotion .10 3 .30
1.00 5.70
HUMAN RESOURCES
Industry leadership .10 5 .50
Planning effectiveness .20 7 1.40
Community attitude .30 4 1.20
Community involvement . 20 6 1.20
Service effectiveness .20 6 1.20
1.00 5.50
DEVELOPMENT & INVESTMENT
ATTRACTION
Development strategy .20 9 1.80
Development promotion .40 9 3.60
Development incentives .25 8 2.00
Planning support & site assembly .10 5 . 50
Profitability of existing operations .05 7 .35
1.00 8.25
SUMMARY WEIGHT SCORE INDEX
Product .35 6.45 2.26
Promotion .25 5.70 1.43
Human resources .30 5.50 1.65
Development & investment attraction .10 8.25 .83
1.00 OVERALL 6.17

99
HANDOUT 1.5d
DESTINATION RATING PROFILE
FACTOR WEIGHT RATING WEIGHTE
D SCORE
(factors without weights need not be listed) (out of 10)
PRODUCT
Attractions .10 3 .30
Activities .40 8 3.20
Accommodation .25 6 1.50
Access .15 5 .75
Infrastructure .05 7 .35
Services .05 7 .35
1.00 6.45
PROMOTION
Identity / image .30 6 1.80
Target marketing .20 4 .80
Information and interpretation .40 7 2.80
Advertising & promotion .10 3 .30
1.00 5.70
HUMAN RESOURCES
Industry leadership .10 5 .50
Planning effectiveness .20 7 1.40
Community attitude .30 4 1.20
Community involvement . 20 6 1.20
Service effectiveness .20 6 1.20
1.00 5.50
DEVELOPMENT & INVESTMENT
ATTRACTION
Development strategy .20 9 1.80
Development promotion .40 9 3.60
Development incentives .25 8 2.00
Planning support & site assembly .10 5 . 50
Profitability of existing operations .05 7 .35
1.00 8.25
SUMMARY WEIGHT SCORE INDEX
Product .35 6.45 2.26
Promotion .25 5.70 1.43
Human resources .30 5.50 1.65
Development & investment attraction .10 8.25 .83
1.00 OVERALL 6.17

100
LINKED SWOT EXAMPLE HANDOUT 1.5e
A tourist example to illustrate linking strengths and weaknesses with opportunities
and threats
• Rationale for concentrating on visitation to Adelaide
• Strengths - our town is easily accessible to Adelaide, we have a pleasant farming environment, good beaches and we are price competitive
• Opportunities - visitation to Adelaide is growing strongly, government promotional support is available, investment in major tourist developments is occurring in the region, growing interest in farm-based holidays and adventure
• We will focus on the short-trip market
• Strengths - accessibility, strong product line for places of interest (scenic features, museums, old mines)
• Threats - cost of petrol is increasing, consumer preference to divide total holiday time into more short trips
• We need a major magnet in the town
• Strengths - existing town character and community retail support, strong product line of support businesses
• Threats - potential new investment in an adjoining region will shift the centre of gravity away from our region
• Opportunities - strong short trip support for unique theme developments