productivity commission - court performance 2015
DESCRIPTION
Productivity Commission's performance indicators for courts throughout Australia - 2014-2015TRANSCRIPT

7/21/2019 Productivity Commission - court performance 2015
http://slidepdf.com/reader/full/productivity-commission-court-performance-2015 1/4
C.32 REPORT ON GOVERNMENT SERVICES 2016
Table C.8 Performance indicator results for courtsa, b
NSW Vic Qld WA SA Tas ACT NT Aus Gov Aust
Equity — Access indicators
Fees paid by applicants
Average civil court fees collected per lodgment ($), 2014-15
Most recent data for this measure are comparable and complete, subject to caveats (chapter 7)
Supreme/Federal
2 930 1 702 1 936 2 181 2 961 629 2 403 1 552 3 747 2 455
District 1 649 1 592 976 989 976 .. .. .. .. 1 324
Magistrates 163 219 119 130 115 85 217 57 .. 160
Family .. .. .. 405 .. .. .. .. 218 298
Federal Crct .. .. .. .. .. .. .. .. 558 558
Source: Attachment table 7A.18
Judicial officers
Total number of full time equivalent (FTE) judicial officers, 2014-15
Most recent data for this measure are comparable and complete, subject to caveats (chapter 7)
No. 261.3 248.0 156.3 125.5 69.9 21.4 13.6 25.8 150.1 1 071.8
Source: Attachment table 7A.27
Number of FTE judicial officers per 100,000 population , 2014-15
Most recent data for this measure are comparable and complete, subject to caveats (chapter 7)
No. per100,000 3.5 4.2 3.3 4.9 4.1 4.2 3.5 10.5 0.6 4.5
Source: Attachment table 7A.27
Effectiveness — Access indicators
Backlog
Percentage of criminal lodgments pending completion at 30 June, 2015 (%)
Most recent data for this measure are comparable and complete, subject to caveats (chapter 7)
Higher(appeal)
>12 mths 2.6 4.9 10.3 15.9 11.2 7.7 30.6 11.1 .. ..
>24 mths 0.5 0.6 2.7 0.0 1.5 3.8 0.0 0.0 .. ..
Higher (non-appeal)
>12 mths 18.1 22.0 14.3 6.8 21.8 27.6 15.3 4.5 .. ..
>24 mths 3.7 2.3 4.5 .6 5.1 8.8 3.8 – .. ..
Magistrates
>6 mths 12.6 23.2 31.3 28.3 23.6 32.3 27.1 31.2 .. ..
>12 mths 2.0 7.0 13.3 8.9 7.8 13.8 8.6 15.6 .. ..
Children’s
>6 mths 13.4 10.3 27.4 13.2 20.3 27.9 36.5 32.3 .. ..
>12 mths 1.6 2.9 14.1 3.1 6.8 12.1 17.4 16.8 .. ..
Source: Attachment table 7A.19
(continued next page)

7/21/2019 Productivity Commission - court performance 2015
http://slidepdf.com/reader/full/productivity-commission-court-performance-2015 2/4
JUSTICE SECTOR OVERVIEW C.33
Table C.8 (continued)
NSW Vic Qld WA SA Tas ACT NT AusGov
Aust
Backlog
Percentage of civil lodgments pending completion at 30 June, 2015 (%)
Most recent data for this measure are comparable and complete, subject to caveats (chapter 7)
Higher (appeal)
>12 months 15.4 16.3 19.5 14.2 8.3 11.3 47.4 6.5 6.5 ..
>24 months 2.5 4.2 4.7 1.8 1.0 1.6 26.3 – .6 ..
Higher (non-appeal)
>12 months 25.3 29.0 21.7 37.7 44.6 34.9 36.7 33.7 39.9 ..>24 months 8.1 11.6 5.2 13.2 22.4 11.0 11.5 11.6 24.6 ..
Magistrates
>6 months 25.1 25.7 47.9 46.2 41.4 43.9 41.5 46.7 .. ..
>12 months .8 15.6 10.6 10.1 11.1 12.3 17.1 7.2 .. ..
Family - appeal
>12 months .. .. .. – .. .. .. .. 30.8 ..
>24 months .. .. .. – .. .. .. .. 13.8 ..
Family – nonappeal
>12 months .. .. .. 25.0 .. .. .. .. 26.3 ..>24 months .. .. .. 6.0 .. .. .. .. 10.5 ..
Federal Circuit
>6 months .. .. .. .. .. .. .. .. 33.6 ..
>12 months .. .. .. .. .. .. .. .. 13.9 ..
Coroners’
>12 months 27.9 31.9 25.9 19.6 35.4 33.2 38.7 37.2 .. ..
>24 months 18.6 15.4 12.0 8.4 12.9 12.5 24.1 22.2 .. ..
Source: Attachment table 7A.21
Attendance
Average number of attendances per finalisation, criminal courts 2014-15
Most recent data for this measure are neither comparable nor complete (chapter 7)
Supreme na na 4.0 2.9 3.5 7.0 6.6 6.8 .. ..
District/County 3.2 4.7 4.3 3.7 6.1 .. .. .. .. ..
Magistrates 2.6 2.0 2.5 2.5 3.9 4.0 3.7 3.3 .. ..
Childrens 3.6 2.2 2.7 3.8 3.9 5.1 3.9 4.8 .. ..
Source: Attachment table 7A.22
(continued next page)

7/21/2019 Productivity Commission - court performance 2015
http://slidepdf.com/reader/full/productivity-commission-court-performance-2015 3/4
C.34 REPORT ON GOVERNMENT SERVICES 2016
Table C.8 (continued)
NSW Vic Qld WA SA Tas ACT NT AusGov Aust
Average number of attendances per finalisation, civil courts 2014-15
Most recent data for this measure are neither comparable nor complete (chapter 7)
Supreme/Federal na na 1.2 2.2 4.0 1.8 5.9 4.2 3.2 ..
District/county 3.7 0.8 0.4 1.2 4.0 .. .. .. .. ..
Magistrates 0.8 1.1 0.9 0.8 1.1 1.1 1.6 1.1 .. ..
Children’s na 1.8 3.5 4.0 2.5 5.4 5.7 3.7 .. ..
Family .. .. .. 1.8 .. .. .. .. 2.2 ..
Federal Circuit .. .. .. .. .. .. .. .. 1.9 ..
Coroners’ 4.0 1.0 3.8 2.7 1.9 1.0 3.4 1.0 .. ..
Source: Attachment table 7A.22
Efficiency indicators
Clearance
Finalisations divided by lodgments (multiplied by 100 to provide percentage), criminal, 2014- 2015
Most recent data for this measure are comparable and complete, subject to caveats (chapter 7)
Supreme(appeal) 127.2 107.0 94.4 104.9 89.4 74.3 95.7 111.8 .. ..
Supreme(non-appeal) 105.8 83.5 89.6 88.9 92.0 90.0 90.5 85.0 .. ..
District/county(appeal) 98.3 108.4 91.1 .. .. .. .. .. .. ..
District/county
(non-appeal)85.9 105.3 96.5 76.0 92.5 .. .. .. .. ..
Magistrates 101.1 111.5 97.4 103.4 102.7 91.9 95.7 103.9 .. ..
Children’s 100.0 103.3 102.4 104.6 110.0 98.9 102.6 103.2 .. ..
Source: Attachment tables 7A.24–26
Finalisations divided by lodgments (multiplied by 100 to provide percentage), civil, 2014- 2015
Most recent data for this measure are comparable and complete, subject to caveats (chapter 7)
Supreme(appeal) 111.9 111.0 75.5 81.6 91.0 85.1 116.1 95.5 84.2 ..
Supreme(non-appeal) 110.9 92.1 101.7 98.0 97.9 103.7 106.4 99.3 91.4 ..
District/county(appeal) 118.7 181.6 91.8 99.2 102.7 .. .. .. .. ..
District/county(non-appeal) 94.9 99.9 100.7 96.1 142.4 .. .. .. .. ..
Magistrates 105.1 108.2 104.8 96.9 102.7 106.8 104.2 98.6 .. ..
Children’s 95.1 86.5 98.4 105.1 88.1 121.2 72.3 102.5 .. ..
Family (appeal) .. .. .. 133.3 .. .. .. .. 91.5 ..
Family(non-appeal) .. .. .. 93.5 .. .. .. .. 98.6 ..
Federal Circuit .. .. .. .. .. .. .. .. 93.9 ..
Coroners’ 106.1 108.5 93.1 92.2 106.6 90.2 104.4 91.1 .. ..
Source: Attachment tables 7A.24–26
(continued next page)
7/21/2019 Productivity Commission - court performance 2015
http://slidepdf.com/reader/full/productivity-commission-court-performance-2015 4/4
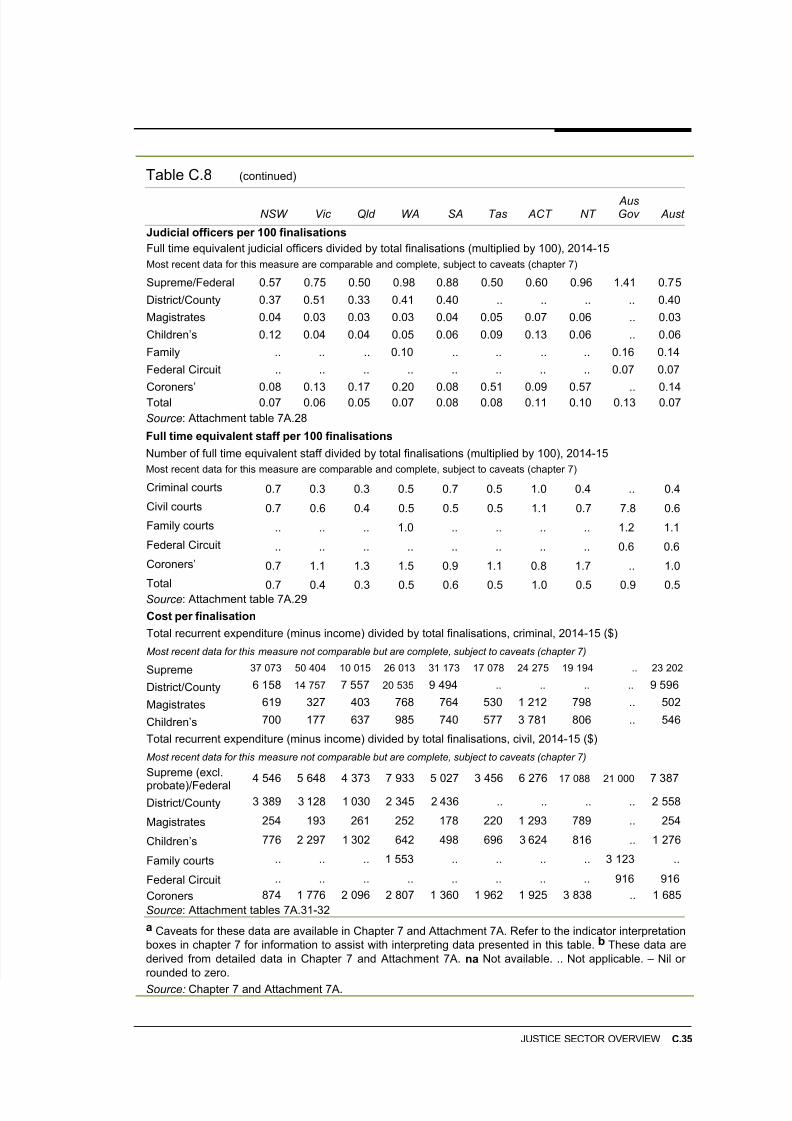
JUSTICE SECTOR OVERVIEW C.35
Table C.8 (continued)
NSW Vic Qld WA SA Tas ACT NT AusGov Aust
Judicial officers per 100 finalisations
Full time equivalent judicial officers divided by total finalisations (multiplied by 100), 2014-15
Most recent data for this measure are comparable and complete, subject to caveats (chapter 7)
Supreme/Federal 0.57 0.75 0.50 0.98 0.88 0.50 0.60 0.96 1.41 0.75
District/County 0.37 0.51 0.33 0.41 0.40 .. .. .. .. 0.40
Magistrates 0.04 0.03 0.03 0.03 0.04 0.05 0.07 0.06 .. 0.03
Children’s 0.12 0.04 0.04 0.05 0.06 0.09 0.13 0.06 .. 0.06
Family .. .. .. 0.10 .. .. .. .. 0.16 0.14
Federal Circuit .. .. .. .. .. .. .. .. 0.07 0.07
Coroners’ 0.08 0.13 0.17 0.20 0.08 0.51 0.09 0.57 .. 0.14Total 0.07 0.06 0.05 0.07 0.08 0.08 0.11 0.10 0.13 0.07
Source: Attachment table 7A.28
Full time equivalent staff per 100 finalisations
Number of full time equivalent staff divided by total finalisations (multiplied by 100), 2014-15
Most recent data for this measure are comparable and complete, subject to caveats (chapter 7)
Criminal courts 0.7 0.3 0.3 0.5 0.7 0.5 1.0 0.4 .. 0.4
Civil courts 0.7 0.6 0.4 0.5 0.5 0.5 1.1 0.7 7.8 0.6
Family courts .. .. .. 1.0 .. .. .. .. 1.2 1.1
Federal Circuit .. .. .. .. .. .. .. .. 0.6 0.6
Coroners’ 0.7 1.1 1.3 1.5 0.9 1.1 0.8 1.7 .. 1.0
Total 0.7 0.4 0.3 0.5 0.6 0.5 1.0 0.5 0.9 0.5Source: Attachment table 7A.29
Cost per finalisation
Total recurrent expenditure (minus income) divided by total finalisations, criminal, 2014-15 ($)
Most recent data for this measure not comparable but are complete, subject to caveats (chapter 7)
Supreme 37 073 50 404 10 015 26 013 31 173 17 078 24 275 19 194 .. 23 202
District/County 6 158 14 757 7 557 20 535 9 494 .. .. .. .. 9 596
Magistrates 619 327 403 768 764 530 1 212 798 .. 502
Children’s 700 177 637 985 740 577 3 781 806 .. 546
Total recurrent expenditure (minus income) divided by total finalisations, civil, 2014-15 ($)
Most recent data for this measure not comparable but are complete, subject to caveats (chapter 7)
Supreme (excl.
probate)/Federal4 546 5 648 4 373 7 933 5 027 3 456 6 276 17 088 21 000 7 387
District/County 3 389 3 128 1 030 2 345 2 436 .. .. .. .. 2 558
Magistrates 254 193 261 252 178 220 1 293 789 .. 254
Children’s 776 2 297 1 302 642 498 696 3 624 816 .. 1 276
Family courts .. .. .. 1 553 .. .. .. .. 3 123 ..
Federal Circuit .. .. .. .. .. .. .. .. 916 916
Coroners 874 1 776 2 096 2 807 1 360 1 962 1 925 3 838 .. 1 685
Source: Attachment tables 7A.31-32
a Caveats for these data are available in Chapter 7 and Attachment 7A. Refer to the indicator interpretationboxes in chapter 7 for information to assist with interpreting data presented in this table. b These data arederived from detailed data in Chapter 7 and Attachment 7A. na Not available. .. Not applicable. – Nil orrounded to zero.
Source: Chapter 7 and Attachment 7A.