prof. dr. peter hoeppe head of geo risks research munich
TRANSCRIPT

Geohazards: Minimizing Risk, Maximizing AwarenessThe Role of the Insurance Industry
Prof. Dr. Peter HoeppeHead of Geo Risks ResearchMunich Re
International Year of Planet Earth, Paris, 13 February 2008
Munich Re• Insurer of Insurances
• Founded 1880
• One of the world‘s largest re-insurers
• Premium income ca. bn 20 €
• Leading role in insurance of natural catastrophes
Geo Risks Research Department of Munich Re –Analyses of natural disasters since 1974
Core business of insurance industry is quantification of risks!

Trends of Natural Disasters
The last years have brought records in natural disasters in respect to:
Intensities
Frequencies
Damages and losses
Heat stress
Cold stress
light
extremehigh
moderatelight
comfortable
moderatehigh
extreme
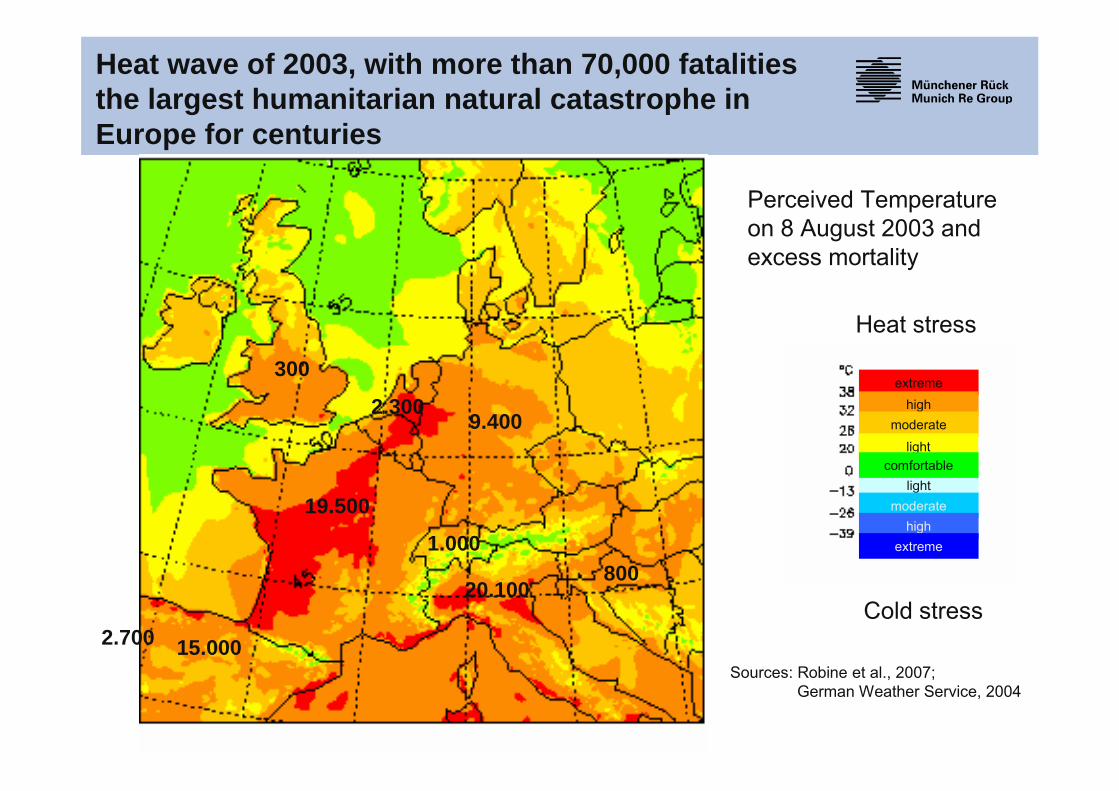
Perceived Temperature on 8 August 2003 and excess mortality
Sources: Robine et al., 2007;German Weather Service, 2004
19.500
9.400
15.000
300
2.300
20.100
2.700
1.000800
Heat wave of 2003, with more than 70,000 fatalities the largest humanitarian natural catastrophe in Europe for centuries

The Tsunami of 26 December 2004> 200,000 victimsca. 2.7 million homelessEconomic loss about US$ 10 bnInsured loss about US$ 1 bnLargest natural catastrophe since earthquake in Tangshan 1976Largest tsunami event in the documented history (fourth largest earth quake)
Hurricane Katrina, 25.-30.8.20056th strongest hurricane, largest losses of a single event
1.322 fatalities
Insured losses (US$ m):Economic losses (US$ m): 125.000
61.000 (NFIP included)

Source: Image courtesy of Earth Sciences and Image Analysis Laboratory, NASA Johnson Space Center, Bild-NummerISS008-E-19646. http://eol.jsc.nasa.gov
2004: 1st Hurricane in South AtlanticHurricane Catarina off the Coast of Brasil, March 2004
Hurricane Vince (9 October 2005)Vince, a hurricane in a region without hurricane risk (easterly North Atlantic, Madeira)
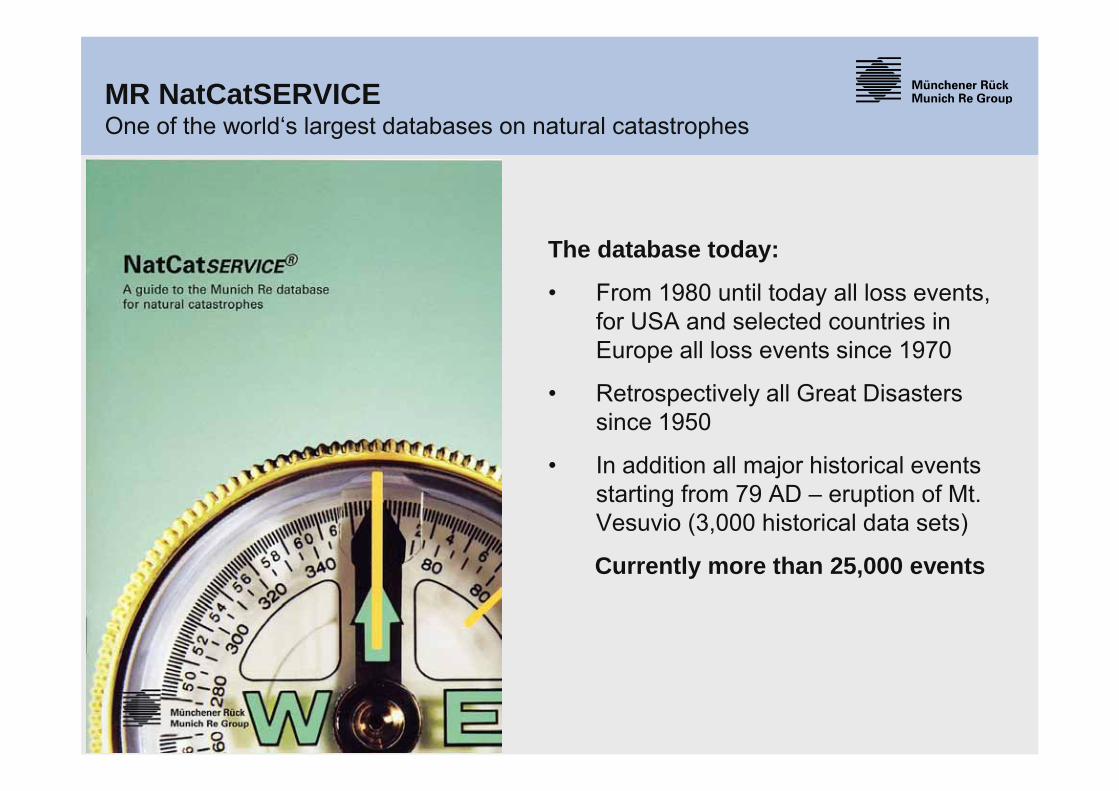
MR NatCatSERVICEOne of the world‘s largest databases on natural catastrophes
The database today:
• From 1980 until today all loss events, for USA and selected countries in Europe all loss events since 1970
• Retrospectively all Great Disasters since 1950
• In addition all major historical events starting from 79 AD – eruption of Mt. Vesuvio (3,000 historical data sets)
Currently more than 25,000 events
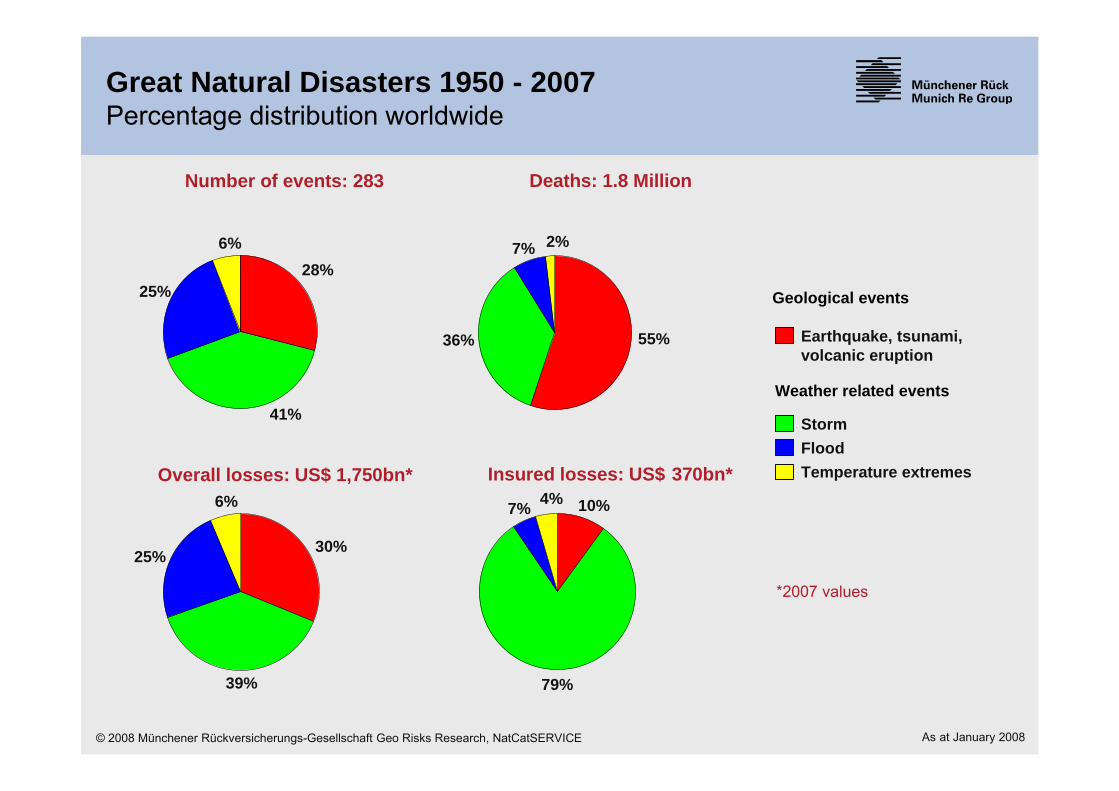
Great Natural Disasters 1950 - 2007Percentage distribution worldwide
Weather related events
Earthquake, tsunami, volcanic eruption
Temperature extremes
Geological events
StormFlood
Deaths: 1.8 MillionNumber of events: 283
Overall losses: US$ 1,750bn* Insured losses: US$ 370bn*
*2007 values
© 2008 Münchener Rückversicherungs-Gesellschaft Geo Risks Research, NatCatSERVICE As at January 2008
28%
41%
25%
6%
55%
2%
36%
7%
30%
39%
25%
6% 10%
79%
7% 4%

Great Natural Disasters 1950 – 2007Number of events
Earthquake, tsunami, volcanic eruption
Storm Temperature extremes (e.g. heat wave, wildfire)
Flood
Num
ber
© 2008 Münchener Rückversicherungs-Gesellschaft Geo Risks Research, NatCatSERVICE As at January 2008
0
2
4
6
8
10
12
14
16
1950 1955 1960 1965 1970 1975 1980 1985 1990 1995 2000 2005
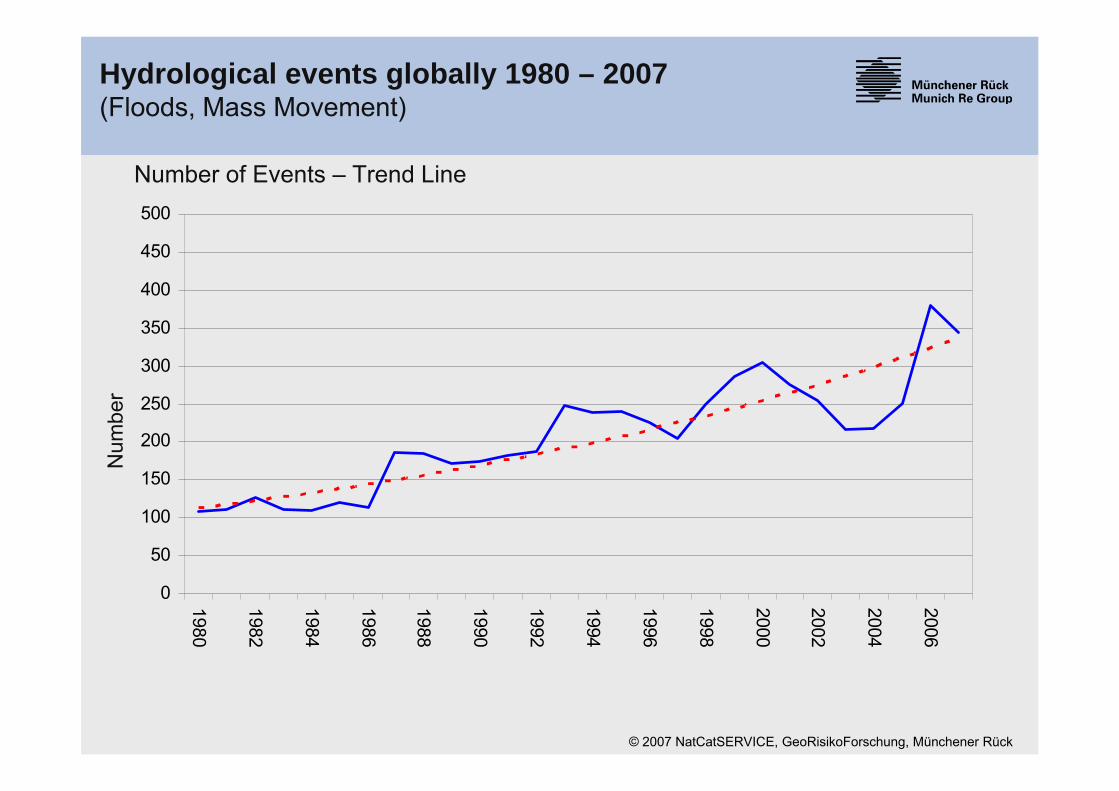
Hydrological events globally 1980 – 2007(Floods, Mass Movement)
© 2007 NatCatSERVICE, GeoRisikoForschung, Münchener Rück
Anz
ahl
0
50
100
150
200
250
300
350
400
450
500
1980
1982
1984
1986
1988
1990
1992
1994
1996
1998
2000
2002
2004
2006Number of Events – Trend Line
Num
ber
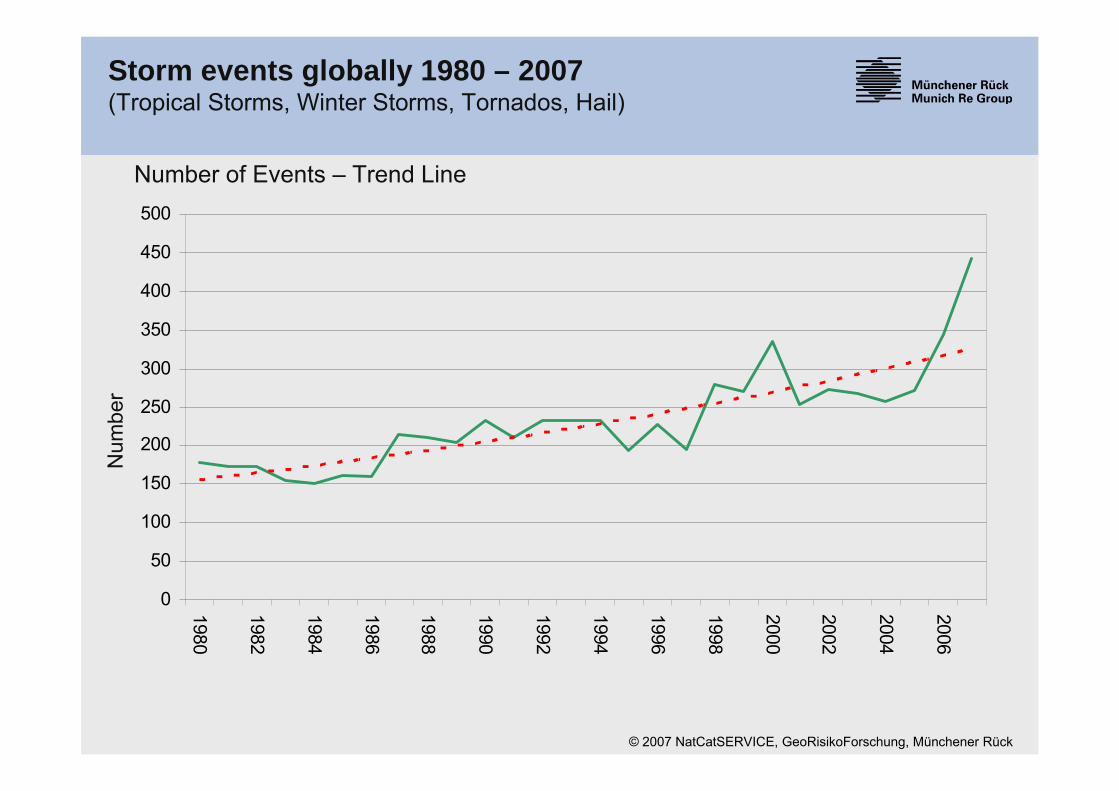
Storm events globally 1980 – 2007(Tropical Storms, Winter Storms, Tornados, Hail)
© 2007 NatCatSERVICE, GeoRisikoForschung, Münchener Rück
Anz
ahl
0
50
100
150
200
250
300
350
400
450
500
1980
1982
1984
1986
1988
1990
1992
1994
1996
1998
2000
2002
2004
2006Number of Events – Trend Line
Num
ber
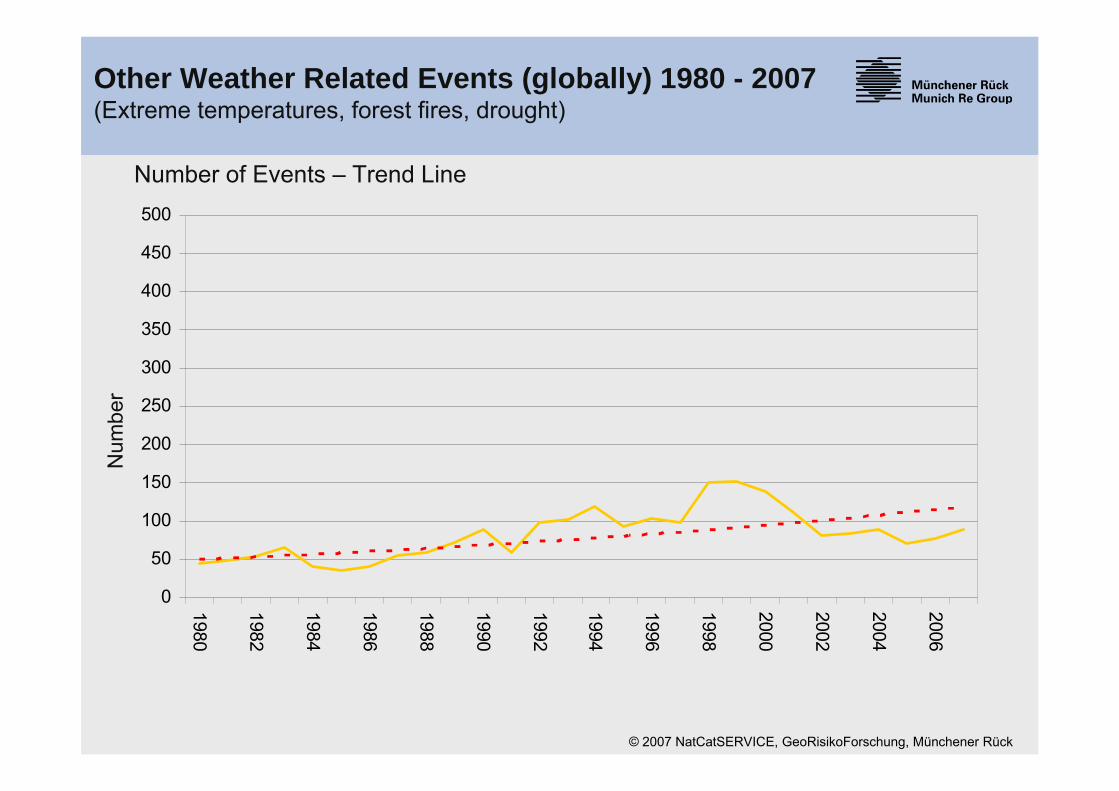
Other Weather Related Events (globally) 1980 - 2007(Extreme temperatures, forest fires, drought)
© 2007 NatCatSERVICE, GeoRisikoForschung, Münchener Rück
Anz
ahl
0
50
100
150
200
250
300
350
400
450
500
1980
1982
1984
1986
1988
1990
1992
1994
1996
1998
2000
2002
2004
2006Number of Events – Trend Line
Num
ber
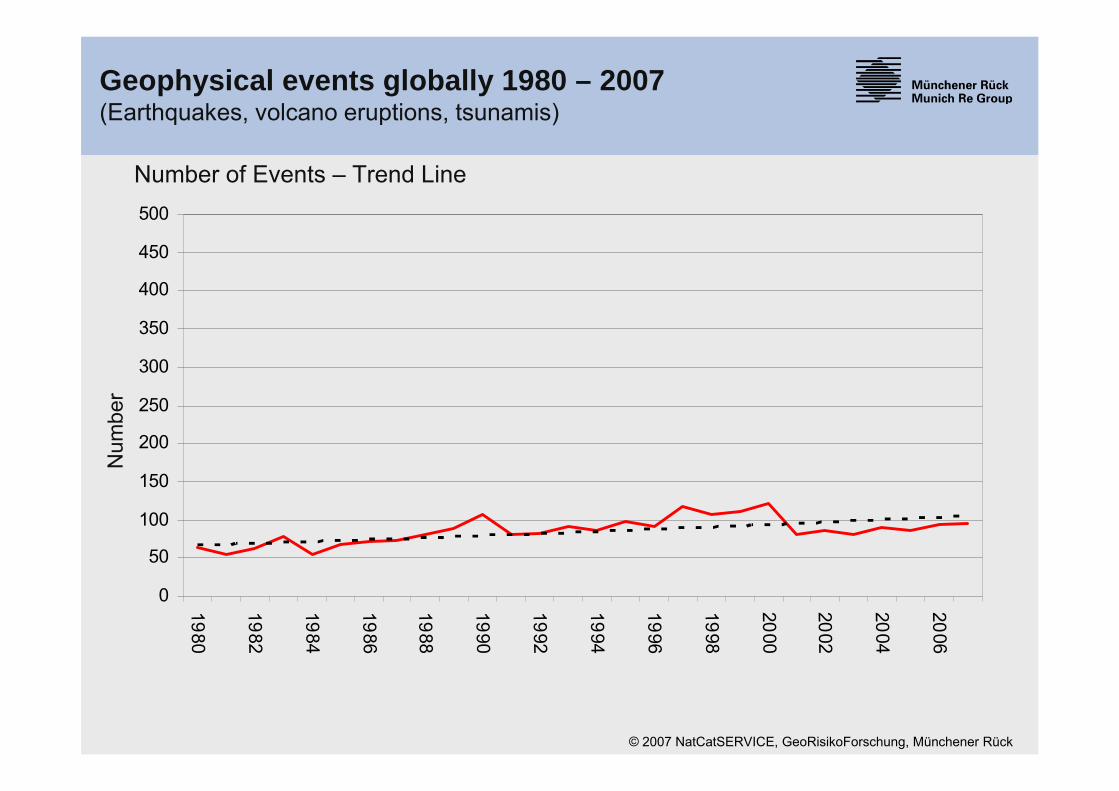
Geophysical events globally 1980 – 2007 (Earthquakes, volcano eruptions, tsunamis)
© 2007 NatCatSERVICE, GeoRisikoForschung, Münchener Rück
Anz
ahl
0
50
100
150
200
250
300
350
400
450
500
1980
1 982
1 984
19 86
19 88
199 0
1992
1994
1996
1998
2000
2002
2 004
20 06Number of Events – Trend Line
Num
ber

Great Natural Disasters 1950 – 2007Overall and insured losses
Overall losses(2007 values)
Insured losses (2007 values)
Trend overall losses Trend insured losses
US$
bn
© 2008 Münchener Rückversicherungs-Gesellschaft Geo Risks Research, NatCatSERVICE As at January 2008
0
20
40
60
80
100
120
140
160
180
200
1950 1955 1960 1965 1970 1975 1980 1985 1990 1995 2000 2005
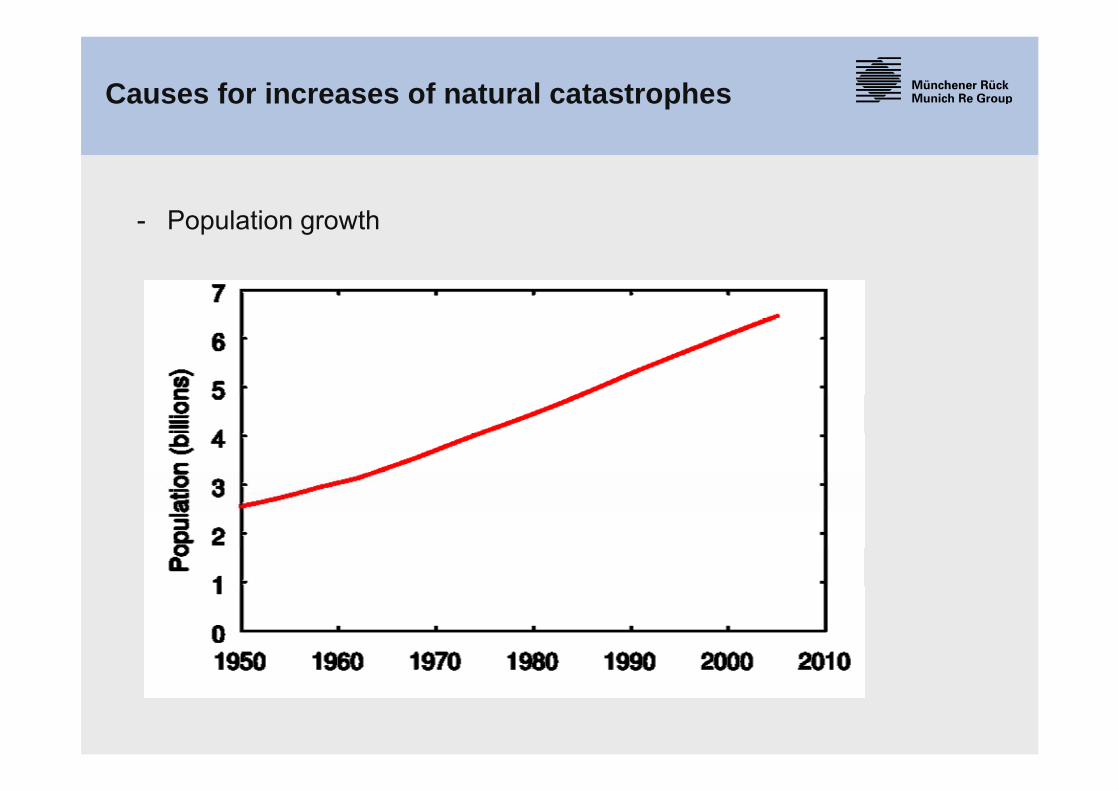
- Population growth
Causes for increases of natural catastrophes

- Population growth
- Increasing standard of living
Causes for increases of natural catastrophes
- Population growth
- Increasing standard of living
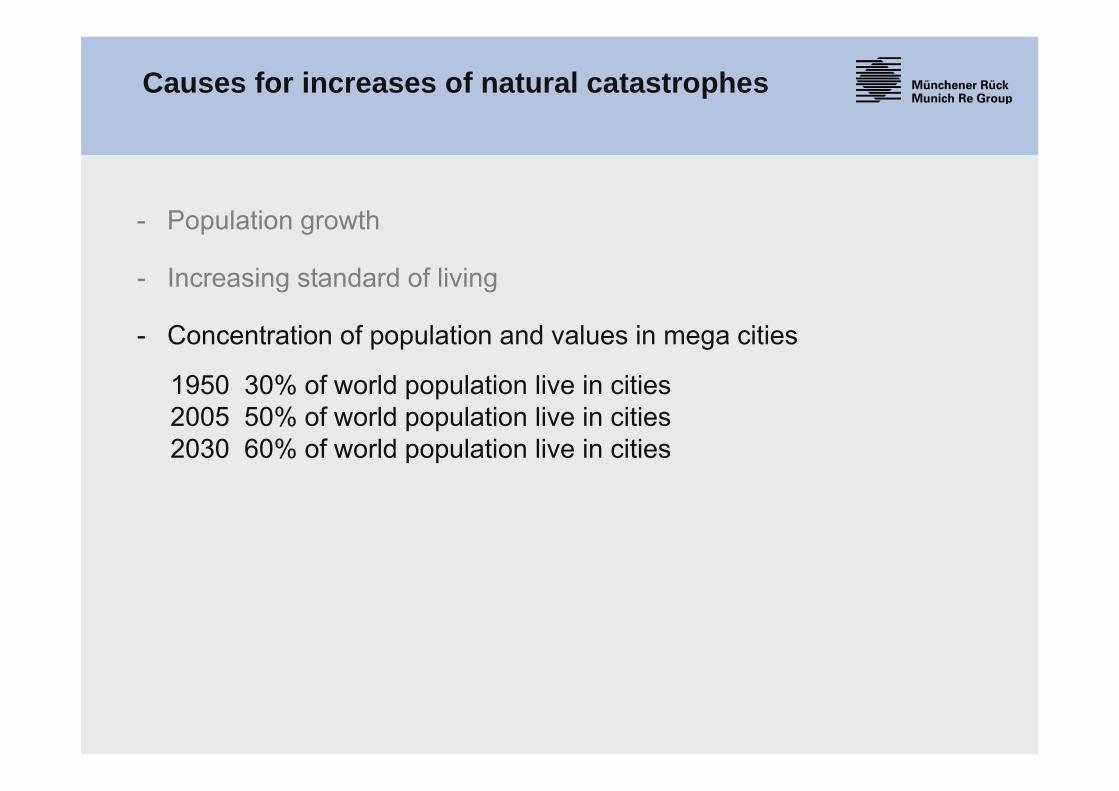
- Concentration of population and values in mega cities
Causes for increases of natural catastrophes
1950 30% of world population live in cities2005 50% of world population live in cities2030 60% of world population live in cities

- Population growth
- Increasing standard of living
- Concentration of population and values in mega cities
- More and more people settling in highly exposed regions
Causes for increases of natural catastrophes

- Population growth
- Increasing standard of living
- Concentration of population and values in mega cities
- More and more people settling in highly exposed regions
- Increased vulnerability of modern societies
Causes for increases of natural catastrophes
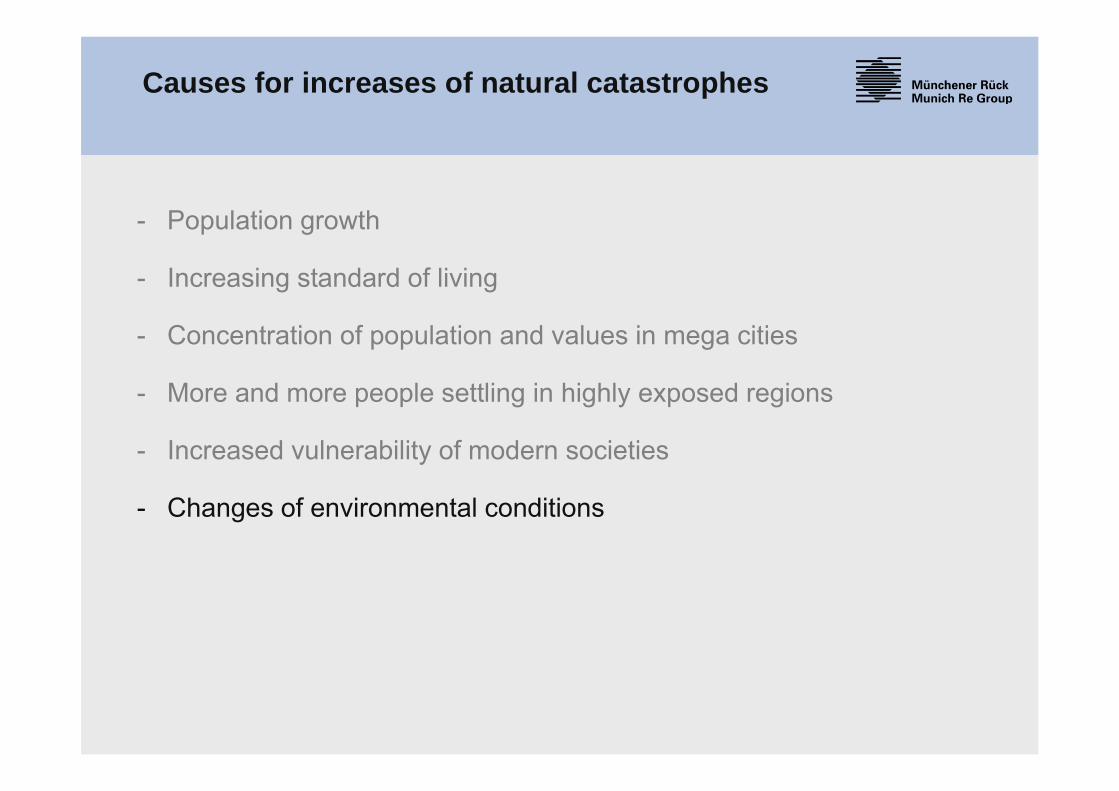
- Population growth
- Increasing standard of living
- Concentration of population and values in mega cities
- More and more people settling in highly exposed regions
- Increased vulnerability of modern societies
- Changes of environmental conditions
Causes for increases of natural catastrophes
-0,5
-0,3
-0,1
0,1
0,3
0,5
1856 1876 1896 1916 1936 1956 1976 1996-0,5
-0,3
-0,1
0,1
0,3
0,5
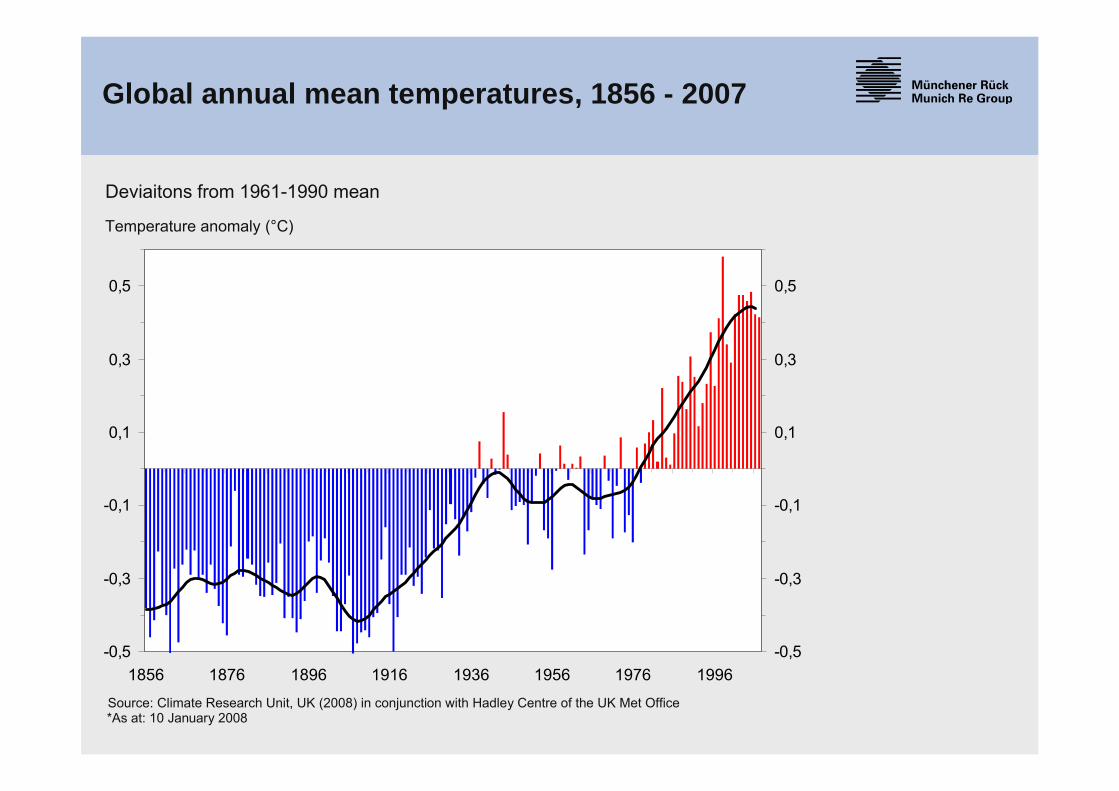
Global annual mean temperatures, 1856 - 2007
Deviaitons from 1961-1990 mean
Temperature anomaly (°C)
Source: Climate Research Unit, UK (2008) in conjunction with Hadley Centre of the UK Met Office*As at: 10 January 2008
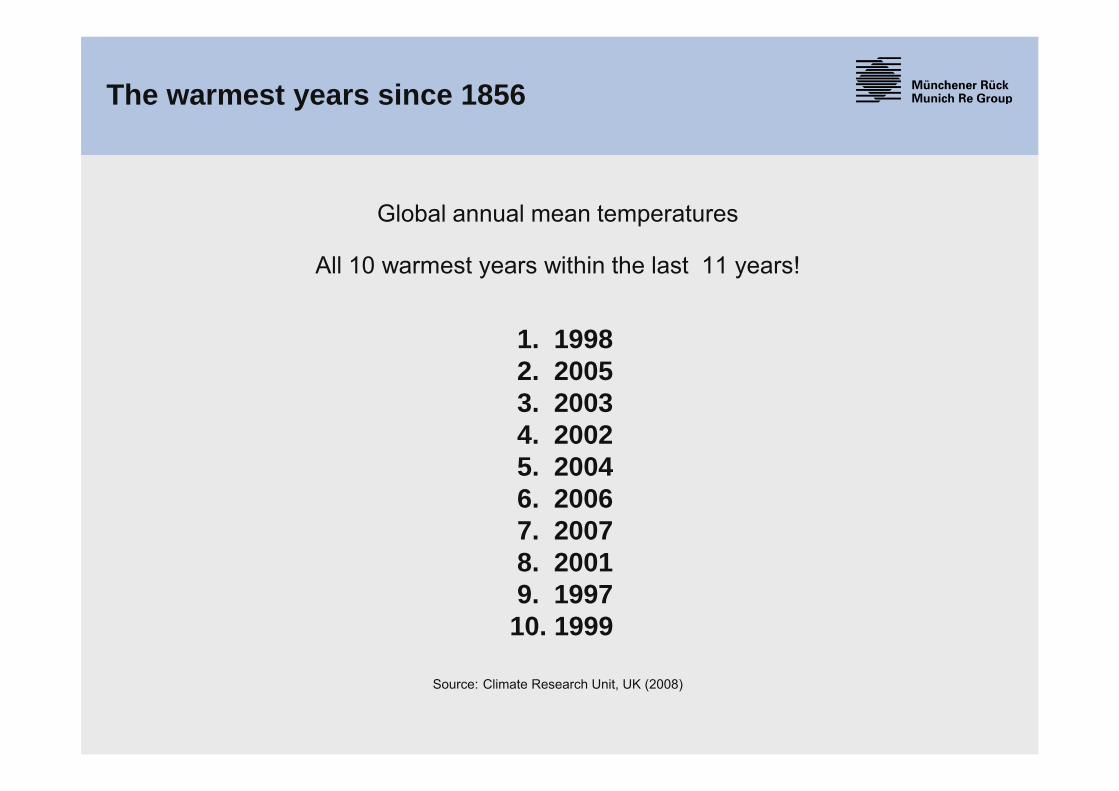
Global annual mean temperatures
All 10 warmest years within the last 11 years!
1. 19982. 2005 3. 20034. 20025. 2004 6. 20067. 2007 8. 20019. 199710. 1999
Source: Climate Research Unit, UK (2008)
The warmest years since 1856
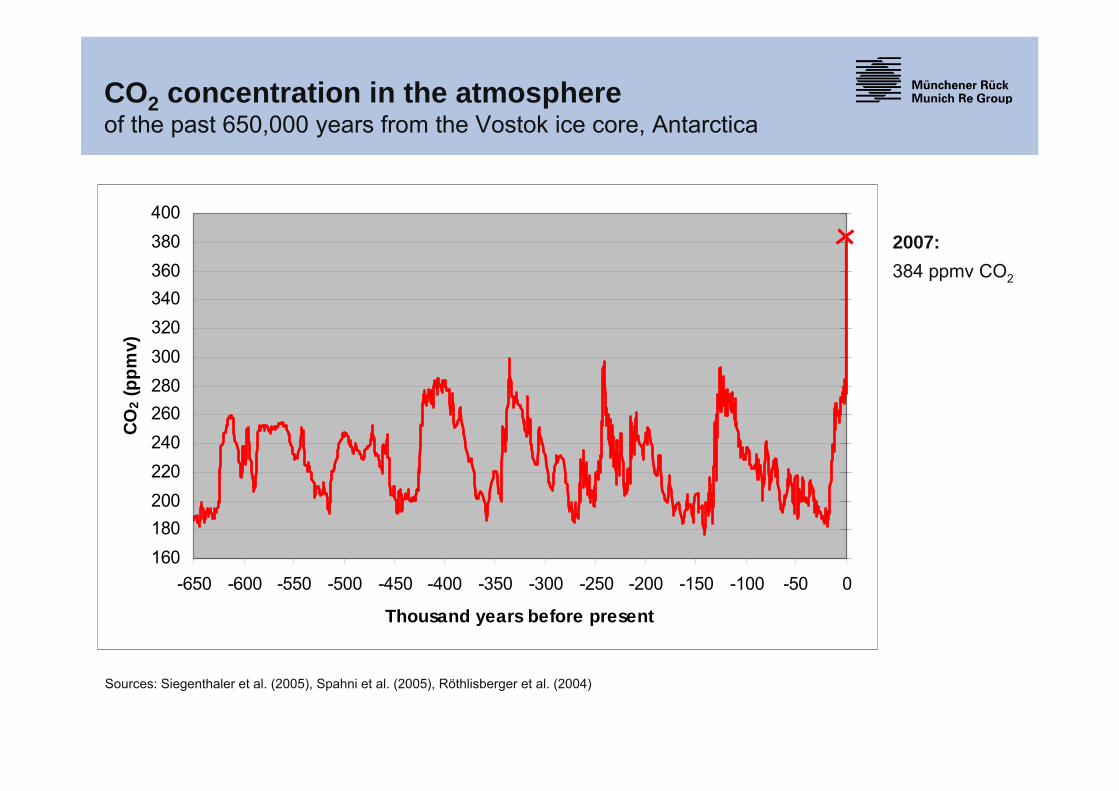
CO2 concentration in the atmosphereof the past 650,000 years from the Vostok ice core, Antarctica
160180200220240260280300320340360380400
-650 -600 -550 -500 -450 -400 -350 -300 -250 -200 -150 -100 -50 0
Thousand years before present
CO2 (
ppm
v)
2007: 384 ppmv CO2
Sources: Siegenthaler et al. (2005), Spahni et al. (2005), Röthlisberger et al. (2004)

The specific vulnerability of cities in respectto climate change
Many cities are located at or close to the sea -> high exposures to wind storm, storm surge and rise of sea level
Evacuations of big cities ahead of weather disasters like hurricanes cause almost unsolvable logistical problems
Damages in infrastructure leading to power outages and public transport breakdown disrupt the basis of urban life
The social structure of big cities can cause problems in the post disaster management (crime)
In big cities global warming is an add on to already existing urban heat islands

Most mega cities are located at the coast
population in coastal regions (2003)
2/3 within 300 km
1/3 within 50 km
1/10 within 5 km
15 of the world’s 20 largest cities are on coastal
plains.
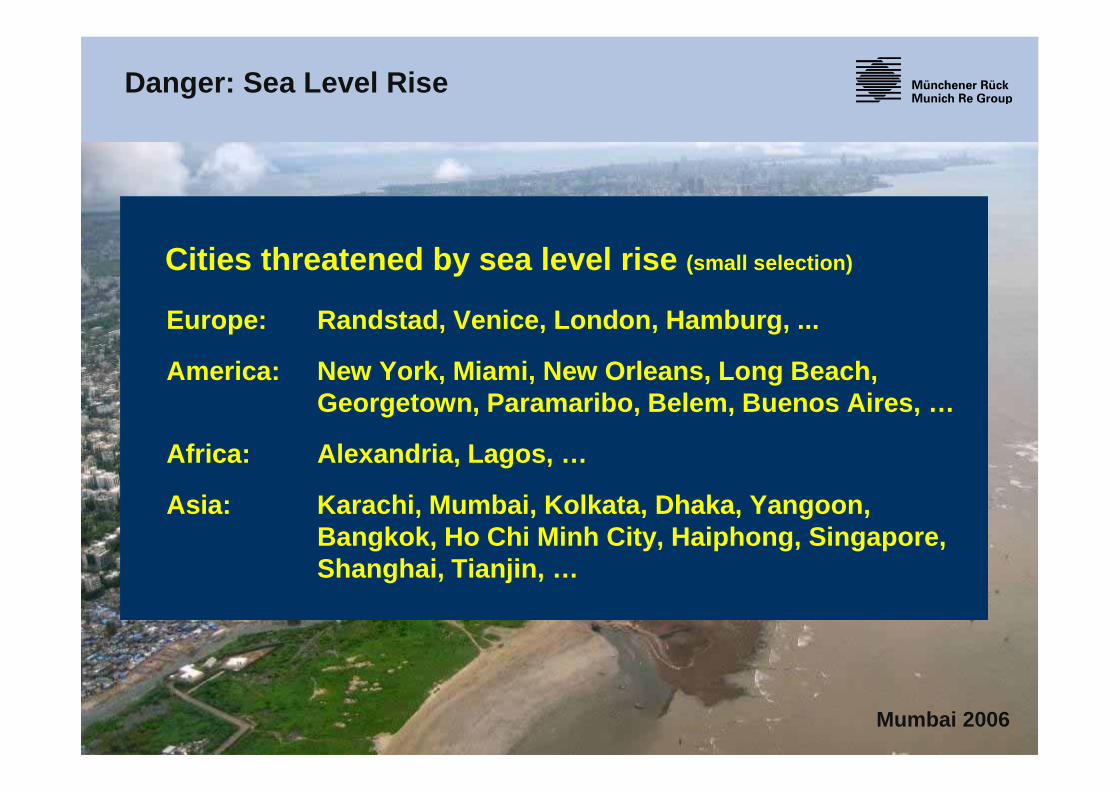
Cities threatened by sea level rise (small selection)
Europe: Randstad, Venice, London, Hamburg, ...
America: New York, Miami, New Orleans, Long Beach, Georgetown, Paramaribo, Belem, Buenos Aires, …
Africa: Alexandria, Lagos, …
Asia: Karachi, Mumbai, Kolkata, Dhaka, Yangoon, Bangkok, Ho Chi Minh City, Haiphong, Singapore, Shanghai, Tianjin, …
Danger: Sea Level Rise
Mumbai 2006
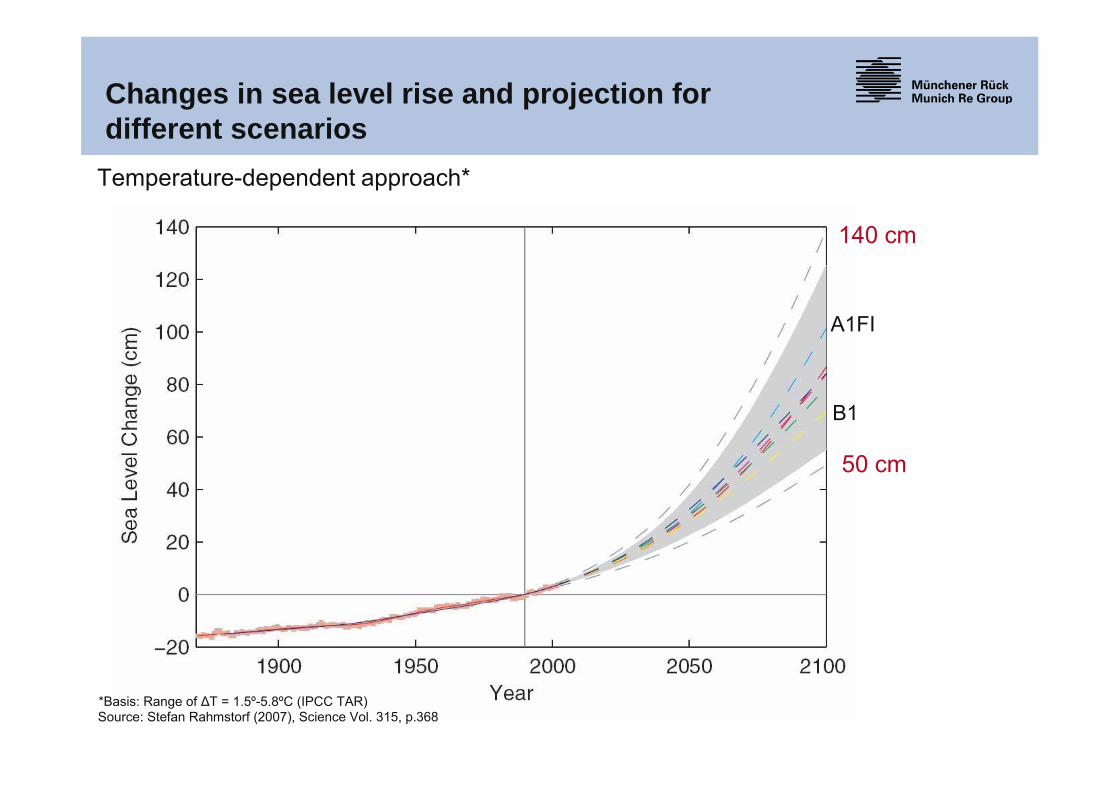
Changes in sea level rise and projection for different scenarios
A1FI
B1
*Basis: Range of ΔT = 1.5º-5.8ºC (IPCC TAR)Source: Stefan Rahmstorf (2007), Science Vol. 315, p.368
Temperature-dependent approach*
140 cm
50 cm

Climate Change and Extreme Weather Events (IPCC, 2007)
very likely > 90% likely >66% more likely than not > 50%
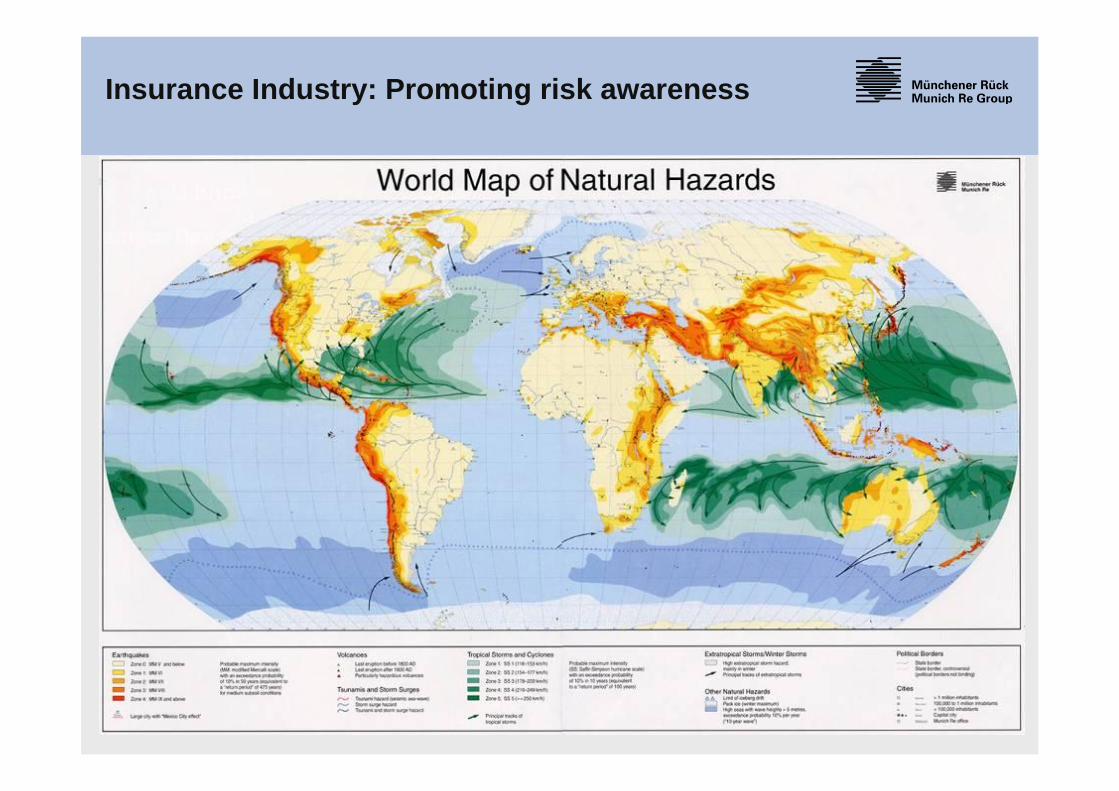
Insurance Industry: Promoting risk awareness
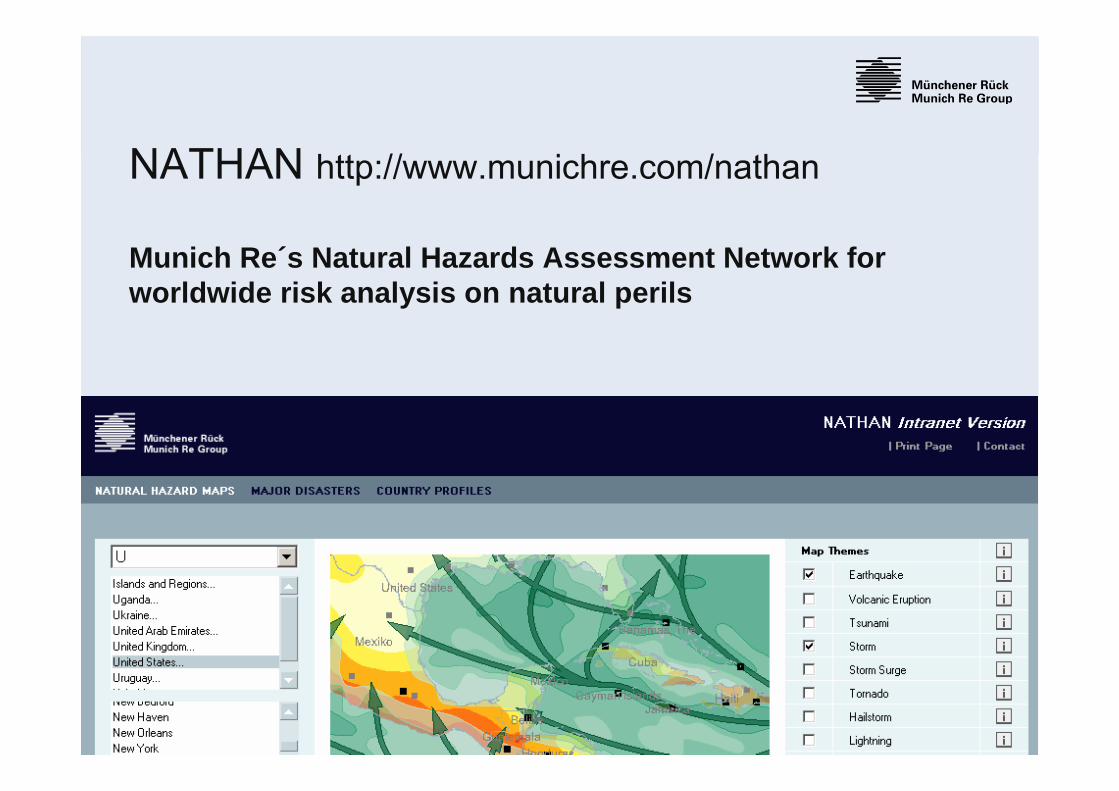
NATHAN http://www.munichre.com/nathan
Munich Re´s Natural Hazards Assessment Network for worldwide risk analysis on natural perils

Natural Hazard Maps
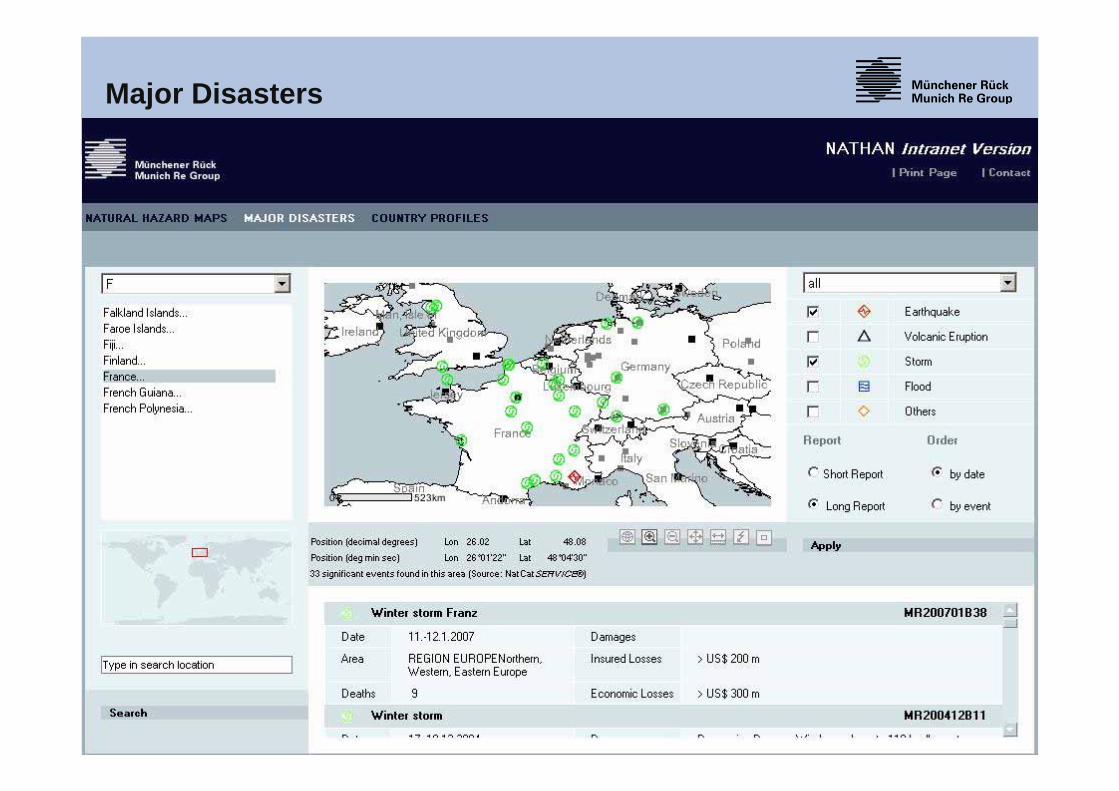
Major Disasters
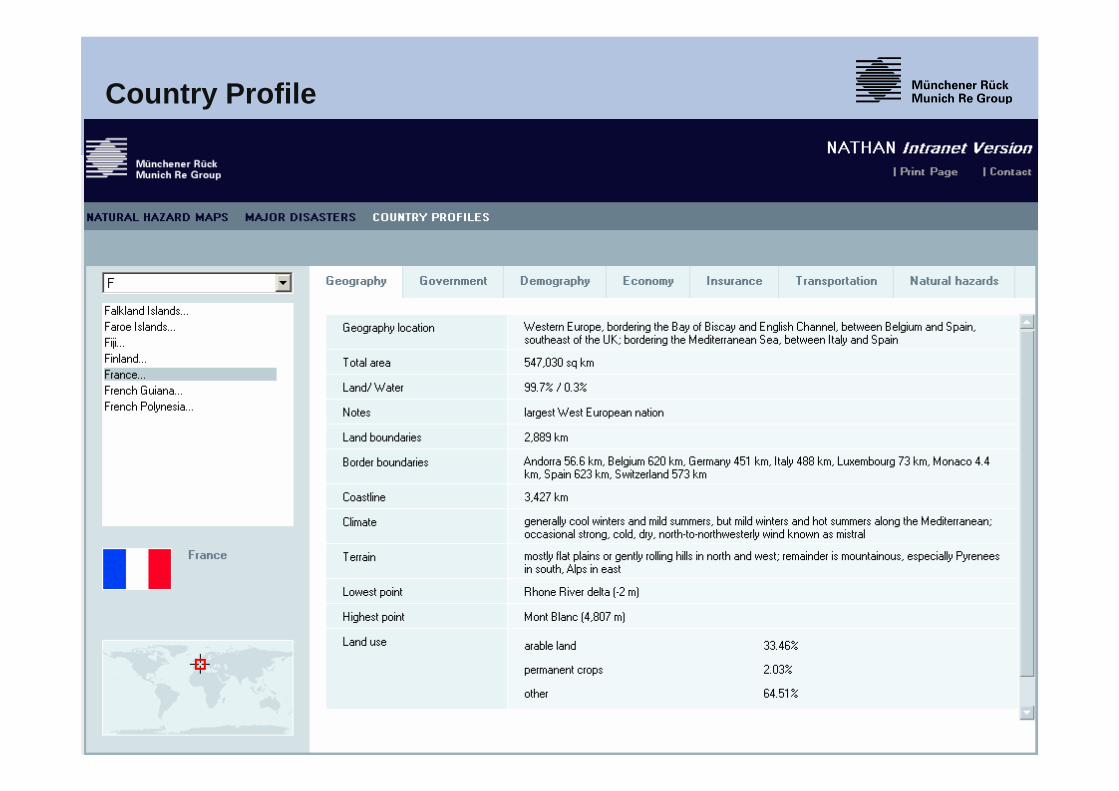
Country Profile

Hazard Exposure
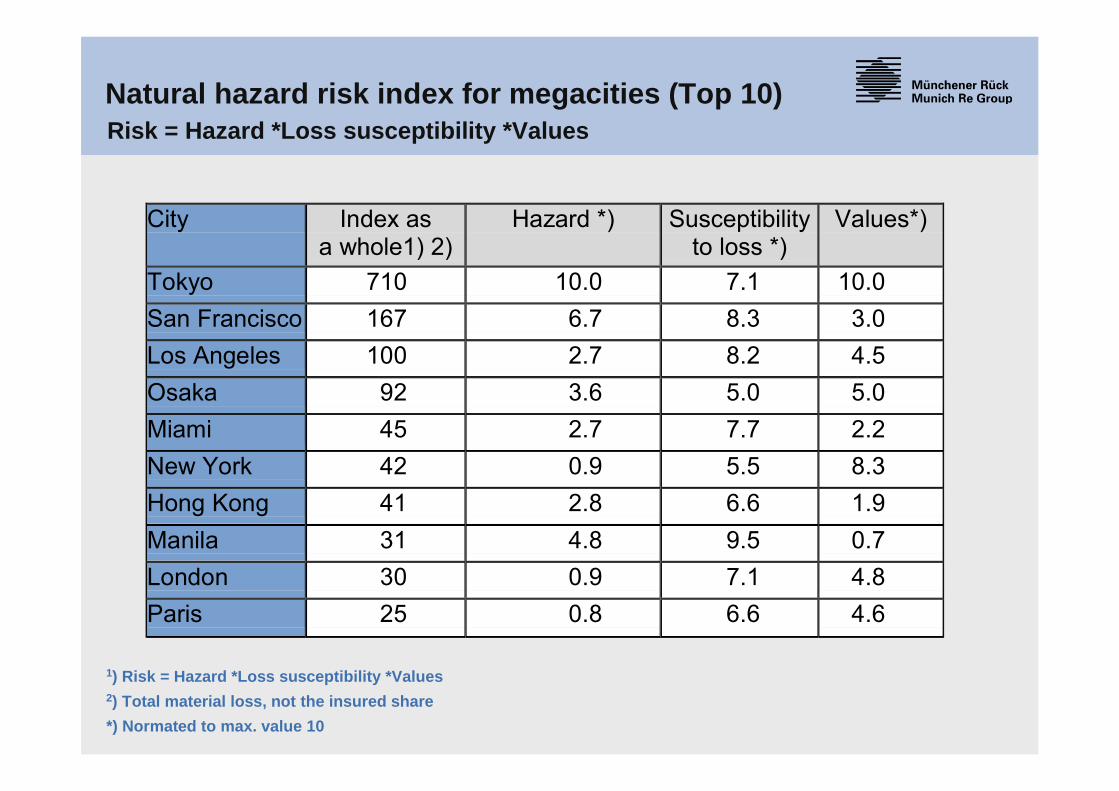
Natural hazard risk index for megacities (Top 10)
1) Risk = Hazard *Loss susceptibility *Values2) Total material loss, not the insured share*) Normated to max. value 10
City Index as a whole1) 2)
Hazard *) Susceptibility to loss *)
Values*)
Tokyo 710 10.0 7.1 10.0 San Francisco 167 6.7 8.3 3.0 Los Angeles 100 2.7 8.2 4.5 Osaka 92 3.6 5.0 5.0 Miami 45 2.7 7.7 2.2 New York 42 0.9 5.5 8.3 Hong Kong 41 2.8 6.6 1.9 Manila 31 4.8 9.5 0.7 London 30 0.9 7.1 4.8 Paris 25 0.8 6.6 4.6
Risk = Hazard *Loss susceptibility *Values
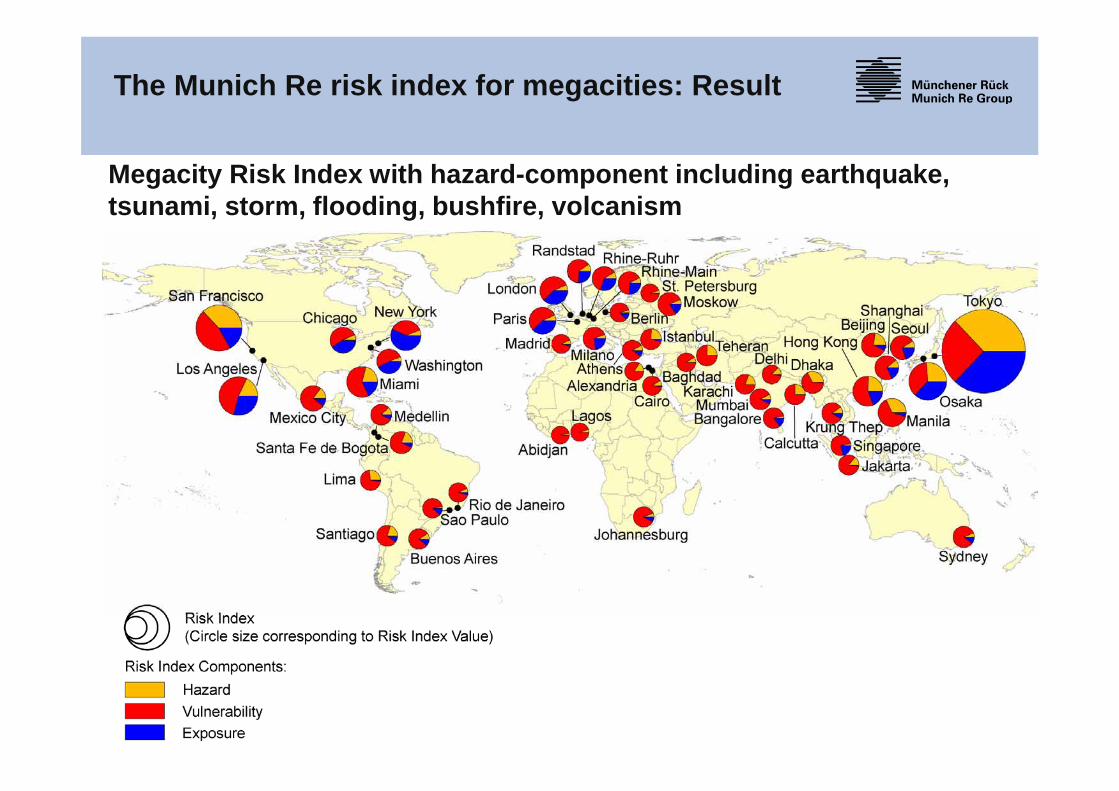
Megacity Risk Index with hazard-component including earthquake, tsunami, storm, flooding, bushfire, volcanism
The Munich Re risk index for megacities: Result

Conclusions
Natural catastrophes, especially weather related events, are increasingdramatically in number and magnitude. Loss potentials have reachednew dimensions
There is more and more scientific evidence for causal links betweenglobal warming and increasing frequencies and intensities of naturalcatastrophes
We have to mitigate global warming and adapt to the changing risks inrespect to the regionally specific risk patterns
New building standards and settlement policies are necessary inrespect to the already existing and also changing natural hazards inorder to reduce the vulnerability
The insurance industry is a competent partner to minimize risks andmaximize awareness
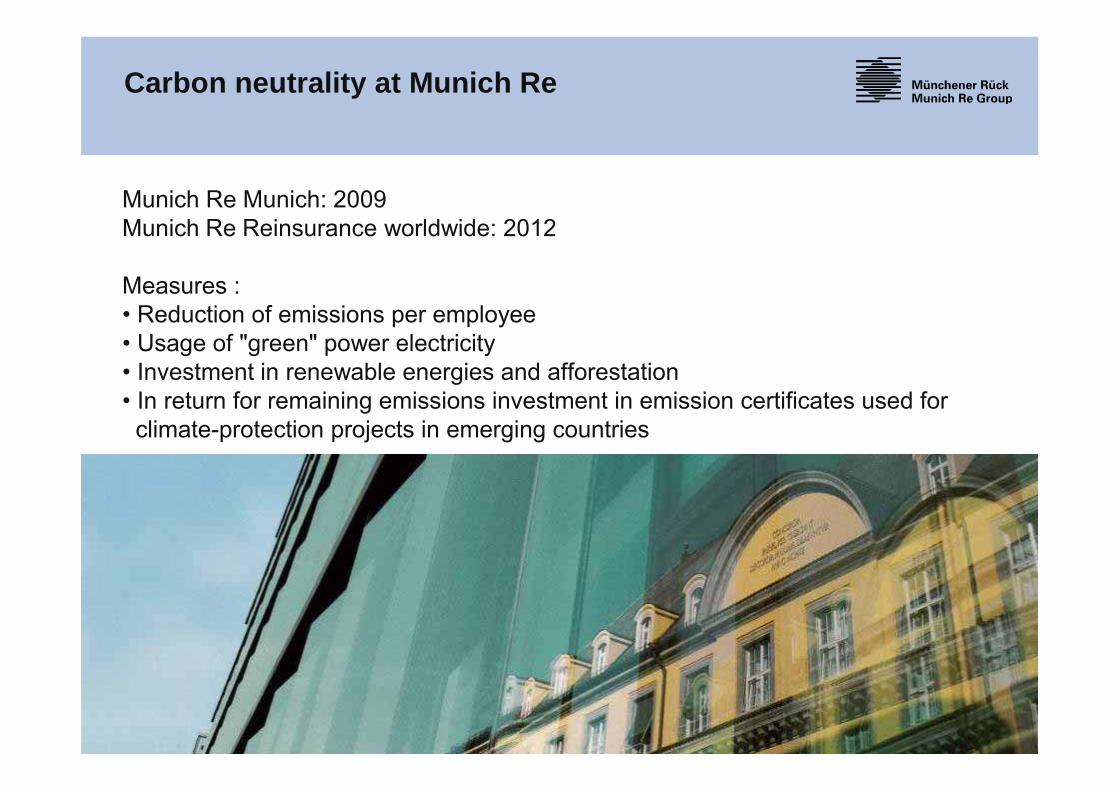
Carbon neutrality at Munich Re
Munich Re Munich: 2009Munich Re Reinsurance worldwide: 2012
Measures :• Reduction of emissions per employee• Usage of "green" power electricity• Investment in renewable energies and afforestation• In return for remaining emissions investment in emission certificates used for
climate-protection projects in emerging countries
Thank you very much for your interest
Peter Hoeppe