professor anthony clayton, university of the west indies 11/06/2015 improving the policy process pan...
Post on 19-Dec-2015
215 views
TRANSCRIPT
Professor Anthony Clayton, Professor Anthony Clayton, University of the West University of the West IndiesIndies
18/04/23
Improving the policy Improving the policy processprocess
•Pan American Health OrganizationPan American Health Organization•Regional Center for Disaster Risk Regional Center for Disaster Risk Reduction, UWIReduction, UWI•CDERA CDERA
Thursday 23Thursday 23rdrd November 2006 November 2006Sunset Jamaica Grande Resort, Ocho RiosSunset Jamaica Grande Resort, Ocho Rios
Professor Anthony ClaytonProfessor Anthony ClaytonUniversity of the West IndiesUniversity of the West Indies
PAHO Leaders 2006PAHO Leaders 2006
Disaster risk reduction, mitigation, preparedness and Disaster risk reduction, mitigation, preparedness and responseresponse
Professor Anthony Clayton, Professor Anthony Clayton, University of the West University of the West IndiesIndies Problems, problems…Problems, problems…
Problem:Problem: why do so many government policies why do so many government policies fail?fail?
Common reasons:Common reasons: failure to understand the task, failure to understand the task, unhelpful misperceptions, assumptions and unhelpful misperceptions, assumptions and politics, policy conflicts, resulting in incoherent politics, policy conflicts, resulting in incoherent priorities & unachievable missions.priorities & unachievable missions.
Examples:Examples:χ Why do countries get poorer when aid flows increase?Why do countries get poorer when aid flows increase?χ Why do we negotiate for aid programs that damage our Why do we negotiate for aid programs that damage our
economy?economy?χ Why do measures to protect jobs increase Why do measures to protect jobs increase
unemployment?unemployment?χ Why do government agencies undermine each other?Why do government agencies undermine each other?χ Why can’t we solve the drug problem?Why can’t we solve the drug problem?
Professor Anthony Clayton, Professor Anthony Clayton, University of the West University of the West IndiesIndies
Example: WarExample: War
The nature of war has changedThe nature of war has changed
Wars were formerly between nations; the majority of conflicts Wars were formerly between nations; the majority of conflicts today involve civil wars/insurgencies. War today is more today involve civil wars/insurgencies. War today is more likely to involve infiltration rather than invasion.likely to involve infiltration rather than invasion.
Wars are increasingly asymmetrical, between security forces Wars are increasingly asymmetrical, between security forces and unconventional irregular forces.and unconventional irregular forces.
In traditional warfare, most of the fatalities were soldiers. In traditional warfare, most of the fatalities were soldiers. Today, most of the casualties are civilians.Today, most of the casualties are civilians.
The nature of war has changed fundamentally; more The nature of war has changed fundamentally; more significant changes are expected over the next 10-20 years.significant changes are expected over the next 10-20 years.
The way in which the issues are perceived by the general The way in which the issues are perceived by the general public (taxpayers, voters, recruits) has not kept pace. So public (taxpayers, voters, recruits) has not kept pace. So there is an increasing disconnect.there is an increasing disconnect.
Even more important, the way in which the issues are Even more important, the way in which the issues are perceived by the professionals has not kept pace…perceived by the professionals has not kept pace…

Professor Anthony Clayton, Professor Anthony Clayton, University of the West University of the West IndiesIndies Wargame exposed gaping hole in Pentagon Wargame exposed gaping hole in Pentagon
strategystrategy• When terror came out of a clear blue sky on When terror came out of a clear blue sky on
September 11, some of the Pentagon's top brass were September 11, some of the Pentagon's top brass were given a jolting reminder of a wargame they played in given a jolting reminder of a wargame they played in 1997. In the game, the US was pitted against a 1997. In the game, the US was pitted against a zealous, decentralised terror organisation very like al-zealous, decentralised terror organisation very like al-Qaida, and the US lost. Each time the US forces Qaida, and the US lost. Each time the US forces thought they had scored a blow against the terror thought they had scored a blow against the terror organisation, it would regenerate itself to strike on organisation, it would regenerate itself to strike on another front. It emerged from the campaign more or another front. It emerged from the campaign more or less unscathed. less unscathed.
• That was four years ago, but some of the military That was four years ago, but some of the military strategists who organized the game believe the strategists who organized the game believe the Pentagon failed to learn the lessons from the Pentagon failed to learn the lessons from the wargame, and said yesterday that the US military was wargame, and said yesterday that the US military was still a long way from readiness to fight the adversary still a long way from readiness to fight the adversary it now faced. it now faced.
Julian Borger, The Guardian Tuesday September 25, 2001Julian Borger, The Guardian Tuesday September 25, 2001
Professor Anthony Clayton, Professor Anthony Clayton, University of the West University of the West IndiesIndies
• According to Doug Johnson, a strategic studies professor According to Doug Johnson, a strategic studies professor involved in the 1997 exercise, the army lost because “it didn't involved in the 1997 exercise, the army lost because “it didn't want to play that game”. The army brass, Dr Johnson said, want to play that game”. The army brass, Dr Johnson said, “were intent on fighting a variation of a war against large tank “were intent on fighting a variation of a war against large tank armies on the central plains of somewhere”. At one point, the armies on the central plains of somewhere”. At one point, the Pentagon officers involved became so frustrated with their Pentagon officers involved became so frustrated with their elusive opponents that they asked for the game organizers to elusive opponents that they asked for the game organizers to have a friendly government's armoured battalion defect to the have a friendly government's armoured battalion defect to the other side. “They did it to give someone to blast,” Dr Johnson other side. “They did it to give someone to blast,” Dr Johnson said. “Everyone went away feeling viscerally satisfied.”said. “Everyone went away feeling viscerally satisfied.”
• As a result, they missed the point. The terror organisation still As a result, they missed the point. The terror organisation still had most of its cells in place, and a functioning financial had most of its cells in place, and a functioning financial network. network.
• ““Within the contours of that particular game, the American Within the contours of that particular game, the American forces and their allies simply weren't configured to deal with an forces and their allies simply weren't configured to deal with an enemy like the one we created,” said Steven Metz, head of the enemy like the one we created,” said Steven Metz, head of the Army War College's regional strategy and planning department. Army War College's regional strategy and planning department.
The Pentagon: still fighting the wrong warThe Pentagon: still fighting the wrong war
Professor Anthony Clayton, Professor Anthony Clayton, University of the West University of the West IndiesIndies Lessons?Lessons?
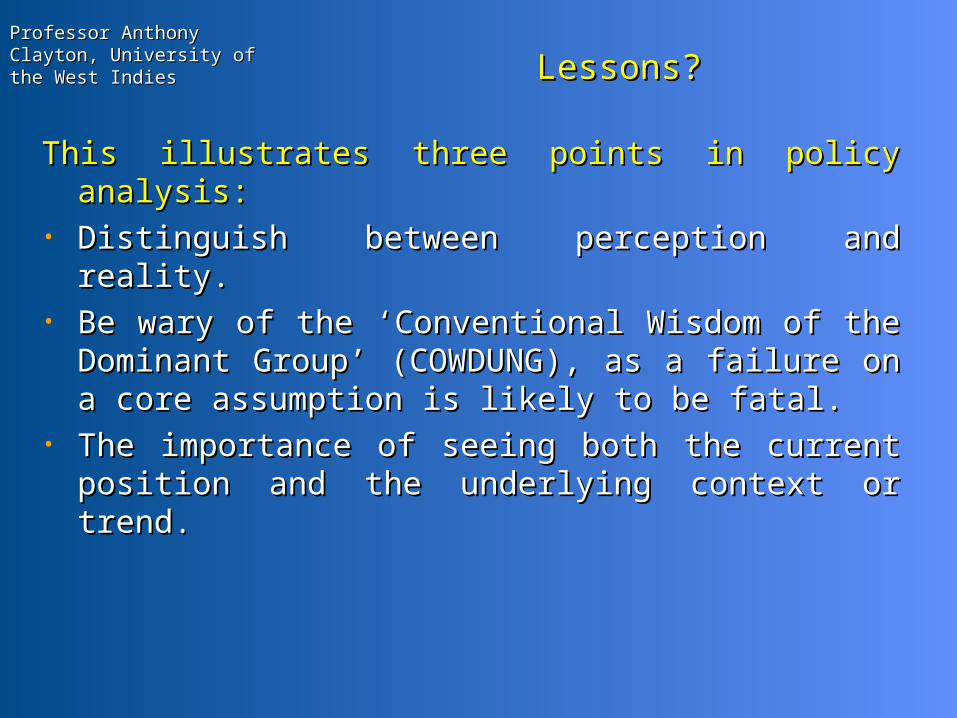
This illustrates three points in policy analysis:This illustrates three points in policy analysis:• Distinguish between perception and reality.Distinguish between perception and reality.• Be wary of the ‘Conventional Wisdom of the Be wary of the ‘Conventional Wisdom of the
Dominant Group’ (COWDUNG), as a failure on a Dominant Group’ (COWDUNG), as a failure on a core assumption is likely to be fatal.core assumption is likely to be fatal.
• The importance of seeing both the current position The importance of seeing both the current position and the underlying context or trend.and the underlying context or trend.

Professor Anthony Clayton, Professor Anthony Clayton, University of the West University of the West IndiesIndies Making better policyMaking better policy
Question:Question: how can we increase the chances of success? how can we increase the chances of success?
Answer: Answer: a more systematic approach, to help usa more systematic approach, to help us• Control for preconceived ideas and assumptionsControl for preconceived ideas and assumptions• Check the facts, get the problem into focusCheck the facts, get the problem into focus• Identify our optionsIdentify our options• For each option, identify costs and trade-offsFor each option, identify costs and trade-offs• Agree our prioritiesAgree our priorities• Build the necessary consensus about the way Build the necessary consensus about the way
forwardforward• Implement!Implement!• Monitor, change tactics if required, stay focused on Monitor, change tactics if required, stay focused on
the goalthe goal
Professor Anthony Clayton, Professor Anthony Clayton, University of the West University of the West IndiesIndies
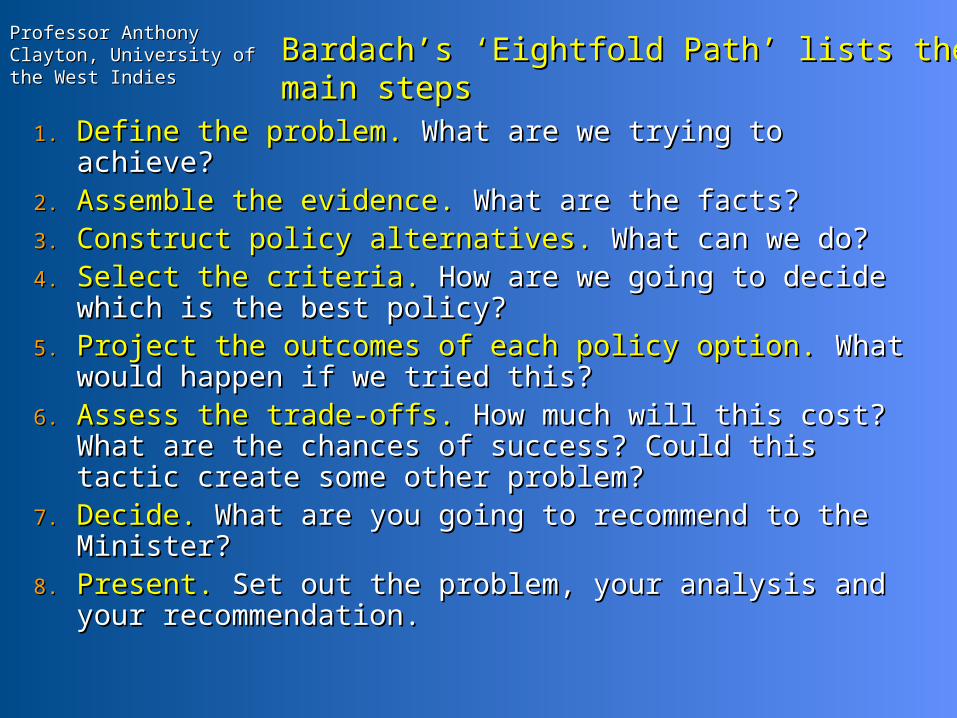
Bardach’s ‘Eightfold Path’ lists the main Bardach’s ‘Eightfold Path’ lists the main stepssteps
1.1. Define the problem.Define the problem. What are we trying to achieve? What are we trying to achieve?2.2. Assemble the evidence.Assemble the evidence. What are the facts? What are the facts?3.3. Construct policy alternatives.Construct policy alternatives. What can we do? What can we do?4.4. Select the criteria.Select the criteria. How are we going to decide How are we going to decide
which is the best policy?which is the best policy?5.5. Project the outcomes of each policy option.Project the outcomes of each policy option. What What
would happen if we tried this?would happen if we tried this?6.6. Assess the trade-offs.Assess the trade-offs. How much will this cost? How much will this cost?
What are the chances of success? Could this tactic What are the chances of success? Could this tactic create some other problem?create some other problem?
7.7. Decide.Decide. What are you going to recommend to the What are you going to recommend to the Minister?Minister?
8.8. Present.Present. Set out the problem, your analysis and Set out the problem, your analysis and your recommendation.your recommendation.

Professor Anthony Clayton, Professor Anthony Clayton, University of the West University of the West IndiesIndies 3) Constructing policy alternatives3) Constructing policy alternatives
• Must be evidence-based (from stage 2).Must be evidence-based (from stage 2).• Take into account a range of expert advice and Take into account a range of expert advice and
stakeholder views.stakeholder views.• Represent the main bodies of opinion.Represent the main bodies of opinion.• Help to bring issues into focus (usually achieved Help to bring issues into focus (usually achieved
by making sure that alternatives are sufficiently by making sure that alternatives are sufficiently diverse).diverse).
• Example 1:Example 1: Swedish defence policy Swedish defence policy• Example 2:Example 2: Go Big, Go Long, Go Home. Go Big, Go Long, Go Home.
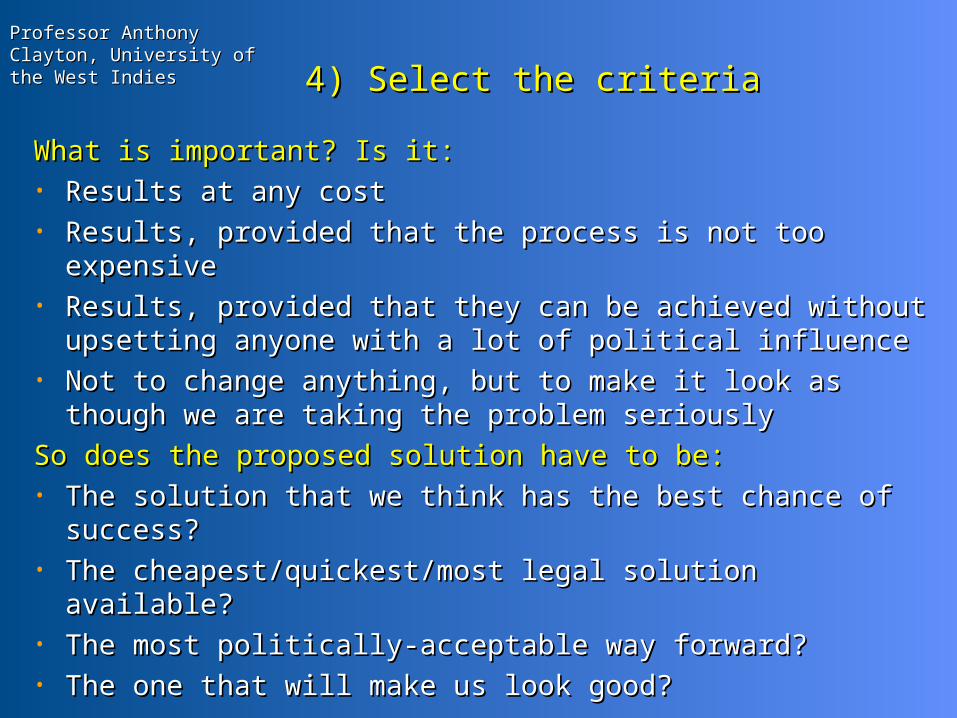
Professor Anthony Clayton, Professor Anthony Clayton, University of the West University of the West IndiesIndies 4) Select the criteria4) Select the criteria
What is important? Is it:What is important? Is it:• Results at any costResults at any cost• Results, provided that the process is not too expensiveResults, provided that the process is not too expensive• Results, provided that they can be achieved without Results, provided that they can be achieved without
upsetting anyone with a lot of political influenceupsetting anyone with a lot of political influence• Not to change anything, but to make it look as though Not to change anything, but to make it look as though
we are taking the problem seriouslywe are taking the problem seriously
So does the proposed solution have to be:So does the proposed solution have to be:• The solution that we think has the best chance of The solution that we think has the best chance of
success?success?• The cheapest/quickest/most legal solution available?The cheapest/quickest/most legal solution available?• The most politically-acceptable way forward?The most politically-acceptable way forward?• The one that will make us look good?The one that will make us look good?
Professor Anthony Clayton, Professor Anthony Clayton, University of the West University of the West IndiesIndies
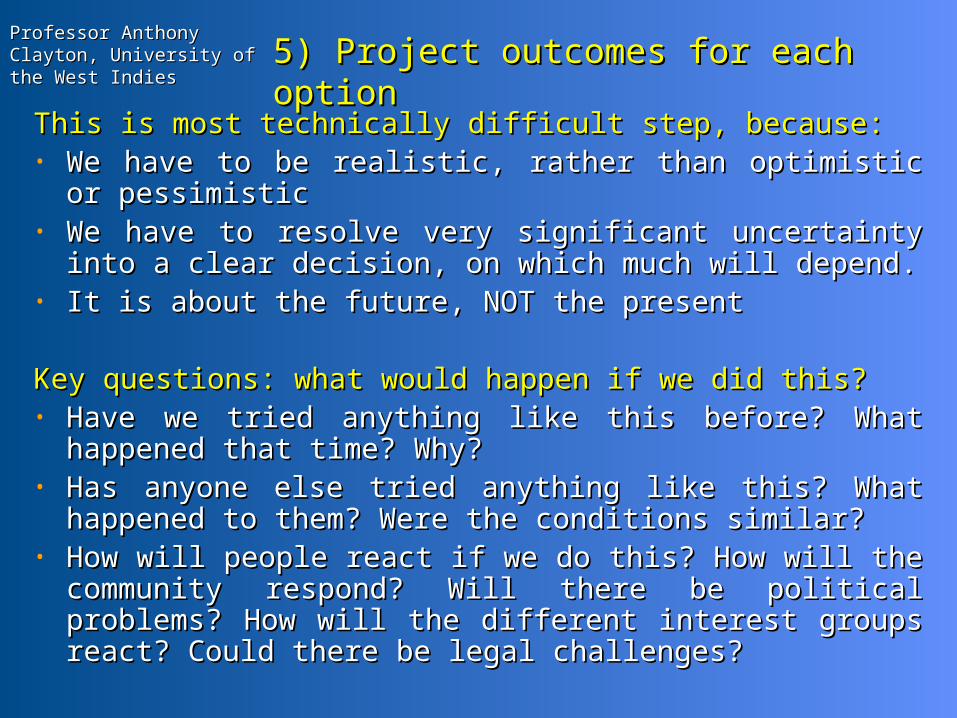
5) Project outcomes for each option5) Project outcomes for each option
This is most technically difficult step, because:This is most technically difficult step, because:• We have to be realistic, rather than optimistic or We have to be realistic, rather than optimistic or
pessimisticpessimistic• We have to resolve very significant uncertainty into a We have to resolve very significant uncertainty into a
clear decision, on which much will depend.clear decision, on which much will depend.• It is about the future, NOT the presentIt is about the future, NOT the present Key questions: what would happen if we did this?Key questions: what would happen if we did this?• Have we tried anything like this before? What Have we tried anything like this before? What
happened that time? Why?happened that time? Why?• Has anyone else tried anything like this? What Has anyone else tried anything like this? What
happened to them? Were the conditions similar?happened to them? Were the conditions similar?• How will people react if we do this? How will the How will people react if we do this? How will the
community respond? Will there be political problems? community respond? Will there be political problems? How will the different interest groups react? Could How will the different interest groups react? Could there be legal challenges?there be legal challenges?

Professor Anthony Clayton, Professor Anthony Clayton, University of the West University of the West IndiesIndies Estimating impacts and costsEstimating impacts and costs
Example: the cost of crime control in Jamaica:Example: the cost of crime control in Jamaica:• ‘‘For J$180m we can reduce homicides by 5%’.For J$180m we can reduce homicides by 5%’.• If 5% = 80 homicides, cost of reduction = If 5% = 80 homicides, cost of reduction =
$2.25m/homicide.$2.25m/homicide.• What are the chances of success? 90%? 50%? 10%? What are the chances of success? 90%? 50%? 10%?
1%?1%?• What are the risks of unwanted side effects?What are the risks of unwanted side effects?• How does this compare against e.g. investment in How does this compare against e.g. investment in
schools?schools?
Bearing in mind that:Bearing in mind that: o Job security increases unemploymentJob security increases unemploymento Safer drivers take more risksSafer drivers take more riskso Free zones encourage relocation, not job-creationFree zones encourage relocation, not job-creation

Professor Anthony Clayton, Professor Anthony Clayton, University of the West University of the West IndiesIndies 6) Dealing with trade-offs6) Dealing with trade-offs
• One option is clearly the best (rare)One option is clearly the best (rare)• Each option has a different combination of costs and benefits Each option has a different combination of costs and benefits
(the usual situation)(the usual situation)
OptionOption CostCost Chance of Chance of successsuccess
RisksRisks
AA MediumMedium HighHigh HighHigh
BB LowLow LowLow MediumMedium
CC HighHigh MediumMedium LowLow
Professor Anthony Clayton, Professor Anthony Clayton, University of the West University of the West IndiesIndies Aggregated vs disaggregated decision-Aggregated vs disaggregated decision-
makingmaking
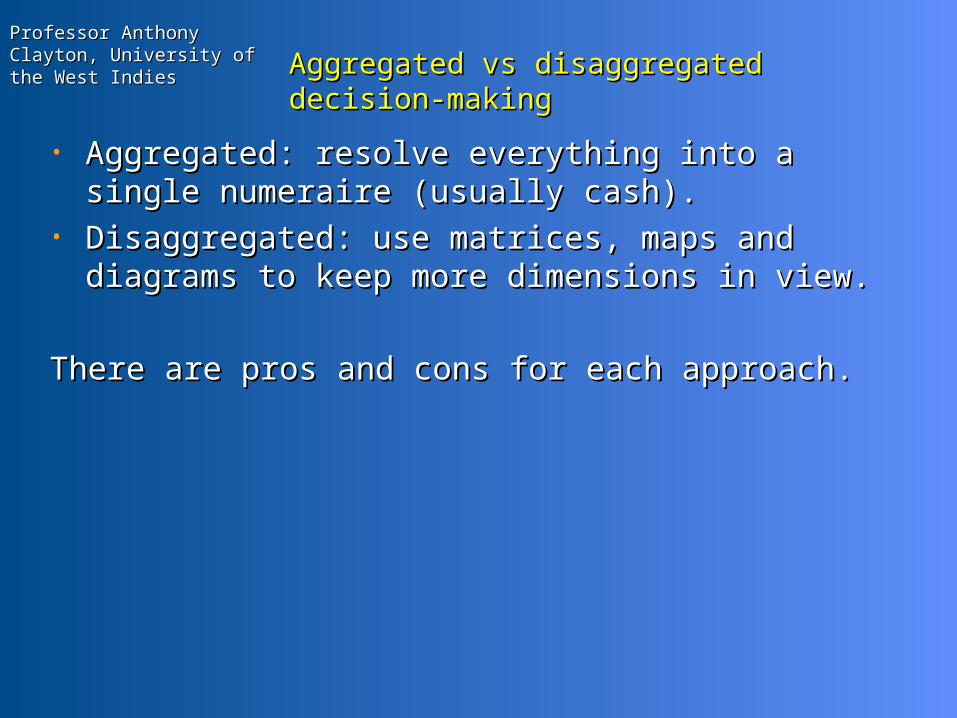
• Aggregated: resolve everything into a single Aggregated: resolve everything into a single numeraire (usually cash).numeraire (usually cash).
• Disaggregated: use matrices, maps and Disaggregated: use matrices, maps and diagrams to keep more dimensions in view.diagrams to keep more dimensions in view.
There are pros and cons for each approach.There are pros and cons for each approach.
Professor Anthony Clayton, Professor Anthony Clayton, University of the West University of the West IndiesIndies
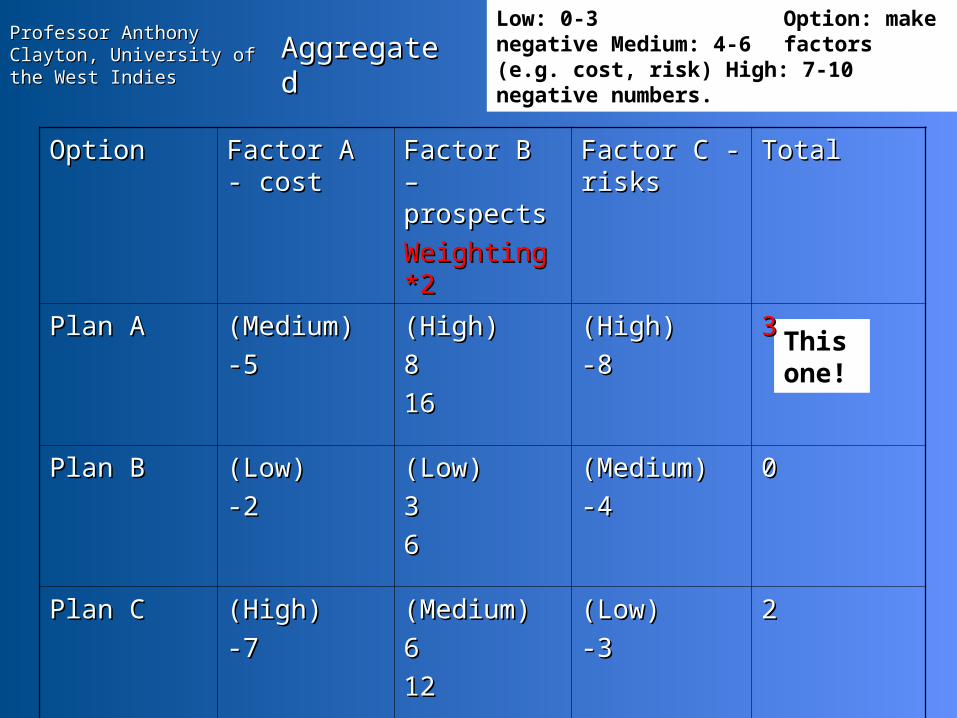
AggregatedAggregatedLow: 0-3 Option: make negative Medium: 4-6 factors (e.g. cost, risk) High: 7-10 negative numbers.
This one!
OptionOption Factor A - Factor A - costcost
Factor B – Factor B – prospectsprospects
Weighting Weighting *2*2
Factor C - Factor C - risksrisks
TotalTotal
Plan APlan A (Medium)(Medium)
-5-5(High)(High)
88
1616
(High)(High)
-8-833
Plan BPlan B (Low)(Low)
-2-2(Low)(Low)
33
66
(Medium)(Medium)
-4-400
Plan CPlan C (High)(High)
-7-7(Medium)(Medium)
66
1212
(Low)(Low)
-3-322

Professor Anthony Clayton, Professor Anthony Clayton, University of the West University of the West IndiesIndies
Probability/impact matrixProbability/impact matrix
• The conclusions from a policy exercise usually The conclusions from a policy exercise usually have to be absorbed into a government (or have to be absorbed into a government (or business) agenda that is already crowded. It is business) agenda that is already crowded. It is important to have greater clarity about future important to have greater clarity about future problems and potential solutions, but that does problems and potential solutions, but that does not remove the need to make the large number of not remove the need to make the large number of day-to-day decisions involved in managing a day-to-day decisions involved in managing a Ministry or government agency.Ministry or government agency.
• So it is important to have priorities for action.So it is important to have priorities for action.• A probability – impact matrix is a way of A probability – impact matrix is a way of
organizing these priorities. It is similar to the organizing these priorities. It is similar to the triage used by military doctors when dealing with triage used by military doctors when dealing with incoming casualties. incoming casualties.

Professor Anthony Clayton, Professor Anthony Clayton, University of the West University of the West IndiesIndies Probability/impact matrixProbability/impact matrix
Low impactLow impact High impactHigh impact
Low probabilityLow probability
High probabilityHigh probability
Risk of critical failure!Risk of critical failure!
Ignore
Low priority
Monitor carefully
Top priority

Professor Anthony Clayton, Professor Anthony Clayton, University of the West University of the West IndiesIndies
High impact, low probability (we High impact, low probability (we thought…)thought…)
• It is sensible to allocate most time and resources to It is sensible to allocate most time and resources to high impact, high probability events, but it is also high impact, high probability events, but it is also important to monitor high impact, low probability important to monitor high impact, low probability events… events…
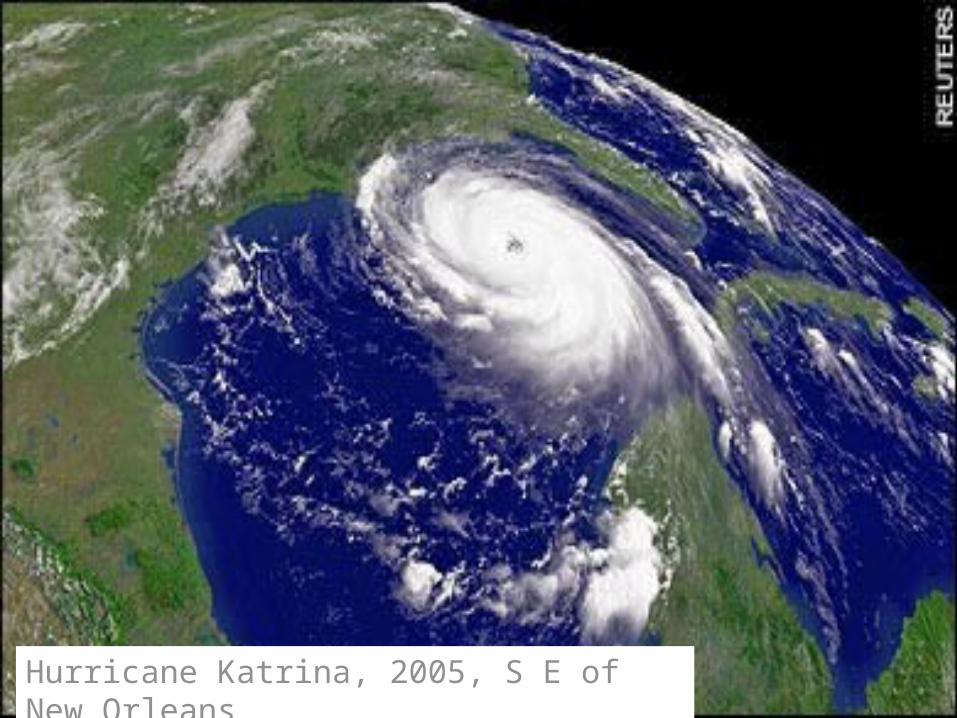
• The US Federal Emergency Management Agency The US Federal Emergency Management Agency knew that New Orleans was potentially vulnerable to knew that New Orleans was potentially vulnerable to a hurricane, and had identified this as one of the a hurricane, and had identified this as one of the three worst disasters that could befall the United three worst disasters that could befall the United States. This was, however, seen by the administration States. This was, however, seen by the administration as a low probability event.as a low probability event.
• On the 28th–29th August 2005, Hurricane Katrina On the 28th–29th August 2005, Hurricane Katrina resulted in a 28-foot storm surge as well as torrential resulted in a 28-foot storm surge as well as torrential rain, the latter raised the height of Lake Pontchartrain rain, the latter raised the height of Lake Pontchartrain by 7.6 feet, and the combination overwhelmed the by 7.6 feet, and the combination overwhelmed the levees that protected the city of New Orleans. About levees that protected the city of New Orleans. About 80% of the city, which is on average about 6 feet 80% of the city, which is on average about 6 feet below sea level, was then flooded.below sea level, was then flooded.
Unprepared. The Washington Post. Monday, September 5th, 2005Unprepared. The Washington Post. Monday, September 5th, 2005
Professor Anthony Clayton, Professor Anthony Clayton, University of the West University of the West IndiesIndies 7) Decide7) Decide
• Are you convinced?Are you convinced?• Are your colleagues convinced?Are your colleagues convinced?• Are the external experts, independent advisors, Are the external experts, independent advisors,
stakeholders convinced?stakeholders convinced?

Professor Anthony Clayton, Professor Anthony Clayton, University of the West University of the West IndiesIndies 8) Final presentation8) Final presentation
State the following:State the following:• The problemThe problem• The analysis of trends, causesThe analysis of trends, causes• Options, intervention pointsOptions, intervention points• Benefits, costs, trade-offs and risksBenefits, costs, trade-offs and risks• RecommendationRecommendation
Professor Anthony Clayton, Professor Anthony Clayton, University of the West University of the West IndiesIndies Project management toolsProject management tools
There are a range of useful tools, including:There are a range of useful tools, including:• Project cycle managementProject cycle management• LogFrame planningLogFrame planning• Critical Path AnalysisCritical Path Analysis• PERT analysisPERT analysis• Gantt chartsGantt charts
These can help to:These can help to:• Identify the important sub-tasks.Identify the important sub-tasks.• Identify the dependencies between sub-tasks.Identify the dependencies between sub-tasks.• Organize the dependent sub-tasks into the Organize the dependent sub-tasks into the
appropriate sequence.appropriate sequence.• Identify potential vulnerabilities.Identify potential vulnerabilities.• Identify the minimum time required to complete a Identify the minimum time required to complete a
project.project.• Identify where resources can be optimally allocated.Identify where resources can be optimally allocated.

Professor Anthony Clayton, Professor Anthony Clayton, University of the West University of the West IndiesIndies Project cycle management (1)Project cycle management (1)
Most projects can be divided into a 6 phase Most projects can be divided into a 6 phase project cycle:project cycle:1.1. Defining the theme.Defining the theme. This is the choice of area, usually a This is the choice of area, usually a
list of key problems that require a policy intervention list of key problems that require a policy intervention (typically scoring high on risk, public concern, or assessed (typically scoring high on risk, public concern, or assessed chances of success).chances of success).
2.2. Project identification.Project identification. This is the initial formulation of This is the initial formulation of ideas for the actual project, including objectives, ideas for the actual project, including objectives, expected results and a list of the actions to be taken. The expected results and a list of the actions to be taken. The goal at this stage is to work out whether it is worth going goal at this stage is to work out whether it is worth going ahead with a feasibility/pilot study. If the answer is yes, ahead with a feasibility/pilot study. If the answer is yes, then the next step is usually to draw up the terms of then the next step is usually to draw up the terms of reference and undertake the study.reference and undertake the study.
3.3. Formulation.Formulation. This involves looking at the results of the This involves looking at the results of the feasibility or pilot study and specifying the project itself. feasibility or pilot study and specifying the project itself. Objectives, expected results and a list of the actions to be Objectives, expected results and a list of the actions to be taken must now be set down in precise detail. These must taken must now be set down in precise detail. These must then be checked back against the theme defined earlier. then be checked back against the theme defined earlier. If the project is going to require external funding, it is at If the project is going to require external funding, it is at this stage that you decide whether or not to draw up a this stage that you decide whether or not to draw up a bid for funds.bid for funds.
Professor Anthony Clayton, Professor Anthony Clayton, University of the West University of the West IndiesIndies Project cycle management (2)Project cycle management (2)
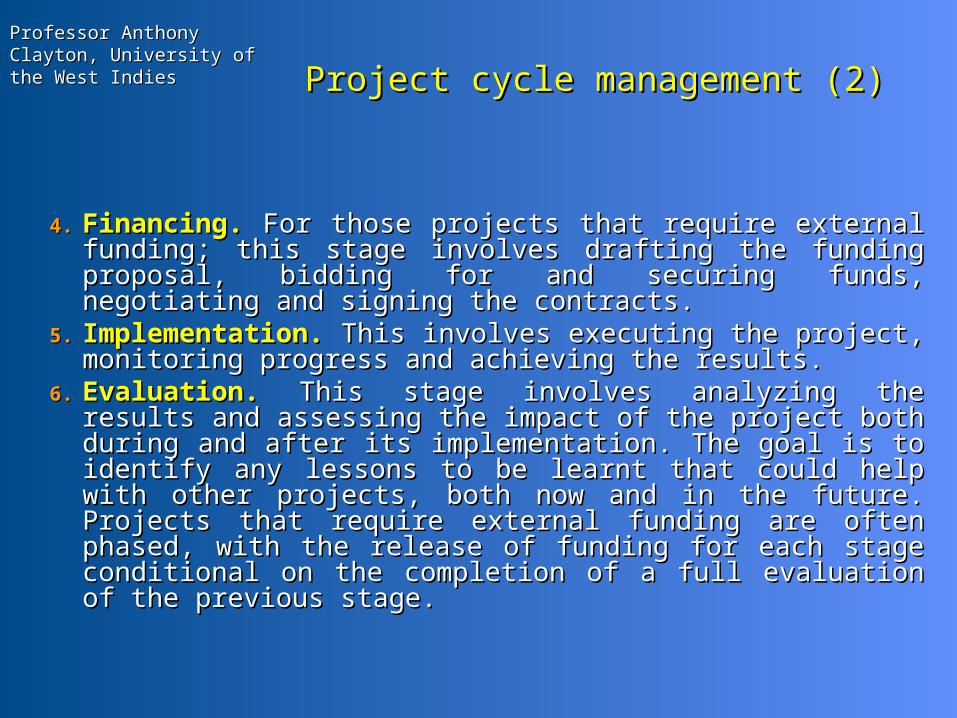
4.4. Financing.Financing. For those projects that require external For those projects that require external funding; this stage involves drafting the funding funding; this stage involves drafting the funding proposal, bidding for and securing funds, negotiating proposal, bidding for and securing funds, negotiating and signing the contracts.and signing the contracts.
5.5. Implementation.Implementation. This involves executing the project, This involves executing the project, monitoring progress and achieving the results.monitoring progress and achieving the results.
6.6. Evaluation.Evaluation. This stage involves analyzing the results This stage involves analyzing the results and assessing the impact of the project both during and and assessing the impact of the project both during and after its implementation. The goal is to identify any after its implementation. The goal is to identify any lessons to be learnt that could help with other projects, lessons to be learnt that could help with other projects, both now and in the future. Projects that require both now and in the future. Projects that require external funding are often phased, with the release of external funding are often phased, with the release of funding for each stage conditional on the completion of funding for each stage conditional on the completion of a full evaluation of the previous stage.a full evaluation of the previous stage.
Professor Anthony Clayton, Professor Anthony Clayton, University of the West University of the West IndiesIndies LogFrame: risk reductionLogFrame: risk reduction
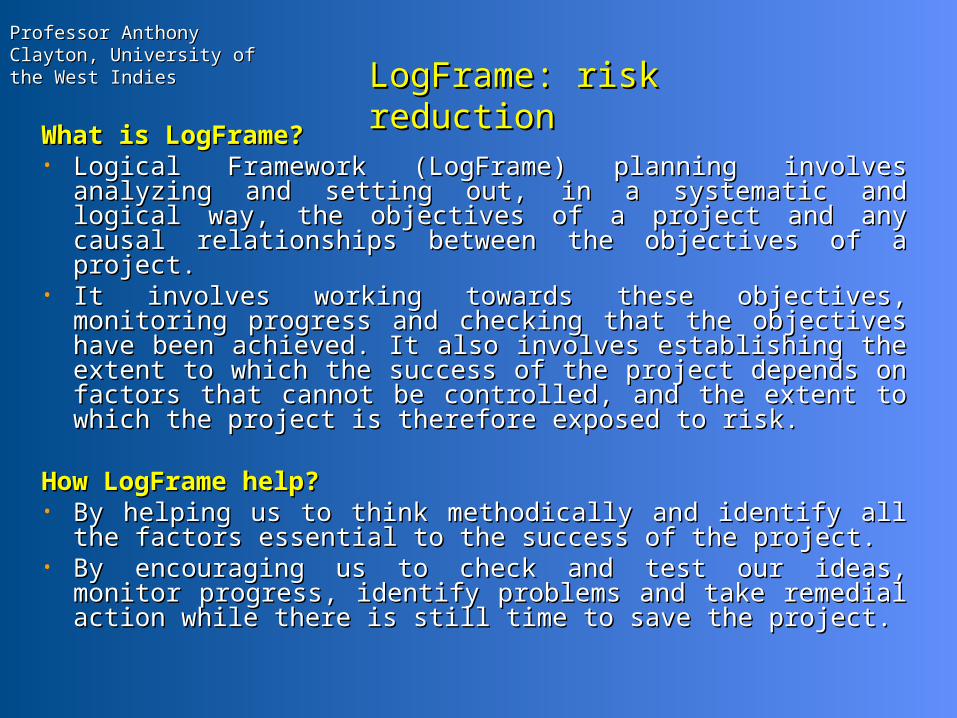
What is LogFrame?What is LogFrame?• Logical Framework (LogFrame) planning involves Logical Framework (LogFrame) planning involves
analyzing and setting out, in a systematic and logical way, analyzing and setting out, in a systematic and logical way, the objectives of a project and any causal relationships the objectives of a project and any causal relationships between the objectives of a project.between the objectives of a project.
• It involves working towards these objectives, monitoring It involves working towards these objectives, monitoring progress and checking that the objectives have been progress and checking that the objectives have been achieved. It also involves establishing the extent to which achieved. It also involves establishing the extent to which the success of the project depends on factors that cannot the success of the project depends on factors that cannot be controlled, and the extent to which the project is be controlled, and the extent to which the project is therefore exposed to risk.therefore exposed to risk.
How LogFrame help?How LogFrame help?• By helping us to think methodically and identify all the By helping us to think methodically and identify all the
factors essential to the success of the project.factors essential to the success of the project.• By encouraging us to check and test our ideas, monitor By encouraging us to check and test our ideas, monitor
progress, identify problems and take remedial action while progress, identify problems and take remedial action while there is still time to save the project.there is still time to save the project.
Professor Anthony Clayton, Professor Anthony Clayton, University of the West University of the West IndiesIndies
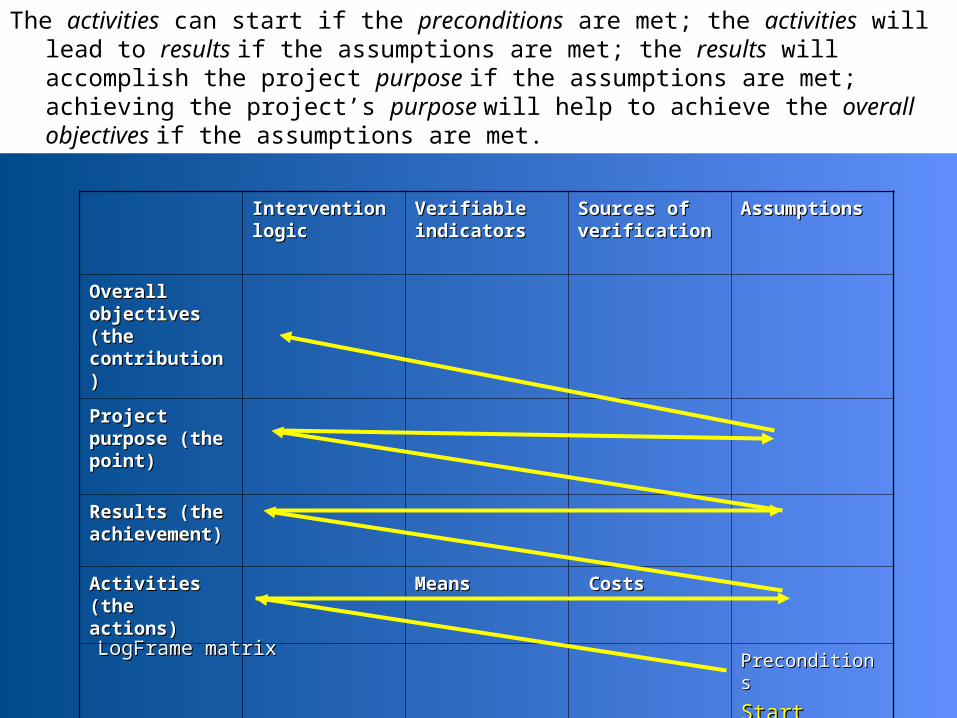
LogFrame matrixLogFrame matrix
Intervention Intervention logiclogic
Verifiable Verifiable indicatorsindicators
Sources of Sources of verificationverification
AssumptionsAssumptions
Overall Overall objectives objectives (the (the contribution)contribution)
Project Project purpose (the purpose (the point)point)
Results (the Results (the achievement)achievement)
Activities Activities (the actions)(the actions)
MeansMeans CostsCosts
PreconditionsPreconditions
StartStart
The activities can start if the preconditions are met; the activities will lead to results if the assumptions are met; the results will accomplish the project purpose if the assumptions are met; achieving the project’s purpose will help to achieve the overall objectives if the assumptions are met.

Professor Anthony Clayton, Professor Anthony Clayton, University of the West University of the West IndiesIndies Critical Path Analysis (1)Critical Path Analysis (1)
Critical Path Analysis and the related PERT model were Critical Path Analysis and the related PERT model were developed in the 1950s to manage military projects, but are developed in the 1950s to manage military projects, but are now more generally used to manage any particularly large, now more generally used to manage any particularly large, complex project. Another related tool, the Gantt chart, was complex project. Another related tool, the Gantt chart, was developed three decades earlier. These tools involve listing developed three decades earlier. These tools involve listing all the sub-tasks in a project, then organizing them into two all the sub-tasks in a project, then organizing them into two groups:groups:
1.1. Sequential:Sequential: the first group consists of those tasks that have the first group consists of those tasks that have to be completed in to be completed in sequence,sequence, because each stage depends because each stage depends on the one before. When building a factory, for example, the on the one before. When building a factory, for example, the foundation must be finished before the load-bearing walls go foundation must be finished before the load-bearing walls go up, and the walls must be ready before the roof can be fitted.up, and the walls must be ready before the roof can be fitted.
2.2. Parallel:Parallel: the second group consists of those tasks that do not the second group consists of those tasks that do not depend on the completion of other tasks. These can therefore depend on the completion of other tasks. These can therefore be completed in be completed in parallel,parallel, i.e. at the same time as other tasks. i.e. at the same time as other tasks. In the same factory building project, for example, the In the same factory building project, for example, the contractor might decide that the tarmac for the car park can contractor might decide that the tarmac for the car park can be laid at any time; this does not depend on progress with be laid at any time; this does not depend on progress with the foundations, walls or floors of the main building.the foundations, walls or floors of the main building.
Professor Anthony Clayton, Professor Anthony Clayton, University of the West University of the West IndiesIndies Critical Path Analysis (2)Critical Path Analysis (2)
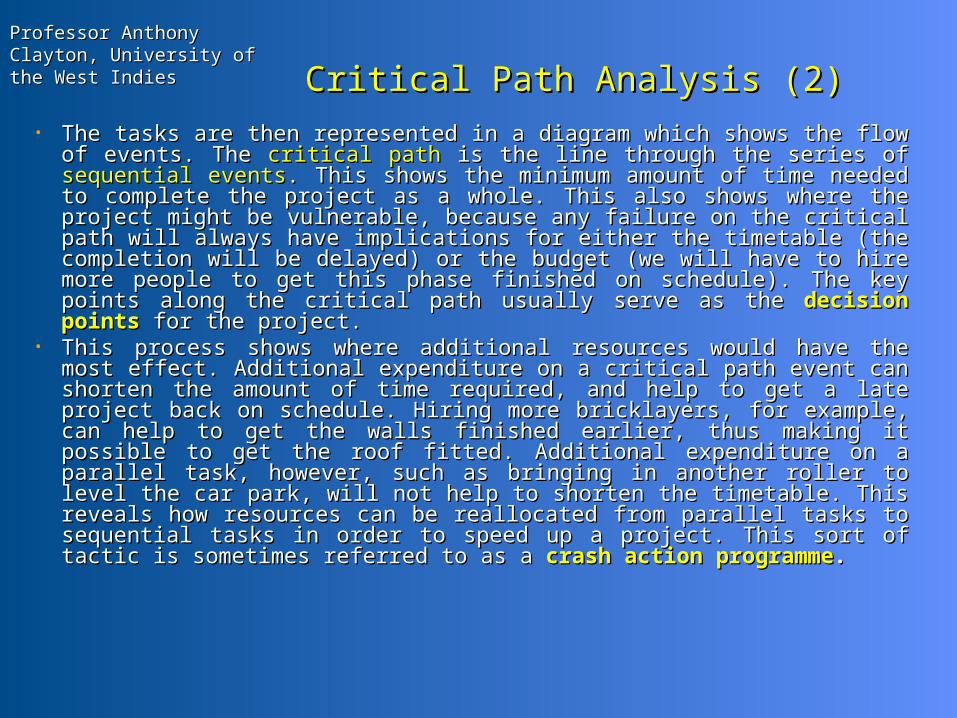
• The tasks are then represented in a diagram which shows the flow of The tasks are then represented in a diagram which shows the flow of events. The events. The critical pathcritical path is the line through the series of is the line through the series of sequential sequential eventsevents. This shows the minimum amount of time needed to . This shows the minimum amount of time needed to complete the project as a whole. This also shows where the project complete the project as a whole. This also shows where the project might be vulnerable, because any failure on the critical path will might be vulnerable, because any failure on the critical path will always have implications for either the timetable (the completion will always have implications for either the timetable (the completion will be delayed) or the budget (we will have to hire more people to get be delayed) or the budget (we will have to hire more people to get this phase finished on schedule). The key points along the critical this phase finished on schedule). The key points along the critical path usually serve as the path usually serve as the decision pointsdecision points for the project. for the project.
• This process shows where additional resources would have the most This process shows where additional resources would have the most effect. Additional expenditure on a critical path event can shorten effect. Additional expenditure on a critical path event can shorten the amount of time required, and help to get a late project back on the amount of time required, and help to get a late project back on schedule. Hiring more bricklayers, for example, can help to get the schedule. Hiring more bricklayers, for example, can help to get the walls finished earlier, thus making it possible to get the roof fitted. walls finished earlier, thus making it possible to get the roof fitted. Additional expenditure on a parallel task, however, such as bringing Additional expenditure on a parallel task, however, such as bringing in another roller to level the car park, will not help to shorten the in another roller to level the car park, will not help to shorten the timetable. This reveals how resources can be reallocated from timetable. This reveals how resources can be reallocated from parallel tasks to sequential tasks in order to speed up a project. This parallel tasks to sequential tasks in order to speed up a project. This sort of tactic is sometimes referred to as a sort of tactic is sometimes referred to as a crash action crash action programmeprogramme..
Professor Anthony Clayton, Professor Anthony Clayton, University of the West University of the West IndiesIndies
Program Evaluation & Review Program Evaluation & Review Technique (PERT)Technique (PERT)
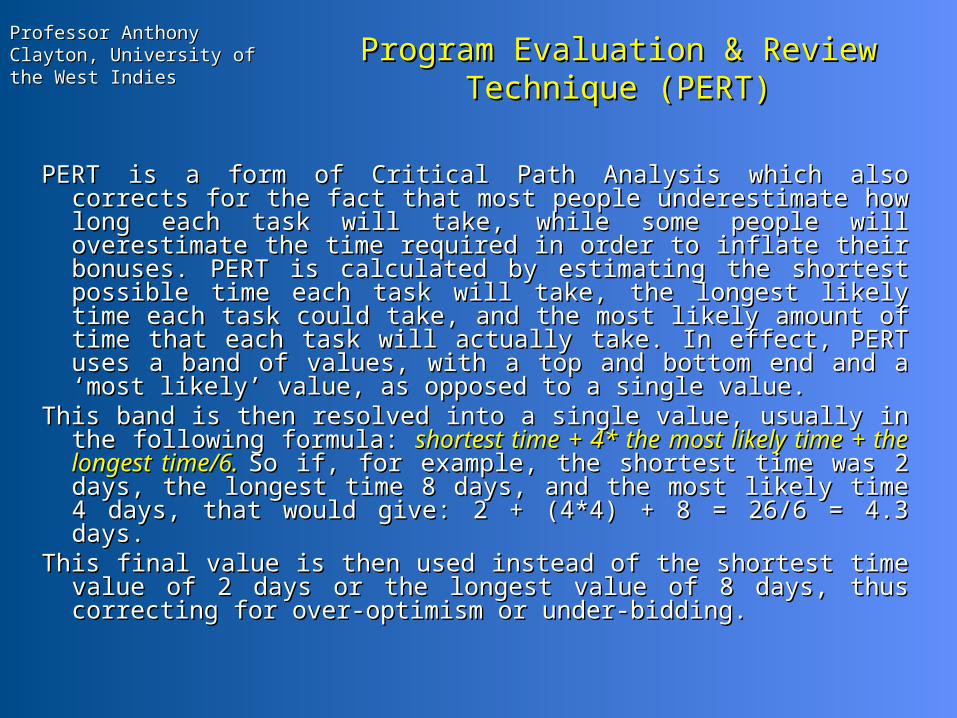
PERT is a form of Critical Path Analysis which also corrects for PERT is a form of Critical Path Analysis which also corrects for the fact that most people underestimate how long each the fact that most people underestimate how long each task will take, while some people will overestimate the time task will take, while some people will overestimate the time required in order to inflate their bonuses. PERT is calculated required in order to inflate their bonuses. PERT is calculated by estimating the shortest possible time each task will take, by estimating the shortest possible time each task will take, the longest likely time each task could take, and the most the longest likely time each task could take, and the most likely amount of time that each task will actually take. In likely amount of time that each task will actually take. In effect, PERT uses a band of values, with a top and bottom effect, PERT uses a band of values, with a top and bottom end and a ‘most likely’ value, as opposed to a single value.end and a ‘most likely’ value, as opposed to a single value.
This band is then resolved into a single value, usually in the This band is then resolved into a single value, usually in the following formula: following formula: shortest time + 4* the most likely time + shortest time + 4* the most likely time + the longest time/6.the longest time/6. So if, for example, the shortest time was So if, for example, the shortest time was 2 days, the longest time 8 days, and the most likely time 4 2 days, the longest time 8 days, and the most likely time 4 days, that would give: 2 + (4*4) + 8 = 26/6 = 4.3 days.days, that would give: 2 + (4*4) + 8 = 26/6 = 4.3 days.
This final value is then used instead of the shortest time value This final value is then used instead of the shortest time value of 2 days or the longest value of 8 days, thus correcting for of 2 days or the longest value of 8 days, thus correcting for over-optimism or under-bidding.over-optimism or under-bidding.
Professor Anthony Clayton, Professor Anthony Clayton, University of the West University of the West IndiesIndies Visual toolsVisual tools
Critical path, PERT and Gantt Critical path, PERT and Gantt chartscharts (Gantt charts were (Gantt charts were developed by Henry Gantt in 1917) are usually shown developed by Henry Gantt in 1917) are usually shown as horizontal bar charts that show the important as horizontal bar charts that show the important tasks over time.tasks over time.
These are useful visual tools for keeping track of These are useful visual tools for keeping track of projects.projects.
Professor Anthony Clayton, Professor Anthony Clayton, University of the West University of the West IndiesIndies
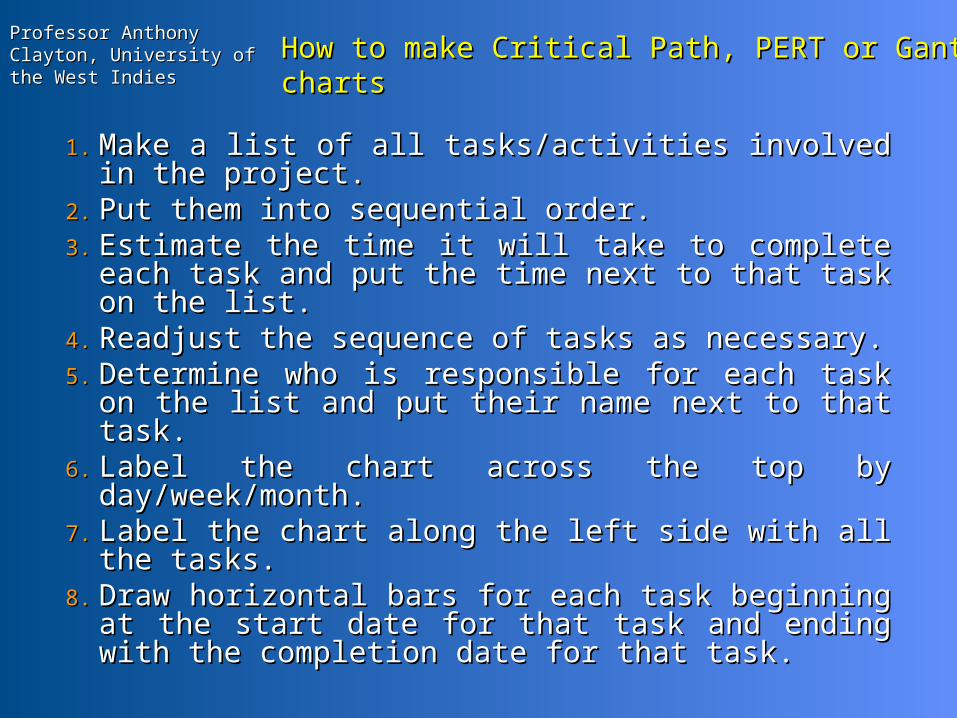
How to make Critical Path, PERT or Gantt chartsHow to make Critical Path, PERT or Gantt charts
1.1. Make a list of all tasks/activities involved in the Make a list of all tasks/activities involved in the project.project.
2.2. Put them into sequential order.Put them into sequential order.3.3. Estimate the time it will take to complete each Estimate the time it will take to complete each
task and put the time next to that task on the task and put the time next to that task on the list.list.
4.4. Readjust the sequence of tasks as necessary.Readjust the sequence of tasks as necessary.5.5. Determine who is responsible for each task on Determine who is responsible for each task on
the list and put their name next to that task.the list and put their name next to that task.6.6. Label the chart across the top by Label the chart across the top by
day/week/month.day/week/month.7.7. Label the chart along the left side with all the Label the chart along the left side with all the
tasks.tasks.8.8. Draw horizontal bars for each task beginning at Draw horizontal bars for each task beginning at
the start date for that task and ending with the the start date for that task and ending with the completion date for that task.completion date for that task.
Professor Anthony Clayton, Professor Anthony Clayton, University of the West University of the West IndiesIndies
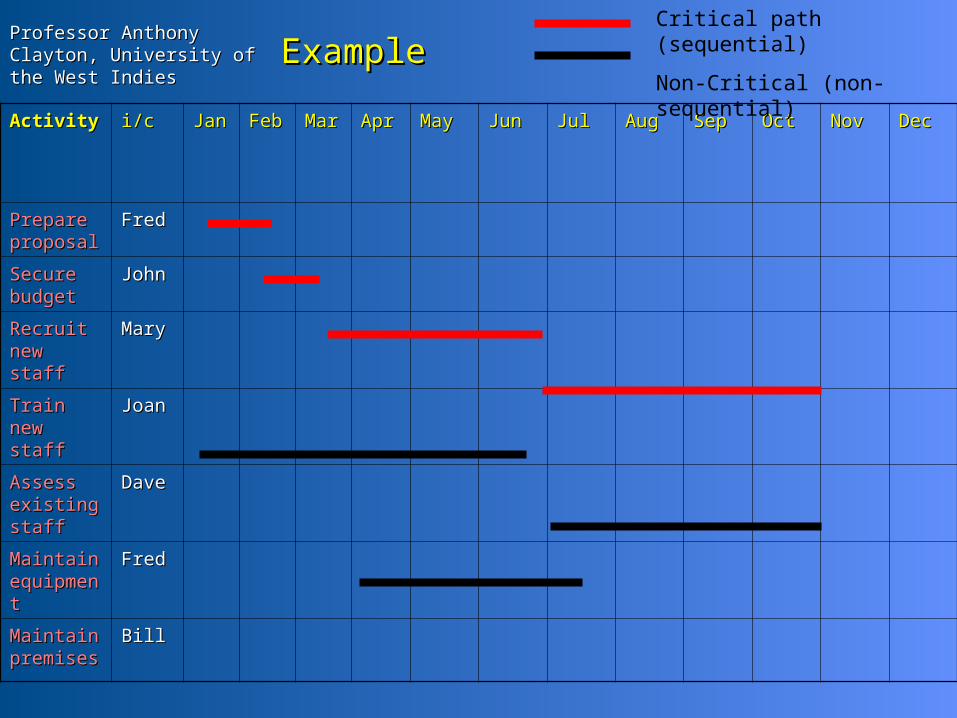
ActivityActivity i/ci/c JanJan FebFeb MarMar AprApr MayMay JunJun JulJul AugAug SepSep OctOct NovNov DecDec
Prepare Prepare proposalproposal
FredFred
Secure Secure budgetbudget
JohnJohn
Recruit Recruit new staffnew staff
MaryMary
Train new Train new staffstaff
JoanJoan
Assess Assess existing existing staffstaff
DaveDave
Maintain Maintain equipmeequipmentnt
FredFred
Maintain Maintain premisespremises
BillBill
ExampleExampleCritical path (sequential)
Non-Critical (non-sequential)
Professor Anthony Clayton, Professor Anthony Clayton, University of the West University of the West IndiesIndies
5) Project outcomes for each option5) Project outcomes for each option
This is most technically difficult step, because:This is most technically difficult step, because:• We have to be realistic, rather than optimistic or We have to be realistic, rather than optimistic or
pessimisticpessimistic• We have to resolve very significant uncertainty into We have to resolve very significant uncertainty into
a clear decision, on which much will depend.a clear decision, on which much will depend.• It is about the future, NOT the presentIt is about the future, NOT the present
So how do we plan for the future?

Professor Anthony Clayton, Professor Anthony Clayton, University of the West University of the West IndiesIndies The problem with forecasts…The problem with forecasts…
“Sophisticated, highly-paid economists have successfully predicted seven of the last three global recessions” (various sources).
“Never make forecasts; especially about the future” - Sam Goldwyn

Professor Anthony Clayton, Professor Anthony Clayton, University of the West University of the West IndiesIndies Why do forecasts fail?Why do forecasts fail?
1) 1) Trends change.Trends change. We start from the current position, We start from the current position, identify and extrapolate trends. We tend to assume that identify and extrapolate trends. We tend to assume that these will continue – but eventually they don’t. these will continue – but eventually they don’t. Competition intensifies, markets saturate and preferences Competition intensifies, markets saturate and preferences change.change.
2) 2) Parameters change.Parameters change. Market trends are shaped by Market trends are shaped by underlying social and economic factors e.g. demographics, underlying social and economic factors e.g. demographics, productivity growth and technological development. These productivity growth and technological development. These structural factors usually change slowly– but external structural factors usually change slowly– but external shocks or new ‘disruptive’ technologies can represent shocks or new ‘disruptive’ technologies can represent discontinuitiesdiscontinuities (or tipping points) that precipitate more (or tipping points) that precipitate more rapid change and restructure markets.rapid change and restructure markets.
Trend change is (in principle) predictable….but it is difficult to Trend change is (in principle) predictable….but it is difficult to anticipate discontinuities.anticipate discontinuities.

Professor Anthony Clayton, Professor Anthony Clayton, University of the West University of the West IndiesIndies Can we do better?Can we do better?
Conventional forecasting results become less reliable at times Conventional forecasting results become less reliable at times of significant, rapid and pervasive changeof significant, rapid and pervasive change
We are living in an unprecedented era of accelerating We are living in an unprecedented era of accelerating technological, economic and social change, driven by:technological, economic and social change, driven by:o New technologies, such as informatics, biotechnology, and New technologies, such as informatics, biotechnology, and
nanotechnologynanotechnologyo Global trade liberalisation, which could increase contestable Global trade liberalisation, which could increase contestable
world output from 20% of the total to 80% of the total by world output from 20% of the total to 80% of the total by 20302030
o The re-drawing of world geopolitical parametersThe re-drawing of world geopolitical parameterso Changing pattern of resource demand, environmental Changing pattern of resource demand, environmental
impactsimpacts
Are there more reliable decision/planning tools for times of Are there more reliable decision/planning tools for times of change?change?
Professor Anthony Clayton, Professor Anthony Clayton, University of the West University of the West IndiesIndies What is foresighting?What is foresighting?
Foresighting is a tool used:Foresighting is a tool used: to inform decision-makingto inform decision-making to help people anticipate future opportunities and avoid to help people anticipate future opportunities and avoid
problemsproblems Foresighting involves:Foresighting involves:
envisioning a range of possible future scenarios, envisioning a range of possible future scenarios, testing these rigorously, then - testing these rigorously, then - back-casting to present day, and mapping out the steps back-casting to present day, and mapping out the steps
needed to achieve the preferred scenario/avoid the worst-needed to achieve the preferred scenario/avoid the worst-case scenario.case scenario.
The foresight process itself is important, because:The foresight process itself is important, because: it clarifies and challenges assumptionsit clarifies and challenges assumptions it encourages shared visions and flexible thinkingit encourages shared visions and flexible thinking it creates new ‘knowledge networks’it creates new ‘knowledge networks’
Professor Anthony Clayton, Professor Anthony Clayton, University of the West University of the West IndiesIndies
Changing parameters: climate Changing parameters: climate changechange

Professor Anthony Clayton, Professor Anthony Clayton, University of the West University of the West IndiesIndies
Earth's temperature is dangerously high - Earth's temperature is dangerously high - NASANASA
•
Researchers at Nasa's Goddard Institute for Space Studies said Researchers at Nasa's Goddard Institute for Space Studies said that Earth's temperature was now reaching its highest level in a that Earth's temperature was now reaching its highest level in a million years. Dr James Hansen, who led the study, said further million years. Dr James Hansen, who led the study, said further global warming of just 1°C could lead to big changes to the global warming of just 1°C could lead to big changes to the planet. “If warming is kept less than that, effects of global planet. “If warming is kept less than that, effects of global warming may be relatively manageable,” he said. “But if further warming may be relatively manageable,” he said. “But if further global warming reaches 2° or 3°C, the Earth may become a global warming reaches 2° or 3°C, the Earth may become a different planet [to] the one we know now. The last time it was different planet [to] the one we know now. The last time it was that warm was in the middle Pliocene, about 3m years ago, when that warm was in the middle Pliocene, about 3m years ago, when sea level was about 25 meters (80 feet) higher than today.”sea level was about 25 meters (80 feet) higher than today.”
•
The study showed that there was already a threat of more The study showed that there was already a threat of more extreme weather like the strong El Niños in 1983 and 1998, extreme weather like the strong El Niños in 1983 and 1998, when many countries around the world had devastating floods when many countries around the world had devastating floods and tornadoes.and tornadoes.
•
Adapted from Hilary Osborne Tuesday September 26 2006 The Guardian
Professor Anthony Clayton, Professor Anthony Clayton, University of the West University of the West IndiesIndies
Hurricane Katrina, 2005, S E of New Orleans
Professor Anthony Clayton, Professor Anthony Clayton, University of the West University of the West IndiesIndies
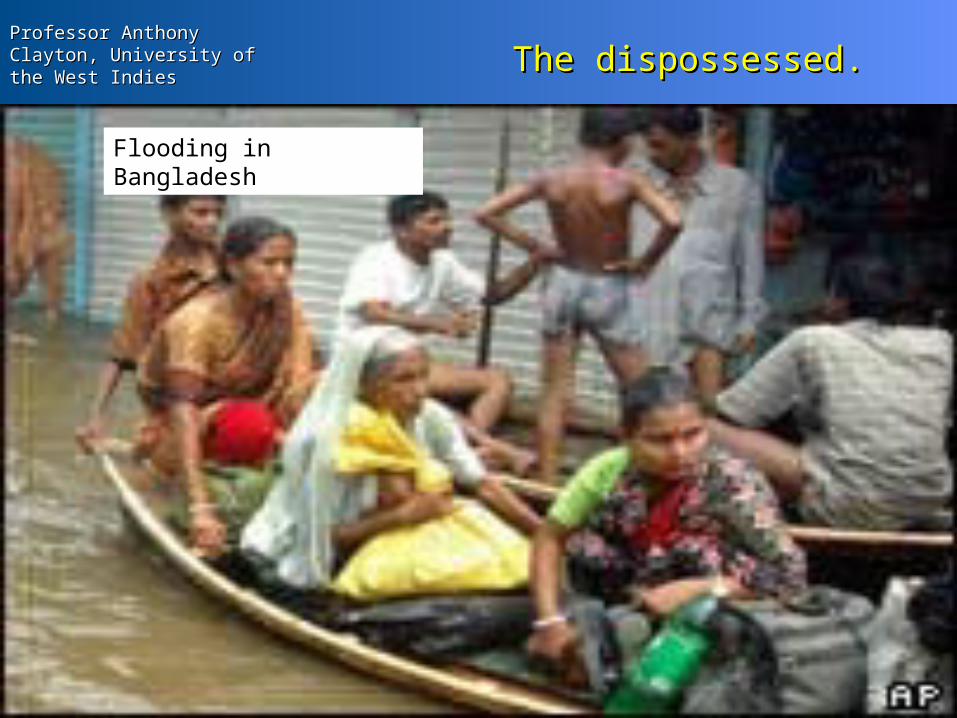
The dispossessed.The dispossessed.
Flooding in Bangladesh

Professor Anthony Clayton, Professor Anthony Clayton, University of the West University of the West IndiesIndies
Professor Anthony Clayton, Professor Anthony Clayton, University of the West University of the West IndiesIndies
Is this a solvable problem?
Previous environmental treaties have had partial success:
The Montreal Protocol, which limits CFC emissions.
The Basle Convention, which controls trans-boundary shipments of hazardous waste.
But these are relatively solvable problems compared to energy use; carbon emissions derive from the use of our primary energy sources.
Professor Anthony Clayton, Professor Anthony Clayton, University of the West University of the West IndiesIndies Kyoto – redundant before Kyoto – redundant before
ratifiedratified
• The US, the largest source of carbon emissions, has not The US, the largest source of carbon emissions, has not ratified the protocol, partly because it imposes no limits ratified the protocol, partly because it imposes no limits on the gases produced by developing countries.on the gases produced by developing countries.
• China, which is now the world’s biggest consumer of coal China, which is now the world’s biggest consumer of coal and second biggest consumer of oil, emits almost as and second biggest consumer of oil, emits almost as much carbon as the 25 members of the EU combined, much carbon as the 25 members of the EU combined, and will shortly overtake them to become the world’s and will shortly overtake them to become the world’s second largest source of carbon emissions, is exempt.second largest source of carbon emissions, is exempt.
• As a result of these non-ratifications and exemptions, UN As a result of these non-ratifications and exemptions, UN projections indicate that the treaty will reduce the projections indicate that the treaty will reduce the currently projected rise in average surface temperature currently projected rise in average surface temperature of 1.4 to 5.8°C by 2100 by just 0.1%.of 1.4 to 5.8°C by 2100 by just 0.1%.
Professor Anthony Clayton, Professor Anthony Clayton, University of the West University of the West IndiesIndies
Methane Methane releaserelease
There are naturally-occurring greenhouse gases, mostly methane, There are naturally-occurring greenhouse gases, mostly methane, trapped in ice-like structures called clathrates. Most of these are trapped in ice-like structures called clathrates. Most of these are trapped in cold sediments and Arctic tundra.trapped in cold sediments and Arctic tundra.
There is ~400 gigatons of methane currently trapped in frozen There is ~400 gigatons of methane currently trapped in frozen arctic tundra. If the temperature gets too high, and the tundra arctic tundra. If the temperature gets too high, and the tundra defrosts, this methane will be released. Methane is >20 times defrosts, this methane will be released. Methane is >20 times more efficient than CO² as a greenhouse gas, so this could cause more efficient than CO² as a greenhouse gas, so this could cause ‘runaway’ climate change.‘runaway’ climate change.
Similar events have happened before. The largest previous release Similar events have happened before. The largest previous release of methane happened at the Permian-Triassic boundary event, of methane happened at the Permian-Triassic boundary event, about 250 million years ago, when 95% of extant species were about 250 million years ago, when 95% of extant species were destroyed. It took 20 - 30 million years for rudimentary coral destroyed. It took 20 - 30 million years for rudimentary coral reefs to re-establish and forests to re-grow; in some areas it took reefs to re-establish and forests to re-grow; in some areas it took >100 million years for ecosystems to reach similar levels of >100 million years for ecosystems to reach similar levels of diversity. diversity.
- potential - potential disaster?disaster?

Professor Anthony Clayton, Professor Anthony Clayton, University of the West University of the West IndiesIndies
Western Siberia in 2005...thawed for the first time in 11,000 years…

Professor Anthony Clayton, Professor Anthony Clayton, University of the West University of the West IndiesIndies
A Stern warning (part 1)A Stern warning (part 1)
Key points in the report written by Sir Nicholas Stern for the Key points in the report written by Sir Nicholas Stern for the UK government, published on Monday 30UK government, published on Monday 30thth October: October:
CO² and temperature riseCO² and temperature rise• Carbon emissions have raised global temperatures by Carbon emissions have raised global temperatures by
0.5°C.0.5°C.• With BAU, there is >75% chance that global temperatures With BAU, there is >75% chance that global temperatures
will rise by 2-3°C over the next 50 years. There is a 50% will rise by 2-3°C over the next 50 years. There is a 50% chance that global temperatures could rise by 5°C.chance that global temperatures could rise by 5°C.
Environmental impactEnvironmental impact• Melting glaciers will increase flood risk, then drought.Melting glaciers will increase flood risk, then drought.• Crop yields will decline, particularly in Africa.Crop yields will decline, particularly in Africa.• Rising sea levels could displace 200 million people.Rising sea levels could displace 200 million people.• Up to 40% of species could become extinct.Up to 40% of species could become extinct.• There will be more frequent extreme weather patterns.There will be more frequent extreme weather patterns.

Professor Anthony Clayton, Professor Anthony Clayton, University of the West University of the West IndiesIndies
A Stern warning (part 2)A Stern warning (part 2)
Economic impactEconomic impact• A rise of A rise of 2-3°C2-3°C could reduce global GDP by 3%. could reduce global GDP by 3%.• A rise of 5A rise of 5°C°C could cost up to 10% of global GDP. The could cost up to 10% of global GDP. The
poorest countries would lose disproportionately more.poorest countries would lose disproportionately more.• Worst case scenario; the global economy could shrink Worst case scenario; the global economy could shrink
by 20% - permanently.by 20% - permanently.Cost of remedial actionCost of remedial action• Controlling this risk would require stabilizing emissions Controlling this risk would require stabilizing emissions
within the next 20 years then reducing by 1-3% pa. within the next 20 years then reducing by 1-3% pa. The transition to a low-carbon economy would cost 1% The transition to a low-carbon economy would cost 1% of GDP, mostly one-off expenditure (e.g. investment in of GDP, mostly one-off expenditure (e.g. investment in low-carbon technologies).low-carbon technologies).
Conclusion:Conclusion:• A one-off investment of $1 could avert a permanent A one-off investment of $1 could avert a permanent
reduction in annual income of $5-20.reduction in annual income of $5-20.

Professor Anthony Clayton, Professor Anthony Clayton, University of the West University of the West IndiesIndies
Professor Anthony Clayton, Professor Anthony Clayton, University of the West University of the West IndiesIndies
The real problem…as always…
…is people…
Professor Anthony Clayton, Professor Anthony Clayton, University of the West University of the West IndiesIndies
Surging demandSurging demand
• Transport still only accounts for 14% global Transport still only accounts for 14% global emissions, less than power generation and land-emissions, less than power generation and land-use.use.
• However, air travel is the most However, air travel is the most rapidly-growingrapidly-growing source of carbon emissions.source of carbon emissions.
• This growth in the demand for global transport This growth in the demand for global transport (driven by falling prices and increasing demand) is (driven by falling prices and increasing demand) is now seen as one of the most intractable problems now seen as one of the most intractable problems in slowing the rate of climate change.in slowing the rate of climate change.
Professor Anthony Clayton, Professor Anthony Clayton, University of the West University of the West IndiesIndies
Growth in air travelGrowth in air travel
• Air traffic has been expanding at nearly 250% of Air traffic has been expanding at nearly 250% of average economic growth rates since 1959.average economic growth rates since 1959.
• The current UK Government's Aviation White Paper The current UK Government's Aviation White Paper notes that aviation has increased fivefold over the notes that aviation has increased fivefold over the last 30 years, and predicts that UK passenger last 30 years, and predicts that UK passenger numbers will more than double from 180 million to numbers will more than double from 180 million to 475 million over the next 25 years.475 million over the next 25 years.
Professor Anthony Clayton, Professor Anthony Clayton, University of the West University of the West IndiesIndies Carbon-intensive activityCarbon-intensive activity
• Air travel is not only the most rapidly-growing source of carbon Air travel is not only the most rapidly-growing source of carbon emissions, it is also very emissions, it is also very energy-intensive.energy-intensive. For example, a For example, a Boeing 747 burns about 5 gallons per mile, so a London to New Boeing 747 burns about 5 gallons per mile, so a London to New York flight (3,471 miles) requires some 17,355 gallons.York flight (3,471 miles) requires some 17,355 gallons.
• Air travel relies on carbon-based fuel, so it is a Air travel relies on carbon-based fuel, so it is a carbon-carbon-intensive intensive activity – more so than other forms of transport. For activity – more so than other forms of transport. For example, a short flight (under 500km, e.g. London to example, a short flight (under 500km, e.g. London to Amsterdam) generates 0.17kg of carbon/passenger/kilometre, Amsterdam) generates 0.17kg of carbon/passenger/kilometre, compared with 0.14 kg/km by car, 0.052 kg/km for rail and compared with 0.14 kg/km by car, 0.052 kg/km for rail and 0.047 kg/km by ship. So flying produces over three times more 0.047 kg/km by ship. So flying produces over three times more carbon/kilometre than rail, and over three-and-a-half times carbon/kilometre than rail, and over three-and-a-half times more than travelling by ship.more than travelling by ship.
• As a result, a return flight between the UK and Australia As a result, a return flight between the UK and Australia produces about 3 tonnes of carbon per person (for comparison, produces about 3 tonnes of carbon per person (for comparison, an average car emits about 6 tonnes of carbon per annum).an average car emits about 6 tonnes of carbon per annum).

Professor Anthony Clayton, Professor Anthony Clayton, University of the West University of the West IndiesIndies Aggregate carbon Aggregate carbon
emissionsemissions
• The world fleet now consists of about 16,000 The world fleet now consists of about 16,000 commercial jet aircraft. These generate over commercial jet aircraft. These generate over 600m tonnes of CO600m tonnes of CO²² per year. per year.
• This means that aviation generates now nearly This means that aviation generates now nearly as much COas much CO²² as all human activities in Africa. as all human activities in Africa.

Professor Anthony Clayton, Professor Anthony Clayton, University of the West University of the West IndiesIndies
Consuming the carbon Consuming the carbon allowanceallowance
• In September 2005 the UK's Tyndall Centre for In September 2005 the UK's Tyndall Centre for Climate Change calculated that all householders, Climate Change calculated that all householders, motorists and businesses in the UK would have to motorists and businesses in the UK would have to reduce their COreduce their CO²² emissions to zero if the aviation emissions to zero if the aviation industry was to be incorporated into the UK industry was to be incorporated into the UK Government climate change targets for 2050.Government climate change targets for 2050.
• In other words, the entire UK economy would have In other words, the entire UK economy would have to emit no carbon at all, because the airline to emit no carbon at all, because the airline industry would be emitting so much that it would industry would be emitting so much that it would consume the UK’s entire carbon allowance. The consume the UK’s entire carbon allowance. The same equation is true of most other EU member same equation is true of most other EU member states. This is clearly impossible.states. This is clearly impossible.
Professor Anthony Clayton, Professor Anthony Clayton, University of the West University of the West IndiesIndies Technological options?Technological options?
• There have been significant improvements in aircraft and There have been significant improvements in aircraft and engine technology. The new generation of planes (like the engine technology. The new generation of planes (like the Airbus A380 and the Boeing 7E7) are partly made of carbon Airbus A380 and the Boeing 7E7) are partly made of carbon composites, rather than metal, therefore offer significantly composites, rather than metal, therefore offer significantly better fuel efficiency and reduced emissions per passenger.better fuel efficiency and reduced emissions per passenger.
• But the IPCC point out that these gains will be erased by the But the IPCC point out that these gains will be erased by the projected growth in demand, which means that total fuel projected growth in demand, which means that total fuel consumption and emissions of e.g. carbon dioxide, water consumption and emissions of e.g. carbon dioxide, water vapour, nitric oxide, nitrogen dioxide and sulphur dioxide will vapour, nitric oxide, nitrogen dioxide and sulphur dioxide will continue to rise.continue to rise.
• It is not (yet) possible to operate aircraft on biofuels (but do It is not (yet) possible to operate aircraft on biofuels (but do we have enough land anyway?)we have enough land anyway?)
Professor Anthony Clayton, Professor Anthony Clayton, University of the West University of the West IndiesIndies
Scarcity is Scarcity is dynamicdynamicScarcity reflects four main factors:Scarcity reflects four main factors:
Total physical quantity in available form/location.Total physical quantity in available form/location. Technology required to find, extract, process and transport the Technology required to find, extract, process and transport the
resource.resource. Pattern of demand/use (also partly determined by available Pattern of demand/use (also partly determined by available
technology).technology). Economics: (anticipated) demand, supply, competition, Economics: (anticipated) demand, supply, competition,
alternatives & substitutes.alternatives & substitutes.
These four factors determine energy & resource-use efficiency.These four factors determine energy & resource-use efficiency.
So calculations of sustainability must take into account a number So calculations of sustainability must take into account a number of factors, including (a) total stock, location and accessibility of factors, including (a) total stock, location and accessibility (b) available technology, (c) economics (d) market and (b) available technology, (c) economics (d) market and technological trends, (e) development trends (f) demand technological trends, (e) development trends (f) demand growth and so on.growth and so on.
Professor Anthony Clayton, Professor Anthony Clayton, University of the West University of the West IndiesIndies SolutionsSolutions
1.1. Faster technological advance, including both Faster technological advance, including both incremental gains and more radical substitutions.incremental gains and more radical substitutions.
2.2. Faster progress in ‘offset’ (flanking) technologies.Faster progress in ‘offset’ (flanking) technologies.
3.3. Demand-rationing, via price.Demand-rationing, via price.
4.4. Command-and-control, via regulation.Command-and-control, via regulation.
5.5. Disaster preparedness, zoning, planning, exercises Disaster preparedness, zoning, planning, exercises and mitigation.and mitigation.
Professor Anthony Clayton, Professor Anthony Clayton, University of the West University of the West IndiesIndies
ConclusionsConclusions
• We need a robust process for making, We need a robust process for making, implementing and monitoring policy.implementing and monitoring policy.
• This has to be based on strategic/scenario This has to be based on strategic/scenario planning and risk mapping.planning and risk mapping.
• We need to search for the optimal (attainable, We need to search for the optimal (attainable, achievable or affordable) solution; this might lie achievable or affordable) solution; this might lie in another discipline or jurisdiction.in another discipline or jurisdiction.

Professor Anthony Clayton, Professor Anthony Clayton, University of the West University of the West IndiesIndies Thank you !Thank you !Thank you !Thank you !