project management professional (pmp)® exam prep course 11 ... · brainstorming ¾ quiet writing v...
TRANSCRIPT

Project Management Professional (PMP)®
Exam Prep
Course 11 - Project Risk Management

Slide 1
Looking Glass Development, LLC
(303) 663-5402 / (888) 338-7447
4610 S. Ulster St. #150 Denver, CO 80237
Project Risk Management
_____________________________________________________________________________________
_____________________________________________________________________________________
_____________________________________________________________________________________
_____________________________________________________________________________________
_____________________________________________________________________________________
_____________________________________________________________________________________
_____________________________________________________________________________________
_____________________________________________________________________________________
_____________________________________________________________________________________
_____________________________________________________________________________________

Slide 2
Risk Management The processes concerned with conducting risk
management planning, identification, analysis, responses and monitoring and control on a project.
Updated throughout the project.
Increase the probability and impact of positive risks & decrease the probability and impact of negative risks.
© Copyright and all rights reserved – Looking Glass Development, LLC.
Planning Process Group
11. Project Risk Management
11.1Plan Risk
Management
11.3Perform
QualitativeRisk Analysis
11.2Identify Risks
11.4Perform
QuantitativeRisk Analysis
11.5Plan Risk
Responses
Monitoring and Controlling Process Group
11. Project RiskManagement
11.6Monitor Risks
_____________________________________________________________________________________
_____________________________________________________________________________________
_____________________________________________________________________________________
_____________________________________________________________________________________
_____________________________________________________________________________________
_____________________________________________________________________________________
_____________________________________________________________________________________
_____________________________________________________________________________________
_____________________________________________________________________________________
_____________________________________________________________________________________

Slide 3
Risk Management
Risk – an uncertain event or condition that, if realized, has a positive or negative impact on at least one project objective (such as time, cost, scope or quality).
Risks can have one or more causes and one or more impacts.
© Copyright and all rights reserved – Looking Glass Development, LLC.
_____________________________________________________________________________________
_____________________________________________________________________________________
_____________________________________________________________________________________
_____________________________________________________________________________________
_____________________________________________________________________________________
_____________________________________________________________________________________
_____________________________________________________________________________________
_____________________________________________________________________________________
_____________________________________________________________________________________
_____________________________________________________________________________________

Slide 4
Risk Management
© Copyright and all rights reserved – Looking Glass Development, LLC.
ProjectRisks
IntegrationScope
Requirements
Schedule
Budget
Quality
Resources
Communications
Risk
Procurement
Stakeholder
_____________________________________________________________________________________
_____________________________________________________________________________________
_____________________________________________________________________________________
_____________________________________________________________________________________
_____________________________________________________________________________________
_____________________________________________________________________________________
_____________________________________________________________________________________
_____________________________________________________________________________________
_____________________________________________________________________________________
_____________________________________________________________________________________
Slide 5
Risk Management
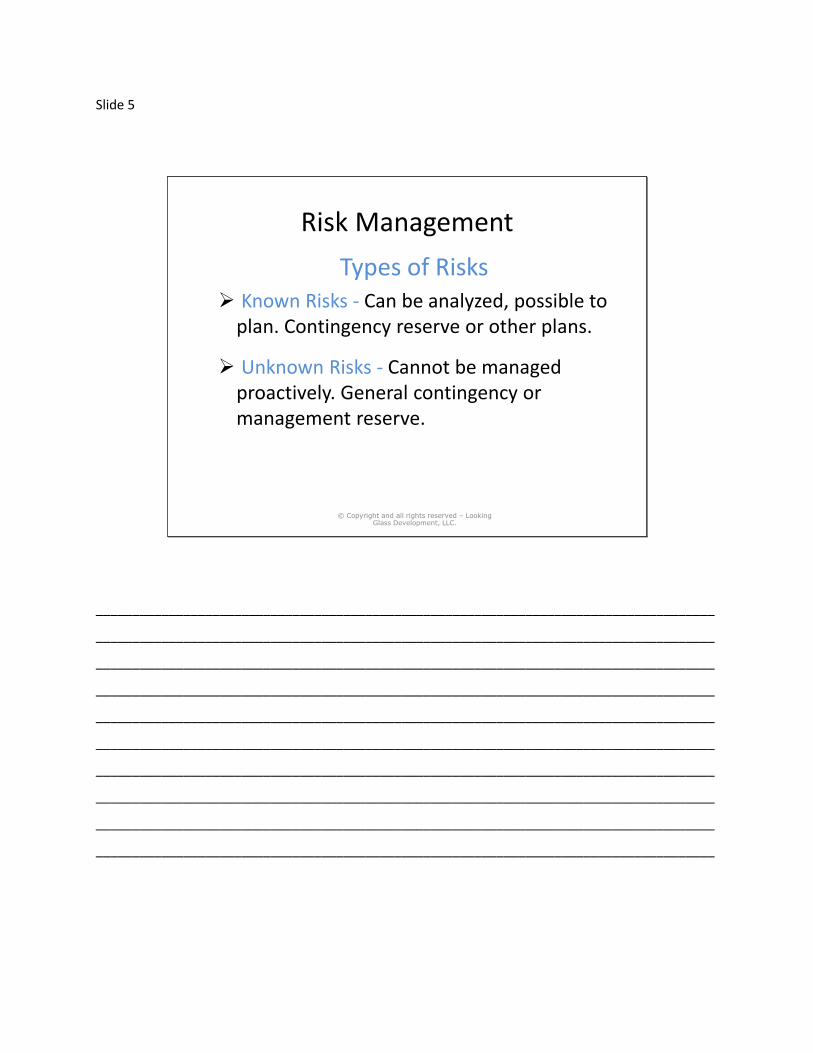
Types of Risks Known Risks - Can be analyzed, possible to
plan. Contingency reserve or other plans.
Unknown Risks - Cannot be managed proactively. General contingency or management reserve.
© Copyright and all rights reserved – Looking Glass Development, LLC.
_____________________________________________________________________________________
_____________________________________________________________________________________
_____________________________________________________________________________________
_____________________________________________________________________________________
_____________________________________________________________________________________
_____________________________________________________________________________________
_____________________________________________________________________________________
_____________________________________________________________________________________
_____________________________________________________________________________________
_____________________________________________________________________________________

Slide 6
Risk Management
Key TermsRisk Tolerance
Risk Averse
Risk FactorsProbability & impact
The range of possible outcomes
Expected timing in the project life-cycle
© Copyright and all rights reserved – Looking Glass Development, LLC.
_____________________________________________________________________________________
_____________________________________________________________________________________
_____________________________________________________________________________________
_____________________________________________________________________________________
_____________________________________________________________________________________
_____________________________________________________________________________________
_____________________________________________________________________________________
_____________________________________________________________________________________
_____________________________________________________________________________________
_____________________________________________________________________________________

Slide 7
Risk ManagementKey Terms
Variability Risk — Uncertainty exists about some key characteristics of a planned event, activity, or decision. Examples include: productivity being above or below a target, or weather conditions impacting construction.
Ambiguity Risk — What might happen in the future. This risk deals with the fact that there are areas of imperfect knowledge. Examples changes in regulation or law, or inherent systemic complexity.
Project Resilience — Resilience is the ability to overcome unknown risks when they occur.
Integrated Risk Management — Integrated risk management provides a coordinated approach to enterprise-wide risk management to ensure alignment and coherence to ensure risks are managed across all levels of the organization.
© Copyright and all rights reserved – Looking Glass Development, LLC.
_____________________________________________________________________________________
_____________________________________________________________________________________
_____________________________________________________________________________________
_____________________________________________________________________________________
_____________________________________________________________________________________
_____________________________________________________________________________________
_____________________________________________________________________________________
_____________________________________________________________________________________
_____________________________________________________________________________________
_____________________________________________________________________________________
Slide 8
Risk Management11.1 Plan Risk Management
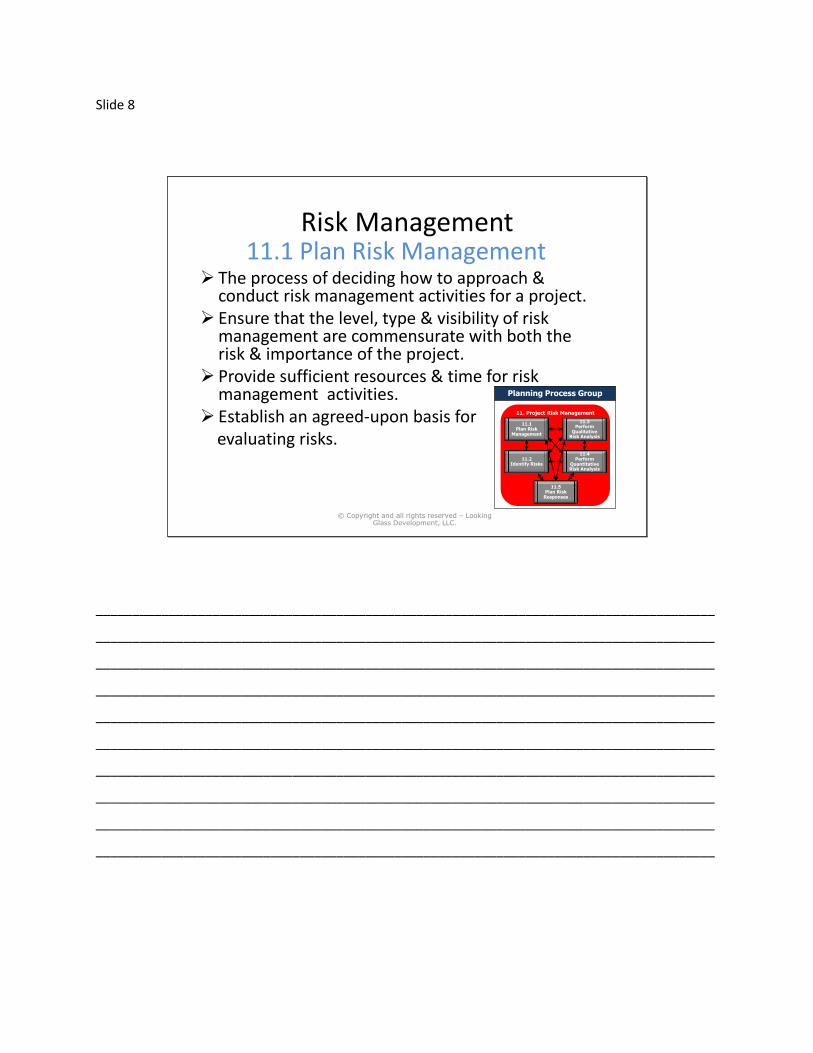
The process of deciding how to approach & conduct risk management activities for a project.
Ensure that the level, type & visibility of risk management are commensurate with both the risk & importance of the project.
Provide sufficient resources & time for risk management activities.
Establish an agreed-upon basis for evaluating risks.
© Copyright and all rights reserved – Looking Glass Development, LLC.
Planning Process Group
11. Project Risk Management
11.1Plan Risk
Management
11.3Perform
QualitativeRisk Analysis
11.2Identify Risks
11.4Perform
QuantitativeRisk Analysis
11.5Plan Risk
Responses
_____________________________________________________________________________________
_____________________________________________________________________________________
_____________________________________________________________________________________
_____________________________________________________________________________________
_____________________________________________________________________________________
_____________________________________________________________________________________
_____________________________________________________________________________________
_____________________________________________________________________________________
_____________________________________________________________________________________
_____________________________________________________________________________________
Slide 9
Risk Management
11.1 Plan Risk Management
© Copyright and all rights reserved – Looking Glass Development, LLC.
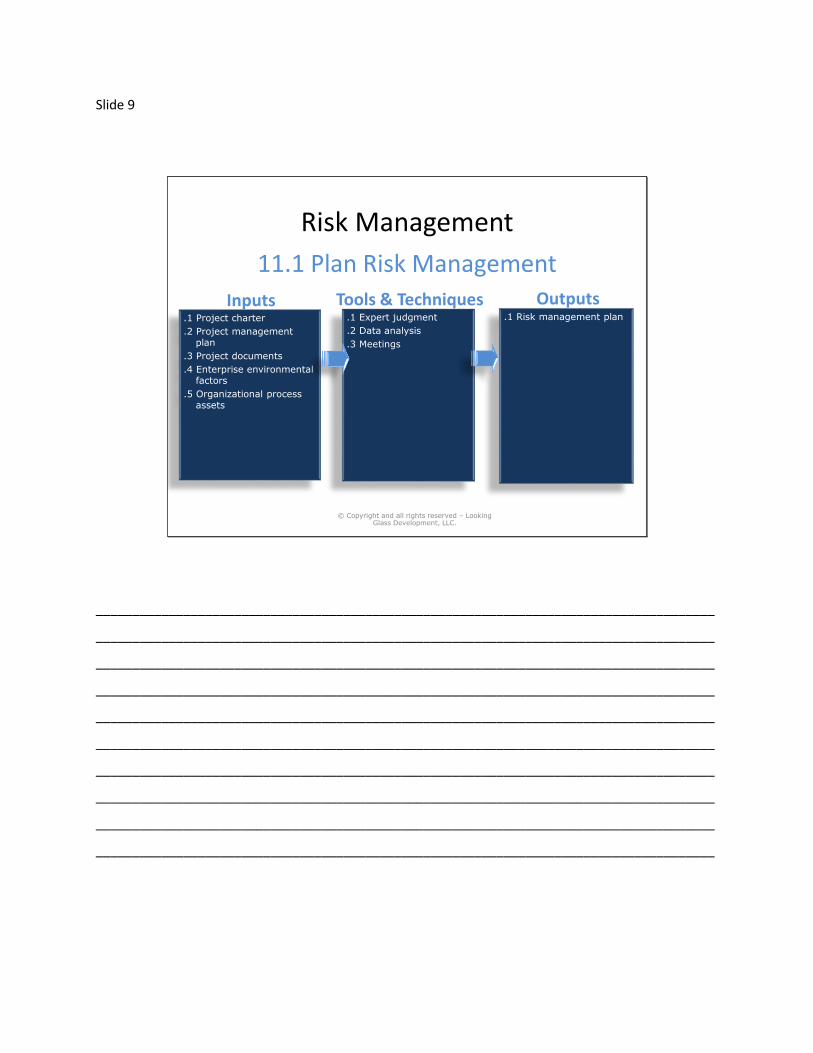
Inputs.1 Project charter
.2 Project management plan
.3 Project documents
.4 Enterprise environmental factors
.5 Organizational process assets
Tools & Techniques.1 Expert judgment
.2 Data analysis
.3 Meetings
Outputs.1 Risk management plan
_____________________________________________________________________________________
_____________________________________________________________________________________
_____________________________________________________________________________________
_____________________________________________________________________________________
_____________________________________________________________________________________
_____________________________________________________________________________________
_____________________________________________________________________________________
_____________________________________________________________________________________
_____________________________________________________________________________________
_____________________________________________________________________________________

Slide 10
Risk ManagementIncluded in the Risk Management PlanMethodologyRoles and ResponsibilitiesBudgetingTimingRisk Categories (RBS) . . .Revised stakeholder tolerancesReporting formatsTracking Definitions of probability and impactMatrices . . .
© Copyright and all rights reserved – Looking Glass Development, LLC.
_____________________________________________________________________________________
_____________________________________________________________________________________
_____________________________________________________________________________________
_____________________________________________________________________________________
_____________________________________________________________________________________
_____________________________________________________________________________________
_____________________________________________________________________________________
_____________________________________________________________________________________
_____________________________________________________________________________________
_____________________________________________________________________________________
Slide 11
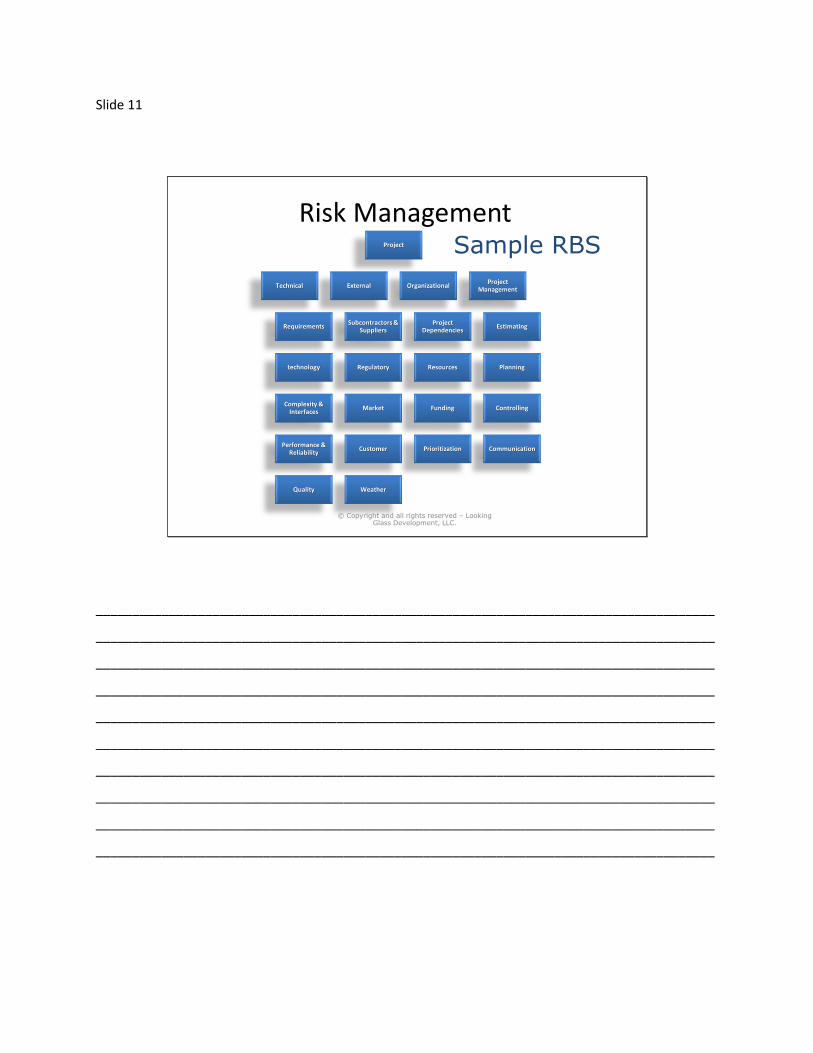
Risk ManagementProject
Technical
Requirements
technology
Complexity & Interfaces
Performance & Reliability
Quality
External
Subcontractors & Suppliers
Regulatory
Market
Customer
Weather
Organizational
Project Dependencies
Resources
Funding
Prioritization
Project Management
Estimating
Planning
Controlling
Communication
Sample RBS
© Copyright and all rights reserved – Looking Glass Development, LLC.
_____________________________________________________________________________________
_____________________________________________________________________________________
_____________________________________________________________________________________
_____________________________________________________________________________________
_____________________________________________________________________________________
_____________________________________________________________________________________
_____________________________________________________________________________________
_____________________________________________________________________________________
_____________________________________________________________________________________
_____________________________________________________________________________________

Slide 12
Risk Management
Scales for Impact and ProbabilityLinear
– .1, .3, .5, .7,.9
Non-Linear– .05, .10, .20, .40, .80
Relative– Very low, low, medium,
high, very high
© Copyright and all rights reserved – Looking Glass Development, LLC.
_____________________________________________________________________________________
_____________________________________________________________________________________
_____________________________________________________________________________________
_____________________________________________________________________________________
_____________________________________________________________________________________
_____________________________________________________________________________________
_____________________________________________________________________________________
_____________________________________________________________________________________
_____________________________________________________________________________________
_____________________________________________________________________________________
Slide 13
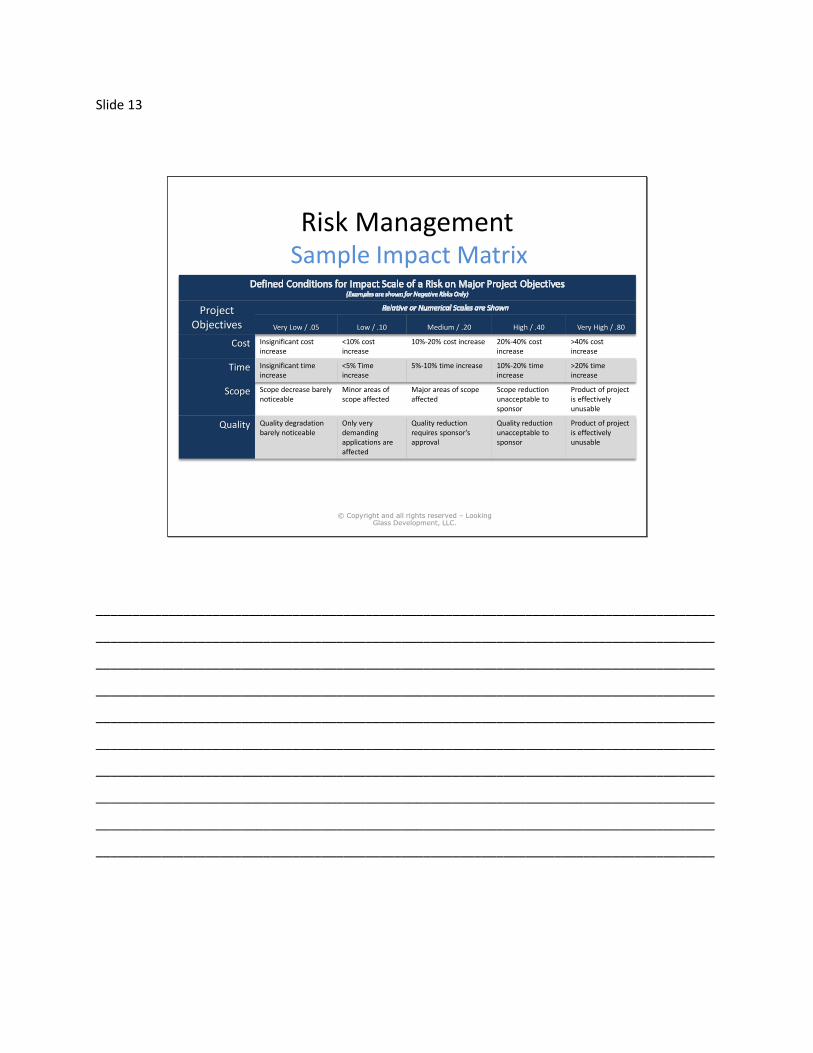
Risk Management
Project Objectives Very Low / .05 Low / .10 Medium / .20 High / .40 Very High / .80
Cost Insignificant cost increase
<10% cost increase
10%-20% cost increase 20%-40% cost increase
>40% cost increase
Time Insignificant time increase
<5% Time increase
5%-10% time increase 10%-20% time increase
>20% time increase
Scope Scope decrease barely noticeable
Minor areas of scope affected
Major areas of scope affected
Scope reduction unacceptable to sponsor
Product of project is effectively unusable
Quality Quality degradation barely noticeable
Only very demanding applications are affected
Quality reduction requires sponsor’s approval
Quality reduction unacceptable to sponsor
Product of project is effectively unusable
© Copyright and all rights reserved – Looking Glass Development, LLC.
Sample Impact Matrix
_____________________________________________________________________________________
_____________________________________________________________________________________
_____________________________________________________________________________________
_____________________________________________________________________________________
_____________________________________________________________________________________
_____________________________________________________________________________________
_____________________________________________________________________________________
_____________________________________________________________________________________
_____________________________________________________________________________________
_____________________________________________________________________________________

Slide 14
Risk Management
11.2 Identify RisksDetermine which risks might affect the project and documents their characteristics.
Project Manager
Project Team
Stakeholders
Subject matter experts
People outside the project
© Copyright and all rights reserved – Looking Glass Development, LLC.
Planning Process Group
11. Project Risk Management
11.1Plan Risk
Management
11.3Perform
QualitativeRisk Analysis
11.2Identify Risks
11.4Perform
QuantitativeRisk Analysis
11.5Plan Risk
Responses
_____________________________________________________________________________________
_____________________________________________________________________________________
_____________________________________________________________________________________
_____________________________________________________________________________________
_____________________________________________________________________________________
_____________________________________________________________________________________
_____________________________________________________________________________________
_____________________________________________________________________________________
_____________________________________________________________________________________
_____________________________________________________________________________________
Slide 15
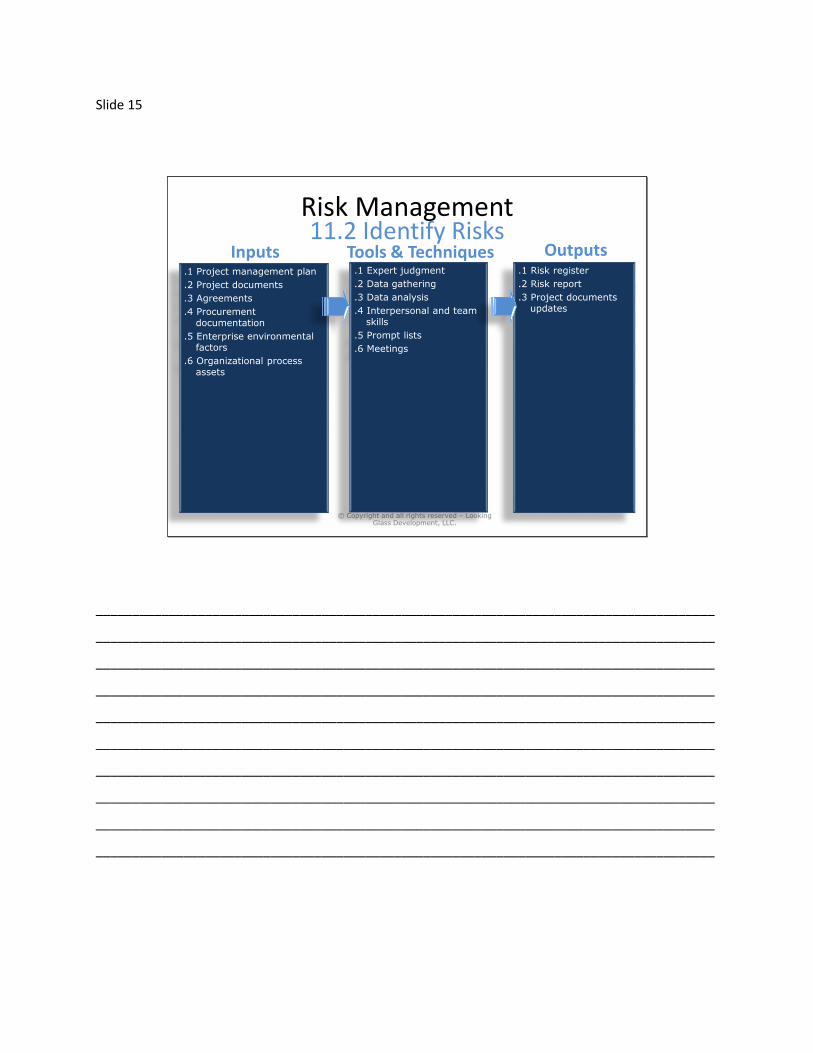
Risk Management11.2 Identify Risks
© Copyright and all rights reserved – Looking Glass Development, LLC.
Inputs.1 Project management plan
.2 Project documents
.3 Agreements
.4 Procurement documentation
.5 Enterprise environmental factors
.6 Organizational process assets
Tools & Techniques.1 Expert judgment
.2 Data gathering
.3 Data analysis
.4 Interpersonal and team skills
.5 Prompt lists
.6 Meetings
Outputs.1 Risk register
.2 Risk report
.3 Project documents updates
_____________________________________________________________________________________
_____________________________________________________________________________________
_____________________________________________________________________________________
_____________________________________________________________________________________
_____________________________________________________________________________________
_____________________________________________________________________________________
_____________________________________________________________________________________
_____________________________________________________________________________________
_____________________________________________________________________________________
_____________________________________________________________________________________
Slide 16
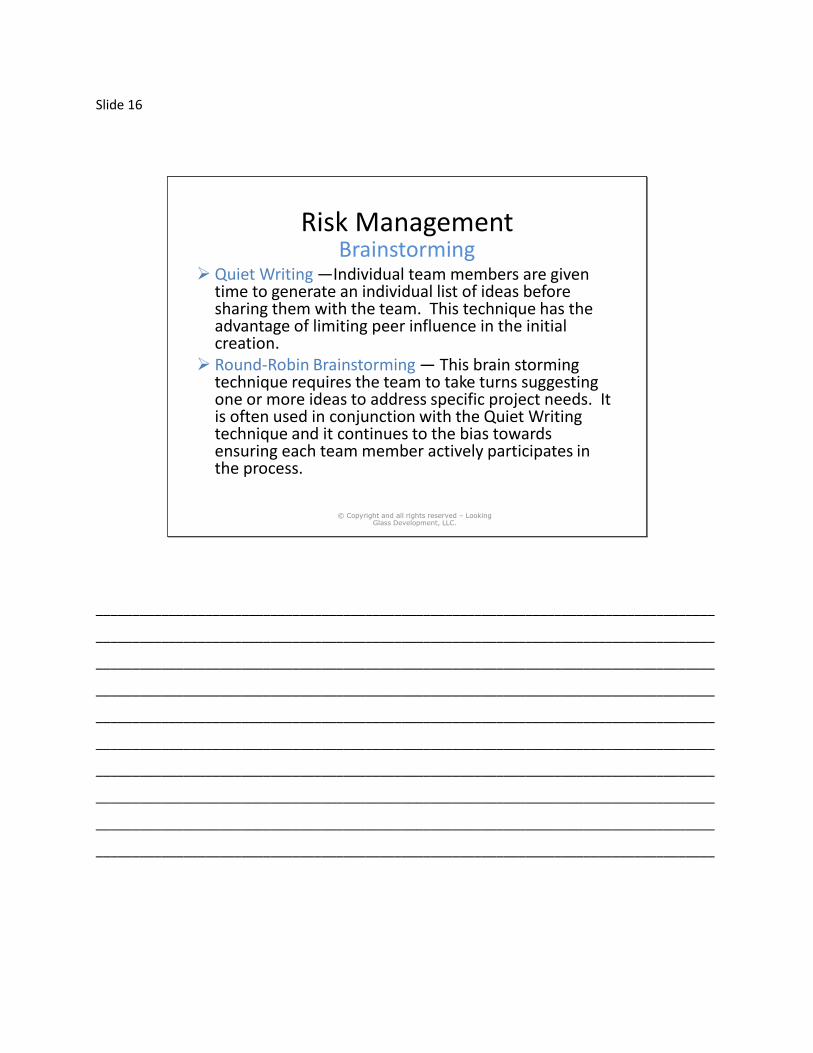
Risk ManagementBrainstorming
Quiet Writing —Individual team members are given time to generate an individual list of ideas before sharing them with the team. This technique has the advantage of limiting peer influence in the initial creation.
Round-Robin Brainstorming — This brain storming technique requires the team to take turns suggesting one or more ideas to address specific project needs. It is often used in conjunction with the Quiet Writing technique and it continues to the bias towards ensuring each team member actively participates in the process.
© Copyright and all rights reserved – Looking Glass Development, LLC.
_____________________________________________________________________________________
_____________________________________________________________________________________
_____________________________________________________________________________________
_____________________________________________________________________________________
_____________________________________________________________________________________
_____________________________________________________________________________________
_____________________________________________________________________________________
_____________________________________________________________________________________
_____________________________________________________________________________________
_____________________________________________________________________________________
Slide 17
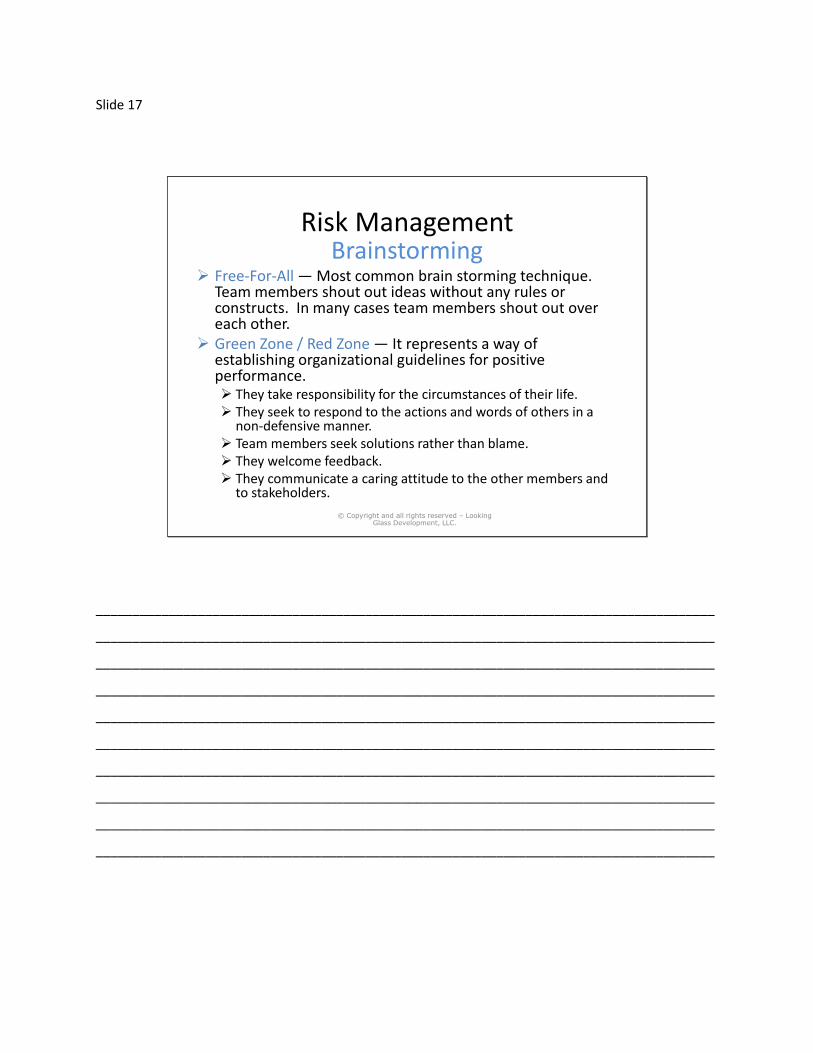
Risk ManagementBrainstorming
Free-For-All — Most common brain storming technique. Team members shout out ideas without any rules or constructs. In many cases team members shout out over each other.
Green Zone / Red Zone — It represents a way of establishing organizational guidelines for positive performance. They take responsibility for the circumstances of their life. They seek to respond to the actions and words of others in a
non-defensive manner. Team members seek solutions rather than blame. They welcome feedback. They communicate a caring attitude to the other members and
to stakeholders.
© Copyright and all rights reserved – Looking Glass Development, LLC.
_____________________________________________________________________________________
_____________________________________________________________________________________
_____________________________________________________________________________________
_____________________________________________________________________________________
_____________________________________________________________________________________
_____________________________________________________________________________________
_____________________________________________________________________________________
_____________________________________________________________________________________
_____________________________________________________________________________________
_____________________________________________________________________________________

Slide 18
Risk ManagementDelphi Technique
Survey the subject matter experts about the subject in question.
Aggregate the survey results and feed them back to the experts for review.
Have the experts consolidate the responses to a consensus opinion.
© Copyright and all rights reserved – Looking Glass Development, LLC.
_____________________________________________________________________________________
_____________________________________________________________________________________
_____________________________________________________________________________________
_____________________________________________________________________________________
_____________________________________________________________________________________
_____________________________________________________________________________________
_____________________________________________________________________________________
_____________________________________________________________________________________
_____________________________________________________________________________________
_____________________________________________________________________________________

Slide 19
Risk ManagementSWOT Analysis
© Copyright and all rights reserved – Looking Glass Development, LLC.
Strengths Weaknesses
Opportunities Threats
_____________________________________________________________________________________
_____________________________________________________________________________________
_____________________________________________________________________________________
_____________________________________________________________________________________
_____________________________________________________________________________________
_____________________________________________________________________________________
_____________________________________________________________________________________
_____________________________________________________________________________________
_____________________________________________________________________________________
_____________________________________________________________________________________
Slide 20
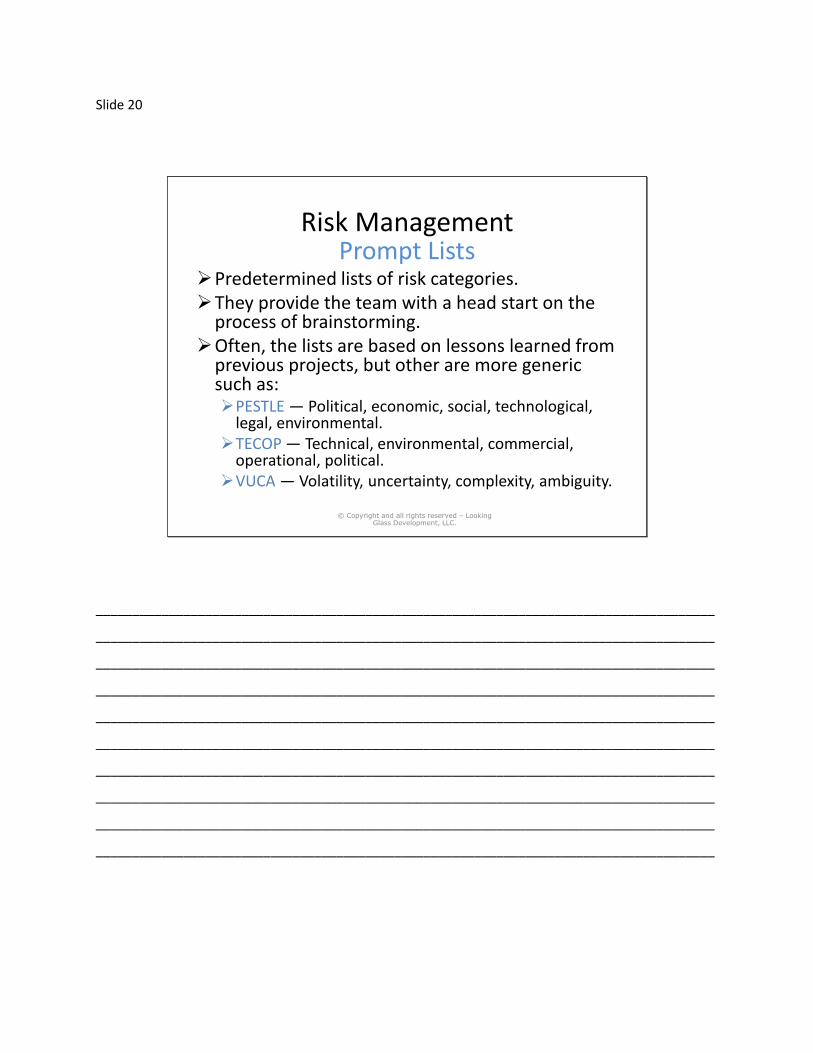
Risk ManagementPrompt Lists
Predetermined lists of risk categories. They provide the team with a head start on the
process of brainstorming.Often, the lists are based on lessons learned from
previous projects, but other are more generic such as:PESTLE — Political, economic, social, technological,
legal, environmental.TECOP — Technical, environmental, commercial,
operational, political.VUCA — Volatility, uncertainty, complexity, ambiguity.
© Copyright and all rights reserved – Looking Glass Development, LLC.
_____________________________________________________________________________________
_____________________________________________________________________________________
_____________________________________________________________________________________
_____________________________________________________________________________________
_____________________________________________________________________________________
_____________________________________________________________________________________
_____________________________________________________________________________________
_____________________________________________________________________________________
_____________________________________________________________________________________
_____________________________________________________________________________________

Slide 21
Risk Management
The Risk RegisterList of identified risks
And possibly…
– List of potential responses
– Root causes
– Updated risk categories
© Copyright and all rights reserved – Looking Glass Development, LLC.
_____________________________________________________________________________________
_____________________________________________________________________________________
_____________________________________________________________________________________
_____________________________________________________________________________________
_____________________________________________________________________________________
_____________________________________________________________________________________
_____________________________________________________________________________________
_____________________________________________________________________________________
_____________________________________________________________________________________
_____________________________________________________________________________________

Slide 22
Risk Management
11.3 Perform Qualitative Risk AnalysisPrioritizing the identified risks for further
action (including further analysis or response planning).
Uses the probability and impact scoring defined in Plan Risk Management.
© Copyright and all rights reserved – Looking Glass Development, LLC.
Planning Process Group
11. Project Risk Management
11.1Plan Risk
Management
11.3Perform
QualitativeRisk Analysis
11.2Identify Risks
11.4Perform
QuantitativeRisk Analysis
11.5Plan Risk
Responses
_____________________________________________________________________________________
_____________________________________________________________________________________
_____________________________________________________________________________________
_____________________________________________________________________________________
_____________________________________________________________________________________
_____________________________________________________________________________________
_____________________________________________________________________________________
_____________________________________________________________________________________
_____________________________________________________________________________________
_____________________________________________________________________________________
Slide 23
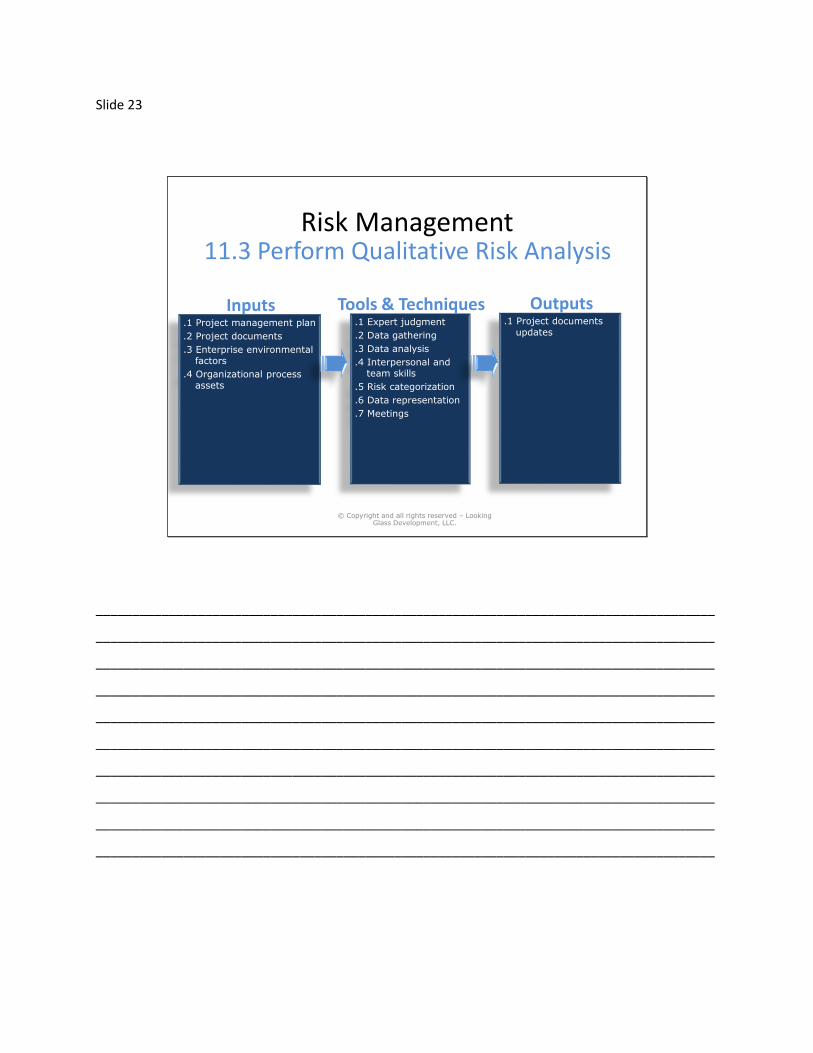
Risk Management11.3 Perform Qualitative Risk Analysis
© Copyright and all rights reserved – Looking Glass Development, LLC.
Inputs.1 Project management plan
.2 Project documents
.3 Enterprise environmental factors
.4 Organizational process assets
Tools & Techniques.1 Expert judgment
.2 Data gathering
.3 Data analysis
.4 Interpersonal and team skills
.5 Risk categorization
.6 Data representation
.7 Meetings
Outputs.1 Project documents
updates
_____________________________________________________________________________________
_____________________________________________________________________________________
_____________________________________________________________________________________
_____________________________________________________________________________________
_____________________________________________________________________________________
_____________________________________________________________________________________
_____________________________________________________________________________________
_____________________________________________________________________________________
_____________________________________________________________________________________
_____________________________________________________________________________________
Slide 24
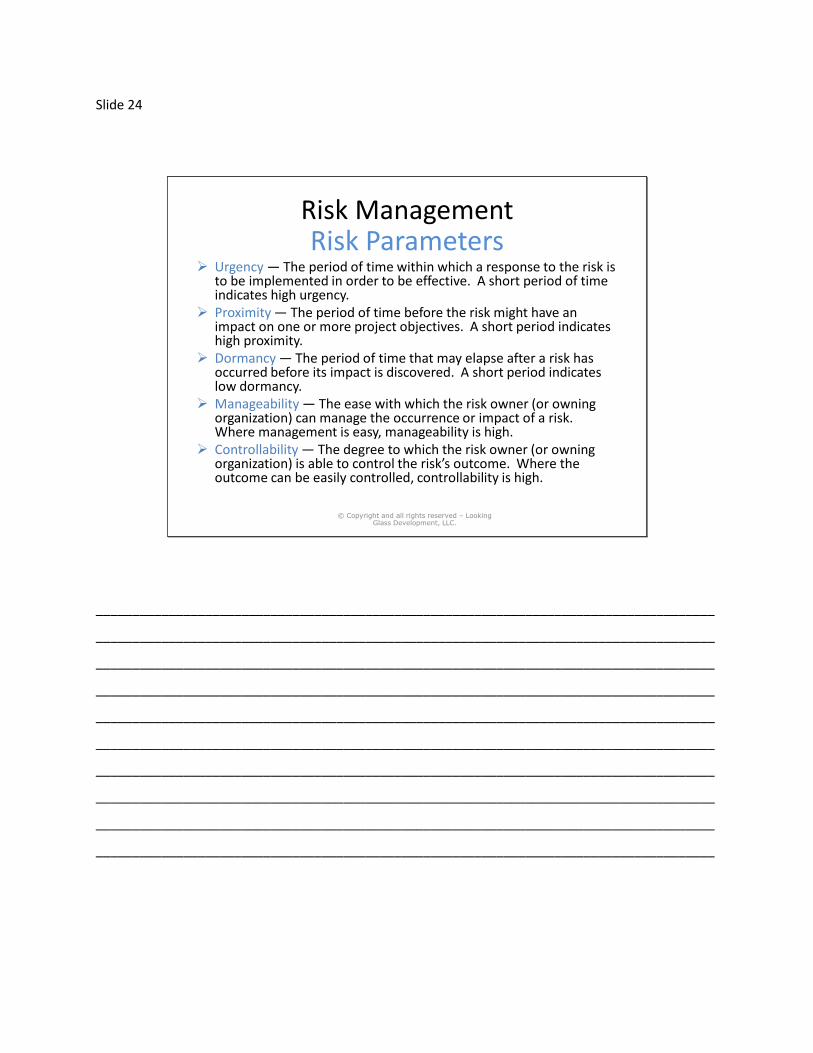
Risk ManagementRisk Parameters
Urgency — The period of time within which a response to the risk is to be implemented in order to be effective. A short period of time indicates high urgency.
Proximity — The period of time before the risk might have an impact on one or more project objectives. A short period indicates high proximity.
Dormancy — The period of time that may elapse after a risk has occurred before its impact is discovered. A short period indicates low dormancy.
Manageability — The ease with which the risk owner (or owning organization) can manage the occurrence or impact of a risk. Where management is easy, manageability is high.
Controllability — The degree to which the risk owner (or owning organization) is able to control the risk’s outcome. Where the outcome can be easily controlled, controllability is high.
© Copyright and all rights reserved – Looking Glass Development, LLC.
_____________________________________________________________________________________
_____________________________________________________________________________________
_____________________________________________________________________________________
_____________________________________________________________________________________
_____________________________________________________________________________________
_____________________________________________________________________________________
_____________________________________________________________________________________
_____________________________________________________________________________________
_____________________________________________________________________________________
_____________________________________________________________________________________

Slide 25
Risk ManagementRisk Parameters
Detectability — The ease with which the results of the risk occurring, or being about to occur, can be detected and recognized. Where the risk occurrence can be detected easily, detectability is high.
Connectivity — The extent to which the risk is related to other individual project risks. Where a risk is connected to many other risks, connectivity is high.
Strategic impact — The potential for the risk to have a positive or negative effect on the organization’s strategic goals. Where the risk has a major effect on strategic goals, strategic impact is high.
Propinquity — The degree to which a risk is perceived to matter by one or more stakeholders. Where a risk is perceived as very significant, propinquity is high.
© Copyright and all rights reserved – Looking Glass Development, LLC.
_____________________________________________________________________________________
_____________________________________________________________________________________
_____________________________________________________________________________________
_____________________________________________________________________________________
_____________________________________________________________________________________
_____________________________________________________________________________________
_____________________________________________________________________________________
_____________________________________________________________________________________
_____________________________________________________________________________________
_____________________________________________________________________________________
Slide 26
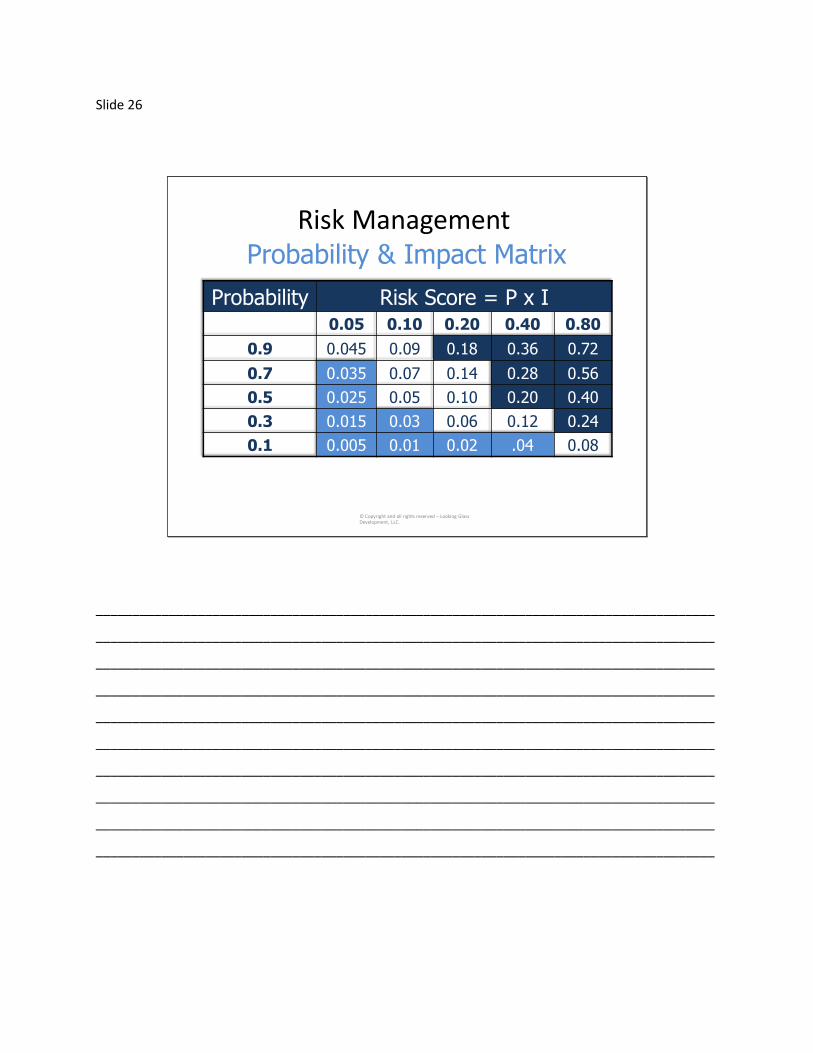
Risk Management
Probability Risk Score = P x I0.05 0.10 0.20 0.40 0.80
0.9 0.045 0.09 0.18 0.36 0.72
0.7 0.035 0.07 0.14 0.28 0.56
0.5 0.025 0.05 0.10 0.20 0.40
0.3 0.015 0.03 0.06 0.12 0.24
0.1 0.005 0.01 0.02 .04 0.08
© Copyright and all rights reserved – Looking Glass Development, LLC.
Probability & Impact Matrix
_____________________________________________________________________________________
_____________________________________________________________________________________
_____________________________________________________________________________________
_____________________________________________________________________________________
_____________________________________________________________________________________
_____________________________________________________________________________________
_____________________________________________________________________________________
_____________________________________________________________________________________
_____________________________________________________________________________________
_____________________________________________________________________________________

Slide 27
Risk Management11.4 Perform Quantitative Risk
AnalysisAnalyzes the effect of those risk events that have
been prioritized as potentially and substantially impacting the project’s competing demands, and assigns a numerical rating to those risks
Also presents a quantitative approach
to making decisions in the presence of
uncertainty
© Copyright and all rights reserved – Looking Glass Development, LLC.
Planning Process Group
11. Project Risk Management
11.1Plan Risk
Management
11.3Perform
QualitativeRisk Analysis
11.2Identify Risks
11.4Perform
QuantitativeRisk Analysis
11.5Plan Risk
Responses
_____________________________________________________________________________________
_____________________________________________________________________________________
_____________________________________________________________________________________
_____________________________________________________________________________________
_____________________________________________________________________________________
_____________________________________________________________________________________
_____________________________________________________________________________________
_____________________________________________________________________________________
_____________________________________________________________________________________
_____________________________________________________________________________________

Slide 28
Risk Management11.4 Perform Quantitative Risk
Analysis
© Copyright and all rights reserved – Looking Glass Development, LLC.
Inputs.1 Project management
plan
.2 Project documents
.3 Enterprise environmental factors
.4 Organizational process assets
Tools & Techniques.1 Expert judgment
.2 Data gathering
.3 Interpersonal and team skills
.4 Representations of uncertainty
.5 Data analysis
Outputs.1 Project documents
updates
_____________________________________________________________________________________
_____________________________________________________________________________________
_____________________________________________________________________________________
_____________________________________________________________________________________
_____________________________________________________________________________________
_____________________________________________________________________________________
_____________________________________________________________________________________
_____________________________________________________________________________________
_____________________________________________________________________________________
_____________________________________________________________________________________

Slide 29
Risk Management
Influence DiagramsInfluence diagrams are also called relevance
diagrams, decision diagrams, or decision networks.
They represent project decisions using compact graphical and mathematical representations.
© Copyright and all rights reserved – Looking Glass Development, LLC.
_____________________________________________________________________________________
_____________________________________________________________________________________
_____________________________________________________________________________________
_____________________________________________________________________________________
_____________________________________________________________________________________
_____________________________________________________________________________________
_____________________________________________________________________________________
_____________________________________________________________________________________
_____________________________________________________________________________________
_____________________________________________________________________________________

Slide 30
Risk Management
Influence Diagrams
© Copyright and all rights reserved – Looking Glass Development, LLC.
_____________________________________________________________________________________
_____________________________________________________________________________________
_____________________________________________________________________________________
_____________________________________________________________________________________
_____________________________________________________________________________________
_____________________________________________________________________________________
_____________________________________________________________________________________
_____________________________________________________________________________________
_____________________________________________________________________________________
_____________________________________________________________________________________

Slide 31
© Copyright and all rights reserved – Looking Glass Development, LLC.
Risk ManagementExpected Monetary Value (EMV)
Calculates the average outcome when future events are uncertain
Cost Probability Product
Optimistic Outcome $150,000 .20 $ 30,000
Likely Outcome $225,000 .50 $112,500
Pessimistic Outcome $300,000 .30 $ 90,000
$ 232,500
_____________________________________________________________________________________
_____________________________________________________________________________________
_____________________________________________________________________________________
_____________________________________________________________________________________
_____________________________________________________________________________________
_____________________________________________________________________________________
_____________________________________________________________________________________
_____________________________________________________________________________________
_____________________________________________________________________________________
_____________________________________________________________________________________

Slide 32
Risk Management
Decision Tree Analysis
© Copyright and all rights reserved – Looking Glass Development, LLC.
ChoiceEvent
ChanceEvent
ChanceEvent
60%
40%
20%
80%
Outcome EMV
$250K $150K
-$100K -$40K
-$45K -$9K
$20K $16K
Conservative EMV = $7,000
Aggressive EMV = $110,000
_____________________________________________________________________________________
_____________________________________________________________________________________
_____________________________________________________________________________________
_____________________________________________________________________________________
_____________________________________________________________________________________
_____________________________________________________________________________________
_____________________________________________________________________________________
_____________________________________________________________________________________
_____________________________________________________________________________________
_____________________________________________________________________________________

Slide 33
© Copyright and all rights reserved – Looking Glass Development, LLC.
Risk Management
OTS or
Develop
OTS
Develop
Well
received
Rejected
Well
received
Rejected
$ - 250K
$ - 350K
65%
$550 K
35%
$ -100 K
85%
$500 K
15%
-60K
$ 300K
$ - 350K
$ 150K
$ - 410K
$ 195K
$ -123K
$ 128K
$ -61.5K
OTS
$ 72.5K
Develop$ 66K
A.Cost ofChoice
B.Probability
&Outcome
C.Outcome
MinusCost
D.C * Probability
E.Final Outcomes
_____________________________________________________________________________________
_____________________________________________________________________________________
_____________________________________________________________________________________
_____________________________________________________________________________________
_____________________________________________________________________________________
_____________________________________________________________________________________
_____________________________________________________________________________________
_____________________________________________________________________________________
_____________________________________________________________________________________
_____________________________________________________________________________________

Slide 34
Risk ManagementData Modeling - Simulation
Monte Carlo Simulations- Cost - Use WBS or similar breakdown
- Schedule - Use PDM
Data Modeling - Sensitivity Analysis- Determine the most potential impact.
- Impact of single element of uncertainty when
all other elements are held at baseline.
© Copyright and all rights reserved – Looking Glass Development, LLC.
_____________________________________________________________________________________
_____________________________________________________________________________________
_____________________________________________________________________________________
_____________________________________________________________________________________
_____________________________________________________________________________________
_____________________________________________________________________________________
_____________________________________________________________________________________
_____________________________________________________________________________________
_____________________________________________________________________________________
_____________________________________________________________________________________

Slide 35
Risk Management
11.5 Plan Risk ResponsesDeveloping options and determining actions to
enhance opportunities and reduce threats to the project’s objectives.
Addresses the risks by their priority,
inserting resources and activities
into the budget, schedule, and project
management plan, as needed.
© Copyright and all rights reserved – Looking Glass Development, LLC.
Planning Process Group
11. Project Risk Management
11.1Plan Risk
Management
11.3Perform
QualitativeRisk Analysis
11.2Identify Risks
11.4Perform
QuantitativeRisk Analysis
11.5Plan Risk
Responses
_____________________________________________________________________________________
_____________________________________________________________________________________
_____________________________________________________________________________________
_____________________________________________________________________________________
_____________________________________________________________________________________
_____________________________________________________________________________________
_____________________________________________________________________________________
_____________________________________________________________________________________
_____________________________________________________________________________________
_____________________________________________________________________________________
Slide 36
Risk Management
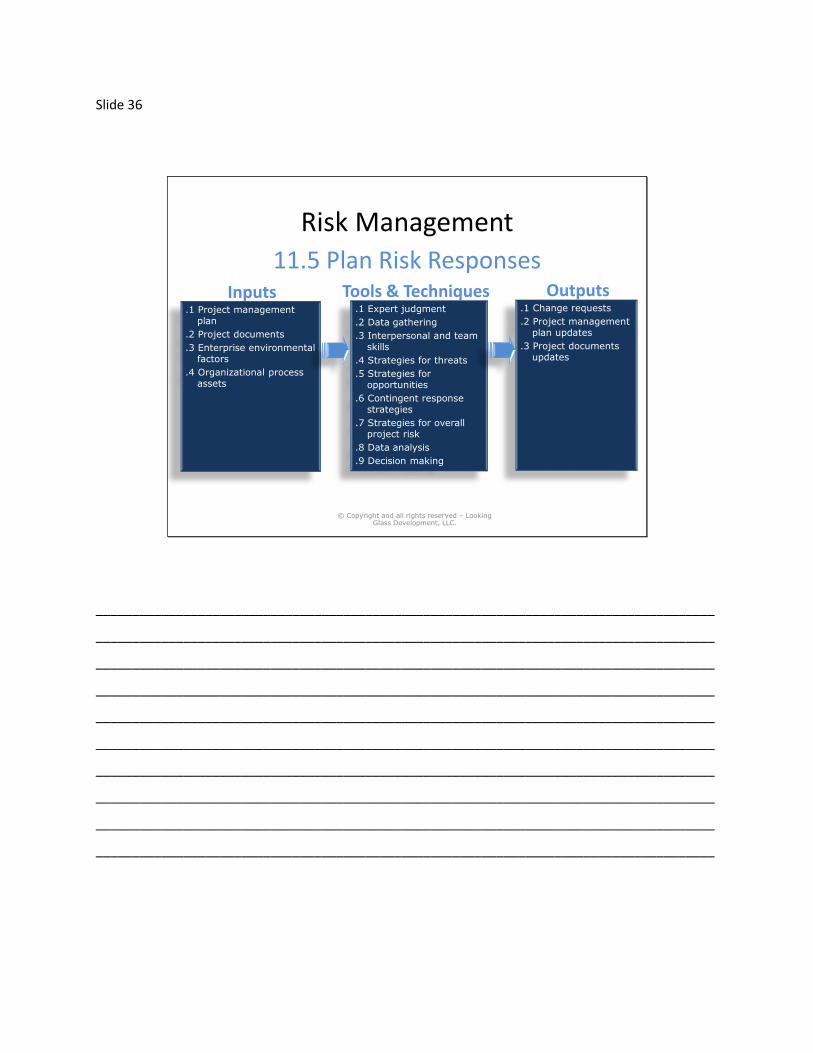
11.5 Plan Risk Responses
© Copyright and all rights reserved – Looking Glass Development, LLC.
Inputs.1 Project management
plan
.2 Project documents
.3 Enterprise environmental factors
.4 Organizational process assets
Tools & Techniques.1 Expert judgment
.2 Data gathering
.3 Interpersonal and team skills
.4 Strategies for threats
.5 Strategies for opportunities
.6 Contingent response strategies
.7 Strategies for overall project risk
.8 Data analysis
.9 Decision making
Outputs.1 Change requests
.2 Project management plan updates
.3 Project documents updates
_____________________________________________________________________________________
_____________________________________________________________________________________
_____________________________________________________________________________________
_____________________________________________________________________________________
_____________________________________________________________________________________
_____________________________________________________________________________________
_____________________________________________________________________________________
_____________________________________________________________________________________
_____________________________________________________________________________________
_____________________________________________________________________________________
Slide 37
Risk Management
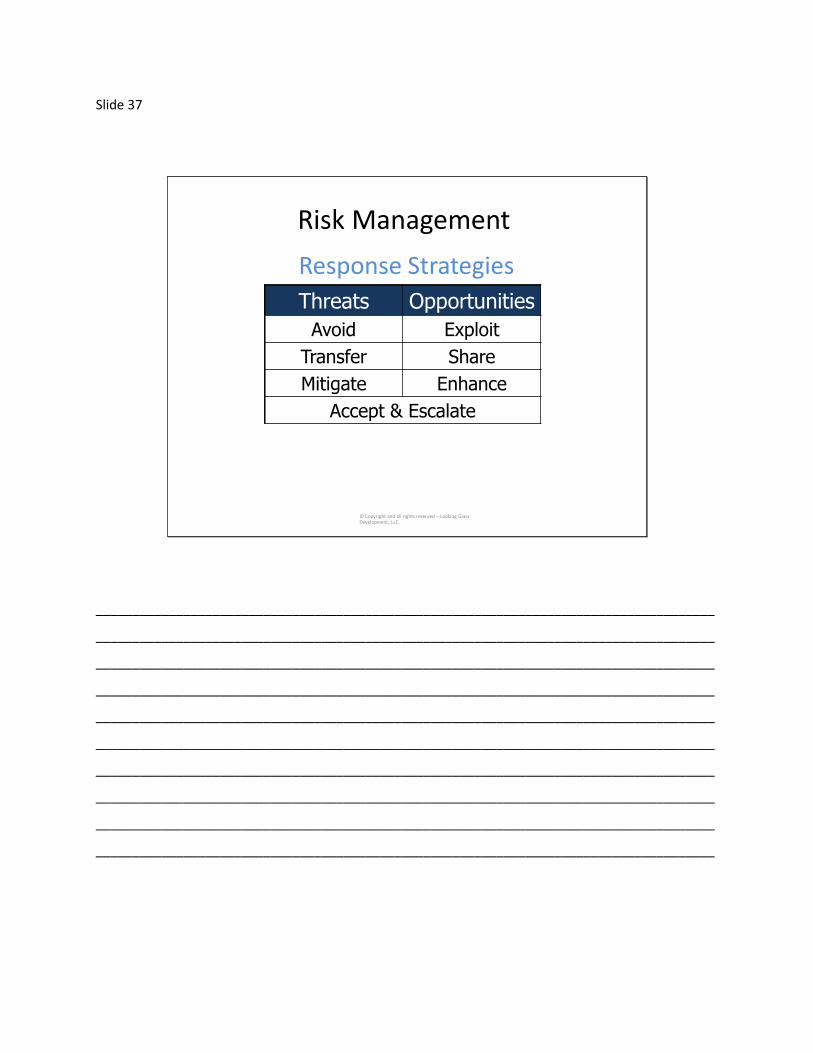
Response Strategies
Threats Opportunities
Avoid Exploit
Transfer Share
Mitigate Enhance
Accept & Escalate
© Copyright and all rights reserved – Looking Glass Development, LLC.
_____________________________________________________________________________________
_____________________________________________________________________________________
_____________________________________________________________________________________
_____________________________________________________________________________________
_____________________________________________________________________________________
_____________________________________________________________________________________
_____________________________________________________________________________________
_____________________________________________________________________________________
_____________________________________________________________________________________
_____________________________________________________________________________________

Slide 38
© Copyright and all rights reserved – Looking Glass Development, LLC.
Risk Management
Impacts to the project
Owner
Analysis data
Selected strategy
Action items
Fallback plans
Symptoms/warning signs (Triggers).
Budget and schedule updates to be made.
Contingency requests, requirements, plans.
Risk Register Updates
_____________________________________________________________________________________
_____________________________________________________________________________________
_____________________________________________________________________________________
_____________________________________________________________________________________
_____________________________________________________________________________________
_____________________________________________________________________________________
_____________________________________________________________________________________
_____________________________________________________________________________________
_____________________________________________________________________________________
_____________________________________________________________________________________

Slide 39
Risk Management
11.6 Implement Risk Responses Found in executing process group.
This process takes the strategies defined in the last process and puts them into action with its major output being change requests that are run through the integrated change control process.
© Copyright and all rights reserved – Looking Glass Development, LLC.
_____________________________________________________________________________________
_____________________________________________________________________________________
_____________________________________________________________________________________
_____________________________________________________________________________________
_____________________________________________________________________________________
_____________________________________________________________________________________
_____________________________________________________________________________________
_____________________________________________________________________________________
_____________________________________________________________________________________
_____________________________________________________________________________________

Slide 40
Risk Management
11.6 Plan Implement Responses
© Copyright and all rights reserved – Looking Glass Development, LLC.
Inputs.1 Project management
plan
.2 Project documents
.3 Organizational process assets
Tools & Techniques.1 Expert judgment
.2 Interpersonal and team skills
.3 Project management information system
Outputs.1 Change requests
.2 Project documents updates
_____________________________________________________________________________________
_____________________________________________________________________________________
_____________________________________________________________________________________
_____________________________________________________________________________________
_____________________________________________________________________________________
_____________________________________________________________________________________
_____________________________________________________________________________________
_____________________________________________________________________________________
_____________________________________________________________________________________
_____________________________________________________________________________________
Slide 41
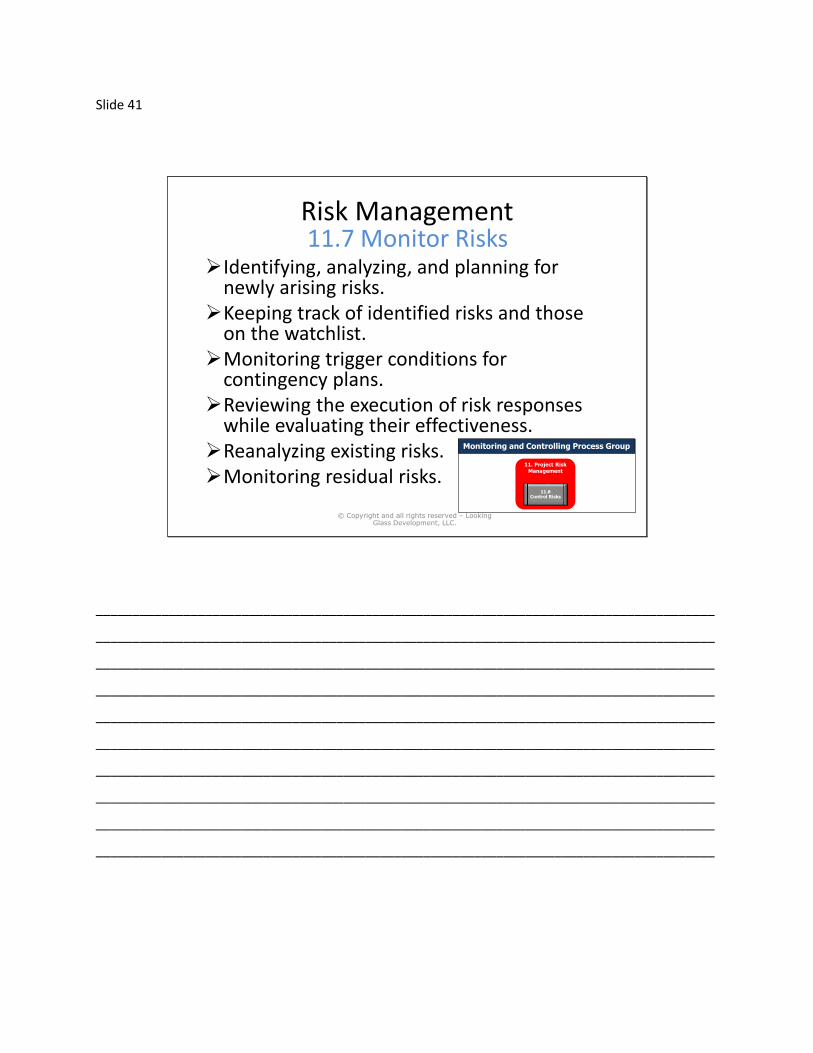
Risk Management11.7 Monitor Risks
Identifying, analyzing, and planning for newly arising risks.
Keeping track of identified risks and those on the watchlist.
Monitoring trigger conditions for contingency plans.
Reviewing the execution of risk responses while evaluating their effectiveness.
Reanalyzing existing risks.Monitoring residual risks.
© Copyright and all rights reserved – Looking Glass Development, LLC.
Monitoring and Controlling Process Group
11. Project RiskManagement
11.6Control Risks
_____________________________________________________________________________________
_____________________________________________________________________________________
_____________________________________________________________________________________
_____________________________________________________________________________________
_____________________________________________________________________________________
_____________________________________________________________________________________
_____________________________________________________________________________________
_____________________________________________________________________________________
_____________________________________________________________________________________
_____________________________________________________________________________________

Slide 42
Risk Management11.7 Monitor Risks
© Copyright and all rights reserved – Looking Glass Development, LLC.
Inputs.1 Project management
plan
.2 Project documents
.3 Work performance data
.4 Work performance reports
Tools & Techniques.1 Data analysis
.2 Audits
.3 Meetings
Outputs.1 Work performance
information
.2 Change requests
.3 Project management plan updates
.4 Project documents updates
.5 Organizational process assets updates
_____________________________________________________________________________________
_____________________________________________________________________________________
_____________________________________________________________________________________
_____________________________________________________________________________________
_____________________________________________________________________________________
_____________________________________________________________________________________
_____________________________________________________________________________________
_____________________________________________________________________________________
_____________________________________________________________________________________
_____________________________________________________________________________________

Slide 43
Risk Management
Project Risk Management – SummarySeven (7) processes.
Activities in Monitor Risks.
Eight types of risk responses.
Risk register.
Definition of risk, positive and negative.
Solving & interpreting decision trees & EMV.
© Copyright and all rights reserved – Looking Glass Development, LLC.
_____________________________________________________________________________________
_____________________________________________________________________________________
_____________________________________________________________________________________
_____________________________________________________________________________________
_____________________________________________________________________________________
_____________________________________________________________________________________
_____________________________________________________________________________________
_____________________________________________________________________________________
_____________________________________________________________________________________
_____________________________________________________________________________________
Slide 44
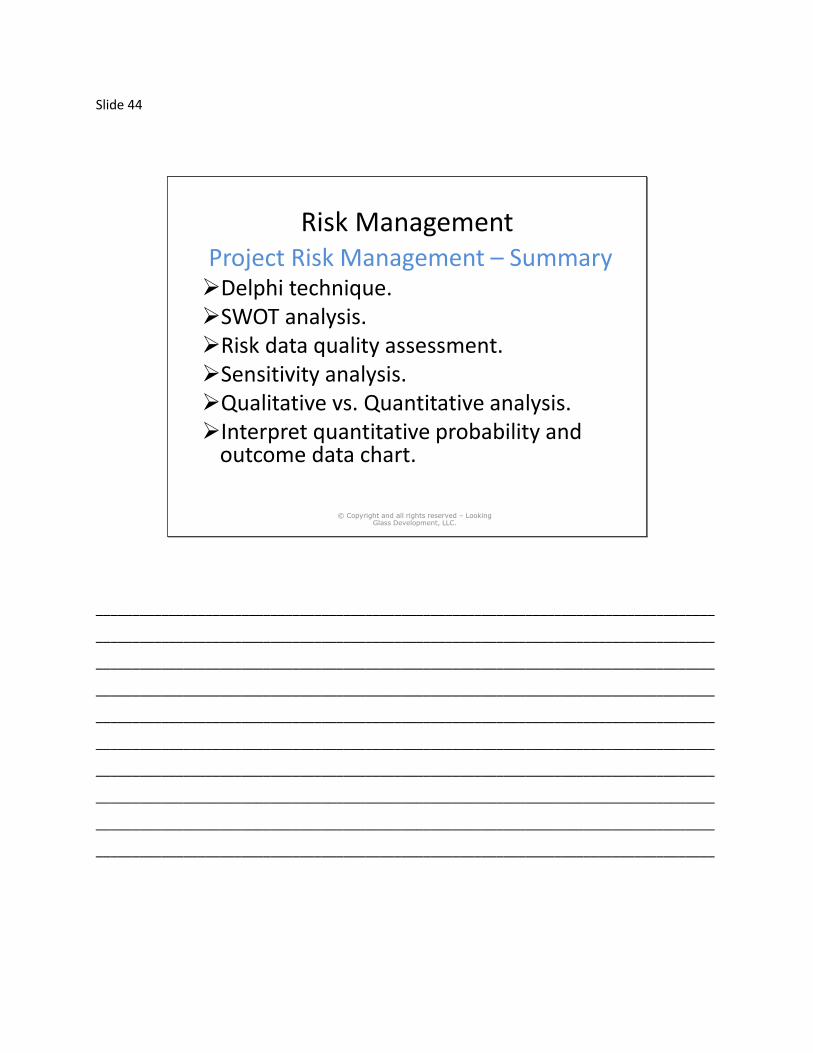
Risk ManagementProject Risk Management – SummaryDelphi technique.SWOT analysis.Risk data quality assessment.Sensitivity analysis.Qualitative vs. Quantitative analysis.Interpret quantitative probability and
outcome data chart.
© Copyright and all rights reserved – Looking Glass Development, LLC.
_____________________________________________________________________________________
_____________________________________________________________________________________
_____________________________________________________________________________________
_____________________________________________________________________________________
_____________________________________________________________________________________
_____________________________________________________________________________________
_____________________________________________________________________________________
_____________________________________________________________________________________
_____________________________________________________________________________________
_____________________________________________________________________________________


Review Questions - Part 1:
1. You have been asked to establish an estimated project cost using Expected
Monetary Value (EMV). If the project has a best case estimate of $10,000 with a
probability of 20%, a most likely case estimate of $12,000 with a probability of
50%, and a worst case estimate of $14,400 with a probability of 30% what is the
EMV for the project?
A. $12,320
B. $12,400
C. $13,010
D. $13,260
2. You have been asked to establish an estimated project cost using Expected
Monetary Value (EMV). If the project has a best case estimate of $15,000 with a
probability of 30%, a most likely case estimate of $19,500 with a probability of
50%, and a worst case estimate of $26,325 with a probability of 20% what is the
EMV for the project?
A. $19.190
B. $19,515
C. $20,110
D. $20,350
3. You have been asked to establish an estimated project cost using Expected
Monetary Value (EMV). If the project has a best case estimate of $25,000 with a
probability of 22%, a most likely case estimate of $31,250 with a probability of
53%, and a worst case estimate of $40,625 with a probability of 25% what is the
EMV for the project?
A. $30.190
B. $31,560
C. $32,219
D. $33,350

4. You have been asked to establish an estimated project cost using Expected
Monetary Value (EMV). If the project has a best case estimate of $50,000 with a
probability of 25%, a most likely case estimate of $55,000 with a probability of
45%, and a worst case estimate of $68,750 with a probability of 30% what is the
EMV for the project?
A. $55,975
B. $56,550
C. $57,125
D. $57,875
5. You have been asked to establish an estimated project cost using Expected
Monetary Value (EMV). If the project has a best case estimate of $75,000 with a
probability of 30%, a most likely case estimate of $86,250 with a probability of
40%, and a worst case estimate of $99,188 with a probability of 30% what is the
EMV for the project?
A. $86.756
B. $87,247
C. $87,691
D. $88,121
6. You have been asked to establish an estimated project cost using Expected
Monetary Value (EMV). If the project has a best case estimate of $30,000 with a
probability of 24%, a most likely case estimate of $34,500 with a probability of
56%, and a worst case estimate of $45,540 with a probability of 20% what is the
EMV for the project?
A. $35,121
B. $35,628
C. $36,222
D. $36,920
7. You have been asked to establish an estimated project cost using Expected
Monetary Value (EMV). If the project has a best case estimate of $35,000 with a
probability of 15%, a most likely case estimate of $40,250 with a probability of
60%, and a worst case estimate of $54,338 with a probability of 25% what is the
EMV for the project?
A. $41,652
B. $42,111
C. $42,984
D. $43,596
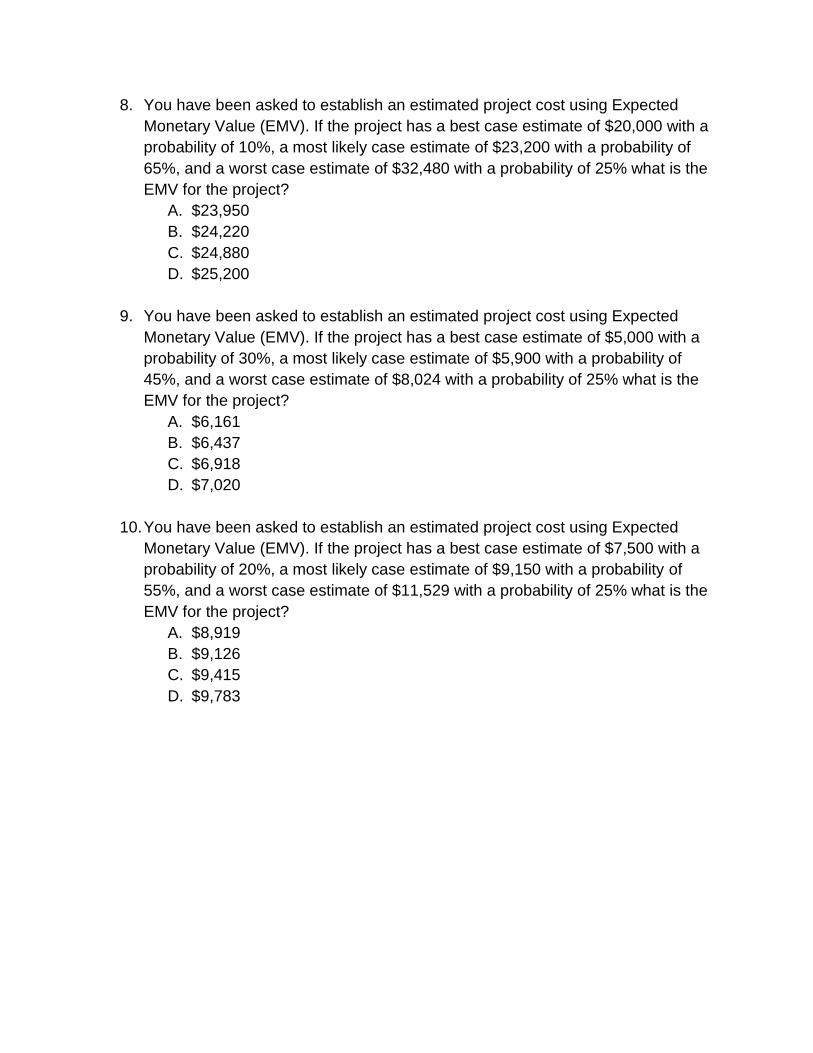
8. You have been asked to establish an estimated project cost using Expected
Monetary Value (EMV). If the project has a best case estimate of $20,000 with a
probability of 10%, a most likely case estimate of $23,200 with a probability of
65%, and a worst case estimate of $32,480 with a probability of 25% what is the
EMV for the project?
A. $23,950
B. $24,220
C. $24,880
D. $25,200
9. You have been asked to establish an estimated project cost using Expected
Monetary Value (EMV). If the project has a best case estimate of $5,000 with a
probability of 30%, a most likely case estimate of $5,900 with a probability of
45%, and a worst case estimate of $8,024 with a probability of 25% what is the
EMV for the project?
A. $6,161
B. $6,437
C. $6,918
D. $7,020
10. You have been asked to establish an estimated project cost using Expected
Monetary Value (EMV). If the project has a best case estimate of $7,500 with a
probability of 20%, a most likely case estimate of $9,150 with a probability of
55%, and a worst case estimate of $11,529 with a probability of 25% what is the
EMV for the project?
A. $8,919
B. $9,126
C. $9,415
D. $9,783

Review Questions - Part 2:
1. Which of the following is an input to the identify risks process?
A. Project management plan
B. SWOT analysis
C. Risk related contracts
D. Technical performance measurements
2. Which of the following is NOT a tool or technique used in the identify risks
process?
A. Data gathering
B. Data analysis
C. Risk categorization
D. Prompt list
3. Which of the following is a tool or technique used in the perform qualitative risk
analysis process?
A. Risk response analysis
B. Risk prioritization
C. Project management information system
D. Risk categorization
4. Which of the following is NOT an input to the perform quantitative risk analysis
process?
A. Organizational process assets
B. Agreements
C. Project management plan
D. Project documents
5. Which of the following is NOT a tool or technique used in the perform quantitative
risk analysis process?
A. Prompt lists
B. Representations of uncertainty
C. Interpersonal and team skills
D. Expert judgment

6. Which of the following is a tool or technique used in the perform quantitative risk
analysis process?
A. Representations of uncertainty
B. Risk categorization
C. Meetings
D. Project management information system
7. Which of the following is a tool or technique used in the plan risk responses
process?
A. Risk response analysis
B. Risk response planning
C. Contingent response strategies
D. Strategic risk response planning
8. Which of the following is NOT a tool or technique used in the plan risk response
process?
A. Strategies for negative risks or threats
B. Strategies for positive risks or opportunities
C. Expert judgment
D. Contingency reserve analysis
9. Which of the following is NOT an tool and technique to the monitor risks
process?
A. Risk urgency assessment
B. Risk audits
C. Status meetings
D. Technical performance measurement
10. Which of the following is a tool or technique used in the monitor risks process?
A. Audits
B. Interpersonal and team skills
C. Expert judgment
D. Decision making
11. Which of the following is NOT a tool or technique used in the implement risk
responses process?
A. Expert judgment
B. Interpersonal and team skills
C. Technical performance measurements
D. Project management information system

12. Which of the following is a tool or technique used in the implement risk
responses process?
A. Data gathering and representation techniques
B. Project management information systems
C. Risk data quality assessment
D. Planning meetings and analysis
13. You are acting as the portfolio manager and must select a project to execute
from a pool of three choices. Each of the choices has an expected payout of
$20,000 and an equal 75% chance of succeeding. In this situation what does
$15,000 represent?
A. Net present value
B. Risk value
C. Expected monetary value
D. Simple interest
14. You are leading a large complex project within your organization that is forecast
to continue for ten more months. The project has an 18% chance of being
impacted in a given month by a particular risk. What is the probability that the
project will be impacted by the risk in the 3rd month?
A. 18%
B. 36%
C. 54%
D. 72%
15. You are acting as an outside project management expert consultant for a
struggling project. The project is important to the chief executive officer who is
concerned the project is not going to hit its schedule date. Which of the following
is most likely to impact achieving the schedule target?
A. Significant increases in component costs.
B. Delays in obtaining required sponsor approvals.
C. Date slippages as stakeholders fail to attend sprint reviews.
D. Disputes with contractors over increase costs.

16. You have been asked to select one of four projects for your organization to
execute. The organization is very risk adverse. If you assume the ends of a
range of estimates are +/- 3 sigma from the mean, which of the following range
estimates involves the least risk?
A. Mean of 33 days.
B. 40 days plus or minus 8 days.
C. 32 - 46 days.
D. Optimistic = 33 days, most likely 40 days, pessimistic 46 days.
17. You have been asked to select one of four projects for your organization to
execute. The organization is very risk adverse. If you assume the ends of a
range of estimates are +/- 3 sigma from the mean, which of the following range
estimates involves the least risk?
A. Optimistic = 21 days, most likely 27 days, pessimistic = 32 days.
B. 26 days plus or minus 5 days.
C. 20 - 33 days.
D. Mean of 26 days.
18. Which of the following is not a factor in the assessment of project risk?
A. Transference costs
B. Risk probability
C. Value at stake
D. Risk event
19. You take over a project from a previous project manager. As part of the turn over
process they hand you a risk watch list. What should be done with the risks on
the watch list?
A. Add the information to your takeover report.
B. Add them to the lessons learned for future projects.
C. Read over the watch list as they are already covered in the properly
completed contingency plans.
D. Read over the watch list then revisit during monitoring and controlling.
20. Which of the following is not always an input to the risk management process?
A. Work breakdown structure
B. Lessons learned
C. Project status reports
D. Historical information
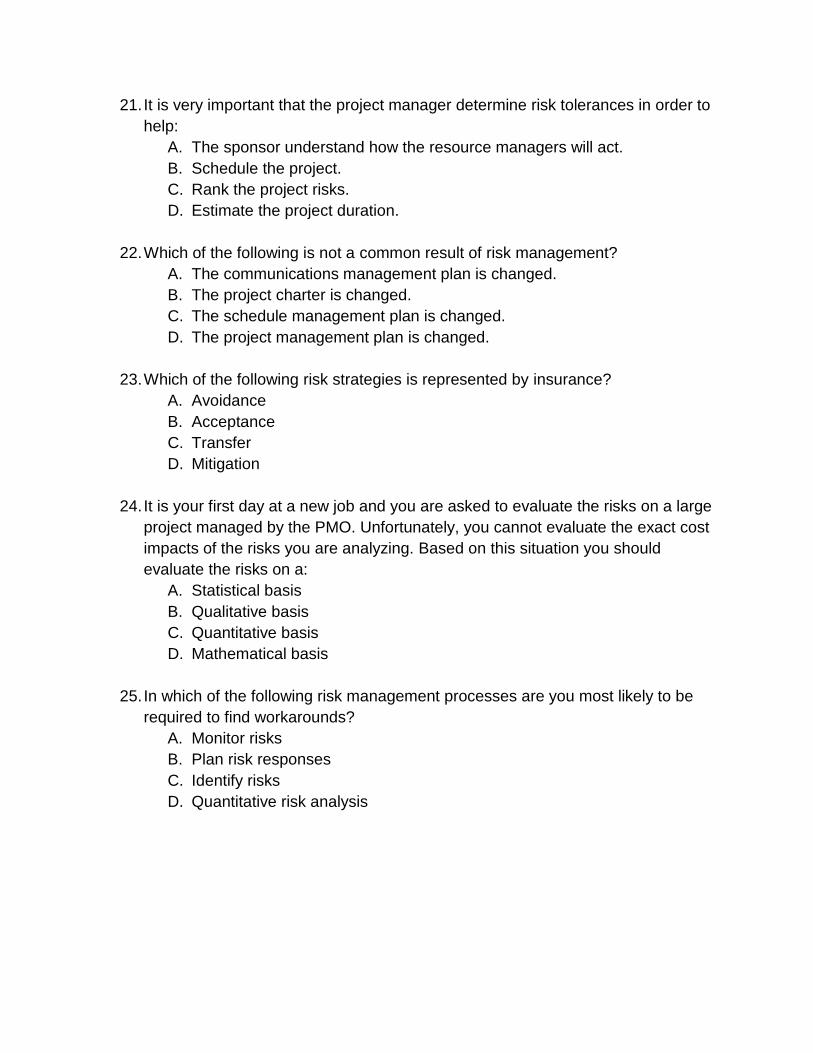
21. It is very important that the project manager determine risk tolerances in order to
help:
A. The sponsor understand how the resource managers will act.
B. Schedule the project.
C. Rank the project risks.
D. Estimate the project duration.
22. Which of the following is not a common result of risk management?
A. The communications management plan is changed.
B. The project charter is changed.
C. The schedule management plan is changed.
D. The project management plan is changed.
23. Which of the following risk strategies is represented by insurance?
A. Avoidance
B. Acceptance
C. Transfer
D. Mitigation
24. It is your first day at a new job and you are asked to evaluate the risks on a large
project managed by the PMO. Unfortunately, you cannot evaluate the exact cost
impacts of the risks you are analyzing. Based on this situation you should
evaluate the risks on a:
A. Statistical basis
B. Qualitative basis
C. Quantitative basis
D. Mathematical basis
25. In which of the following risk management processes are you most likely to be
required to find workarounds?
A. Monitor risks
B. Plan risk responses
C. Identify risks
D. Quantitative risk analysis

26. You have just determined that you need to transfer a risk. In which of the
following risk management processes are you?
A. Identify risks
B. Plan risk responses
C. Monitor and control risks
D. Perform quantitative risk analysis
27. You are acting as the project manager for a large project $1,500,000 within your
organization. You have just finished the risk response plan for your project.
Which of the following should you probably do next?
A. Begin a project risk reassessment.
B. Begin to analyze the risks that appear in major project documents.
C. Complete the work breakdown structure.
D. Determine the overall risk rating for the project.
28. You are in the process of quantifying risks on a project you are leading. Several
of your key resources are non-collocated and have needed input. How can this
be done?
A. Make use of the Delphi technique.
B. Make use of Monte Carlo analysis.
C. Make use collaboration software.
D. Apply critical chain modeling.
29. During the plan risk management process the project team you are leading
discovers 387 risks and 32 major causes of those risks. The project is part of a
major program within the organization and must be completed. Your team is very
experienced and has worked together for several years. You have also worked
with the sponsor for several years as well, and they are very supportive of your
efforts. Significant time has been spent to ensure the project scope and WBS is
complete and it has been signed off by all the key stakeholders. Unfortunately,
your team has not been able to determine an effective way to mitigate or insure
against the one of those major risks. It is something that must be done by the
internal team and cannot be outsourced. It also cannot be deleted from the
project. What would be the best solution?
A. Determine a way to transfer the risk
B. Determine a way to avoid the risk
C. Continue to investigate ways to mitigate the risk
D. Accept the risk

30. You are the project manager on a large IT project. You have assembled your
team, identified the major risks on the project, determined what would trigger
those risks, rated the risks on a rating matrix, tested the major risk assumptions,
and assessed the quality of the data used. The team is continuing to move
through the risk management process. What have you forgotten to do?
A. Involve other stakeholders.
B. Use a Monte Carlo simulation.
C. Mitigate the risks.
D. The overall risk ranking for the project.
31. You have worked with different stakeholders to determine the probability and
impact of a project's risks. You have also analyzed the assumptions. Before you
move on to the next step in the risk management process, what do you need to
do?
A. Identify and evaluate triggers.
B. Develop your risk rating matrix.
C. Evaluate the trends in risk analysis.
D. Create a contingency plan.
32. You apply for a job with a large consulting company. As part of the interview
process you are provided with a sample project charter and asked to provide an
analysis of the project risks. Which of the following would best help you complete
the exercise?
A. The PMBOK Guide.
B. A discussion with several team members within the organization from a
similar project that failed in the past.
C. The scope statement from the project planning process.
D. The resource plan from the project planning process.
33. You are working as a project manager on a large new product development
project. While preparing your risk responses your team identifies additional risks.
What should you do?
A. Get management to allocate another 5% to the project budget to cover the
risks.
B. Determine the risk events and the associated cost, then add the cost to
the project budget as a reserve.
C. Document the risks, and calculate the expected monetary value based on
the PI score that result from the risk occurrence.
D. Add reserves to the project to accommodate the new risks and notify
management.
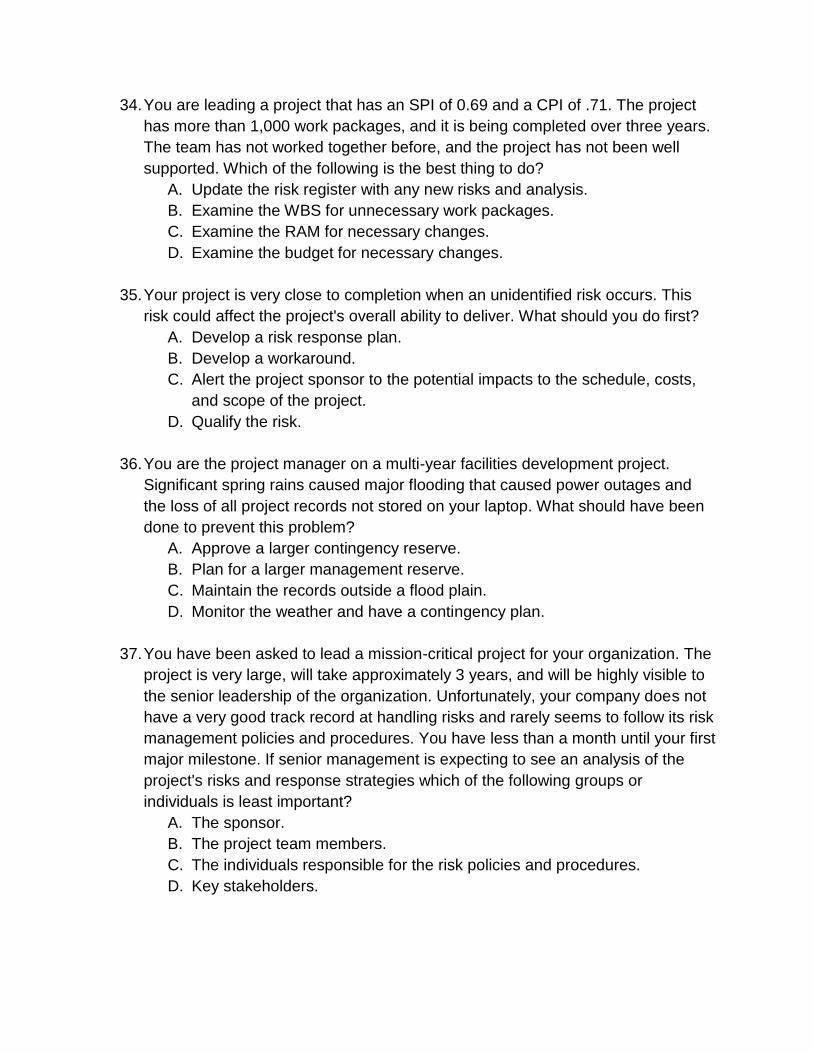
34. You are leading a project that has an SPI of 0.69 and a CPI of .71. The project
has more than 1,000 work packages, and it is being completed over three years.
The team has not worked together before, and the project has not been well
supported. Which of the following is the best thing to do?
A. Update the risk register with any new risks and analysis.
B. Examine the WBS for unnecessary work packages.
C. Examine the RAM for necessary changes.
D. Examine the budget for necessary changes.
35. Your project is very close to completion when an unidentified risk occurs. This
risk could affect the project's overall ability to deliver. What should you do first?
A. Develop a risk response plan.
B. Develop a workaround.
C. Alert the project sponsor to the potential impacts to the schedule, costs,
and scope of the project.
D. Qualify the risk.
36. You are the project manager on a multi-year facilities development project.
Significant spring rains caused major flooding that caused power outages and
the loss of all project records not stored on your laptop. What should have been
done to prevent this problem?
A. Approve a larger contingency reserve.
B. Plan for a larger management reserve.
C. Maintain the records outside a flood plain.
D. Monitor the weather and have a contingency plan.
37. You have been asked to lead a mission-critical project for your organization. The
project is very large, will take approximately 3 years, and will be highly visible to
the senior leadership of the organization. Unfortunately, your company does not
have a very good track record at handling risks and rarely seems to follow its risk
management policies and procedures. You have less than a month until your first
major milestone. If senior management is expecting to see an analysis of the
project's risks and response strategies which of the following groups or
individuals is least important?
A. The sponsor.
B. The project team members.
C. The individuals responsible for the risk policies and procedures.
D. Key stakeholders.
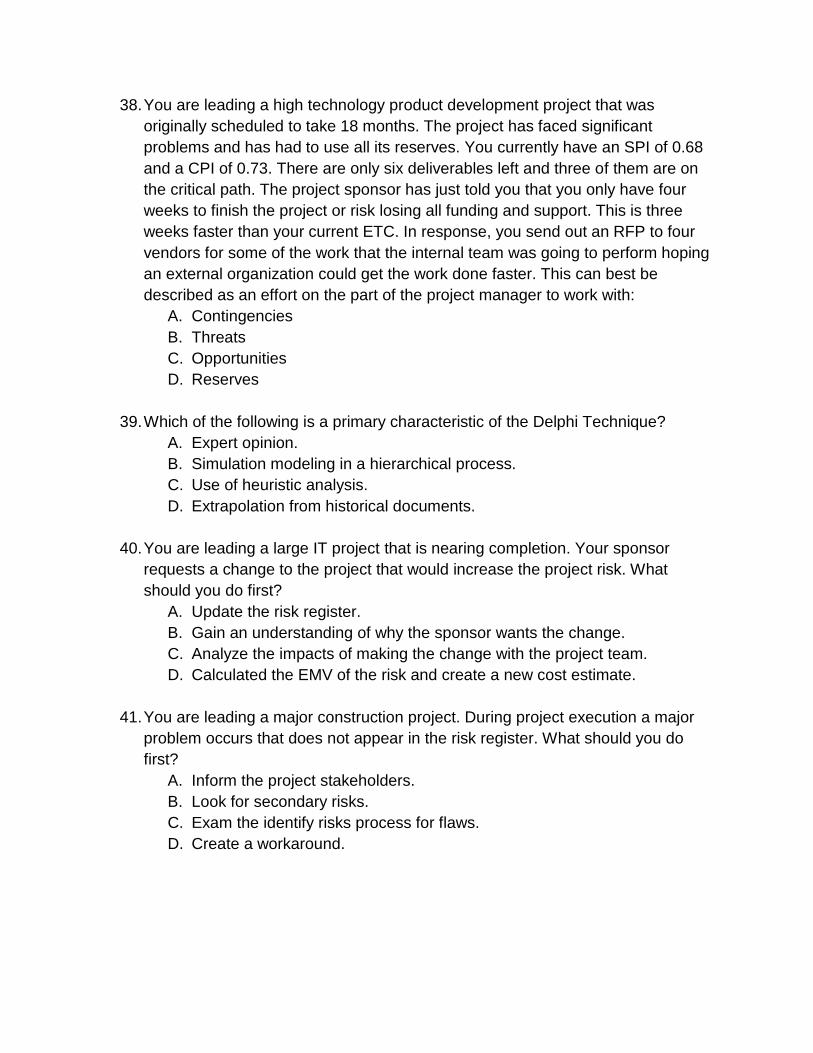
38. You are leading a high technology product development project that was
originally scheduled to take 18 months. The project has faced significant
problems and has had to use all its reserves. You currently have an SPI of 0.68
and a CPI of 0.73. There are only six deliverables left and three of them are on
the critical path. The project sponsor has just told you that you only have four
weeks to finish the project or risk losing all funding and support. This is three
weeks faster than your current ETC. In response, you send out an RFP to four
vendors for some of the work that the internal team was going to perform hoping
an external organization could get the work done faster. This can best be
described as an effort on the part of the project manager to work with:
A. Contingencies
B. Threats
C. Opportunities
D. Reserves
39. Which of the following is a primary characteristic of the Delphi Technique?
A. Expert opinion.
B. Simulation modeling in a hierarchical process.
C. Use of heuristic analysis.
D. Extrapolation from historical documents.
40. You are leading a large IT project that is nearing completion. Your sponsor
requests a change to the project that would increase the project risk. What
should you do first?
A. Update the risk register.
B. Gain an understanding of why the sponsor wants the change.
C. Analyze the impacts of making the change with the project team.
D. Calculated the EMV of the risk and create a new cost estimate.
41. You are leading a major construction project. During project execution a major
problem occurs that does not appear in the risk register. What should you do
first?
A. Inform the project stakeholders.
B. Look for secondary risks.
C. Exam the identify risks process for flaws.
D. Create a workaround.

42. You are leading a research and development project. You are in the executing
process group when one of your senior resources identifies a risk that is not
listed in the risk register. What should you do?
A. Determine how the team member identified the risk.
B. Analyze the risk.
C. Inform the sponsor and key stakeholders of the risk.
D. Place the risk in the risk register.
43. You are taking over a $50,000 IT project for your organization. The project is
entering its third phase. Although there appear to be many risks on the project,
no one has evaluated them to assess the range of possible impacts. What needs
to be done?
A. Perform qualitative risk analysis
B. Plan risk management
C. Plan risk responses
D. Monitor risks
44. Which of the following best describes a heuristic?
A. An advanced statistical calculation used to model risks.
B. A simulation used to model risks.
C. A rule of thumb.
D. A calculation used to produce a weighted measure of risk.
45. Monte Carlo analysis is used to:
A. Get an indication of the risk involved in a project.
B. Simulate the order in which activities occur.
C. Estimate an activity's length.
D. Measure project risk level.
46. You are working with your team to complete the risk response plan. However,
every time the team develops a risk response, another risk is identified as being
caused by the suggested response. Which of the following is the best thing for
the project manager to do?
A. Return to the identify risks process as something is amiss.
B. Document the new risks and continue the plan risk responses process.
C. Return to the define scope process to determine what is missing.
D. Get more stakeholders involved in the identify risks process as so many
were missed.
47. From which of the following processes would you expect to generate a watch
list?
A. Plan risk management
B. Identify risks
C. Perform qualitative risk analysis
D. Plan risk responses
48. Which of the following must be an agenda item at all team meetings?
A. Review of project issues
B. Identification of new assignments
C. Status of all activities
D. Discussion of project risks
49. Which of the following is not always an input to the risk management process?
A. Project status reports
B. Historical information
C. Lessons learned
D. The work breakdown structure
50. You are struggling to evaluate the exact cost impact of risks on your project. You
would be advised to evaluate on a:
A. Qualitative basis
B. Quantitative basis
C. Numeric basis
D. Cost basis
51. You have just finished the risk response plan for your US $250,000 information
technology project. Which of the following should you probably do next?
A. Determine the overall risk rating for the project.
B. Add needed work packages to the work breakdown structure.
C. Hold a project risk reassessment.
D. Begin to analyze the risks that appeared in the technical design.
52. You have just completed the determination of probability and impact of your
defined project risks. You have also analyzed the assumptions and are ready to
move on to the next step of risk management, but based upon the information
what have you forgotten to do?
A. Identify triggers.
B. Evaluate trends in the risk analysis.
C. Create a fallback plan.
D. Provide a standardized risk rating matrix.
53. As the project manager you have assembled your team and identified more than
100 risks on your project. You and the team have rated them on a risk rating
matrix, tested their assumptions, and assessed the quality of the data used. The
team is continuing to move through the risk management process, but what have
you forgotten to do?
A. Risk mitigation.
B. Overall risk ranking for the project.
C. Involve other stakeholders.
D. Monte Carlo analysis.
54. Your team has come up with 521 risks and 42 major causes of those risks. Your
team has worked on several projects together and your project sponsor is both
influential and supportive. You and your team have invested significant time to
make sure the project work was completed and signed off by all key
stakeholders. However, during the planning phase, the team was unable to come
up with an effective way to mitigate or ensure against a particular risk. The work
cannot be outsourced or deleted from the project. Which of the following
represents the best solution?
A. Accept the risk.
B. Look for ways to transfer the risk.
C. Look for ways to avoid the risk.
D. Continue to look for ways to mitigate the risk.

55. You are leading a large, multi-year engineering project designed to impact
multiple locations within your company. A tornado destroys the headquarters
location and all the project records including all project reporting and historical
information with no way of recovering the information. What should have been
done to prevent this problem?
A. Purchase insurance.
B. Monitor the weather and have a contingency plan.
C. Plan a reserve fund.
D. Schedule the installation outside of tornado season.
56. During the project execution phase of a project you are leading one of your
subject matter experts identifies a risk that is not in the risk register. What should
you do?
A. Disregard the risk because it was not identified in risk identification
B. Inform the sponsor of the risk
C. Analyze the risk
D. Discuss with the resource how they identified the risk to ensure others
were not missed
57. Which of the following is a chief characteristic of the Delphi Technique?
A. A bottoms up approach
B. Analytical heuristic analysis
C. Expert opinion
D. Extrapolation from historical records of previous projects
58. You are leading a multi-year project that is almost complete. You have five
deliverables left and have used up almost all the reserves. You sponsor informs
you that the project must be completed two weeks earlier than previously
forecasted. In response you send out an RFP to several potential vendors to
outsource three of the remaining deliverables. This is an example of the project
manager attempting to work with what?
A. Reserves
B. Opportunities
C. Threats
D. Strengths
59. During the identify risks process, a project manager made a long list of risks
identified by all the stakeholders using various methods. She then made sure all
the risks were understood and that triggers had been identified. Later, in the plan
risk responses process, she took all the risks that had been identified and
determined ways to mitigate them. What has she done wrong?
A. The project manager should have waited until the perform qualitative risk
analysis process to get the stakeholders involved.
B. The project manager should have created workarounds.
C. More people should be involved in the plan risk response process.
D. Triggers are not identified until the identify risks process.
60. Which of the following is the existence of an uncertainty about some key
characteristics of a planned event, activity, or decision?
A. Variability Risk
B. Ambiguity Risk
C. Project Resilience
D. Integrated Risk Management

Answer Key - Part 1:
1. A
Answer A. The formula to get the correct answer is: ($10,000 * 20%) + ($12,000 *
50%) + ($14,400 * 30%) = $12,320
2. B
Answer B. The formula to get the correct answer is: ($25,000 * 22%) + ($31,250 *
53%) + ($40,625 * 25%) = $19,515
3. C
Answer C. The formula to get the correct answer is: ($15,000 * 30%) + ($19,500
* 50%) + ($26,325 * 20%) = $32,219
4. D
Answer D. The formula to get the correct answer is: ($50,000 * 25%) + ($55,000
* 45%) + ($68,750 * 30%) = $57,875
5. A
Answer A. The formula to get the correct answer is: ($75,000 * 30%) + ($86,250 *
40%) + ($99,188 * 30%) = $86,756
6. B
Answer B. The formula to get the correct answer is: ($30,000 * 24%) + ($34,500 *
56%) + ($45,540 * 20%) = $35,628
7. C
Answer C. The formula to get the correct answer is: ($35,000 * 15%) + ($40,250
* 60%) + ($54,338 * 25%) = $42,984
8. D
Answer D. The formula to get the correct answer is: ($20,000 * 10%) + ($23,200
* 65%) + ($32,480 * 25%) = $25,200
9. A
Answer A. The formula to get the correct answer is: ($5,000 * 30%) + ($5,900 *
45%) + ($8,024 * 25%) = $6,161

10. C
Answer C. The formula to get the correct answer is: ($7,500 * 20%) + ($9,150 *
55%) + ($11,529 * 25%) = $9,415
Answer Key - Part 2:
1. A
Answer A. PMBOK Guide p. 396 - The inputs to the identify risks process
includes:
- Project management plan
- Project documents
- Agreements
- Procurement documentation
- Enterprise environmental factors
- Organizational process assets
2. C
Answer C. PMBOK Guide p. 396 - The tools and techniques of the identify risks
process include:
- Expert judgment
- Data gathering
- Data analysis
- Interpersonal and team skills
- Prompt lists
- Meetings
3. D
Answer D. PMBOK Guide p. 396 - The tools and techniques used in the perform
qualitative risk analysis include:
- Expert judgment
- Data gathering
- Data analysis
- Interpersonal and team skills
- Risk categorization
- Data representation
- Meetings
4. B
Answer B. PMBOK Guide p. 396 - The inputs to the perform quantitative risk
analysis process include:
- Risk management plan
- Cost management plan
- Schedule Management Plan
- Risk register

- Enterprise environmental factors
- Organizational process assets
5. A
Answer A. PMBOK Guide p. 396 - The tools and techniques used in the perform
quantitative risk analysis process include:
- Expert judgment
- Data gathering
- Interpersonal and team skills
- Representations of uncertainty
- Data analysis
6. A
Answer A. PMBOK Guide p. 396 - The tools and techniques used in the perform
quantitative risk analysis process include:
- Expert judgment
- Data gathering
- Interpersonal and team skills
- Representations of uncertainty
- Data analysis
7. C
Answer C. PMBOK Guide p. 396 - The tools and techniques used in the plan risk
responses process include:
- Expert judgment
- Data gathering
- Interpersonal and team skills
- Strategies for negative risks or threats
- Strategies for positive risks or opportunities
- Contingent response strategies
- Strategies for overall project risks
- Data analysis
- Decision making
8. D
Answer D. PMBOK Guide p. 396 - The tools and techniques used in the plan risk
responses process include:
- Expert judgment
- Data gathering
- Interpersonal and team skills

- Strategies for negative risks or threats
- Strategies for positive risks or opportunities
- Contingent response strategies
- Strategies for overall project risks
- Data analysis
- Decision making
9. A
Answer A. PMBOK Guide p. 396 - The tools and techniques used in the monitor
risks process include:
- Data analysis
- Audits
- Meetings
10. A
Answer A. PMBOK Guide p. 396 - The tools and techniques used in the monitor
risks process include:
- Data analysis
- Audits
- Meetings
11. C
Answer C. PMBOK Guide p. 396 - The tools and techniques used in the
implement risk responses process include:
- Expert judgment
- Interpersonal and team skills
- Project management information system
12. B
Answer B. PMBOK Guide - The tools and techniques used in the implement risk
responses process include:
- Expert judgment
- Interpersonal and team skills
- Project management information system
13. C
Answer C. The expected monetary value is calculated by multiplying the
probability times the impact of any event.
14. A
Answer A. Many people miss this question. Remember, each month in the
scenario is independent. So if the probability is 18% in one month and the
probability is equal, it is 18% in all months.
15. B
Answer B. Only delays in obtaining sponsor approvals are guaranteed to cause
delays. The other alternatives might cause a delay (except the post
implementation review meeting).
16. D
Answer D. This question is actually much easier than it first appears. Because
we are assuming a range of estimates that is +/- 3 sigma, meaning it is a normal
distribution, all you have to do is determine which range estimate has the
smallest difference or variance. The 3 point estimate has a range of 13, the 33-
46 days is a range of 13, and 40 +/- 8 days is 16.
17. B
Answer B. This question is actually much easier than it first appears. Because we
are assuming a range of estimates that is +/- 3 sigma, meaning it is a normal
distribution, all you have to do is determine which range estimate has the
smallest difference or variance. The 3 point estimate has a range of 11 days. The
plus or minus 5 days is a range of 10 and 20-33 days is 13.
18. A
Answer A. "Transference costs" is a fancy way of saying insurance premiums.
These do not come into play until you are evaluating the risk responses.
19. B
Answer B. A good project manager is constantly monitoring the identified risks on
a project. In this question you do not know where the watch list came from.
20. C
Answer C. Although project status reports can be a vital input to the risk
management process, they are usually not available during the risk planning
process and are therefore not always an input to the risk management process.
21. C
Answer C. Risk tolerances, or how much risk various stakeholders are willing to
accept. This is a critical piece of information used to rank the project risks.
22. B
Answer B. Of the choices the project charter is the least likely to be changed
because of the risk management process. Remember, the charter authorizes the
project.
23. C
Answer C. Insurance is the most common type of risk transfer. It is making the
risk someone else's problem.
24. B
Answer B. The question tells you that you cannot find the exact impacts. This
excludes statistical, quantitative and mathematical basis of measure. You are left
with qualitative such as high, medium and low.
25. A
Answer A. Workarounds-by definition-are responses created for risks not
included in the risk register.
26. B
Answer B. Be careful here. The question states you have just determined that
you NEED to transfer a risk. This is done in the plan risk response process.
27. C
Answer C. Finishing the risk response plan is done in the planning process
group. The only of the options that is also in the planning process group is the
completion of the work breakdown structure.
28. A
Answer A. The Delphi Technique is specifically designed to survey your experts,
aggregate their responses and then feed the aggregated result back to them for
confirmation. This is the best option in a situation where the resources are not all
together.
29. D
Answer D. There are two important aspects to this question. Firstly, did you
notice that everything but the last four sentences is unnecessary? Secondly, this
question really reflects the real world. The question excludes everything but
acceptance. Sometimes in the real world all you can do is accept a risk.

30. A
Answer A. There is nothing wrong with this process. It simply needs to be
continued. The best answer in this case is to involve other stakeholders
31. B
Answer B. Before you can move on to the next step in the process you need a
definition for how you will be rating the risks.
32. B
Answer B. This question centers on imagining where you are in the project. The
question gives you a charter and nothing else. Therefore, you must assume you
are in the initiating process. Two of the other choices say they are from the
planning process and therefore not available. The PMBOK Guide is a nice
framework, bur remember PMI suggests the situation is critical.
33. C
Answer C. Before you can determine the appropriate response you have to
determine the value or cost of the risk as well as the impacts. Only then can you
determine if you or management needs to add reserves or another response is
needed.
34. A
Answer A. To answer this question correctly you had to notice the project is
already significantly over budget and behind schedule. Changing the WBS, RAM,
or budget should only happen in response to risks that occur. So you should start
there.
35. D
Answer D. The first thing you always do is analyze the situation and develop
alternatives. Only then do you proceed.
36. D
Answer D. With the information provided you do not know what the best solution
would have been. The only thing you can say for sure is that you should have
had a contingency plan-oh, and watching the weather probably wasn't a bad idea
either.
37. A
Answer A. Although sponsors are often involved in the identification of risks, they
are usually not as involved in the development of response plans. All the other
answers are key resources in the development of response plans.
38. C
Answer C. This is a bad situation, but that does not impact the answer. Only the
last three sentences matter. You are trying to gain an opportunity to do the
project more quickly.
39. A
Answer A. The Delphi Technique is a process where you survey your subject
matter expert, aggregate their responses, and then feed back the aggregation for
confirmation.
40. C
Answer C. According to PMI, the first thing you must do in any situation is
understand the impacts. Only then can you devise the correct response.
41. D
Answer D. This is a risk that has already happened. The first thing you need to
do is deal with the problem and then take the workaround to the sponsor and key
stakeholders.
42. B
Answer B. The first thing you always do is analyze the risk. Only then can you
determine what should be done next.
43. B
Answer B. The project has started, and it should complete the risk management
process. That process begins by planning risk management. Since that step has
not already occurred it needs to be completed first.
44. C
Answer C. A heuristic is simply a rule of thumb. There is no calculations involved.
45. A
Answer A. Several of these answers are partially correct. The Monte Carlo
Analysis could help you know that an activity needs to change, but not what the
estimate should be. The Monte Carlo analysis is a simulation tool, but it typically

is used to simulate time or cost and not ordering of the activities. It can also be
used to measure the probabilities of risk or the likelihood of being on the critical
path. However, the best answer is getting an overall analysis of the project risk.
46. B
Answer B. Don't get misled by the fact that the process generated so many new
risks. The key is that you follow your process. In this case it is working as it
should. You should expect the identify risk responses process to generate new
risks.
47. C
Answer C. A watch list is made up of low priority risks that, in the perform
qualitative risk analysis process, were determined to be too low priority or low
impact to move further in the risk process.
48. D
Answer D. According to PMI, risks are a critical area that impacts all other areas
of project management. It is so important it should be discussed at every
meeting.
49. A
Answer A. Although project status reports can be an important input to the risk
management process, when you are first completing the process you likely will
not have any status reports yet.
50. A
Answer A. If you cannot determine the exact costs of a risk you should use
qualitative estimates such as low, medium and high.
51. B
Answer B. Based upon the description, this situation is in the planning process
group. You must complete the planning before moving on. The only process in
planning is adding work packages to the WBS.
52. D
Answer D. In this case you are in the Perform Qualitative Risk Analysis process.
There are two key activities in this process: assumption testing and probability
and impact matrix development. The matrix is missing. All the other options will
occur later in risk management.

53. C
Answer C. You might look at this question as a trick of sorts. The process
described is fine. The only issue is you have not involved other stakeholders to
identify more risks.
54. A
Answer A. Most of this question is useless. You cannot remove the work nor can
you insure or outsource it to transfer the risk. The only option left is acceptance.
55. B
Answer B. The risk is the loss of the data due to the weather. Purchasing
insurance does nothing to mitigate the problem. Creating a reserve fund is a form
of risk acceptance. Avoiding the tornado by scheduling the project when it wasn't
tornado season could negatively impact the project. The best choice is to monitor
the weather and know when to implement the contingency plan.
56. C
Answer C. This is another example of those "what would you do first?" questions.
As always, the right answer is analyze the situation.
57. C
Answer C. The Delphi Technique uses expert judgment to build a consensus
opinion. The expert judgment is its key feature.
58. B
Answer B. The ability to potentially outsource some of the deliverables is an
example of taking advantage of an opportunity.
59. C
Answer C. The plan risk responses processes should include the involvement of
all the risk response owners and possibly other stakeholders.
60. A
Answer A. Variability Risk - Uncertainty exists about some key characteristics of
a planned event, activity, or decision. Examples include: productivity being
above or below a target, or weather conditions impacting construction.