projecting genetic diversity and population viability - inter research
TRANSCRIPT

ENDANGERED SPECIES RESEARCHEndang Species Res
Vol. 12: 249–261, 2010doi: 10.3354/esr00295
Published online October 25
INTRODUCTION
The relative importance of genetic diversity in popu-lation viability and management has been debatedover the last few decades (e.g. Asquith 2001). While itis now widely accepted that demographic isolation andsubsequent inbreeding can potentially be implicated
in population extinction (e.g. Saccheri et al. 1998) andthat the introduction of unrelated genomes into inbredpopulations can alleviate such problems (Madsen et al.1999, 2004, Tallmon et al. 2004, Schwartz & Mills2005), the role of genetics in population viability analy-sis remains limited, and the integration of moleculardata is still at an early stage (Reed et al. 2002).
© Inter-Research 2010 · www.int-res.com*Email: [email protected]†This paper is dedicated to the memory of Mahedi Andau
Projecting genetic diversity and populationviability for the fragmented orang-utan populationin the Kinabatangan floodplain, Sabah, Malaysia
Michael W. Bruford1,*, Marc Ancrenaz2, Lounès Chikhi3, Isabelle Lackman-Ancrenaz2, Mahedi Andau4,†, Laurentius Ambu4,
Benoît Goossens1
1School of Biosciences, Cardiff University, Cathays Park, Cardiff CF10 3TL, UK2Kinabatangan Orang-utan Conservation Project, Sukau, Sabah, Malaysia
3Laboratoire Evolution et Diversité Biologique, UMR CNRS 5174, Université Paul Sabatier, Toulouse, France4Sabah Wildlife Department, Kota Kinabalu, Sabah, Malaysia
ABSTRACT: Genetic management of fragmented populations poses logistical and theoretical chal-lenges to conservation managers. Simulating changes in genetic diversity and differentiation withinand among fragmented population units under different management scenarios has until now rarelyused molecular marker data collected from present-day populations. Here we examine the geneticimplications of management options for the highly fragmented yet globally significant orang-utanpopulation in the Lower Kinabatangan Wildlife Sanctuary, Sabah, Malaysia. We simulated the effectsof non-intervention, translocation, corridor establishment and a mixture of the latter 2 approaches onfuture genetic diversity in this population using the stochastic simulation software VORTEX and awell-described molecular dataset for 200 individuals from within the Sanctuary. We found that non-intervention resulted in high extinction risks for a number of subpopulations over short demographictimescales (<5 generations). Furthermore, the exclusive use of either translocation or corridor estab-lishment as a management tool was insufficient to prevent substantial levels of inbreeding usingdemographically and logistically feasible translocation rates and was insufficient to prevent inbreed-ing and extinction in the most isolated subpopulations using conservative corridor establishmentrates. Instead, a combination of modest translocation rates (1 ind. every 20 yr) and corridor establish-ment enabled even the most isolated subpopulations to retain demographic stability and constrainlocalised inbreeding to levels below a threshold of 0.1. Our simulations suggest that this mixed man-agement approach is both a pragmatic and potentially successful course of action and that this com-bination may be useful in other species and fragmented populations in the future. The use of present-day molecular data in stochastic simulations requires further development, but here we show that itcan aid predictive modelling.
KEY WORDS: Population modeling · VORTEX · Orang-utan · Kinabatangan · Fragmentation ·Genetic diversity
Resale or republication not permitted without written consent of the publisher
OPENPEN ACCESSCCESS

Endang Species Res 12: 249–261, 2010
Ongoing population fragmentation is a major issuefor many threatened species, and integrated manage-ment of subpopulations is expected to play an increas-ing role in conservation measures. The dynamics ofgenetic change in fragmented populations is thereforea major focus of attention (e.g. Keyghobadi et al. 2005).However, the consequences of, and optimal strategiesfor genetic management of metapopulations remainunderstudied. The relationship between levels of in-breeding and inbreeding depression itself are stilldebated (Keller & Waller 2002) and are likely to becase specific. Issues such as the frequency and symme-try of genetic exchange and its relationship to thenumber of subpopulations managed (e.g. Bouchy et al.2005), the dynamics of incorporation of immigrantgenes into recipient subpopulations (Keller et al. 2001,Saccheri & Brakefield 2002) plus the potential negativeconsequences of immigration and the role of popula-tion size on genetic load (Robert et al. 2003, Tallmon etal. 2004) are areas in which more research is requiredif genetic management is to be improved. One arealargely unexplored in this context is the integration ofmolecular population genetics into population viabilitymodels and the way in which genetic diversity is pre-dicted to evolve, using marker data as a starting point,under different management strategies.
The increasing use of molecular data to measuregenetic variation in threatened populations potentiallyfacilitates key management decisions (e.g. Frankham2003, Talbot et al. 2003, Tallmon et al. 2004). However,using molecular data directly in predictive populationviability analysis remains limited. The need to inte-grate analysis of past, current and future parametertrajectories in conservation is acknowledged (e.g.Bowen & Roman 2005). When coupled with the obser-vation that rapid evolution in small populations canimpact endangered species (Stockwell et al. 2003),realistic predictive simulations of future genetic diver-sity becomes a potentially important tool in populationmanagement.
Using coalescent-based genealogical simulationsand contemporary molecular data, we previouslyreported evidence for a recent demographic collapseand the resultant contemporary genetic structure ofthe now highly fragmented orang-utan population inthe Lower Kinabatangan Wildlife Sanctuary in Sabah,Malaysia (Goossens et al. 2005, 2006a,b, Jalil et al.2008). Here, we used these data to simulate futuretrends in genetic diversity and demographic viabilityby stochastic population modelling of alternative man-agement scenarios for this metapopulation. We testedthe effects of managed translocation and the establish-ment of habitat corridors and their consequences ongenetic diversity and demographic viability within andin this series of well-characterised, fragmented sub-
populations (Ancrenaz et al. 2004). We address thepredicted effects on genetic diversity of translocations,the establishment of forest fragment corridors and amixed approach combining the two. We compare theseresults to no intervention, assessing the influence ofthe above factors on the trajectory of genetic diversityin the subpopulations concerned.
MATERIALS AND METHODS
Study site, population status and data. The orang-utan population of the Lower Kinabatangan WildlifeSanctuary (LKWS) is one of the most well-studied onthe island of Borneo (e.g. Lackman-Ancrenaz et al.2001, Ancrenaz 2003, 2004). The sanctuary lies in thefloodplain of the Kinabatangan River, one of the mostimportant wetlands in Malaysia for biodiversity de-spite high levels of habitat degradation and fragmenta-tion. This degradation is manifest in different sizedareas of partially degraded and fragmented forestalong both banks of the river (Lackman-Ancrenaz etal. 2001, Ancrenaz 2003) largely surrounded by oilpalm plantations. Despite this, LKWS supports avery high density of primates. The Sabah State Gov-ernment officially gazetted 10 forest lots totallingabout 26 000 ha on 11 August 2005, aiming to create aforest corridor along the river linking 7 Virgin JungleForest Reserves (VJFRs) totalling approximately15 000 ha, and state and private lands (about 10 000 ha)currently under forest cover (Fig. 1; Ancrenaz et al.2004). Ancrenaz et al. (2004) estimated that the forestin the Lower Kinabatangan floodplain comprisedapproximately 52 000 ha in 2001, of which 41 000 hawere judged potentially suitable for orang-utans by asubsequent aerial survey. This study, using bothground and helicopter-based surveys, estimated 1125(range: 686–1883) orang-utans in the area, comprising670 (394–1158) in the LKWS, 228 (153–351) in VJFRsand 227 (139–374) in non-protected forest connectedeither to the LKWS or to the forest reserves.
The Kinabatangan population can no longer be con-sidered a single unit in its current form (Lackman-An-crenaz et al. 2001). To estimate population sizes, Ancre-naz et al. (2004) designated 11 ‘primary sampling units’(PSUs), where each PSU comprised one lot of the sanc-tuary and connected forests, irrespective of their ad-ministrative status (VJFR, private or state land, Fig. 1).Two PSUs were designated for Lot 10, since it is dividedinto 2 separate forest patches. The authors then carriedout line transect nest surveys (4 to 28 PSU–1; Ancrenazet al. 2004). Forest type within each PSU was classifiedaccording to the level of disturbance: heavily disturbed,slightly disturbed and undisturbed. Orang-utan densi-ties were then estimated from nest densities (Ancrenaz
250

Bruford et al.: Metapopulation viability in orang-utans
et al. 2004, their Table 2) using the software Distancev3.5. The 11 PSUs were grouped into 9 sampled popu-lations by Goossens et al. (2005, 2006a,b) correspond-ing to sampling units (S1 to S9).
Molecular analysis using microsatellite genotypesfrom faecal DNA of 200 individuals sampled from allregions of the LKWS (Goossens et al. 2000) confirmedthe signature of a demographic decline of 2 orders ofmagnitude over the last 200 yr (Goossens et al. 2006a).Although estimates of genetic diversity were superfi-cially high (e.g. an expected heterozygosity of 0.74;Goossens et al. 2005), evidence was found for signifi-cant genetic differentiation between most PSUs (aver-age FST 0.04, p < 0.001) and was significantly higheracross the Kinabatangan River than on the same riverside (Goossens et al. 2005). Bayesian migration esti-mates and assignment tests indicated that gene flowwas highly unlikely to occur across the river. In con-trast, migration between lots on the same side of theriver had a high probability, indicating that orang-utans recently moved relatively freely between neigh-
bouring areas, consistent with the recent history of log-ging and subsequent oil palm agriculture since the1970s and 1980s.
We analysed molecular and demographic data usingthe stochastic population modelling program VORTEX(v 9.61, Miller & Lacy 2005, Lacy et al. 2005) to modelthe Lower Kinabatangan population using parametervalues derived from observation and research in LKWS(e.g. Ancrenaz et al. 2004), from a previous orang-utanworkshop carried out at in Kota Kinabalu, Malaysia, inAugust 2003 (Ancrenaz 2003) and an orang-utanpopulation and habitat viability assessment (PHVA)carried out in Jakarta, Indonesia, in January 2004 (Sin-gleton et al. 2004; Appendix 1). During the latter work-shop, 1 of the 2 modelling working groups focused onthe Bornean orang-utan, which has markedly distinctlife history parameters from the Sumatran species.Much of our data are collated from this exercise. Theapproach was to derive a baseline model for a ‘typical’Bornean orang-utan population based on the consen-sus data for the 2004 meeting (Singleton et al. 2004).
251
Fig. 1. Kinabatangan region and the 11 primary sampling units (PSUs). Values indicate mean no. of orang-utans estimated tooccur in the respective PSUs in 2004 (range in parantheses). Reprinted from Ancrenaz et al. (2004a), with permission from
Cambridge University Press

Endang Species Res 12: 249–261, 2010
General parameters of the model. One thousandsimulations were carried out for each model, andresults were compared for the following time periods:(1) 25 yr, which corresponds to between 1 and 3 orang-utan generation times (depending on the estimateused) and a potential timescale for a short-term man-agement plan; (2) 100 yr, equivalent to 4 to 12 genera-tions; and (3) a long-term period of 250 yr, equivalentto 10 to 30 orang-utan generations. General parame-ters used, are not detailed here, can be found inAppendix 1.
Inbreeding depression was incorporated into somemodels using a lethal equivalents estimate of 4.06genome–1 derived from captive orang-utan data (Sin-gleton et al. 2004), and environmental variance inreproduction was not correlated to that of survival.Two types of catastrophe were modelled (Appendix 1)to reflect El Niño-induced severe drought events andoccasional human–orang-utan conflict due to cropraiding. Hunting and further habitat loss due to humanencroachment were not modelled, although small-scale illegal logging and land conversion on privateplots remain periodic issues in the Kinabatangan.
Since the orang-utan population in LKWS is atextremely high density in some PSUs (Ancrenaz et al.2004), we modelled density-dependent reproduction.The equation that VORTEX uses to model densitydependence is (after Lacy et al. 2005):
(1)
where P(N) is the percent of females that breed whenthe population size is N, P(K) is the percent that breedwhen the population is at carrying capacity K, and P(0)is the percent of females breeding when the popula-tion is close to 0 in the absence of any Allee effect. A isthe magnitude of the Allee effect, and is equivalent tothe population size where the percentage of femalesbreeding is 50% of what it would be in the absence ofsuch an effect (Lacy et al. 2005). The exponent B deter-mines the shape of the curve relating the percentbreeding to population size. If B = 1, the percent breed-ing changes linearly with population size. If B = 2, P(N)is a quadratic function of N. In the absence of detailedobservational data, we used the latter exponent (B = 2)for all simulations. The Allee parameter was not used,since the PSUs are relatively small in size, and orang-utans can locate potential mates even at low densities.We modelled the proportion of females breeding at lowdensity as 18% (equivalent to an inter-birth interval of5 to 6 yr, as observed in the LKWS) and at high densityas 12.5% (equivalent to an inter-birth interval of 8 yr,an extreme value for the Kinabatangan).
The population age distribution was estimatedaccording to the results of 71 river sightings where
broad age/sex designations were possible, madebetween 1999 and 2001 (Appendix 1) adjusted for therelative lack of visibility of juveniles. The proportion ofadult males:females at 2.42:1 is highly unusual for aprimate and has not been reported previously fororang-utans, but here was observed both using riversighting data and a detailed demographic census of astudy site within Lot 2 of the LKWS (Ancrenaz et al.2004). It is possible that this adult sex ratio imbalancereflects sex-biased dispersal rates into the lots fromsuboptimal habitat in the recent past or when the pop-ulation first became fragmented. We modelled 100%of adult males as potential breeders, since Goossens etal. (2006b) found that both large males possessing sec-ondary sexual characters and small males lacking suchcharacters were successful breeders in the Kinabatan-gan, confirming the results of Utami et al. (2002) onSumatran orang-utans.
Population-specific parameters. Mortality andreproduction parameters were derived from the dataof Singleton et al. (2004) and in the absence of PSU-specific data were applied equally to all PSUs. Theonly population-specific parameters specified in themodel were population size (mean estimates fromAncrenaz et al. 2004) and initial carrying capacity,adjusted from Ancrenaz (2003), who used maximumobserved density multipliers for well-defined habitattypes where the area of each was characterised foreach PSU. Some parameters, such as age-specific mor-tality and its environmental variation, are unlikely tobe accurate for all PSUs because field researchers inBorneo have recorded very few deaths. The 3 mortalityschedules that were tested by Singleton et al. (2004)did not differentiate mortality rates between differentjuvenile and subadult age classes or between sexes.We refined these estimates based on observations overa 10 yr period in PSU 2 (M. Ancrenaz et al. unpubl.data), specifically focusing on refining the estimates forjuveniles and dispersing-age subadults. Our mortalityestimates are more conservative than previous models.Adjustments were made primarily to reflect relativedegradation of the same habitat in each PSU (Ancre-naz et al. 2004). Prior to adjustment, for all LKWS lots,state and private land in PSUs 1 and 2, which are largeand equivalent in quality and can support very highdensities of orang-utans (up to 6 km–2, the highest everrecorded; Ancrenaz et al. 2004), we used a carryingcapacity of 6.5 km–2. For all VJFRs, which comprisemostly limestone primary forest, which supports alower density of orang-utans (maximum recordedmean 3.8 km–2 for Gomatong VJFR; Ancrenaz et al.2004), we used a K value of 4.5 km–2.
Model design. Models were designed to test thegenetic and demographic consequences of the follow-ing management approaches.
P N P P P KNK
NN A
B
( ) ( ( ) – [( ( ) – ( )) ])= ( ) +0 0
252

Bruford et al.: Metapopulation viability in orang-utans
(1) No intervention: PSUs were modelled as sepa-rate demographic units for the duration of the simula-tions. No translocations were modelled and the carry-ing capacity of the PSUs was kept constant.
(2) Managed translocations — frequency: a singleadult female was modelled as being non-reciprocallytranslocated once every 10, 20 or 50 yr from PSU 2 toboth PSUs 4 and 7 and from PSU 5 to PSUs 8, 10 and 11(north of the river) and for the south side of the river,from PSU 1 to PSUs 3, 6 and 9. The choice of the sourcepopulations was made on the basis of their current sizeand location.
(3) Corridors: here we simulated the effects of notranslocation but a gradual increase in carrying capac-ity (0.1 to 2% per annum, depending on the area of thePSU, its distance from its nearest neighbour and con-straints such as rivers and roads, see Appendix 1) tosimulate the effects of forest corridors. We conser-vatively modelled these to establish over 100 yr (PSUs4 to 5 and 5 to 7 and PSUs 1 to 3) or 250 yr (the remain-der). Once connected, a conservative value for inter-PSU dispersal of 5% of adults per annum was as-sumed, due to the philopatric nature of both males andfemales in this population (Goossens et al. 2006b).
(4) Mixed approach: To assess synergistic effectsbetween approaches 2 and 3, we simulated a mixedstrategy, where we modelled corridor development asin 3, but included translocation of 1 adult female every20 yr described in 2.
All models were simulated both with and withoutinbreeding depression to assess the effects of geneticload on population viability. We report results for thefollowing parameters: mean probability of extinction(proportion of simulations that reached a populationsize of 0), mean final population size, mean gene diver-sity (heterozygosity expected under Hardy-Weinbergequilibrium), mean inbreeding coefficient and themean level of genetic differentiation between PSUs(estimated as Wright’s FST). The last 3 values were cal-culated using the mean of 20 randomly chosen outputfiles generated by each simulation (using the geneticanalysis subroutine) and subsequently analysed usingGenepop v3.4 (Raymond & Rousset 1995).
RESULTS
No intervention
When taking into account the possibility of inbreed-ing depression, the ‘no intervention’ models predictednegative growth rates in almost all models and geneticstability (maintenance of ≥95% of extant gene diver-sity) over 250 yr for only 3 of the 11 PSUs (1, 2 and 5with 0.954, 0.967 and 0.966 respectively, Table 1).
Models incorporating inbreeding depression are likelyto be the more realistic given the now low likelihood ofdispersal among PSUs in the absence of managedtranslocation or habitat corridors linking them. Extinc-tion probabilities after 250 yr of ≥5% were predictedfor 4 PSUs (7, 8, 9, 10 with 0.122, 0.076, 0.079, 0.349,respectively) under models excluding inbreedingdepression and for 6 PSUs (4, 6, 7, 8, 9, 10 with 0.054,0.123, 0.388, 0.275, 0.276, 0.706, respectively) for mod-els including inbreeding depression. PSU 10 also had a≥5% extinction probability after 100 yr with and with-out inbreeding depression (0.069, 0.091, respectively).Inbreeding coefficients after 250 yr ranged from 0.026(PSU 5, incorporating inbreeding depression) to 0.299(PSU 10, excluding inbreeding depression; Table 1).Furthermore, mean final population size decreased in7 of 11 PSUs when inbreeding depression was notincluded and in 9 of 11 PSUs when inbreeding wasincluded (Table 1). Genetic differentiation amongPSUs after 250 yr (Table 2), as estimated by Wright’sFST, increased over present-day values and was signif-icant in all 55 pairwise comparisons, ranging from0.044 (PSU 5 versus PSU 11) to 0.455 (PSU 6 versusPSU 10; see Table S1a in the supplement for equi-valent values at 25 and 100 yr; available at www.int-res.com/articles/suppl/n012p249_supp_pdf). Signifi-cant differentiation among PSUs is also a feature ofthe present-day microsatellite marker dataset (seeGoossens et al. 2005); however, the highest observedpairwise value was 0.12, with the average being 0.04over all comparisons and 0.02 among populations fromthe same side of the river. These simulations thereforepredict a major increase in genetic differentiation.
Managed translocations
We analysed the effects of translocation frequencyon genetic diversity and demographic stability choos-ing females as the translocated sex, since, as all adultmales are potential breeders (Goossens et al. 2006b),the sex of translocated individuals made minimal dif-ferences to model outcomes (data not shown). Asexpected for regularly augmented populations, ex-pected gene diversity values were generally higherthan for the ‘no intervention’ model, and no pairwisecomparison showed a higher predicted gene diversityfor the ‘no intervention’ model after 250 yr (Table 1,Table S2 available at www.int-res.com/articles/suppl/n012p249_supp_pdf).
The predicted probability of extinction (P[E]) after250 yr was <0.01 for all scenarios except for the PSU 10for the 1 translocation every 50 yr scenario (P[E] =0.12), for PSU 9 for the same translocation regime(P[E] = 0.03) and for PSU 1 (donor population) in the
253

Endang Species Res 12: 249–261, 2010
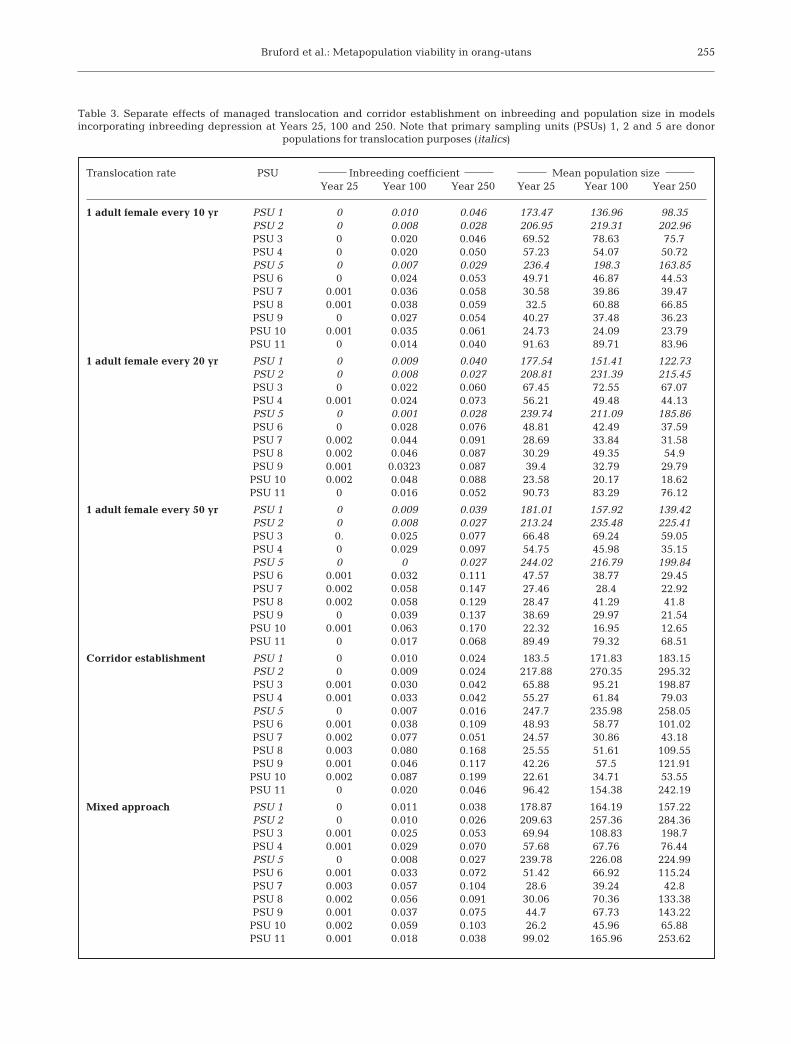
1translocation every 10 yr scenario (P[E] = 0.02). Whencomparing the predicted mean final population size formodels incorporating inbreeding depression (Tables 1& 3) an increase for recipient populations of 82.21 ±34.53% (SD) for 1 female every 10 yr, 53 ± 21.63% for1 female every 20 yr and 11.87 ± 5.8% for 1 female
every 50 yr was recorded. However, this was accompa-nied by a concomitant donor population decline of27.71 ± 17.68%, 10.92 ± 6.2% and 1.88 ± 1.75%,respectively. Within-population inbreeding coeffi-cients after 250 yr simulations were reduced in allrecipient populations when compared to the no-inter-
254
PSU Carrying Mean SD P(E) after Initial/mean SD Retained GD after Mean F after Mean capacity (r) 25/100/250 yr final pop size 25/100/250 yr 25/100/250 yr TE
Without inbreeding depressionPSU 1 230 –0.001 0.037 0/0/0 230/157.7 27.33 0.994/0.981/0.954 0/0.010/0.036 0PSU 2 351 0.001 0.035 0/0/0 209/245.02 39.15 0.994/0.985/0.967 0/0.009/0.023 0PSU 3 108 0 0.045 0/0/0.001 63/71.48 17.24 0.980/0.949/0.889 0.001/0.030/0.098 0PSU 4 72 –0.001 0.051 0/0/0.017 61/44.36 14.1 0.977/0.933/0.837 0.001/0.037/0.131 192.2PSU 5 313 –0.001 0.036 0/0/0 293/218.63 36.51 0.995/0.986/0.966 0/0.008/0.027 0PSU 6 62 –0.002 0.054 0/0.029/0.036 55/37.72 12.52 0.976/0.923/0.808 0.001/0.041/0.150 187.8PSU 7 54 0 0.063 0/0.019/0.122 23/30.93 11.55 0.947/0.964/0.732 0.003/0.080/0.216 149.5PSU 8 97 0.003 0.056 0/0.022/0.076 22/58.41 19.12 0.946/0.878/0.796 0.003/0.079/0.174 137.5PSU 9 49 –0.003 0.06 0/0.006/0.079 49/28.45 10.91 0.971/0.900/0.760 0.001/0.052/0.204 185.2PSU 10 31 –0.003 0.075 0/0.069/0.349 23/17.13 7.48 0.944/0.827/0.628 0.002/0.089/0.299 152.8PSU 11 120 –0.001 0.043 0/0/0 97/79.02 19.33 0.987/0.966/0.906 0.001/0.021/0.076 0
Including inbreeding depressionPSU 1 230 –0.002 0.037 0/0/0 230/144.39 30.32 0.994/0.981/0.952 0/0.009/0.036 0PSU 2 351 0 0.035 0/0/0 209/227.16 39.45 0.994/0.985/0.966 0/0.008/0.026 0PSU 3 108 –0.001 0.046 0/0/0.016 63/52.84 19.55 0.980/0.949/0.874 0.001/0.025/0.097 216PSU 4 72 –0.004 0.054 0/0.001/0.068 61/30.43 14.61 0.979/0.933/0.808 0.001/0.030/0.133 198.1PSU 5 313 –0.001 0.036 0/0/0 293/203.83 38.07 1.000/0.986/0.965 0/0.006/0.026 0PSU 6 62 –0.005 0.058 0/ 0.005/0.123 55/24.37 12.16 0.976/0.923/0.780 0.001/0.039/0.155 197.4PSU 7 54 –0.004 0.069 0/0.032/0.388 23/18.97 10.53 0.947/0.963/0.702 0.002/0.069/0.213 173.8PSU 8 97 –0.002 0.063 0/0.038/0.275 22/33.37 19.31 0.946/0.872/0.762 0.002/0.065/0.161 167.4PSU 9 49 –0.006 0.065 0/0.008/0.274 49/18.1 10.17 0.971/0.900/0.726 0.001/0.050/0.189 194.1PSU 10 31 –0.008 0.08 0/0.091/0.706 23/10.16 6.37 0.944/0.874/0.611 0.002/0.080/0.288 164.2PSU 11 120 –0.002 0.043 0/0/0.004 97/64.03 20.89 0.987/0.966/0.897 0.002/0.020/0.076 203.8
Table 1. Basic demographic and genetic parameters for all primary sampling units (PSUs) of the Lower Kinabatangan Wild-life Sanctuary after 25, 100 and 250 yr under a non-intervention management scenario. Means are of 1000 simulations.
P(E): probability of extinction; pop: population; GD: genetic diversity; TE: time to extinction
PSU 1 PSU 2 PSU 3 PSU 4 PSU 5 PSU 6 PSU 7 PSU 8 PSU 9 PSU 10 PSU 11
PSU 1 0.051 0.029 0.056 0.040 0.015 0.040 0.075 0.022 0.045 0.045PSU 2 0.087 0.074 0.038 0.014 0.037 0.014 0.022 0.061 0.042 0.042PSU 3 0.124 0.124 0.092 0.067 0.028 0.067 0.120 0.027 0.079 0.079PSU 4 0.194 0.128 0.222 0.013 0.046 0.013 0.029 0.065 0.019 0.019PSU 5 0.072 0.041 0.102 0.114 0.028 – 0.014 0.054 0.015 0.015PSU 6 0.133 0.130 0.095 0.208 0.121 0.028 0.049 0.018 0.033 0.033PSU 7 0.180 0.212 0.258 0.241 0.159 0.236 0.029 0.065 0.019 0.019PSU 8 0.196 0.158 0.324 0.252 0.133 0.229 0.266 0.079 0.020 0.020PSU 9 0.188 0.202 0.199 0.287 0.221 0.247 0.331 0.301 0.038 0.038PSU 10 0.235 0.227 0.302 0.313 0.207 0.455 0.308 0.363 0.411 –PSU 11 0.069 0.074 0.122 0.142 0.044 0.188 0.154 0.209 0.314 0.270
Table 2. Wright’s FST values in 2001 (above diagonal) and values predicted after 250 yr (below diagonal) for the non-interventionmodel. Simulation results, estimated using Genepop v3.4, are the means of 20 randomly chosen surviving simulations. Predictedvalues at Years 25 and 100 in the model are displayed in Table S1a in the supplement available at www.int-res.com/articles/suppl/n012p249_supp.pdf. The 2001 data (taken from Goossens et al. 2005) combine primary sampling units (PSUs) 5 and 7 andPSUs 10 and 11: identical allele frequencies were therefore allocated to combined PSUs for simulation purposes. All comparisonsin the present-day data set were significant at the 5% level or less except PSU 2 versus 8; PSUs 5 and 7 versus 8; and PSUs 10 and
11 versus 8. All values for the simulated models were significant at the 5% level or less
Bruford et al.: Metapopulation viability in orang-utans 255
Translocation rate PSU Inbreeding coefficient Mean population sizeYear 25 Year 100 Year 250 Year 25 Year 100 Year 250
1 adult female every 10 yr PSU 1 0 0.010 0.046 173.47 136.96 98.35PSU 2 0 0.008 0.028 206.95 219.31 202.96PSU 3 0 0.020 0.046 69.52 78.63 75.7PSU 4 0 0.020 0.050 57.23 54.07 50.72PSU 5 0 0.007 0.029 236.4 198.3 163.85PSU 6 0 0.024 0.053 49.71 46.87 44.53PSU 7 0.001 0.036 0.058 30.58 39.86 39.47PSU 8 0.001 0.038 0.059 32.5 60.88 66.85PSU 9 0 0.027 0.054 40.27 37.48 36.23PSU 10 0.001 0.035 0.061 24.73 24.09 23.79PSU 11 0 0.014 0.040 91.63 89.71 83.96
1 adult female every 20 yr PSU 1 0 0.009 0.040 177.54 151.41 122.73PSU 2 0 0.008 0.027 208.81 231.39 215.45PSU 3 0 0.022 0.060 67.45 72.55 67.07PSU 4 0.001 0.024 0.073 56.21 49.48 44.13PSU 5 0 0.001 0.028 239.74 211.09 185.86PSU 6 0 0.028 0.076 48.81 42.49 37.59PSU 7 0.002 0.044 0.091 28.69 33.84 31.58PSU 8 0.002 0.046 0.087 30.29 49.35 54.9PSU 9 0.001 0.0323 0.087 39.4 32.79 29.79PSU 10 0.002 0.048 0.088 23.58 20.17 18.62PSU 11 0 0.016 0.052 90.73 83.29 76.12
1 adult female every 50 yr PSU 1 0 0.009 0.039 181.01 157.92 139.42PSU 2 0 0.008 0.027 213.24 235.48 225.41PSU 3 0. 0.025 0.077 66.48 69.24 59.05PSU 4 0 0.029 0.097 54.75 45.98 35.15PSU 5 0 0 0.027 244.02 216.79 199.84PSU 6 0.001 0.032 0.111 47.57 38.77 29.45PSU 7 0.002 0.058 0.147 27.46 28.4 22.92PSU 8 0.002 0.058 0.129 28.47 41.29 41.8PSU 9 0 0.039 0.137 38.69 29.97 21.54PSU 10 0.001 0.063 0.170 22.32 16.95 12.65PSU 11 0 0.017 0.068 89.49 79.32 68.51
Corridor establishment PSU 1 0 0.010 0.024 183.5 171.83 183.15PSU 2 0 0.009 0.024 217.88 270.35 295.32PSU 3 0.001 0.030 0.042 65.88 95.21 198.87PSU 4 0.001 0.033 0.042 55.27 61.84 79.03PSU 5 0 0.007 0.016 247.7 235.98 258.05PSU 6 0.001 0.038 0.109 48.93 58.77 101.02PSU 7 0.002 0.077 0.051 24.57 30.86 43.18PSU 8 0.003 0.080 0.168 25.55 51.61 109.55PSU 9 0.001 0.046 0.117 42.26 57.5 121.91PSU 10 0.002 0.087 0.199 22.61 34.71 53.55PSU 11 0 0.020 0.046 96.42 154.38 242.19
Mixed approach PSU 1 0 0.011 0.038 178.87 164.19 157.22PSU 2 0 0.010 0.026 209.63 257.36 284.36PSU 3 0.001 0.025 0.053 69.94 108.83 198.7PSU 4 0.001 0.029 0.070 57.68 67.76 76.44PSU 5 0 0.008 0.027 239.78 226.08 224.99PSU 6 0.001 0.033 0.072 51.42 66.92 115.24PSU 7 0.003 0.057 0.104 28.6 39.24 42.8PSU 8 0.002 0.056 0.091 30.06 70.36 133.38PSU 9 0.001 0.037 0.075 44.7 67.73 143.22PSU 10 0.002 0.059 0.103 26.2 45.96 65.88PSU 11 0.001 0.018 0.038 99.02 165.96 253.62
Table 3. Separate effects of managed translocation and corridor establishment on inbreeding and population size in modelsincorporating inbreeding depression at Years 25, 100 and 250. Note that primary sampling units (PSUs) 1, 2 and 5 are donor
populations for translocation purposes (italics)

Endang Species Res 12: 249–261, 2010
vention models (mean reductions for 1 female every10, 20 and 50 yr were 0.124 ± 0.078, 0.087 ± 0.056 and0.049 ± 0.034, respectively), and all population simula-tions for translocations every 10 and 20 yr producedinbreeding coefficients below 0.1. Inbreeding coeffi-cients for donor populations were unaffected, and evenin the 1 female every 10 yr translocation model, thepredicted increase after 250 yr compared to the no-intervention model was only 0.01 ± 0.008. Finally, allpredicted values of FST remained significantly differentfrom 0, even in the every 10 yr translocation model,ranging from 0.014 (PSU 5 versus PSU 11, 0.004 at25 yr; 0.009 at 100 yr; 0.014 at 250 yr) to 0.028 (PSU 2versus PSU 4, 0.038 at 25 yr; 0.033 at 100 yr, 0.028 at250 yr; Table S1b,c).
Corridors
For simplicity, corridor models simulated annualexpansions in carrying capacity such that adjacentPSUs 1 and 3, 4 and 5 and 5 and 7 would reconnectafter 100 yr, with the remainder reconnecting at thetermination of the model, after 250 yr (Appendix 1).Land purchase, forest matrix re-establishment rate,forest occupancy and usage by faunal populations areadditional parameters not considered in the model andso conservative projections were used: reconnectionsand subsequent gene flow could potentially occurmuch more rapidly. Trends in gene diversity (Table S2)were very similar to those found for the ‘no interven-tion’ models, with the exception of PSUs 1, 3, 4, 5 and7, where the demographic contact simulated at Year100 concomitantly resulted in an increase in diversity.For example, in simulations of PSU 7, gene diversitydeclined to 0.947 of its original value by Year 25, to0.939 by Year 100 and to 0.862 of its original value by
Year 250. While this decline is consistent, the finalvalue is considerably higher than the 0.732 observedfor the ‘no intervention’ model. Similar responses wereobserved for PSU 4 and PSU 3. In general, fewer simu-lations predicted extinction than in the no interventionmodel (Table S3 available at www.int-res.com/articles/suppl/n012p249_supp.pdf), although PSUs 8and 10 retained a >5% probability of extinction at250 yr (0.061 and 0.118, respectively). Table 3 showsthe results for inbreeding coefficient and mean finalpopulation size. For the PSUs where reconnection wasmodelled to occur at 100 yr, large genetic gains(decreases in inbreeding coefficient) were evident. Forexample, for PSU 4, the simulated inbreeding coeffi-cient after 250 yr was 0.042 as opposed to 0.133 pre-dicted in the no intervention inbreeding model (trend0.001 by Year 25; 0.033 by Year 100; 0.042 by Year 250)and similar gains were seen in PSU 7 (0.051 as opposedto 0.213). Fig. 2 shows the effect of corridor reconnec-tion on the inbreeding coefficient in PSUs 4, 5 and 7. Itis worth noting that the trend of increased inbreedingin PSU 7 is reversed at reconnection, in contrast to themore isolated PSUs 8 and 10, which were not modelledas reconnected until 250 yr. However, as Table 3shows, a combination of relative isolation and smallcurrent carrying capacity means that PSUs 6, 8, 9 and10 were still predicted to attain mean inbreeding coef-ficients >0.1 over the course of the 250 yr simulation.
For PSUs simulated to reconnect after 100 yr, theincreased carrying capacity led to a combined meanfinal population size for PSU 1 and PSU 3 of 382.02 (K =399 versus K = 338 for PSU 1 and PSU 3 currently) andto a mean combined value of 380.26 (K = 461 versus K =439) for PSUs 4, 5 and 7. Other PSUs were predicted torespond positively to the increase in carrying capacityover 250 yr, with a mean final population size for all10 PSUs of 1685.82 (K = 1913), an increase of 584 (53%)
256
Fig. 2. Effect of corridor connection on within-primary sampling unit (PSU) inbreeding coefficients. PSUs 4, 5 and 7 weremodelled to reconnect after 100 yr of the simulation; remaining PSUs were modelled to reconnect at 250 yr

Bruford et al.: Metapopulation viability in orang-utans
over the current population size and 88% of predictedcarrying capacity at the end of 250 yr. Trends in popu-lation size reflected changes in carrying capacity asso-ciated with corridor construction; for example, themost isolated PSU (9) showed an increase from 42.26(Year 25) to 57.5 (Year 100) and 121.91 (Year 250). Thelatter value represents an approximately 4-fold in-crease over the result predicted for the no intervention,no inbreeding model. Although all unconnected PSUsremained significantly differentiated (p < 0.05) whenFST values were estimated using Genepop v3.4, asexpected, the reconnection events for PSUs 3, 4 and 7produced lower pairwise FST values than the 100 yrvalues in all 3 comparisons (Table S1c).
Mixed approach
Since translocation and corridors are not mutuallyexclusive options for the sanctuary, a combination ofcorridor establishment and a realistic translocationprogram was modelled of 1 female every 20 yr. Genediversity trends at 25, 100 and 250 yr were equivalentto the ‘1 female every 20 yr’ model (Table 3; Table S2),with mean final genetic diversity being higher in 9 of11 PSUs. Mean final gene diversity was higher in allcases for the mixed model when compared with thecorridor establishment model (Table 3; Table S2). In allcases, under the mixed model, the mean final probabil-ity of extinction was <0.005. Although the predictedmean inbreeding coefficients in this scenario were<0.1 after 250 yr for all PSUs (Table 3), the SD over-lapped this value for PSUs 6, 8, 9 and 10. Table 3 showsthe results of this approach. In comparison to thetranslocation-only and corridor-only simulations, themixed simulation produced the highest mean finalpopulation size (1695), although this was not signifi-cantly higher than the corridors-only model. It alsoproduced the lowest mean final inbreeding coefficient(0.06322), although 2 PSUs (7 and 10) exceeded amean final inbreeding coefficient of 0.1 (0.104 and0.103, respectively), and this difference was not signif-icantly lower than the translocation-only model. Fur-thermore, despite the combination of gene-flow andpopulation size increase in the mixed model, all uncon-nected PSUs remained significantly differentiated atthe (p < 0.05) when FST was estimated from allele fre-quencies from 20 random simulations (Table S1d).
DISCUSSION
Despite the fact that several population viabilitymodels have previously been developed for orang-utans (Ancrenaz 2003, Singleton et al. 2004), there are
reasons for caution regarding the limitations of themodel used here. Firstly, a single demographic modelfor orang-utans does not encapsulate the diversity oflife history present within both currently recognisedspecies, and it has been suggested that a cline in sev-eral key traits (anatomical, behavioural and ecological)exists from Sumatra to the northern tip of Borneo (Wichet al. 2009). While there is an unusually high degree ofaccuracy for much of the life history data in this modeldue to the extensive field studies carried out in the Kin-abatangan, to date some elements of the model havebeen less easy to parameterise. Examples of these arethe effects of density dependence, the additional mor-tality and reproductive cost associated with El Niñoevents and the assumption of equal mortality andreproductive rates in different PSUs, given that somepopulations may act as demographic sources and oth-ers as demographic sinks. These are long-term para-meters which will take many years to accumulate —longer than many of the predicted extinction times forsome PSUs in this model. However, since much of thesensitivity analysis for many orang-utan parametershas previously been carried out by Singleton et al.(2004), their relative importance for the outcomes ofthe model was already known.
The results of the no-intervention model suggest thatthe genetic and demographic viability of a number ofsubpopulations would be seriously compromised overthe medium to long term, with up to 6 of 10 PSUs hav-ing a >5% probability of extinction assuming inbreed-ing depression using pedigree-determined lethalequivalents after the 250 yr simulation. The interactionbetween small population size, demographic isolationand the subsequent effects of genetic drift and in-breeding have been demonstrated in numerous stud-ies, although the empirical demonstration of theseproblems in wild great ape populations are absentfrom the literature to our knowledge. It is therefore amatter of debate as to whether inbreeding avoidancemechanisms (physiological, behavioural) may modifythe predicted outcomes of these models, which do notinclude disassortative mating as a function of inbreed-ing or relatedness. However, in the case of the moreisolated PSUs, if mating among relatives were to beavoided behaviourally, then such populations maybecome functionally extinct more rapidly than pre-dicted here, as mate choice would become increas-ingly limited over time. Such populations are alsoexpected to rapidly become genetically divergent (asseen in Table 2, where Wright’s FST values were, insome cases, predicted to become very large over thetime course of the simulation), and such a process maybe expected to result in increasing incompatibilityamong gene pools. Currently there is no evidence thatsuch genetic divergence impacts reproductive compat-
257

Endang Species Res 12: 249–261, 2010
ibility in this population, but natural demographic iso-lation between the populations north and south of theriver has already been demonstrated (Goossens et al.2005, Jalil et al. 2008), and conservative conservationmanagement would normally seek to maintain thisdemographic feature (indeed we recommend thatthese riverside populations be maintained as separateManagement Units as long as this is practically feasi-ble) given the significantly greater FST values amongriversides than within (Moritz 1994, Goossens et al.2005, Jalil et al. 2008).
If the very high extinction probabilities for some PSUs(especially 6 to 10; Table 1) would seem to suggest thatnon-interventive approaches are not a viable conserva-tion option, especially given the assumption of no car-rying capacity degradation over time for these smallforest patches, then the question arises as to what is themost efficient management approach from a biological,ecological, financial and logistical standpoint. For fi-nancial and logistical (and possibly biological) effi-ciency, translocation of individuals among PSUs or fromother sources is an attractive option. Because of thelong generation time in this species, relatively modesttranslocation frequencies could potentially provide sig-nificant demographic and genetic augmentation to re-cipient populations and may ameliorate the effects ofinbreeding and genetic drift within populations and ge-netic differentiation among them.
However, translocation as a management tool is notwithout risk. Evidence from other sites where rehabili-tants have been reintroduced into wild populationssuggests that it is a potentially successful approach(e.g. Utami et al. 2002), although data remain largelyuncollated. The impact on both source and sink popu-lations from the point of view of social structure, ani-mal health and accidents during translocation must beconsidered, and any reintroductions must comply withIUCN guidelines. The sex we chose to model fortranslocated individuals was female, largely becausethe genetic benefits of translocating females is pre-dicted to be the highest on average since femaleshave a lower reproductive skew (Utami et al. 2002,Goossens et al. 2006b).
A key element of such a management strategy is thatthere are viable demographic sources of potentialimmigrants for translocation. Here, we simulated theuse of the 3 largest PSUs as the source. The rationalefor this choice was based on practicalities of the situa-tion in the Kinabatangan area. We chose the largestpopulations, as they seemed the most obvious choicebut also because of their geographic location, whichmade them a natural choice to serve as sources toneighbouring populations. However, our simulationsshowed that 2 of these are expected to decrease demo-graphically even in the no intervention scenario (PSU 1
and PSU 5, Table 1). This result may have significantpractical implications, since it shows that large popula-tions may not always be the most likely to be demo-graphically stable. However, even if a population is notexpected to grow based on PHVA simulations, thereality of the local situation may still require this popu-lation to serve as a source, either because of its geo-graphic location or because it is large enough to sufferless from a decrease than smaller candidate sourcepopulations. However, in the Kinabatangan, othersolutions may also be feasible. For instance, individu-als rescued from plantations and human settlements inthe surrounding area over the coming years (a regularoccurrence) and from the rehabilitation centre atSepilok (Sandakan, Sabah) may provide an additionalsource of genetic and demographic stability.
Movement of individuals every 50 yr did not preventthe accumulation of significant amounts of inbreedingwithin the PSUs having the smallest carrying capacitybut the more frequent scenarios were more successfulat controlling inbreeding coefficients in these popula-tions. Interestingly, in no case did the model predict asubsequent lowering of FST values to that below thethreshold of significance, possibly due to the slowreproductive rate of females and the stronger samplingeffects in small populations. However, it is important tostress that the model used does not account for possi-ble genetic gains that would be obtained through thearrival of new immigrants. It has been demonstratedthat a few immigrant genomes can potentially have aprofound effect on the genetic diversity and fitness of asubpopulation (e.g. Keller et al. 1994, 2001, Saccheri &Brakefield 2002), either through disproportionatelyhigh reproductive success due to mate choice in favourof genome dissimilarity (which could not be modelledhere) or because the life history strategy of immigrantindividuals increases their lifetime reproductive suc-cess. Therefore, the models used here are likely tounderestimate the genetic gains of immigration both atthe level of within-population inbreeding and among-population genetic differentiation. However, a numberof problems exist with the utilisation of this manage-ment approach alone. First, it poses a substantialdemographic challenge to the donor populations,especially if, as here, there are 1 or 2 large populationsdonating to several or many small sink populations(e.g. PSU 1 in the 1 translocation every 10 yr scenariomodelled here). Second, it does not address the ongo-ing ecological issues associated with maintainingviable habitat over the period of the management plan.
Creation of habitat corridors and ecological restora-tion are regarded as 2 very important components oflong-term sustainable conservation management.However, they are sometimes extremely difficult tocarry out for logistical and financial reasons. Habitat
258

Bruford et al.: Metapopulation viability in orang-utans
corridors among PSUs of the LKWS are currentlyunder construction at small scales and so we consid-ered their potential impact on population demographicand genetic viability here. Many factors can influencethe timescale and demographic gains associated withforest corridor establishment, such as financial con-straints (land purchase), forest re-establishment rates(which are slow for high canopy dipterocarp forest butwhich can be much quicker for riparian and seasonallyinundated forest) and habitat occupancy and corridorusage dynamics by the faunal community, which couldin principle be almost instantaneous or could be a pro-tracted process. Since these factors are currentlyunknown, we took an extremely conservative ap-proach in terms of the timescales involved, and ourresults therefore need to be treated with caution, espe-cially considering the not inconsiderable difficultiesinvolved with creating connections across humanhabitation and roads (although artificial rope bridgesacross tributaries offer a potential solution at smallerscales). However, creating habitat corridors linking thesmaller PSUs upstream in the Kinabatangan will beextremely challenging and is unlikely to occur overshort timescales.
The demographic and genetic benefits of incremen-tal carrying capacity increases and genetic reconnec-tion are clear in those populations where populationsizes and carrying capacities are currently small andwhere the gains are proportionately highest (e.g.PSU 7, Fig. 2). The eventual reconnection of all PSUs tocreate a contiguous habitat corridor within the LKWSis a stated aim of the developing management plan forthe sanctuary. However, the final outcome will cru-cially depend on the speed at which reconnection cantake place. In our models we tried to use realistic sce-narios, which show clearly that for the most isolatedPSUs, corridor reconnection is unlikely to occur rapid-ly enough to prevent large-scale genetic and demo-graphic loss and alone may not be able to preventextinction in these important populations. If, as geneticevidence currently suggests (Jalil et al. 2008), the Kin-abatangan floodplain was originally colonised from theCrocker Range/Mt. Kinabalu massif when the lowlandforest re-established following the Pleistocene, thenthe upstream orang-utan populations, including thoseinside the sanctuary, are likely to possess the highestlevels of genetic diversity, and indeed Jalil et al. (2008)found some evidence for this with mitochondrial DNA.Thus, the upstream LKWS populations, althoughdemographically more limited, possess substantialunique genetic diversity which would be lost if theywent extinct.
Therefore, if neither translocation nor corridor estab-lishment alone are likely to solve all of the problems forthe populations within the sanctuary, a mixed ap-
proach may fulfil this role. Our mixed model identifiedthe most logistically feasible translocation program,which produced the biggest proportional change inresults as the 1 female every 20 yr scenario. In combi-nation with the corridor re-establishment scenario, thisapproach produced the largest mean final populationsize and the lowest mean inbreeding coefficient acrossthe LKWS and potentially provides both a realistic andeffective solution to the current orang-utan demo-graphic problem.
Much debate has occurred in the literature about thedemographic and genetic thresholds needed to createlong-term viable populations for conservation; how-ever, there is significant support for the so-called50:500 (effective population size:census size) rule as apragmatic approach to minimum viable population(MVP) conservation targeting. The current estimatedNe for PSUs 1 and 2 north and south of the river is 30(Goossens et al. 2006), producing an Ne:N ratio ofapproximately 1:7. Since the census size is estimated at728 on the north riverbank and 377 on the south river-bank, this could equate to an effective population sizeof approximately 100 north of the river and 50 south ofthe river, assuming an additive increase in Ne on eachriverside when all individuals are taken into consider-ation. Assuming that demographic gains from carryingcapacity augmentation and translocation brings a pro-portionate gain at the genetic level (and this could beeven more efficient if appropriately selected individu-als from outside the LKWS are used for demographicaugmentation), corridor reestablishment under theconditions modelled here is predicted to yield a carry-ing capacity of 1915, equivalent to an Ne of 273(approximately 180 north of the river and 90 south ofthe river). Although no simulations achieved 1915 overthe 250 yr term of the model, this may be due to theincremental dynamics of the corridor reestablishmentand could also reflect the slow demographic dynamicsof this species. Nonetheless, additional augmentationcould be used from outside the LKWS at strategicpoints to enable a population size of approximately2000 individuals to be attained and long-term demo-graphic viability to be secured.
Acknowledgements. We thank the Economic Planning Unitand especially P. Munirah for granting permission to carry outresearch in Sabah. This work was funded by the Darwin Ini-tiative for the Survival of Species (grant no. 09/016, DEFRA,UK), Cardiff University, Universiti Malaysia Sabah andHUTAN. Orang-utan hair and faeces were exported to the UKunder export permit from the Federation of Malaysia (CITESCertificate no. 0467, security stamp No. MY 9123707) andunder import permit from the UK (CITES Certificate nos.236719/01 for shed hair samples and 236719/02 for faecalsamples). This paper is dedicated to the memory of MohediAndau, whose inspiration and collaboration was key to theinception and execution of this project.
259

Endang Species Res 12: 249–261, 2010
LITERATURE CITED
Ancrenaz M (ed) (2003) Proceedings of the InternationalWorkshop on orang-utan in Sabah, 25–27 August 2003,Kota Kinabalu, Sabah
Ancrenaz M, Goossens B, Gimenez O, Sawang A, Lackman-Ancrenaz I (2004) Determination of ape distribution andpopulation size using ground and aerial surveys: a casestudy with orang-utans in lower Kinabatangan, Sabah,Malaysia. Anim Conserv 7:375–385
Asquith NM (2001) Misdirections in conservation biology.Conserv Biol 15:345–352
Bouchy P, Theodorou K, Couvet D (2005) Metapopulation via-bility: influence of migration. Conserv Genet 6:75–85
Bowen BW, Roman J (2005) Gaia’s handmaidens: the Orlogmodel for conservation biology. Conserv Biol 19:1037–1043
Frankham R (2003) Genetics and conservation biology. C RBiol 326 (Suppl 1):S22–S29
Goossens BG, Chikhi L, Utami SS, de Ruiter JR, Bruford MW(2000) Multiple-samples and multiple-extracts approachfor microsatellite analysis of faecal samples. ConservGenet 1:157–162
Goossens B, Chikhi L, Jalil MF, Ancrenaz M and others(2005) Patterns of genetic diversity and migration inincreasingly fragmented and declining orang-utan(Pongo pygmaeus) populations from Sabah, Malaysia.Mol Ecol 14:441–456
Goossens B, Chikhi L, Ancrenaz M, Lackman-Ancrenaz I,Andau P, Bruford MW (2006a) Genetic signature ofanthropogenic population collapse in orang-utans. PLoSBiol 4:e25
Goossens B, Setchell JM, James SS, Funk SM and others(2006b) Philopatry and reproductive success in Borneanorang-utans (Pongo pygmaeus). Mol Ecol 15:2577–2588
Jalil MF, Cable J, Sinyor J, Lackman-Ancrenaz I, AncrenazM, Bruford MW, Goossens B (2008) Riverine effects onmitochondrial structure of Bornean orang-utans (Pongopygmaeus) at two spatial scales. Mol Ecol 17:2898–2909
Keller LF, Waller DM (2002) Inbreeding effects in wild popu-lations. Trends Ecol Evol 17:230–241
Keller LF, Arcese P, Smith JNM, Hochachka WM, Stearns SC(1994) Selection against inbred song sparrows during anatural population bottleneck. Nature 372:356–357
Keller LF, Jeffery KJ, Arcese P, Beaumont MA, HochachkaWM, Smith JNM, Bruford MW (2001) Immigration and theephemerality of a natural population bottleneck: evidencefrom molecular markers. Proc Biol Sci 268:1387–1394
Keyghobadi N, Roland J, Matter SF, Strobeck C (2005)Among- and within-patch components of genetic diversityrespond at different rates to habitat fragmentation: anempirical demonstration. Proc Biol Sci 272:553–560
Lackman-Ancrenaz I, Ancrenaz M, Saburi R (2001). The Kin-abatangan orang-utan conservation project. The apes:
challenge for the 21st century. Conf Proc, 10–13 May2000, Brookfield, IL, p 262–265
Lacy RC, Borbat M, Pollak JP (2005) VORTEX: a stochasticsimulation of the extinction process.Version 9.50. ChicagoZoological Society, Brookfield, IL
Madsen T, Shine R, Olsson M, Wittzell H (1999) Restoration ofan inbred adder population. Nature 402:34–35
Madsen T, Ujvari B, Olsson M (2004) Novel genes continue toenhance population growth in adders (Vipera berus). BiolConserv 120:145–147
Miller PS, Lacy RC (2005) VORTEX: a stochastic simulation ofthe extinction process. Version 9.50 user’s manual. Con-servation Breeding Specialist Group (SSC/IUCN), AppleValley, MN
Moritz C (1994) Defining Evolutionary Significant Units forconservation. Trends Ecol Evol 9:373–375
Raymond M, Rousset F (1995) Genepop (version 1.2) — popu-lation genetics software for exact tests and ecumenicism.J Hered 86(3):248–249
Reed JM, Mills LS, Dunning JB, Menges ES and others (2002)Emerging issues in population viability analysis. ConservBiol 16:7–19
Robert A, Couvet D, Sarrazin F (2003) Bottlenecks in largepopulations: the effect of immigration on population via-bility. Evol Ecol 17:213–231
Saccheri IJ, Brakefield PM (2002) Rapid spread of immigrantgenomes into inbred populations. Proc R Soc Lond Ser BBiol Sci 269: 1073–1078
Saccheri I, Kuusaari M, Kankare M, Vikman P, Fortelius W,Hanski I (1998) Inbreeding and extinction in a butterflymetapopulation. Nature 392:491–494
Schwartz MK, Mills LS (2005) Gene flow after inbreedingleads to higher survival in deer mice. Biol Conserv 123:413–420
Singleton I, Wich S, Husson S, Stephens S and others (eds)(2004) Orangutan population and habitat viability assess-ment: final report. IUCN/SSC Conservation BreedingSpecialist Group, Apple Valley, MN
Stockwell CA, Hendry AP, Kinnison MT (2003) Contemporaryevolution meets conservation biology. Trends Ecol Evol18:94–101
Talbot SL, Pearce JM, Pierson BJ, Derksen DV, Scribner KT(2003) Molecular status of the dusky Canada goose(Branta canadensis occidentalis): a genetic assessment of atranslocation effort. Conserv Genet 4:367–381
Tallmon DA, Luikart G, Waples RS (2004) The alluring sim-plicity and complex reality of genetic rescue. Trends EcolEvol 19:489–496
Utami SS, Goossens B, Bruford MW, de Ruiter JR, van HooffJARAM (2002) Male bimaturism and reproductive successin Sumatran orang-utans. Behav Ecol 13(5):643–652
Wich SA, Utami Atmoko SS, Setia TM, van Schaik CP (2008)Orangutans: geographic variation in behavioural ecologyand conservation. Oxford University Press, Oxford
260

Bruford et al.: Metapopulation viability in orang-utans 261
Appendix 1. General parameter values for Lower Kinabatangan Wildlife Sanctuary orang-utans (based on Ancrenaz 2003,
Singleton et al. 2004). EV: environmental variance; N: population size; K: carrying capacity
• Extinction defined as no animals of 1 or both sexes• Inbreeding depression (where used): 4.06 lethal equi-
valents per genome (Singleton et al. 2004), 50% ofgenetic load contributed by lethals
• Natural dispersal not modelled• EV in mortality is concordant among age–sex classes, but
independent from EV in reproduction• Correlation of EV among populations = 1• First age of reproduction for females: 15 yr; for males:
18 yr• Maximum breeding age (senescence): 45 yr• Sex ratio at birth (percent males): 55• Polygynous mating• Percentage of adult males in the breeding pool = 100• Percentage of adult females breeding = {20.5 –[(20.5 – 10)
× (N/K)2]} × [N/(1+N)] = quadratic density dependencewith no Allee parameter (Singleton et al. 2004)
• Variance in percentage of adult females breeding: SD = 10• 100% of females produce 1 progeny• Percentage mortality of females between ages 0 and 1 = 5
(SD = 2.5); between ages 1 and 2 = 6 (3); between ages3 and 7 = 0.5 (0.25); between ages 8 and 10 = 6 (3);between ages 11 and 15 = 0.5 (0.25); between ages 16and 45 = 1.75 (0.88)
• Percentage mortality of males between ages 0 and 1 = 5(SD = 2.5); between ages 1 and 2 = 5 (2.5); betweenages 2 and 7 = 3 (1.5); between ages 8 and 10 = 6 (3);between ages 11 and 14 = 0.5 (0.25); between ages 15and 45 = 1.25 (0.63)
• Two catastrophes: adult mortality as a result of crop raid-ing (frequency: 17%; multiplicative effect on reproduc-tion = 1; multiplicative effect on survival = 0.98) andsevere drought (frequency: 8%; multiplicative effect onreproduction = 1; multiplicative effect on survival =0.965)
• Initial population size — see Ancrenaz et al. (2004), theirTable 2: primary sampling unit (PSU 1) = 230; PSU 2 =209; PSU 3 = 63; PSU 4 = 61; PSU 5 = 293; PSU 6 = 55;PSU 7 = 23; PSU 8 = 22; PSU 9 = 49; PSU 10 = 23; PSU11 = 97
• Age distribution from Ancrenaz (2003) on the basis of 71observations made by boat. Juveniles = 10% (50:50ratio); adult females = 26%; adult males lacking sec-ondary sexual characteristics = 27%; 37% ‘flanged’adult males. Individuals allocated evenly to differentages across all age classes and we assumed that‘unflanged’ males had the same age distribution as‘flanged’ males
• Carrying capacity (modified from Ancrenaz 2003 toreflect present field conditions): PSU 1 = 230; PSU 2 =351; PSU 3 = 108; PSU 4 = 72; PSU 5 = 313; PSU 6 = 62;PSU 7 = 54; PSU 8 = 97; PSU 9 = 49; PSU 10 = 31; PSU11 = 120
• Trend in carrying capacity for corridor models: PSU 1 =+0.1%; PSU 2 = +0.2%; PSU 3 = +0.8%; PSU 4 =+0.5%; PSU 5 = +0.1%; PSU 6 = +0.8%; PSU 7 =+0.1%; PSU 8 = +1%; PSU 9 = +1.6%; PSU 10 = +2%;PSU 11 = +2%
Editorial responsibility: Luigi Boitani,Rome, Italy
Submitted: August 10, 2009; Accepted: June 1, 2010Proofs received from author(s): October 10, 2010