promoting mathematical power for all students: an honest look at trends and tough issues related to...
Post on 18-Dec-2015
212 views
TRANSCRIPT

Promoting Mathematical Power for All Students:
An Honest Look at Trends and Tough Issues Related to Mathematics Instructional Reform
Sarah Theule LubienskiUniversity of Illinois

Outline1. Introduction
–National Council of Teachers of Mathematics (NCTM) Reforms
2. NAEP Trends 1990 - 2003
–What has happened to student achievement?
–Are the NCTM reforms reaching all students?
3. Two Studies on Students’ and Parents’ reactions to reforms
4. Conclusions/Challenges
What are the NCTM Reforms?
The National Council of Teachers of Mathematics released:1) Curriculum and Evaluation Standards (1989). 2) Teaching Standards (1991)3) Assessment Standards (1995)4) Principles and Standards for School Mathematics (2000)
The Standards Emphasize:More: Student reasoning, communicating, problem solving, & balance among five curricular strands (Geometry, Measurement, Algebra, Number, Prob/Stats), “Mathematical power for all”Less: Computation practice, Teacher-telling, memorization of rules with little understanding

Anyon (1980) found class differences in how students were being educated:
Upper-class schools: • Training for executives. • Emphasis on creativity, problem-solving, critical
thinking
Middle-class schools:• Training for middle-managers• Some problem-solving mixed with basic skills, social
skills, etc.
Working-class schools:• Training for followers -- good workers• Emphasis on basic skills, following instructions,
obeying authority
Why Mathematics Education is Particularly Important for Promoting Equity
Mathematics is a gatekeeper to high-status, high-paying jobs.
– For example, the American Association of University Women (1992) reported that women still make less than 70 cents for each dollar made by a man with a similar level of education, but that this difference is negated when women take at least eight credits of college mathematics.
In politics and business, mathematics is used to persuade the public.

What has happened to U.S. student
achievement in mathematics since the first NCTM Standards?
Our “National Test”: National Assessment of Educational Progress (NAEP)
Administered at 4th, 8th, and 12th grades
Main NAEP, Trend NAEP and State NAEP
Main NAEP Results 1990-2003:
1) Overall, achievement has significantly increased at 4th, 8th, and 12th grades.
2)
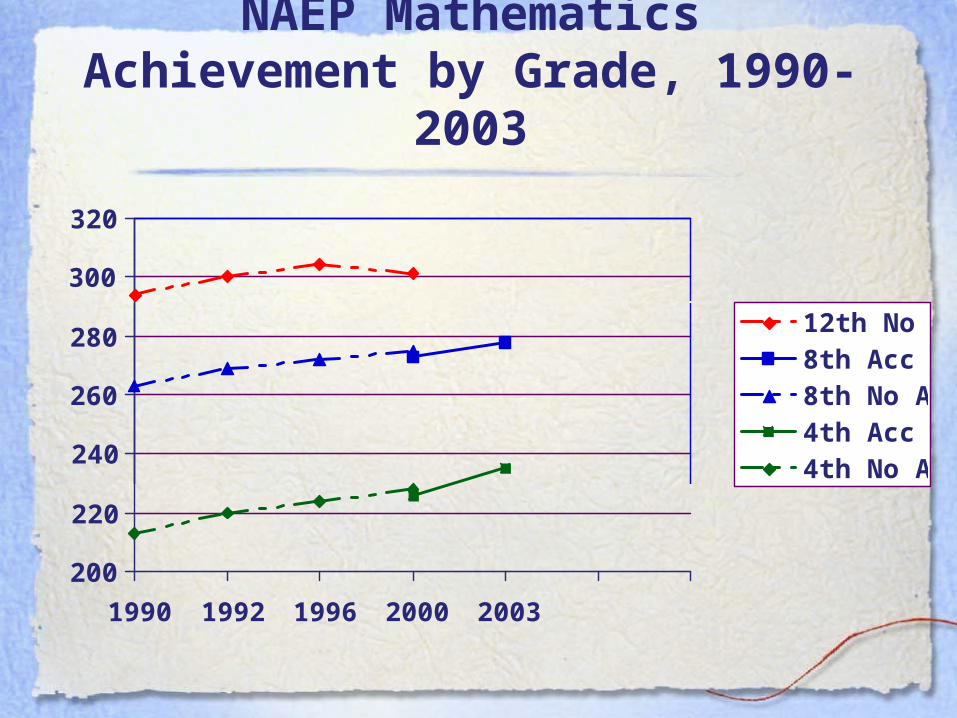
NAEP Mathematics Achievement by Grade, 1990-2003
200
220
240
260
280
300
320
1990 1992 1996 2000 2003
12th No Acc8th Acc8th No Acc4th Acc4th No Acc

What has happened to U.S. student
achievement in mathematics since the first NCTM Standards?
Our “National Test”: National Assessment of Educational Progress (NAEP)
Administered at 4th, 8th, and 12th grades
Main NAEP, Trend NAEP and State NAEP
Main NAEP Results 1990-2003:
1) Overall, achievement has significantly increased at 4th, 8th, and 12th grades.
2) SES and race-related gaps did not significantly change between 1990-2000. Some improvement 2000-2003.
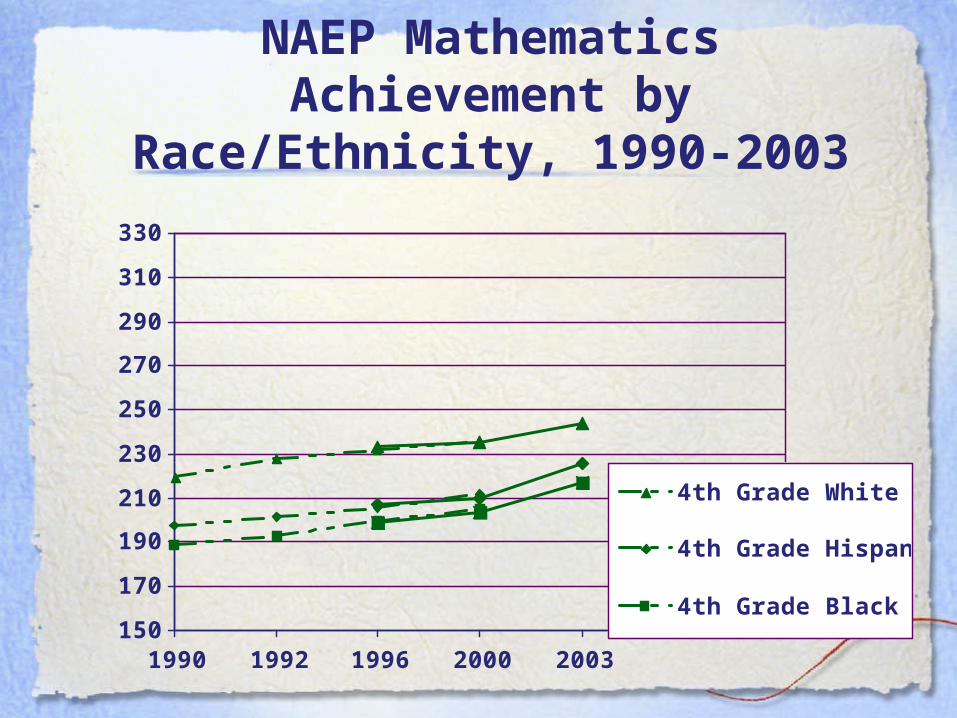
NAEP Mathematics Achievement by Race/Ethnicity, 1990-2003
150
170
190
210
230
250
270
290
310
330
1990 1992 1996 2000 2003
4th Grade White
4th Grade Hispanic
4th Grade Black

NAEP Mathematics Achievement by Race/Ethnicity, 1990-2003
150
170
190
210
230
250
270
290
310
330
1990 1992 1996 2000 2003
12th Grade White
12th Grade Hispanic
12th Grade Black
8th Grade White
8th Grade Hispanic
8th Grade Black
4th Grade White
4th Grade Hispanic
4th Grade Black
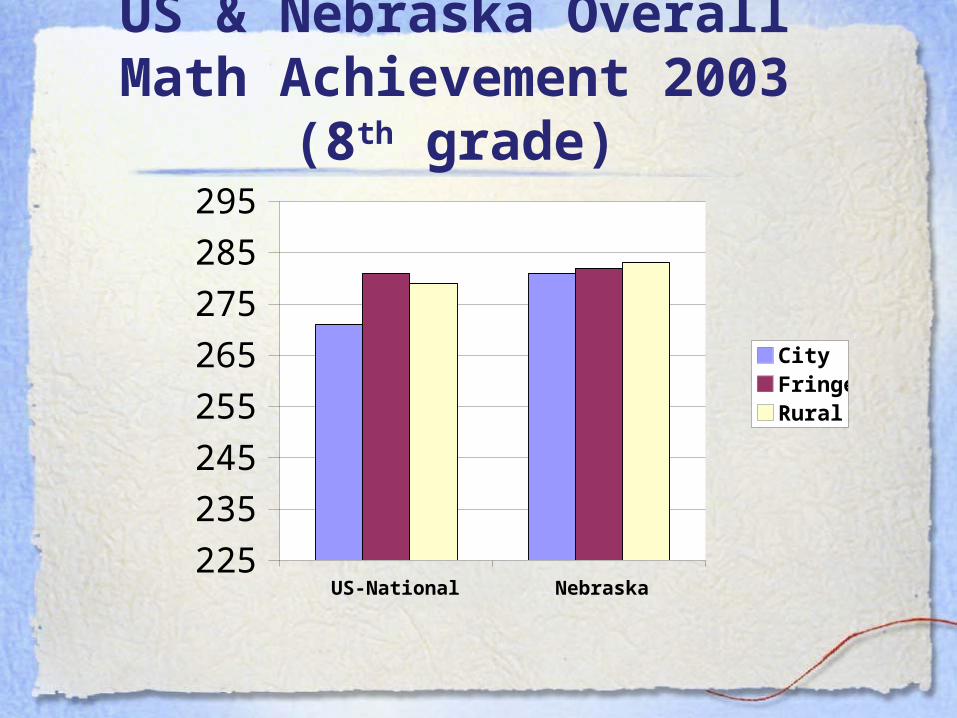
US & Nebraska Overall Math Achievement 2003 (8th grade)
225
235
245
255
265
275
285
295
US-National Nebraska
CityFringeRural
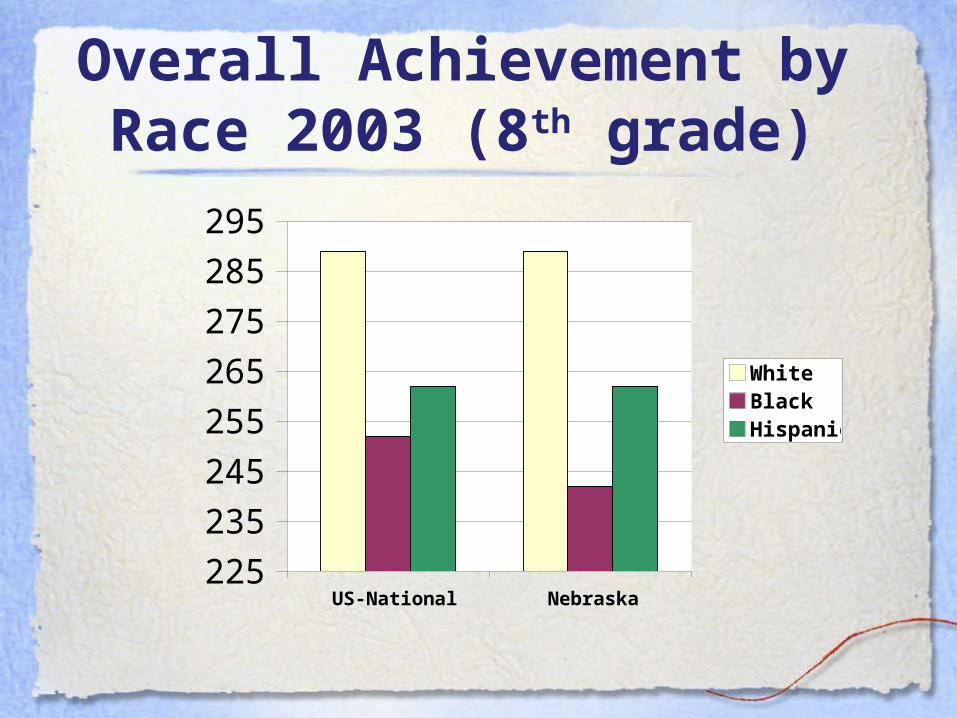
Overall Achievement by Race 2003 (8th grade)
225
235
245
255
265
275
285
295
US-National Nebraska
WhiteBlackHispanic

U.S. Hispanic-White Gaps by Mathematical Strand, 2003
0
10
20
30
40
Hispanic/WhiteGap
Hispanic/WhiteGap
4th Grade 8th Grade
Number
Data
Algebra
Geometry
Measurement
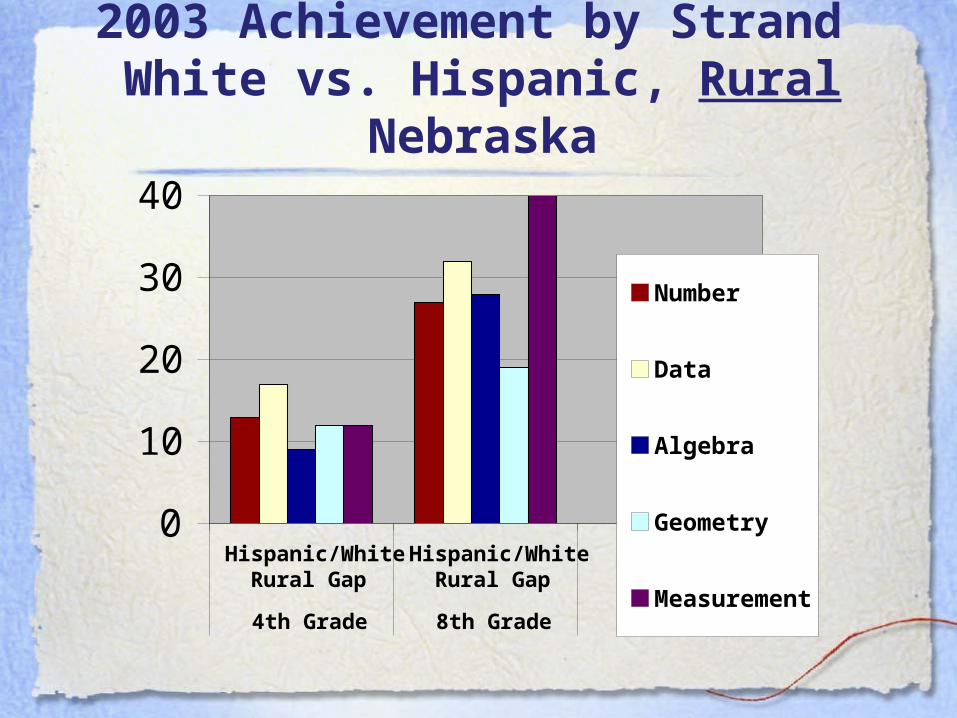
2003 Achievement by Strand White vs. Hispanic, Rural Nebraska
0
10
20
30
40
Hispanic/WhiteRural Gap
Hispanic/WhiteRural Gap
4th Grade 8th Grade
Number
Data
Algebra
Geometry
Measurement

Math Achievement by Race and Free/Reduced Lunch Eligibility, 2000
4th 8th 12th 2000 NAEP Scores
Lunch
No Lunch
Lunch No Lunch
Lunch No Lunch
White
221 (1.7) 18%
238 (1.1) 60%
270 (1.5) 14%
289 (1.0) 63%
294 (3.6) 5%
309 (1.3) 65%
Hispanic 205
(1.7) 59%
221 (2.7) 31%
246 (2.2) 53%
263 (2.4) 30%
277 (3.8) 37%
286 (2.8) 41%
Black
200 (1.6) 70%
219 (2.3) 22%
242 (1.6) 56%
255 (2.1) 28%
269 (2.1) 34%
275 (3.0) 43%

Mean Achievement by Race and SES Quartile, 2000
Fourth Grade Eighth Grade Twelfth Grade Lowest
SES Highest
SES
Lowest SES
Highest SES
Lowest SES
Highest SES
White
215
247
266
300
289
323
Hispanic 202
237
247
281
276
310
Black
198
228
242
270
267
292
What do NAEP data show about instruction?
Are the NCTM Standards reaching all students?

Percentage of Students Whose Teachers Reported Being at Least “Somewhat Knowledgeable” About the NCTM Standards
by Race & Lunch Eligibility, 2000 (not asked in 2003)
2000 4th Grade 8th Grade
White students 66 89
Hispanic Students 59 83
Black Students 64 85
Not eligible forfree/reducedlunch
68 89
Eligible forfree/reducedlunch
63 85

Similarities in Instruction
Teachers of Black and Hispanic studentswere at least as likely as teachers of Whitestudents to report:
- Using manipulatives- Access to computers- Using Ņreal lifeÓ problems- Having students work in groups- Spending time on math instruction- Emphasizing each of the 5 strands

1990-2000 Percentage of 8th Graders Whose Teachers Reported Their Students Use
Calculators “Almost Every Day,” by Race
010203040506070
1990 1996 2000
All White Students
All Hispanic Students
All Black Students
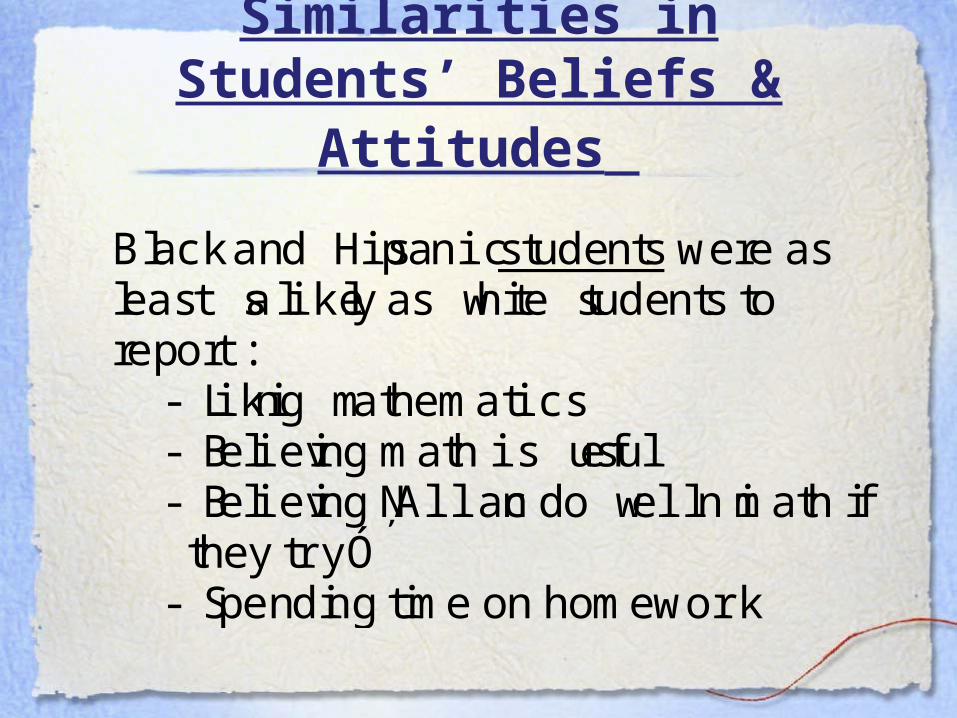
Similarities in Students’ Beliefs & Attitudes
Black and Hispanic students were asleast as likely as white students toreport:
- Liking mathematics- Believing math is useful- Believing ŅAll can do well in math if
they tryÓ- Spending time on homework
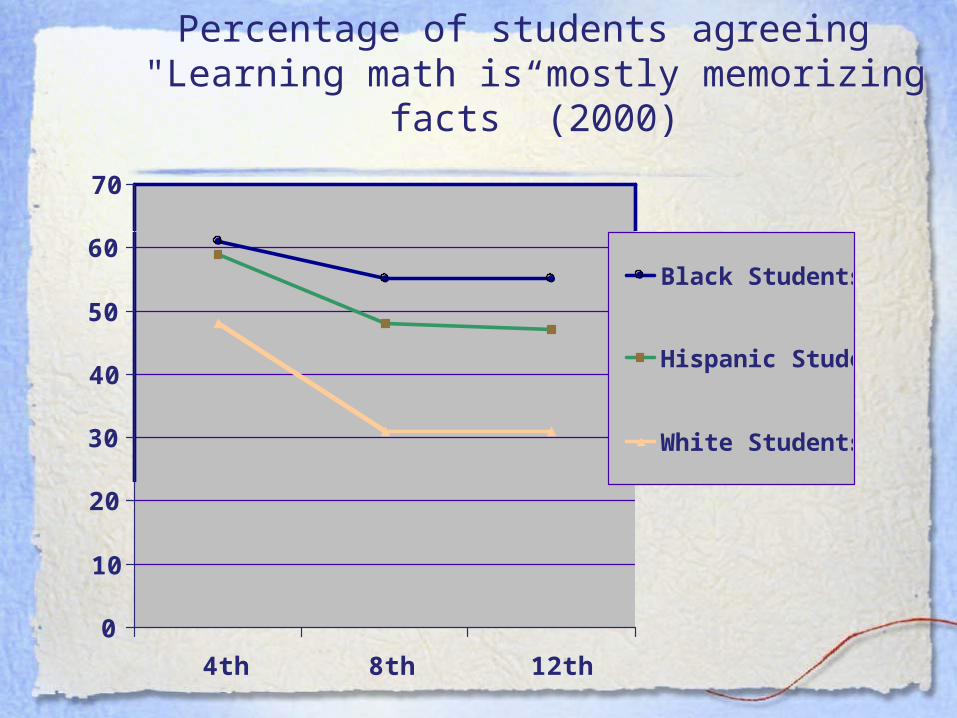
Percentage of students agreeing "Learning math is mostly memorizing facts” (2000)
0
10
20
30
40
50
60
70
4th 8th 12th
Black Students
Hispanic Students
White Students

Percentage of students agreeing "Learning math is mostly memorizing facts” (2000)
0
10
20
30
40
50
60
70
4th 8th 12th
Black Students
Hispanic Students
White Students
Lowest-SES Black St.
Lowest-SES Hispanic St.
Lowest-SES White St.
Highest-SES Black St.
Highest-SES Hispanic St.
Highest-SES White St.
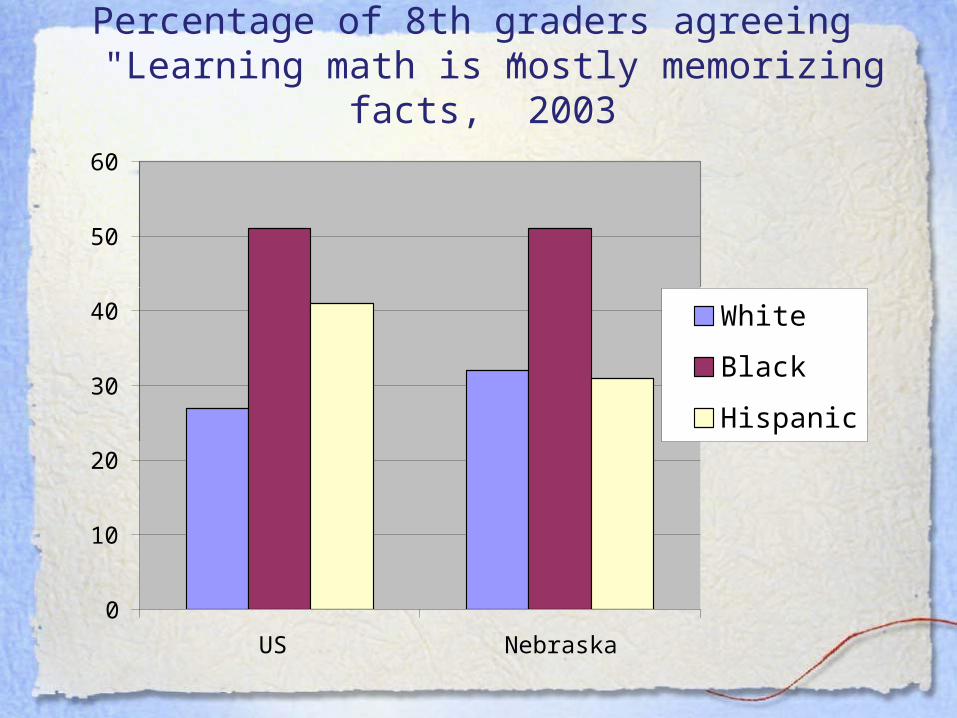
Percentage of 8th graders agreeing "Learning math is mostly memorizing facts,” 2003
0
10
20
30
40
50
60
US Nebraska
White
Black
Hispanic

An Examination of Other Possible Explanations for Achievement Differences
(2000 data)
Teacher Factors:• White 8th graders (80%) slightly more likely than Black or
Hispanic 8th graders (72%) to have a teacher certified in secondary mathematics.
• No significant differences in elementary certification at the 4th grade level.
• No significant differences in having teachers with graduate degrees.
Course Taking:Course taking appears to account for some achievement differences at 8th and 12th grade. However, large gaps remain within groups enrolled in the same courses (e.g., all 12th grade calculus students).
The Promise of Current Reforms
We are convinced that if students are exposed to the kinds of experiences outlined in the Standards, they will gain mathematical power. This term denotes an individual's abilities to explore, conjecture, and reason logically…[and the] development of personal self-confidence.
National Council of Teachers of Mathematics
Curriculum and Evaluation Standards, 1989, p. 5

Sounds good…
Will all benefit as intended?
Will achievement gaps narrow?
If we build it, will they come?

Two Studies that Point to Challenges
1) A study of low- and high-SES 7th graders’ experiences with a Standards-based curriculum and pedagogy.
2) A study of parents’ and students’ choices between Standards-based and traditional instruction at the high school level.
Study One:General Framing Question
Do lower- and higher-SES students experience and react to a "reformed" curriculum and pedagogy differently? If so, how?
What Brought Me To Asking This?• Writing and piloting NSF-funded, middle-school
mathematics curriculum
• My own working class background

Research Context At A Glance
Setting: Socio-economically diverse (but primarily white) middle school in mid-sized city
Curriculum:
Carefully sequenced problem-centered investigations
Pedagogy:
"Launch, explore, summarize" model
My Role: Pilot teacher, curriculum developer, researcher.

Data Collected
• Three sets of interviews• A variety of student surveys• Audio recordings of each lesson• Daily journal• Quizzes, tests, projects, homework• Parent survey to gather SES information

Socioeconomic Status (SES) in This Study
Indicators used to divide students into two, admittedly rough categories: lower and higher SES
• Parents' occupation • Education
• Income • Reading material in home
Total participating students in each category:
Higher-SESMales
Higher-SESFemales
Lower-SESMales
Lower-SESFemales
5 4 4 5

Two Themes
1) Authority/direction
2) Contextualization/abstraction
The first theme arose in relation to students’ experiences with the open nature of the problems and whole-class discussions.
The second theme arose specifically in relation to the contextualized nature of the “real world” problems.
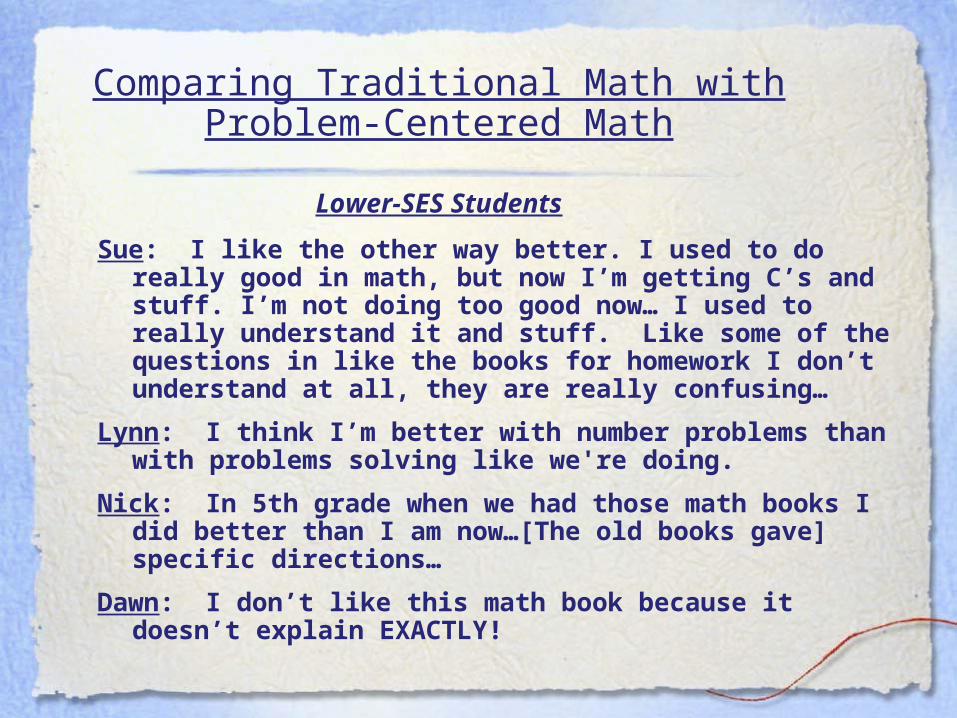
Comparing Traditional Math withProblem-Centered Math
Lower-SES Students
Sue: I like the other way better. I used to do really good in math, but now I’m getting C’s and stuff. I’m not doing too good now… I used to really understand it and stuff. Like some of the questions in like the books for homework I don’t understand at all, they are really confusing…
Lynn: I think I’m better with number problems than with problems solving like we're doing.
Nick: In 5th grade when we had those math books I did better than I am now…[The old books gave] specific directions…
Dawn: I don’t like this math book because it doesn’t explain EXACTLY!

Higher-SES students
Rebecca: This year were doing stuff that I like...Before, we just sat there with 100’s of problems on a page...
Guinevere: It's a lot easier [with the new curriculum]... I guess our family's, just, we are word problem kind of people.
Christopher: 2 years ago we just, like, learned about how to do problems and not how it has to do with real life. . . Sometimes the directions are unclear...[but] I just go and do what I think it's trying to say... I just try my best to figure out the directions, so If I get it wrong it's just because of
directions and not because I did the problem wrong.

"Do you participate much in class discussions? Why or why not?"
(From final survey)
Higher-SES Guinevere: Yes, because I
need to get my point across.
Samantha: Yes, because I want other people to understand my ideas. I like arguing.
Benjamin: Yes, because I like to let people know what I'm thinking.
Lower-SES Rose: Yes. If I know what I'm
talking about. But if I'm confused I just listen.
Sue: Sometimes, only if I know I've got the right answer.
Dawn: No because I don't like to be wrong in front of a whole group.
Carl: No, because I always feel awkward.

Do you learn from whole-class discussions?
Lower-SES Students Lynn: We're like OK this is a rule, and the rule I got I think this
works, but it might work on one problem but not on all the other ones, so I get mixed up. . . Sometimes people say things that aren’t true, like wrong ideas, and I get those stuck in my head, and I have all these different ideas going and it’s confusing...
Sue: I learn better from just like the teacher instead of the whole group…When everyone is there they give their opinions and stuff it may not be right, and I mix those two up, and it just confuses me.
Nick: Yeah, but sometimes I don’t know what they’re talking about.

Higher-SES Students
Christopher: If I don’t understand something and I was wondering how to do something and they brought it up in class, then I would like know. And its kind of fun to listen to arguments.
Rebecca: Yeah, I think it helps me learn more things instead of just like doing it on your own, I can know everybody’s opinions and take it into consideration.
Do you find it confusing when you have all those different opinions out?
Not really, some of em aren’t true, and some of em are, and I can figure out which ones are true and which ones aren’t and stuff.

Abstraction from Contextualized Problems
Two brief examples
The Pizza Sharing Problem -- Intended to teach division interpretation of fractions
Popcorn Box Problem -- Intended to teach unit pricing ideas
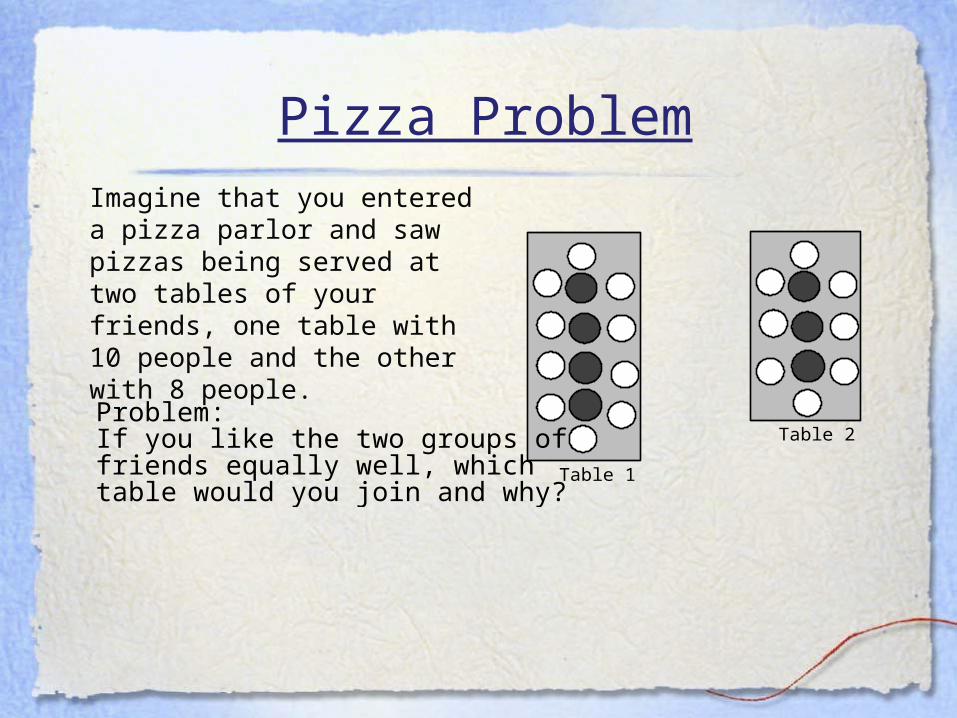
Pizza Problem Imagine that you entered a pizza parlor and saw pizzas being served at two tables of your friends, one table with 10 people and the other with 8 people.
Table 1
Table 2Problem:If you like the two groups offriends equally well, whichtable would you join and why?

Approaches to the Pizza Problem
Sue
Rose
Samantha
You don't know how much the people at the table already ate, and — like say you came five minutes after they served everyone, and say like two pizzas were gone at both tables, and then there's only two on both of them.
If you divided them into 4 pieces each, then… there would be 4 people without seconds at table 1 and 4 people without seconds at table 2.
I took 4 divided by 11 because you have to add more people if you’re going to join the table, and you get 36% of the pizza.

Popcorn Box Problem
Which is the better buy?

More higher-SES students approached theproblems and discussions with an eye towardthe intended, over-arching, mathematical ideas.
They seemed more familiar with what Cooperand Dunne (2000) describe as “the peculiarways boundaries are drawn between schoolmathematics and everyday knowledge.”
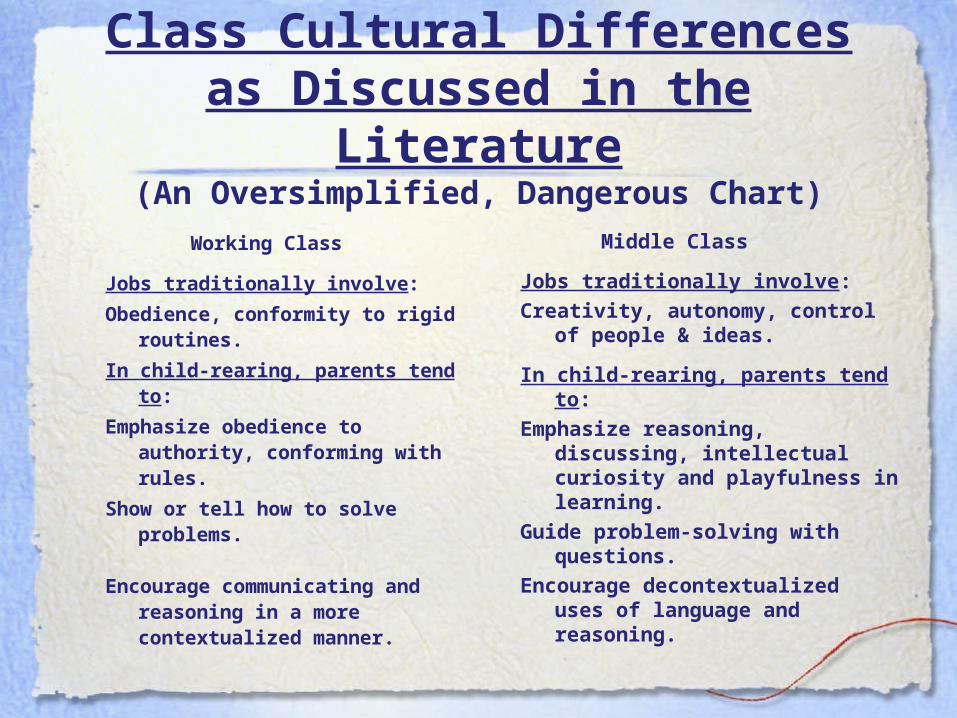
Class Cultural Differences as Discussed in the Literature
(An Oversimplified, Dangerous Chart)
Working Class
Jobs traditionally involve:
Obedience, conformity to rigid routines.
In child-rearing, parents tend to:
Emphasize obedience to authority, conforming with rules.
Show or tell how to solve problems.
Encourage communicating and reasoning in a more contextualized manner.
Middle Class
Jobs traditionally involve:
Creativity, autonomy, control of people & ideas.
In child-rearing, parents tend to:
Emphasize reasoning, discussing, intellectual curiosity and playfulness in learning.
Guide problem-solving with questions.
Encourage decontextualized uses of language and reasoning.
Study Conclusion
This study suggests that instruction centered around students discussing various perspectives and abstracting mathematical ideas from contextualized problems, could value and reward middle-class students' preferred ways of thinking and knowing in some unanticipated ways.

2 Questions

1) So is rote learning better for low-SES students?
No. This would be a repeat of past problems (e.g., Anyon).
My study does not show that lower-SES students learn LESS in a problem-centered environment than a traditional one.
One could argue that lower-SES students have the most to gain from mathematics instruction emphasizing problem solving and critical thinking.

2) What should teachers do?
Four adaptations I would consider:
1) Offer more explicit cross-cultural training into new classroom culture
2) More carefully monitor whether all students had “abstracted” intended mathematics from problem explorations
3) Consider using either “real, real world” problems (tough to pull off) or more abstract problems (could have drawbacks in terms of student motivation/attitudes toward mathematics)
4) Offer more individualized, out-of-class time support for struggling students.

Study 2: Parent/Student choices between
traditional and Standards-based high school mathematics in
one district
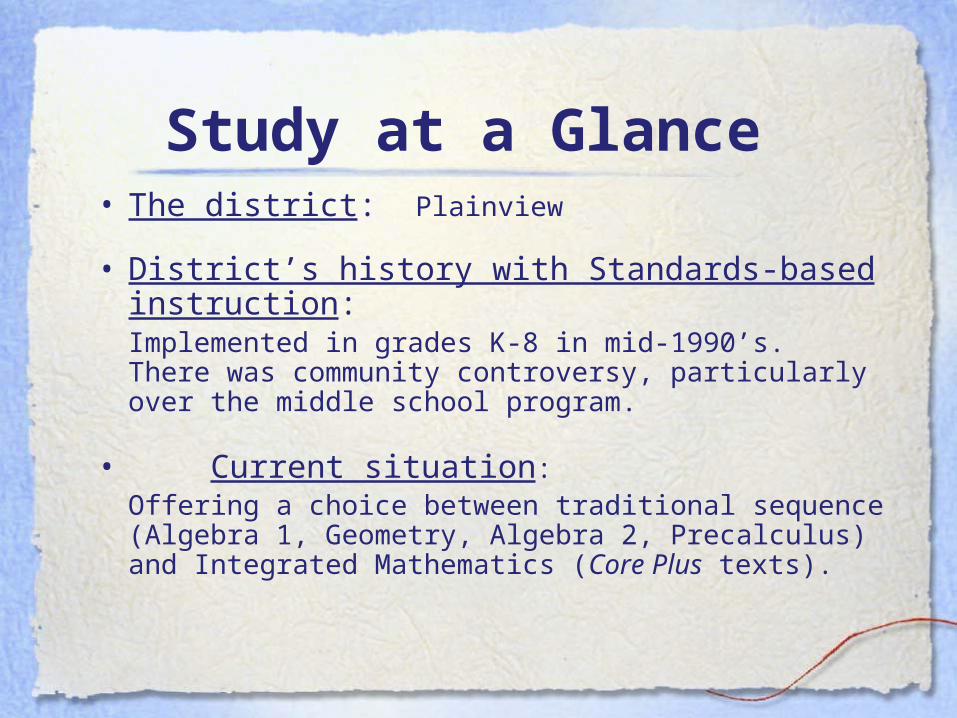
Study at a Glance• The district: Plainview
• District’s history with Standards-based instruction: Implemented in grades K-8 in mid-1990’s. There was community controversy, particularly over the middle school program.
• Current situation: Offering a choice between traditional sequence (Algebra 1, Geometry, Algebra 2, Precalculus) and Integrated Mathematics (Core Plus texts).

Data Collected
• Parent surveys
• Student surveys
• Observations and interviews with one teacher who teaches both Algebra 1 and Integrated 1
Since 2000, 600 Plainview students (and their parents) have chosen between traditional and Integrated high school mathematics.
What percent chose traditional?
A little audience participation - guess the percentage

A Few Findings in Brief• 600 students and parents have chosen between
traditional and Integrated high school mathematics. 82% chose traditional.
• Tradition -- in families, schools, and colleges -- was a factor in many parents’ and students’ decisions.
• Many parents and students chose traditional specifically because it would not be like the middle school curriculum.
• Parents with limited education were the least likely to report having talked to a teacher but the most likely to say a teacher influenced their decision.

Top 4 Parent Decision Factors, by Course
Algebra
n=243
Integrated
n=90
Student wanted 51% Understand 52%
College 51% Student wanted 51%
Content 38% Enjoyment 48%
Understand 36% Real life 43%
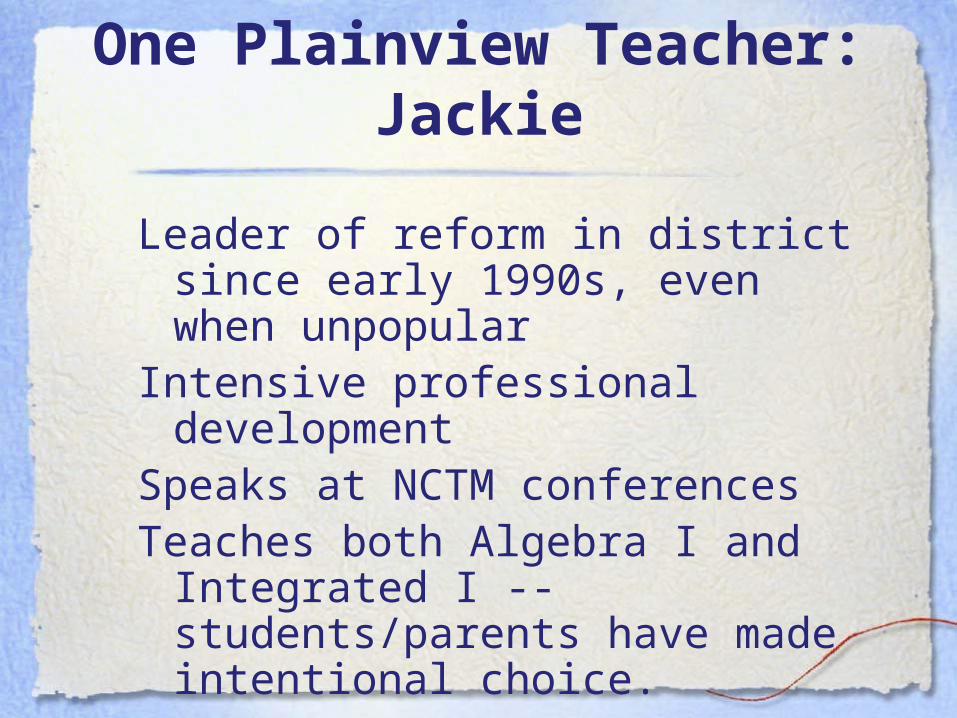
One Plainview Teacher: Jackie
Leader of reform in district since early 1990s, even when unpopular
Intensive professional developmentSpeaks at NCTM conferencesTeaches both Algebra I and
Integrated I -- students/parents have made intentional choice.

Jackie’s Student Survey DataPercent responding “Almost Every Day”
In your math class, how often do these things happen?
AlgebraN= 121
IntegratedN= 82
Students work in groups 3% 100%
Your teacher lectures at the board or overhead for most of the class period
67% 8%
Students use calculators 82% 98%
You spend more than 10 minutes working on a single math problem
11% 23%
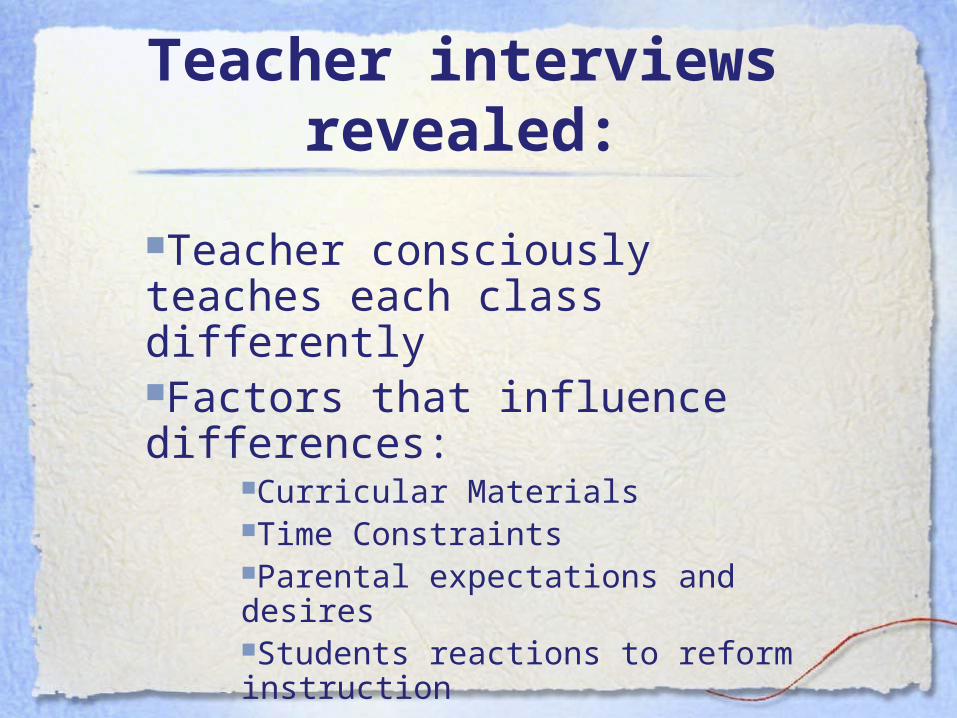
Teacher interviews revealed:
Teacher consciously teaches each class differentlyFactors that influence differences:
Curricular MaterialsTime ConstraintsParental expectations and desiresStudents reactions to reform instruction

Some Concluding Remarks:Challenges/dilemmas of instructional reform
• A good, reform-oriented textbook is important, but so are students’ and parents’ expectations.
• Advantages and disadvantages of choice:Pros: Parents and students can choose, Teachers can choose, limits backlash
Cons: District logistics & resources, potential inequity
• Despite achievement gains over the past decade, severe disparities remain. Any reform must be examined carefully with regard to equity.

For more information about NAEP data regarding the U.S. and Nebraska, you can visit the NAEP Data Tool at:
http://nces.ed.gov/nationsreportcard/ NAEPdata/search.asp

Some comments from students
Integrated:You get to work in
groups. I like to figure things out
and find out why/ how they work.
I wouldn’t have to memorize rules like in Algebra.
This way I don’t do the same thing all year.
Algebra:I prefer learning straight math—I
just get annoyed when they try to put it in context—I don’t care about the # of Suzy’s rugs.
I got a good score on the Algebra Aptitude Test.
I wasn’t sure if colleges accepted Integrated math
Algebra is real math. It has been used for years and has been successful.
I would rather just do problems without expanding or pondering stuff.
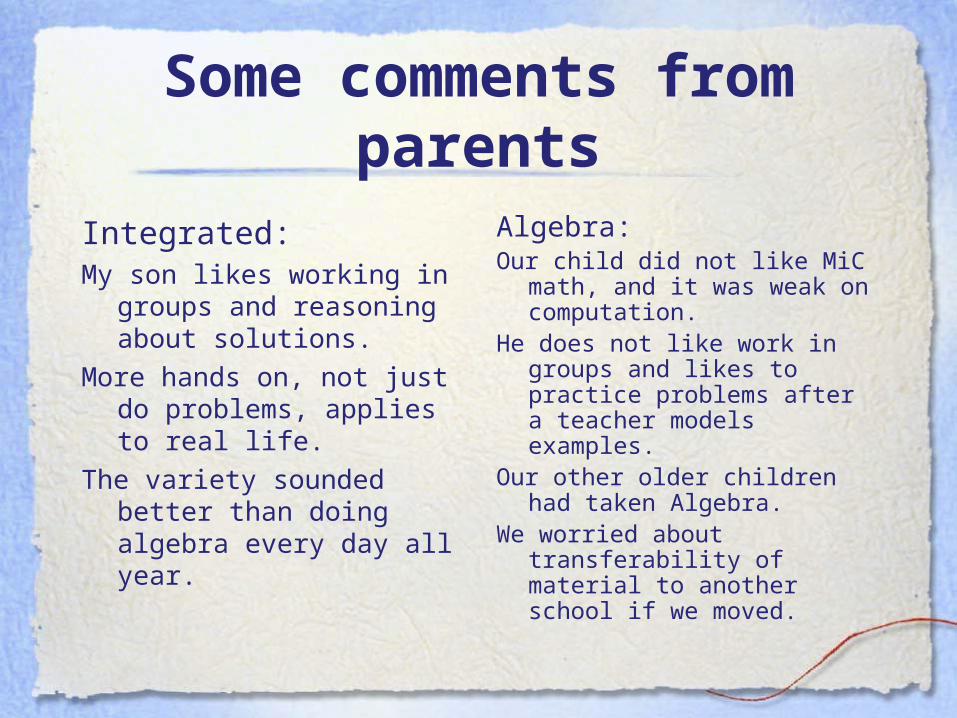
Some comments from parents
Integrated:My son likes working in groups
and reasoning about solutions.
More hands on, not just do problems, applies to real life.
The variety sounded better than doing algebra every day all year.
Algebra:Our child did not like MiC math,
and it was weak on computation.
He does not like work in groups and likes to practice problems after a teacher models examples.
Our other older children had taken Algebra.
We worried about transferability of material to another school if we moved.
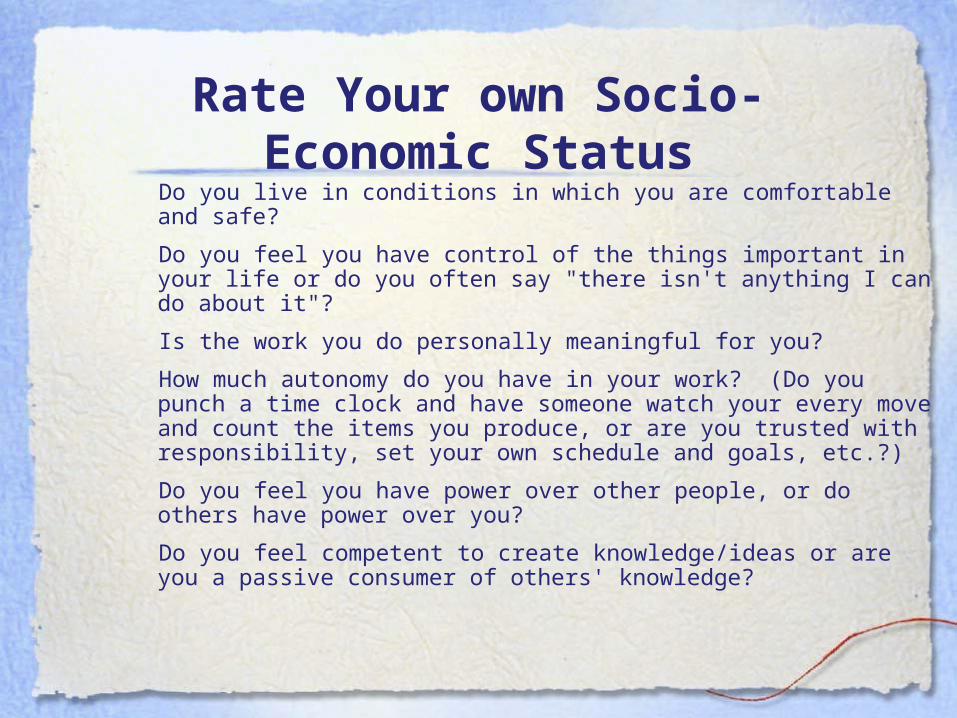
Rate Your own Socio-Economic Status
Do you live in conditions in which you are comfortable and safe?
Do you feel you have control of the things important in your life or do you often say "there isn't anything I can do about it"?
Is the work you do personally meaningful for you?
How much autonomy do you have in your work? (Do you punch a time clock and have someone watch your every move and count the items you produce, or are you trusted with responsibility, set your own schedule and goals, etc.?)
Do you feel you have power over other people, or do others have power over you?
Do you feel competent to create knowledge/ideas or are you a passive consumer of others' knowledge?
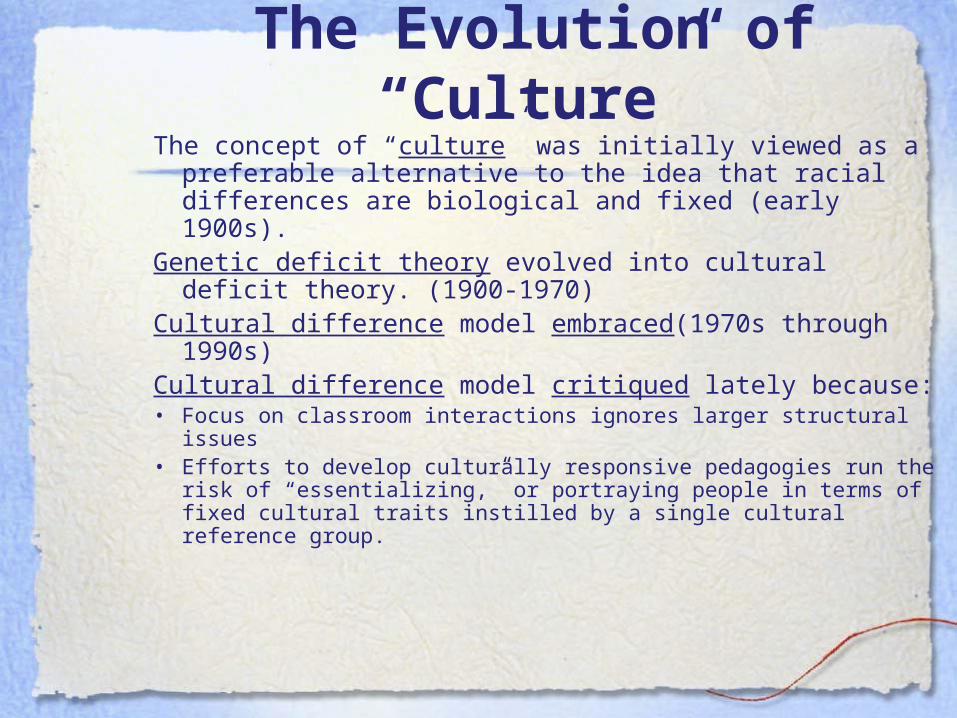
The Evolution of “Culture”The concept of “culture” was initially viewed as a
preferable alternative to the idea that racial differences are biological and fixed (early 1900s).
Genetic deficit theory evolved into cultural deficit theory. (1900-1970)
Cultural difference model embraced(1970s through 1990s)
Cultural difference model critiqued lately because:• Focus on classroom interactions ignores larger structural issues• Efforts to develop culturally responsive pedagogies run the risk
of “essentializing,” or portraying people in terms of fixed cultural traits instilled by a single cultural reference group.

2000 NAEP Scores by Race and SES
Note: these are row percents. For example, 14% of White 4 th graders were in the Low-SES quartile.
4th 8th 12th Low SES
High SES
Low SES
High SES
Low SES
High SES
White 215
14%
247
32%
266
14%
300
32%
289
16%
323
31%
Hispanic 202
48%
237
11%
247
55%
281
7%
276
56%
309
8%
Black 198
51%
229
7%
242
47%
270
8%
267
47%
292
11%
White-Hispanic Gap
13 10 19 19 13 14
White-Black Gap
17 18 24 30 22 31
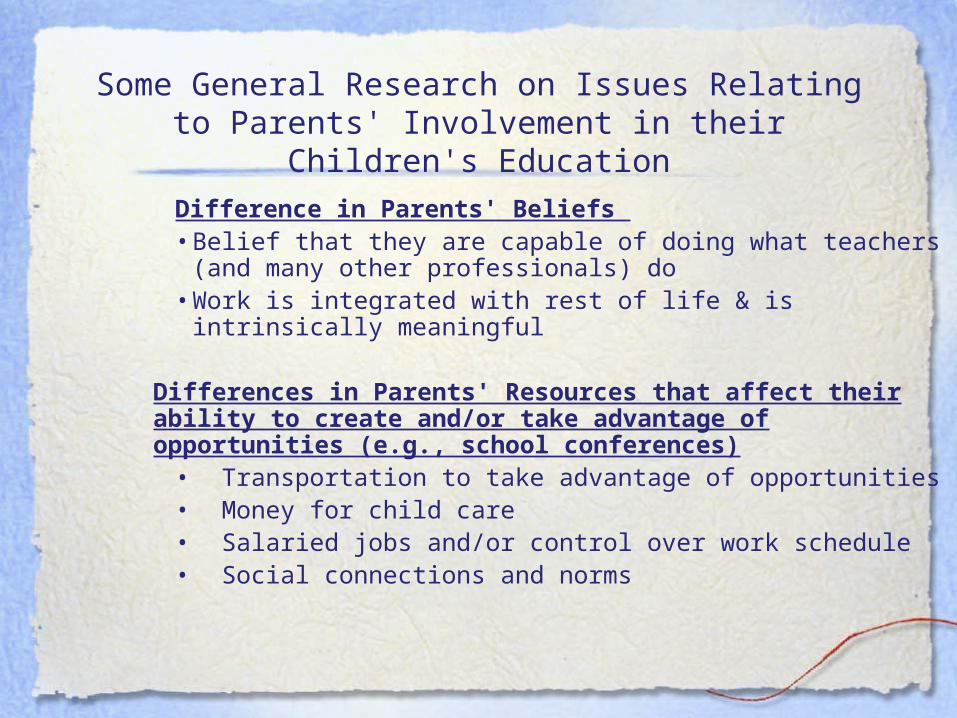
Some General Research on Issues Relating to Parents' Involvement in their Children's Education
Difference in Parents' Beliefs • Belief that they are capable of doing what teachers (and many
other professionals) do• Work is integrated with rest of life & is intrinsically meaningful
Differences in Parents' Resources that affect their ability to create and/or take advantage of opportunities (e.g., school conferences)
• Transportation to take advantage of opportunities • Money for child care• Salaried jobs and/or control over work schedule• Social connections and norms
Class is difficult to define and measure:
Class is a touchy subject. Labeling people by class sounds insulting.
Current emphasis is on celebrating diversity. It is not clear how large disparities of wealth and status are cause for celebration.
Difficulties/Dangers of studying class in education

Deficit vs. Difference Theory
• Assumes lower-class families are culturally deficient
• Places value judgment on cultures: white, middle-class culture is believed to be superior to lower-class culture
• Remedy: Help "fix" deficiencies of lower-class families.
• Assumes the culture of the schools and that of lower-class families are different
• Avoids passing judgment on cultures. Acknowledges the existence of an arbitrary culture of power.
• Remedy: Bridge the cultural gap between schools and students. This includes adapting the culture of the schools to be compatible with the culture of students served by the school. This might also include educating students about the culture of power.
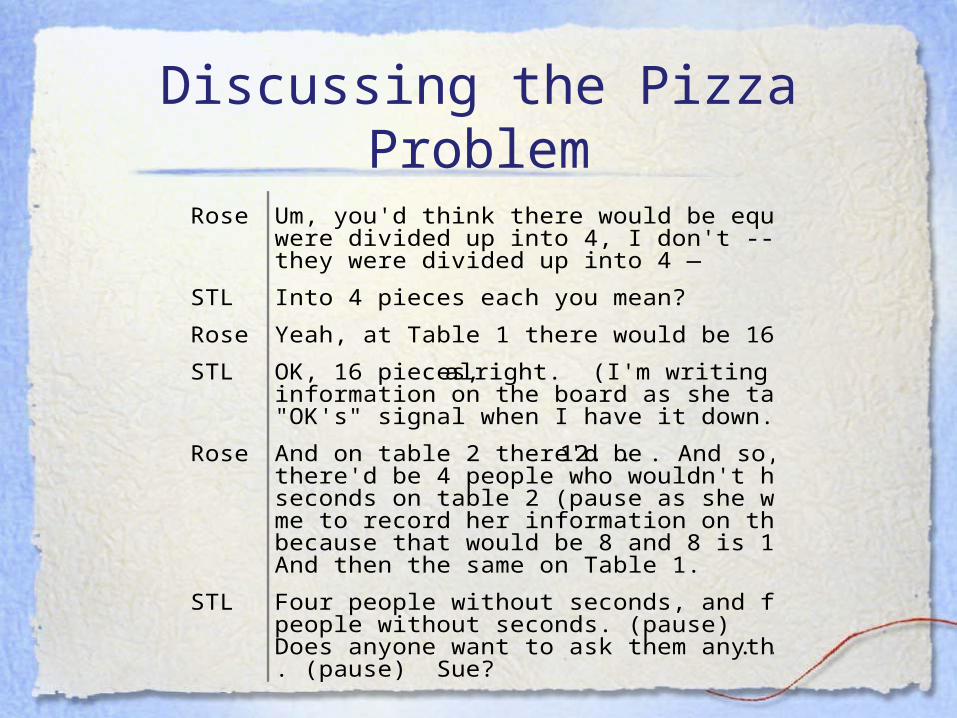
Discussing the Pizza ProblemRose Um, you'd think there would be equal if they
were divided up into 4, I don't -- anyway, ifthey were divided up into 4 —
STL Into 4 pieces each you mean?
Rose Yeah, at Table 1 there would be 16 pieces.
STL OK, 16 pieces, alright. (I'm writing herinformation on the board as she talks. My"OK's" signal when I have it down.)
Rose And on table 2 there'd be 12. . . And so, um,there'd be 4 people who wouldn't haveseconds on table 2 (pause as she waits forme to record her information on the board)because that would be 8 and 8 is 16 (pause)And then the same on Table 1.
STL Four people without seconds, and fourpeople without seconds. (pause)Does anyone want to ask them anything? . .. (pause) Sue?

Sue OK um, you don't know how much the,the, the people at the table who alreadyate, and . . . (pause — I prompted her tocontinue) You don't know — like say youcame five minutes after they servedeveryone and everything, and say liketwo pizzas were gone at like both tables,and then there's only two on both ofthem.
STL OK, so if, so you don't, OK, you don'tknow how much is left at each table, isthat--?
Sue Yeah! You don't, you -- I don't know!(She mumbles something I can't hear.)
STL (Pause) OK, let's just assume -- theydon't say this explicitly -- but let's assumethey just got the pizzas and they haven'tstarted eating yet.
Student It says that.

STL It does say that? OK. . . . (I checked -- theproblem did say that.)Um, Samantha you've had your hand up a longtime
Samantha —I have another idea
STL Go ahead.
Samantha OK, I got the answer by dividing by um, dividinghow many pizzas there are by the number ofpeople, and--(Getting seconds was not the original way shesolved it. But she had listened to theirargument and understood it's mathematicalflaw and tried to address it. )
STL OK, (I'm writing on the board again.)
Samantha So I took four divided by 11 because youhave to add more people if you're going to jointhe table.
STL Because you're going to be there too, soyou're saying there's 11 people and --
Samantha And you get 36% of the pizza.

4th grade lunch 2003
010203040506070
NotEligible-
Rural
Reduced-Rural
Free-Rural USRural/Free
NebraskaRural/Free
US NebraskaWhiteBlackHispanic

8th grade lunch 2003
0
10
20
30
40
50
60
70
Not EligibleRural
ReducedRural
Free Rural US Free NebraskaFree
US NebraskaWhiteBlackHispanic

US & Nebraska Overall Math Achievement 2003 (4th grade)
200205210215220225230235240
US-National Nebraska
CityFringeRural

Overall Achievement by Race 2003( 4th grade)
200
210
220
230
240
250
US-National Nebraska
WhiteBlackHispanic

2. What About Gender in this Study?
Girls had stronger reactions -- both positive and negative. The lower-SES girls put forth more effort than the boys, yet did not succeed on tests and quizzes like the higher-SES girls.
Research suggests that girls are more likely than boys to interpret their struggles and failures as evidence of their incompetence. (E.g., Covington & Omelich, 1979)

3. What about Ethnicity?
The study and literature focused primarily on
white students. This study “transfers” by raising
the possibility that particular ethnic groups could
be advantaged or disadvantaged by an
instructional method in unanticipated ways.

Percentage of 4th graders agreeing "Learning math is mostly memorizing facts,” 2003
0
10
20
30
40
50
60
US Nebraska
WhiteBlackHispanic

U.S. Black-White Gaps by Mathematical Strand, 2003
0
10
20
30
40
50
60
Black/White Gap Black/White Gap
4th Grade 8th Grade
Number
Data
Algebra
Geometry
Measurement

Percentage of 8th Graders Whose Teachers Reported Allowing Students to Use Calculators
on Tests, By Race
0
20
40
60
80
1990 1996 2000
All White Students
All Hispanic Students
All Black Students

Average grades for the yearHigher-SES
MalesHigher-SES
FemalesLower- SES
MalesLower- SES
FemalesChristopher : 96 W 95 Q&T
Samuel: 89 W 90 Q&T
Timothy: 89 W 81 Q&T
Benjamin: 77 W 92 Q&T
Harrison: 70 W 69 Q&T
Rebecca: 99 W 95 Q&T
Samantha: 98 W 96 Q&T
Andrea: 91 W 86 Q&T
Guinevere: 81 W 90 Q&T
Mark: 82 W 84 Q&T
Nick: 78 W 87 Q&T
Carl: 69 W 61 Q&T
James: 21 W 42 Q&T
Rose: 97 W 87 Q&T
Anne: 94 W 88 Q&T
Lynn: 94 W 86 Q&T
Sue: 90 W 77 Q&T
Dawn: 80 W 63 Q&T
84W-85Q&T 92W-92Q&T 76W-77Q&Tw/o James
63-69 w/ James
91W-80Q&T

Those mentioned in answer to the question, "Who are best 3 math students?"
Higher-SESMales
Higher-SESFemales
Lower-SESMales
Lower-SESFemales
Benjamin* - 17
Timothy* - 2
Christopher*- 2
Samuel* - 1
Harrison -
Samantha*- 19
Rebecca* - 4
Guinevere* - 1
Andrea -
Carl -
James -
Nick -
Mark -
Rose - 9
Anne - 2
Dawn -
Sue -
Lynn -
*Students who named themselves are denotedwith an asterisk.