proof-rolling of suhgradesonlinepubs.trb.org/onlinepubs/hrbbulletin/254/254-002.pdf ·...
TRANSCRIPT

"Proof-Rolling of Suhgrades
W.J. TURNBULL, U.S. Army Engineers, Waterways Experiment Station, Vicksburg, Miss.; and CHARLES R. fOSTER, National Bituminous Concrete Association, Vicksburg, Miss.
Proof-rolling of subgrades is being used by state highway departments to check the adequacy of normal compaction and to correct any deficiencies that may exist. Proofrolling is an excellent tool, but there is a growing tendency to look on proof-rolling as a panacea that will end all compaction problems. This is a false approach, as proofrolling will find and correct deficiencies only under certain conditions of moisture. This paper shows the cases where proof-rolling will be effective and those cases where it will not. The paper also contains information that can be used to establish desirable roller characteristics and the amount of rolling that should be used for various conditions.
eTHE TERM "PROOF-ROLLING" as used in this paper refers to the application of a few coverages of a heavy rubber-tired roller on a subgrade or other layer of a subbase or base course after the completion of normal compaction. The procedure is used to check the adequacy of the normal compaction and to correct any deficiencies that may exist. In recent months several states have incorporated proof-rolling requirements into their specifications for heavy-duty pavements. Proof-rolling is an excellent tool that will assist materially in the construction of adequate pavements, but there is a growing tendency to look on proof-rolling as a panacea for all compaction problems, even to the extent of relaxing on inspection and construction control testing where proofrolling is being used. This is an entirely
0
false approach as proof-rolling is not a positive cure-all. The primary purpose of this paper is to show where proof-rolling will correct compaction deficiencies and where it will not. Also, the paper contains information that can be used to establish desirable roller characteristics and the amount of rolling that should be used for various conditions.
BACKGROUND
Heavy rubber-tired rollers have been used to compact buried layers since their development by Porter (1) in the period 1943-1944, and he and others have used the very heavy rollers to proof-:=-test construction on many airfields. The term proof-rolling was introduced into the Corps of Engineers' guide specifications (2) for graded crushedaggregate base courses in 1957. The specifications required the application of 30 coverages with a 50-ton roller after the layer in question had been compacted to 100 percent of modified AASHO density. The primary purpose of the 30 coverages was to boost the density to the range of 103 to 104 percent of modified AASHO that was considered to be necessary. The application of 30 coverages was not proof-rolling in the sense defined in this paper, but the term seemed apt and has been adopted and us.ed widely.
The application of 30 coverages of proof-rolling which was required on the Columbus Air Force Base, Columbus, Miss., as part of the Corps of Engineers' job specifications was thought to be a definite requirement to preclude any occurrence of deficiencies from lack of compaction. However, the time between completion of normal rolling and the start of proof-rolling was sufficient to permit the base course to dry out to such a degree that the 30 coverages did not produce the anticipated density. Settlement under the accelerated traffic test (3) produced approximately %-in. densification within the 10-in. layer of base course-: In retrospect, this case is a classic example where proof-rolling did not get the intended job done because of probable strengthening of the base due to cementation as a result of drying and the inability to reintroduce the proper moisture content for compaction.
12

13
To understand what happened at Columbus and what can happen in other cases, it is necessary to have a working knowledge of the interrelationships of moisture, density, and strength that exist during and immediately after construction and dui·ing subsequent periods when the pavement is being subjected to traffic. These relationships are illustrated in this paper by schematic diagrams rather than by actual presentations of test data. The trends indicated by the schematic diagrams are adequately supported in the literature. References are used to indicate the source of the test data in support of the illustrated trends.
In the discussion, primary Elmphasis is placed on cohesive materials, and all diagrams are for cohesive materials. The principles, however, apply to both cohesive and cohesionless materials, with the one exception that cohesionless materials can usually lose moisture quickly by drainage as well as by evaporation; therefore, the time element b~tween normal compaction and proof-rolling is more critical for cohesionless materials than for cohesive materials.
RELATIONSHIP OF MOISTURE, DENSITY, AND COMPACTION EFFORT
Figure 1 illustrates the typical relationship between moisture content and density that is obtained in the laboratory compaction test on cohesive soils (4). If samples are compac ted at a range of moisture con- -tents with a given compaction effort, for BLOWS PER LAYER VARIED example 12 blows per layer with the specified hammer, densities similar to those indicated by the small circles (Fig. 1) are obtained. A smooth curve drawn through these points represents the moisture-density relationship for the given compaction effort. The moisture content at the peak of the curve is termed the optimum because the maximum density for the specified compaction effort is obtained at the optimum moisture content. If the test is made at higher compaction efforts, for example 25 and 55 blows per layer,
1
MOISTURE CONT£HT Figure 1. Laboratory compaction.
relationships similar to those shown in Figure 1 are obtained (5, 6). The peaks of the compaction curves can be joined by a straight line, designatedthe-"line of optimums." This diagram shows that higher densities are produced with higher compaction efforts if the moisture content is right. No material increase in density can be expected from the higher compaction efforts if the moisture content is appreciably above or below optimum.
VARIABLES AFFECTING FIELD COMPACTION
The purpose of requiring adequate compaction during construction is to prevent settlement under future traffic and to ob-tain higher strength. The next figures illustrate the variables that affect the density that can be obtained during construction with rubber-tired rollers. Inciden-tally, these same variables, inclusive of the depth to the layer being considered, affect the density produced by traffic during the life of the pavement. Figure 2 shows the effect of tire pressure in producing higher densities (6, 7) and illustrates the effect of tire pressure when all other variables are held constant. Increasing the tire pressure increases the compaction effort and produces a pattern
1
TIRE PRESSURE VARIED
MOISTURE CONTENT --......
Figure 2 . Field compaction.
14
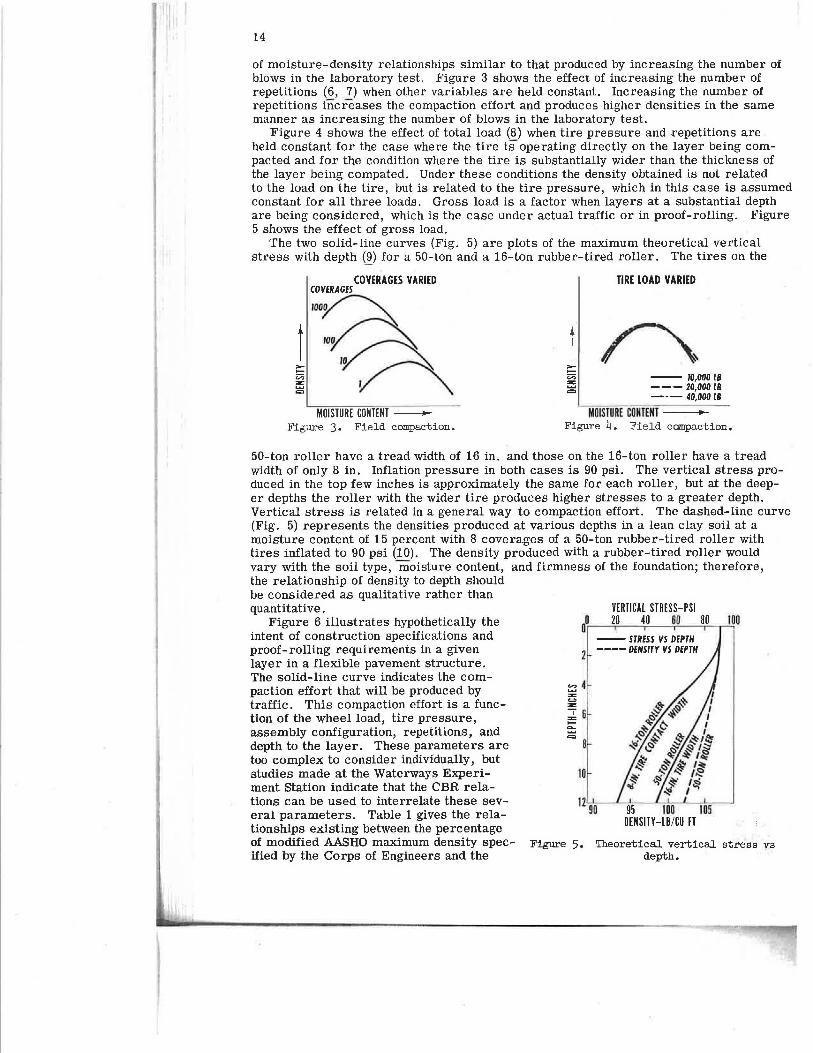
of moisture-density relationships similar to that produced by increasing the number of blows in the laboratory test. Figure 3 shows the effect of increasing the number of repetitions (6, 7) when other variables are held constant. Increasing the number of repetitions increases the compaction effort and produces higher densities in the same manner as increasing the number of blows in the laboratory test.
Figure 4 shows the effect of total load (8) when tire pressure and repetitions are held constant for the case where the tire is operating directly on the layer being compacted and for the condition where the tire is substantially wider than the thickness of the layer being compated. Under these conditions the density obtained is not related to the load on the tire, but is related to the tire pressure, which in this case is assumed constant for all three loads. Gross load is a factor when layers at a substantial depth are being considered, which is the case under actual traffic or in proof-rolling. Figure 5 shows the effect of gross load.
The two solid-line curves (Fig. 5) are plots of the maximum theoretical vertical stress with depth ~) for a 50-ton and a 16-ton rubber-tired roller. The tires on the
COVERAGES VARIED COVERAGES IOOYA
~"~ MOISTURE CONTENT -
Figure 3. Field compaction.
TIRE LOAD VARIED
-- 10,000LB --- 20,000 LB --- 40,000 LB
MOISTURE CONTENT -----<Figure 4. Field compaction.
50-ton roller have a tread width of 16 in. and those on the 16-ton roller have a tread width of only 8 in. Inflation pressure in both cases is 90 psi. The vertical stress produced in the top few inches is approximately the same for each roller, but at the deeper depths the roller with the wider tire produces higher stresses to a greater depth. Vertical stress is related in a general way to compaction effort. The dashed-line curve (Fig. 5) represents the densities produced at various depths in a lean clay soil at a moisture content of 15 percent with 8 coverages of a 50-ton rubber-tired roller with tires inflated to 90 psi (10). The density produced with a rubber-tired roller would vary with the soil type, moisture content, and firmness of the foundation; therefore, the relationship of density to depth should be considered as qualitative rather than quantitative.
Figure 6 illustrates hypothetically the intent of construction specifications and proof-rolling requirements in a given layer in a flexible pavement structure. The solid-line curve indicates the compaction effort that will be produced by traffic. This compaction effort is a function of the wheel load, tire pressure, assembly configuration, repetitions, and depth to the layer. These parameters are too complex to consider individually, but studies made at the Waterways Experiment Station indicate that the CBR relations can be used to interrelate these several parameters. Table 1 gives the relationships existing between the percentage
VERTICAL STRESS-PSI 0 20 40 60 80 JOO o.-------.~~~-.~-----.-----.----.
~4 = ..... :z:
:b 6 -e::; =
ID
-- STRESS VS DEPTH ----DENSITY VS DEPTH
of modified AASHO maximum density spec- Figure 5. Theoretical vertical stress ys ified by the Corps of Engineers and the depth.

Figure 6.
(
ES/RED COMPACTION EFFORT ROM PROOF ROLLING
'
DESIRED COMPACTION EFFORT FROM NORMAl ROLLING
a "" .
A TRAFFIC COMPACTION EFFORT
MOISTURE CONTENT ----t~
Intent of compaction requirements.
15
design CBR at the depth to which the specified percentage of compaction is required. Separate values are necessary for cohesive and cohesionless soil. These values were developed for airfield conditions but are probably applicable to highway conditions.
Table 1 shows that cohesive soils should be compacted to 100 percent modified AASHO density down to a depth where the design CBR is 19, to 95 percent density down to a depth where the design CBR is 9, etc. (The value of 100 percent of modified AASHO for cohesive soil is shown primarily to indicate the position of the curve because cohesive soils can seldom be compacted to 100 percent of modified AASHO maximum density. ) Table 1 can be used with a CBR design curve for the given loading to establish the compaction that should be obtained to a given layer
during construction. In highway work compaction requirements generally are not varied with depth, and usually one value is specified .for the base (for example , 100 percent standard AASHO) and one for the subgrade (for example, 95 percent standard AASHO).
Compaction Effort Percent of Mod. AASHO Density
100 95 90
TABLE 1
Design CBR Cohesive Soils Cohesionless Soils
19 9 5
9 4 2
With the heavier loads and higher repetitions that are being experienced, it is believed that compaction requirements should be raised, in which case it may prove economical to vary the compaction requirements with depth as is done in airfield work. In any case , it should be the intent of the compaction requirements to produce compaction in each layer during construction equivalent to or slightly higher than will be produced by the actual traffic. The short-dashed curve (Fig. 6) shows the intent of the construction requirements.
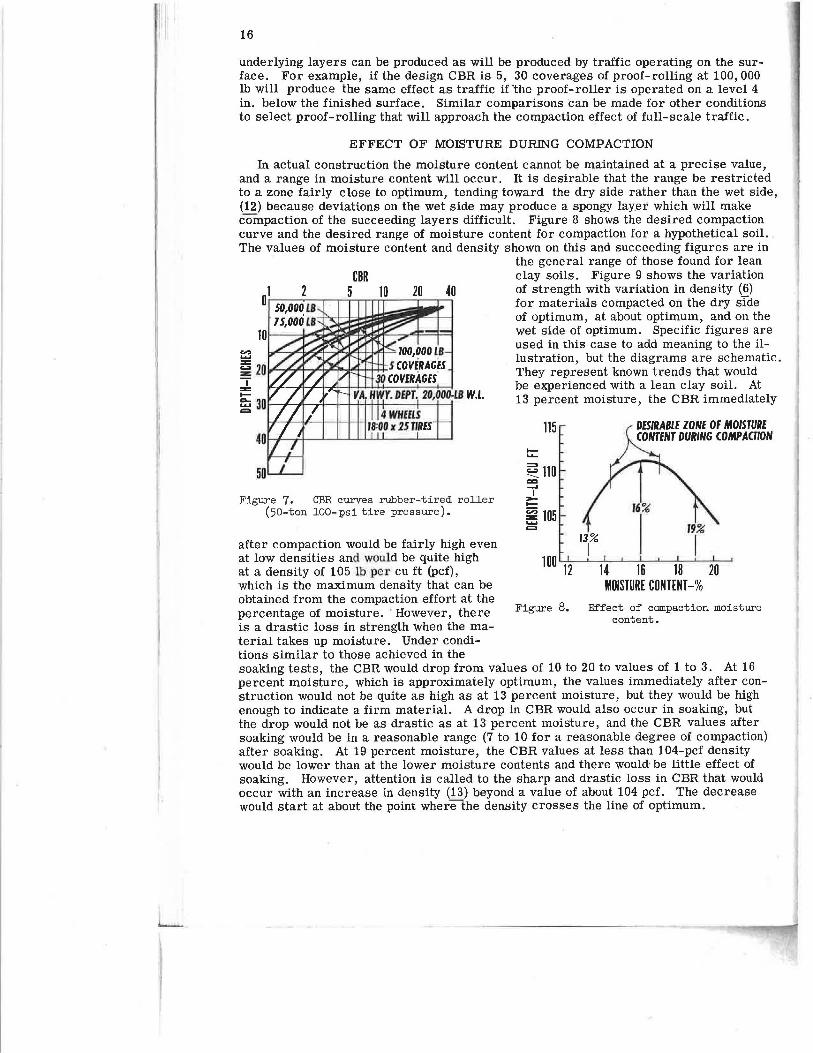
For proof-rolling to be effective, it is desirable that it produce a compaction effort which approximates that specified during construction. The dash-dot curve (Fig. 6) illustrates the intent of proof-rolling requirements. Proof-rolling is done with a very few repetitions as compared to highway or airfield traffic. The.refore, the loads and tire pressures must be higher than those which will be U:nposed on the finished pavement. The compaction effect of the proof-rolling can be compared directly with the compaction effect of traffic by comparing CBR design curves for the roller and the traffic loading. Figure 7 shows CBR curves prepared by the Waterways Experiment Station for a 50-ton roller, 100 psi inflation pressure_, for 5 and 30 coverages. The coverage numbers assigned to the curves should not be taken too literally; the lower value should be considered as covering a range of 3 to 8 coverages, the upper value about 20 to 40 coverages. Comparisons of compaction effort can be made directly by plotting the CBR design curve for a specific traffic loading on the diagram. For illustration purposes the Virginia Highway Department CBR design curve (11) for a 20, 000-lb wheel load is shown. Even the carve for 100, 000-lb 30 coverages lies well above the traffic curve for the 20, 000-lb wheel load, indicating that proof-rolling from the surface will not produce the same compaction effect as the traffic. By operating the proof-roller at levels below the finished surface, the same compaction effect in the
i
I
L
16
underlying layers can be produced as will be produced by traffic operating on the surface. For example, if the design CBR is 5, 30 coverages of proof-rolling at 100, 000 lb will produce the same effect as traffic if lhe proof-roller is operated on a level 4 in. below the finished surface. Similar comparisons can be made for other conditions to select proof-rolling that will approach the compaction effect of full-scale traffic.
EFFECT OF MOISTURE DURING COMPACTION
In actual construction the moisture content cannot be maintained at a precise value, and a range in moisture content will occur. It is desirable that the range be restricted to a zone fairly close to optimum, tending toward the dry side rather than the wet side, (12) because deviations on the wet side may produce a spongy layer which will make compaction of the succeeding layers difficult. Figure 8 shows the desired compaction curve and the desired range of moisture content for compaction for a hypothetical soil. The values of moisture content and density shown on this and succeeding figures are in
the general range of those found for lean CBR clay soils. Figure 9 shows the variation
5 10 20 40 of strength with variation in density (6) for materials compacted on the dry side
Figure 7. CBR curves rubber-tired roller (50-ton 100-psi tire pressure).
after compaction would be fairly high even at low densities and would be quite high at a density of 105 lb per cu ft (pcf), which is the maximum density that can be obtained from the compaction effort at the percentage of moisture. · However, there is a drastic loss in strength when the material takes up moisture. Under condi-tions similar to those achieved in the
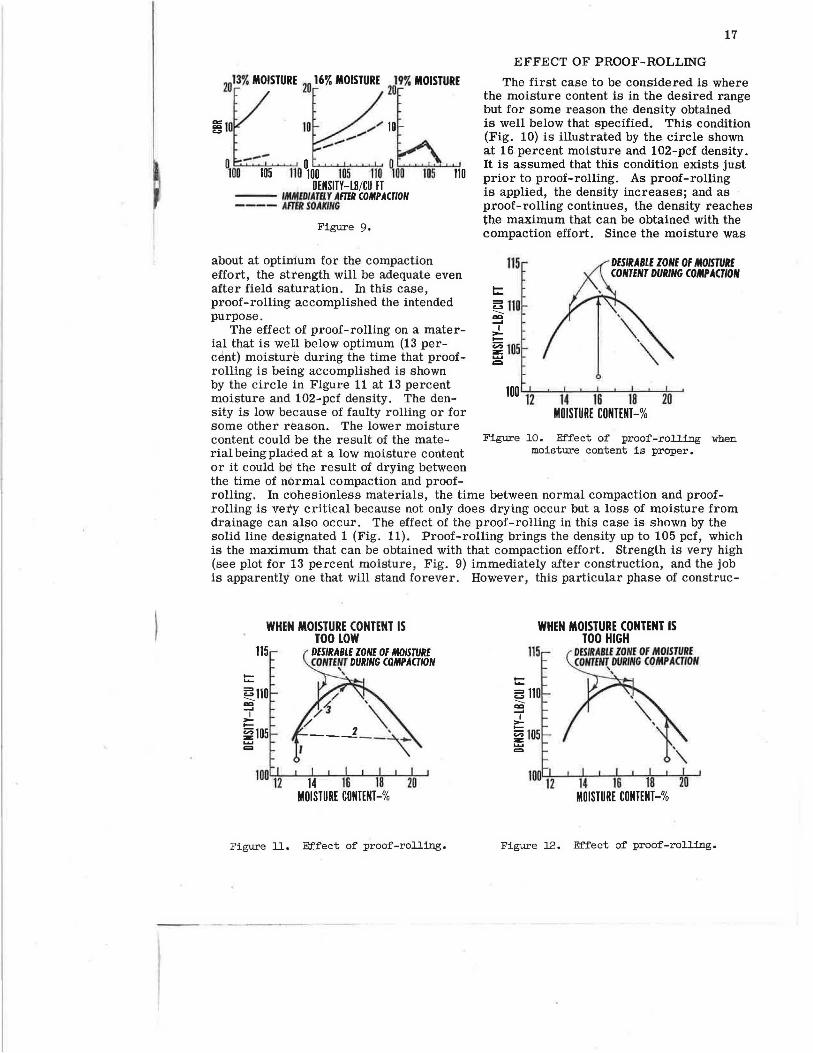
of optimum, at about optimum, and on the wet side of optimum. Specific figures are used in this case to add meaning to the illustration, but the diagrams are schematic. They represent known trends that would be experienced with a lean clay soil. At 13 percent moisture, the CBR immediately
-...... 115
~ 110 CCI ......
I --~ 105 ..... =
100 12
Figure 8.
13% I
14 16 18 20 MOISTURE CONTENT-%
Effect of compaction moisture content.
soaking tests, the CBR would drop from values of 10 to 20 to values of 1 to 3. At 16 percent moisture, which is approximately optimum, the values immediately after construction would not be quite as high as at 13 percent moisture, but they would be high enough to indicate a firm material. A drop in CBR would also occur in soaking, but the drop would not be as drastic as at 13 percent moisture, and the CBR values after soaking would be in a reasonable range (7 to 10 for a reasonable degree of compaction) after soaking. At 19 percent moisture, the CBR values at less than 104-pcf density would be lower than at the lower moisture contents and there would be little effect of soaking. However, attention is called to the sharp and drastic loss in CBR that would occur with an increase in density (13) beyond a value of about 104 pcf. The decrease would start at about the point wherethe density crosses the line of optimum.
20133 MOISTURE
20 163 MOISTURE
2J93 MOISTURE
~v: lO~J l~O D~ 100 105 110 100 105 110 100 105 110
DENSITY-LB/CU FT --- IMMEDIAffiY AFTER COMPACTION ---- AFTER SOAKING
Figure 9.
about at optimum for the compaction effort, the sttength will be adequate even after field saturation. In this case, proof-rolling accomplished the intended purpose.
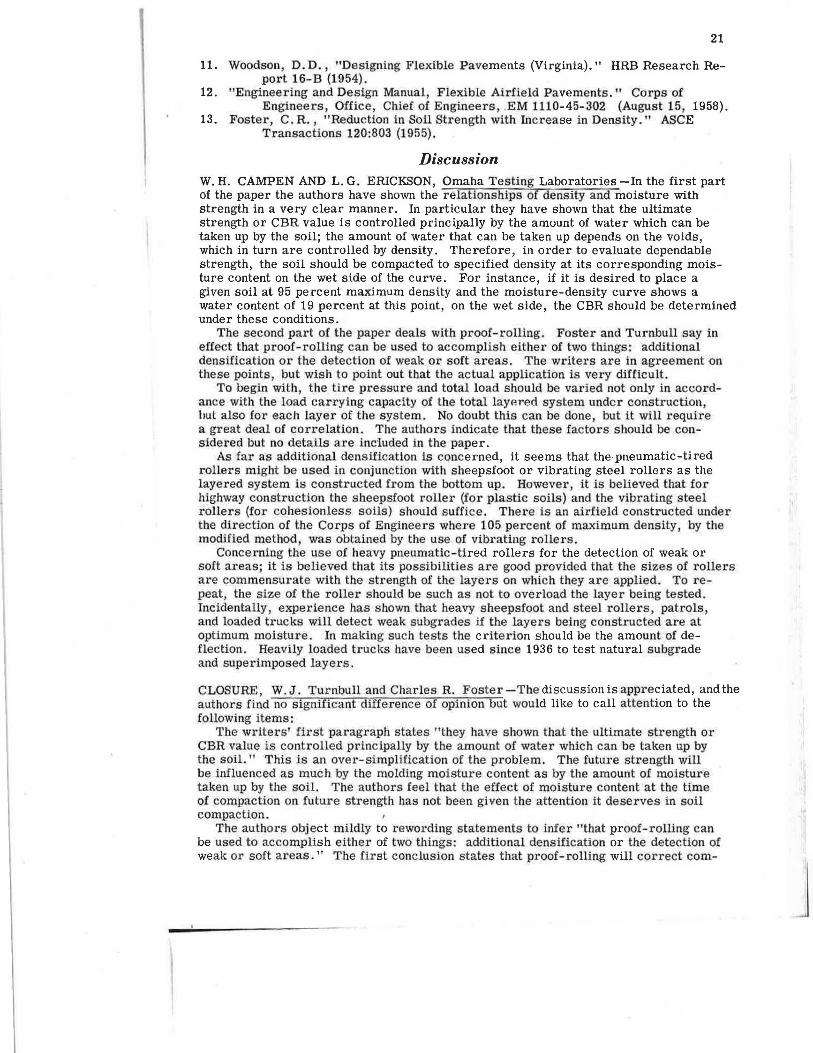
The effect of proof-rolling on a material that is well below optimum (13 perct:!nt) moistur~ during the time that proofrolling is being accomplished is shown by the circle in Figure 11 at 13 percent moisture and 102-pcf density. The density is low because of faulty rolling or for some other reason. The lower moisture content could be the result of the material beingpladed at a low moisture content or it could be the result of drying between the time of normal compaction and proof-
17
EFFECT OF PROOF-ROLLING
The first case to be considered is where the moisture content is in the desired range but for some reason the density obtained is well below that specified. This condition (Fig. 10) is illustrated by the circle shown at 16 percent moisture and 102-pcf density. It is assumed that this condition exists just prior to proof-rolling. As proof-rolling is applied, the density increases; and as proof-rolling continues, the density reaches the maximum that can be obtained with the compaction effort. Since the moisture was
115
t:: ~ 110 .... .....
I >...... ~105 ....... =
100 12
DESIRABLE IONE OF MOISTURE CONTENT DURING COMPACTION
14 16 18 20 MOISTURE CONTENT-%
Figure 10. Effect of proof-rolling when moisture content is proper.
rolling. In cbhesionless materials, the time between normal compaction and proofrolling is vecy critical because not only does drying occur but a loss of moisture from drainage can also occur. The effect of the proof-rolling iri this case is shown by the solid line designated 1 (Fig. 11). Proof-rolling brings the density up to 105 pcf, which is the maximum that can be obtained with that compaction effort. Strength is very high (see plot for 13 percent moisture, Fig. 9) immediately after construction, and the job is apparently one that will stand forever. However, this particular phase of construe-
WHEN MOISTURE CONTENT IS TOO LOW
115 DESIRABLE IONE OF MOISTURE
t:: ~110 ""' __.
I >...... ~105 ..... =
CONTENT DURING COMPACTION ' '
14 16 18 20 MOISTURE CONTENT-%
Figure ll. Ef'f"ect of" proof-rolling.
...... .......
WHEN MOISTURE CONTENT IS TOO HIGH
115 DESIRABLE ZONE OF MOISTURE CONTENT,.~URING COMPACTION
~ 110 ....._ ""' __.
I >-i;; 105 z:: ..... =
14 16 18 20 MOISTURE CONTENT-%
Figure 12. Effect of proof"-rolling.

18
tion may be completed in the late fall, and the road cannot be opened to traffic until the following summer because shoulder work or some other element is not complete. In the meantime, the moisture content increases during the wet winter weather and approaches the compaction curve on the wet side. This change in moisture content is shown by the dashed line labeled 2 (Fig. 11). The line is slanted downward because almost always some swelling will occur upon saturation. A large decrease in strength will occur (see plot for 13 percent moisture , Fig. 9) and the CBR values will be very low, in the order of 1 to 3. With continuous traffic on the pavement, distress in the form of cracking or displacement will develop quickly. In this case, the proof-rolling was wasted and, furthermore it produced a false sense of security. ·
The case illustrated by the dashed line labeled 3 (Fig. 11) results when the moisture content increases moderately to· about optimum while traffic is being applied, with resulting densification. There is a gain in strength as moisture content increases, and the only effect on the structure is settlement in the wheel paths. The density increase is approximately 6 lb, or 5. 7 percent. This percentage of densification in a 12-in. layer would produce 0. 7-in. settlement, enough to hold water during rains. Again, the proof-rolling did not accomplish the desired results. The deficiencies are not as severe as in the previous case , but the deficiency will require correction.
The circle at 102-pcf density and 19 percent moisture (Fig. 12) shows the effect of proof-rolling on a material when the moisture content is above the desired value for compaction at the time proof-rolling is started. The high moisture content could be caused by the material being placed too wet or by an increase in moisture from rain between the time of normal compaction and proof-rolling or by a ground-water condition. As proof-rolling is applied, the density increases with coverages. By reference to the plot for 19 percent moisture (Fig. 9), it can be seen that at a density 102-pcf density, the strength is fairly low (CBR about 4) but as density increases the strength builds up. However, as the density crosses the line of optimums, there is a drastic loss of strength and the CBR drops to values of 1 to 2. Weaving develops under the roller and cracking occurs in the surface of the layer being rolled. The situation can be corrected by removing the material, drying it out to the proper moisture contents , replacing it, and compacting it properly. Where the moisture increase was due to a ground-water condition, the ground-water condition roust be corrected or another design must be employed. In this case, the proof-rolling accomplished something. It located wet material that would subsequently have caused trouble on the road, and in this sense it was not wasted.
Some engineers advocate limiting the proof-rolling so that it will not increase the density of materials on the wet side of the optimum to a point where the decrease in strength occurs (Fig. 13, solid line labeled 1) . Proof-rolling increased the density from 102 to 104 pcf, and it was stopped before loss in CBR occurred and weaving developed. Future performance would depend on the rate at which drying occurred and the rate at which traffic was applied. The dashed line labeled 2 (Fig. 13) illustrates the case where no drying occurred before traffic was applied. Traffic would produce densification; and when the density reached the line of optimums, the drastic loss in
115 ~LINE OF OPTIMUMS " ~ DESIRABLE ZONE OF MOISTURE
· CONTENT DUil/NG COMPACTION
~110 ""
i10s .... """
IOU 12 14 16 18 20 MOISTURE CONTENT-%
Figure 13. Effect of partial proof-rolling when moisture content is too high.
strength described above would occur and distress from cracking and displacement would develop. If drying occurred at a rate such that the combination of moisture and density did not plot above the line of optimums (dashed line labeled 3, Fig. 13), there would be a gain in strength but settlement would occur which would result in grooving in the wheel paths .
OVERROLLING
Figure 14 shows that moderate overrolling during the proof-rolling procedures is not serious. Overrolling refers to the application of a greater com-

19
paction effort, through lead and/or repetitions, than is needed. The "normal" curve indicates the compaction effort produced by normal construction rolling, and it is assumed that this duplicates closely the compaction effort that will be produced by traffic on the finished surface. In addition, three other curves represent 5, 30, and 100 coverages with a specified roller. It is recognized that the 100-coverage level is entirely impractical, but it is shown merely as an example of excessive overrolling. Three levels of compaction effort could also be achieved by using three tire pressures or, if substantial depths are being considered, by using 50-, 100-, and 200-ton rollers. As previously demonstrated, the effect produced by the rollers will vary with moisture content. On the dry side, for example 13 percent moisture, the use of 30 or 100 coverages of overrolling would improve the situation and would produce no detrimental effects, whereas the underrolling with 5 coverages would leave much to be desired. At about optimum, 16 percent moisture, the 5-coverage level would leave much to be desired, the 30-coverage level would not be detrimental, but the 100-coverage level would probably push the density far enough above the line of optimum to cause serious loss of strength. Serious overrolling may weaken materials that would not be weakened under traffic. At the high moisture contents, about 19 percent, all three levels of proofrolling would have about the same effect in that they would cause serious loss of strength.
It appears that excessive overrolling should be avoided both from the standpoint of economics and because excessive overrolling may weaken materials that would not be weakened by traffic. A moderate amount of overrolling would not be detrimental, and it appears desirable to adopt a conservative approach and specify proof-rolling that produces a moderately higher compaction effort than normal rolling.
An exception to the situation described above can occur in a base course or other material which is cohesionless or practically so. Proof-rolling may produce displacement and rutting of the surface of such a material which would not occur under traffic. If the proof-rolling is to be effective, the surface of materials of this type must be stabilized to the extent that it will not displace when rolled.
t:: =
115
S COV PROOF ROLLING I
DESIRA6LE IONE Of MOISTURE CONTENT DURING COMPACTION
100 12 14 16 18 20 MOISTURE CONTENT-%
CONTACT PRESSURE VS INFLATION PRESSURE
The true measure of the effect of compaction with a rubber-tired roller is the contact pressure between the tire and the layer on which it operates. Measurement of the contact pressure is fairly difficult. Without electronic pressure gages, the average contact pressure is the only value that can be obtained feasibly. This average value is obtained by jacking up the roller
Figure i4. Effect of over-rolling during wheel, coating a portion of the tread of the proof-rolling. roller tire with mimeograph ink or some
similar material, and lowering the tire on a sheet of paper resting on a firm surface. The print on the paper gives the area of
tire contact under a static condition. This area is divided into the load to obtain an average contact pressure. Studies made at the Waterways Experiment Station with small electronic pressure gages and those made by others with other types of gages show that the contact pressure between a tire and the layer it is operating on is not uniform, and there are areas where the pressure is considerably higher than the average and also areas where the pressure is lower than the average. The pattern varies considerably with the firmness of the surface and is different for the rolling and for the static condition. The difficulty of measuring the average contact pressure and the variation that occurs in actual contact pressure within the tire print area are such that measurement of the tire print does not appear warranted. Inflation pressure can be measured readily, and this measurement is adequate for construction control purposes.

20
CONCLUSIONS
The following conclusions covering proof-rolling when properly specified are warranted:
1. If the moisture content is in the proper range for compaction, proof-rolling will correct compaction deficiencies.
2. If the moisture content is well on the wet side of optimum, proof-rolling will locate this condition and thus permit correction of the condition during construction.
3. If the moisture content is on the dry side of the proper range for compaction, proof-rolling gives a false sense of security, because the layer looks firm and hard; but as moisture increases, the layer will either lose strength drastically or will compact further under traffic.
4. Moderate overrolling during proof-rolling will not be detrimental, but excessive overrolling should not be applied since it may weaken materials that would not be weakened by traffic.
Based on these considerations, it should be apparent that proof-rolling is not a panacea to end all compaction problems and replace inspection. Proof-rolling is an excellent tool that will assist in overcoming compaction deficiencies and will locate wet materials, but it cannot replace good inspection and proper construction-control testing.
ACKNOWLEDGMENTS
This paper is based primarily on data collected by the U.S. Army Engineer Waterways Experiment Station, Vicksburg, Mississippi, as a part of the studies on development of flexible pavement design criteria for Air Force and Army airfields. Acknowledgment is also made to Edward C. Cothran, Executive Director, Carolina Asphalt Association, for suggesting this paper.
REFERENCES
1. Porter, 0.J., "The Use of Heavy Equipment for Obtaining Maximum Compaction of Soils." American Road Builders Tech. Bul. 109 {1946).
2. "Guide Specifications for Military Construction, Graded-Crushed-Aggregate Base Course." Corps of Engineers, Office, Chief of Engineers, CE 807. 012 {Int) (May 21, 1957).
3. "Proof-Test Section, Columbus Air Force Base." Tech. Rpt. 3-490, Waterways Experiment Station, Corps of Engineers (December 1958).
4. Proctor, R.R., "Description of Field and Laboratory Methods." Engineering NewsRecord, Vol, III, No. 10, {September 1933).
5. "The California Bearing Ratio Test as Applied to the Design of Flexible Pavements for Airports." Tech. Memo. 213-1, Waterways Experiment Station, Corps of Engineers (July 1945).
6. Turnbull, W. J. and Foster, C.R., "Stabilization of Materials by Compaction." ASCE Transactions 123:1 {1958).
7. "Soil Compaction Investigation." Tech. Memo. 3-271, Rpt. No. 7, "Effect on Soil Compaction of Tire Pressure and Number of Coverages of Rubber-Tired Rollers and Foot-Contact Pressure of Sheepsfoot Rollers." Waterways Experiment Station, Corps of Engineers (June 1956).
8. · "Soil Compaction Investigation." Tech. Memo. 3-271, Rpt. No. 2, "Compaction Studies on Silty Clay." Waterways Experiment Station, Corps of Engineers (July 1949).
9. "Investigations of Pressures and Deflections for Flexible Pavements." Tech. Memo. 3~323, Rpt. No. 1, "Homogeneous Clayey-Silt Test Section." Waterways Experiment Station, Corps of Engineers (May 1951).
10. "Soil Compaction Investigation." Tech. Memo. 3-271, Rpt. No. 8, "Effect of Lift Thickness and Tire Pressure." Waterways Experiment Station, Corps of Engineers {October 1957).
21
11. Woodson, D.D. , "Designing Flexible Pavements (Virginia)." HRB Research Report 16-B (1954).
12. "Engineering and Design Manual, Flexible Airfield Pavements." Corps of Engineers, Office, Chief of Engineers, .EM 1110-45-302 (August 15, 1958).
13. Foster, C.R. , "Reduction in Soil Strength with Increase in Density." ASCE Transactions 120:803 (1955).
Discussion W. H. CAMPEN AND L. G. ERICKSON, Omaha Testing Laboratories -In the first part of the paper the authors have shown the relationships of density and moisture with strength in a very clear manner. In particular they have shown that the ultimate strength or CBR value is controlled principally by the amount of water which can be taken up by the soil; the amount of water that can be taken up depends on the voids, which in turn are controlled by density. Therefore, in order to evaluate dependable strength, the soil should be compacted to specified density at its corresponding moisture content on the wet side of the curve. For instance, if it is desired to place a given soil at 95 percent maximum density and the moisture-density curve shows a water content of 19 percent at this point, on the wet side, the CBR should be determined under these conditions.
The second part of the paper deals with proof-rolling. Foster and Turnbull say in effect that proof-rolling can be used to accomplish eithe1· of two things: additional densification or the detection of weak or soft areas. The writers are in agreement on these points, but wish to point out that the actual application is very difficult.
To begin with, the tire pressure and t0tal load should be varied not only in accordance with the load carrying capacity of the total layP.red system under construction, but also for each layer of the system. No doubt this can be done, but it will require a great deal of correlation. The authors indicate that these factors should be considered but no details are included in the paper.
As far as additional densification is concerned, it seems that the pneumatic-tired rollers might be used in conjunction with sheepsfoot or vibrating steel rollers as the layered system is constructed from the bottom up. However, it is believed that for highway construction the sheepsfoot roller (for plastic soils) and the vibrating steel rollers (for cohesionless soils) should suffice. There is an airfield constructed under the direction of the Corps of Engineers where 105 percent of maximum density, by the modified method was obtained by the use of vibrating rollers.
Concerning the use of heavy pneumatic-tired rollers for the detection of weak or soft areas; it is believed that its possibilities are good provided that the sizes of rollers are commensurate witb the strength of the layers on which they are applied. To repeat, the size of the roller should be such as not to overload the layer being tested. Incidentally, experience has shown that heavy sheepsfoot and steel rolle-rs, patrols, and loaded trucks will detect weak subgrades if the layers being constructed are at optimum moisture. In making such tests the criterion should be the amount of deflection. Heavily loaded trucks have been used since 1936 to test natural subgrade and superimposed layers.
CLOSURE, W. J. Turnbull and Charles R. Foster-The discussion is appreciated, and the authors find no significant difference of opinion but would like to call attention to the following items:
The writers' first paragraph states "they have shown that the ultimate strength or CBR value is controlled principally by the amount of water which can be taken up by the soil." This is an over-simplification of the problem. The future strength will be influenced as much by the molding moisture content as by the amount of moisture taken up by the soil. The authors feel that the effect of moisture content at the time of compaction on future strength has not been given the attention it deserves in soil compaction.
The authors object mildly. to rewording statements to infer "that proof-rolling can be used to accomplish either of two things: additional densification or the detection of weak or soft areas." The first conclusion states that proof-rolling will correct com-
22 tioo deficiencies; that is, produce additional densification only if the moisture con
f:n:t is in the proper range during the period of time the proof-rolling is being applied. The detection of layers deficient in strength should, of course, be accomplished with a roller which will not overload the soil.
It is' agreed that the tire pressure and total load should be varied in accordance with each layer, and the authors proposed a method of determining the necessary tire pressure, load, and number of repetitions (the latter a variable that the writer s failed to mention) in the paper . Figure 7 of the paper illustrates the pr oposed method.
There is complete agreement that density should be obtained during construction rather than waiting and attempting to obtain it with proof-rolling. In fact the ver y purpose of th,e paper is an attempt to show "that proof-rolling is not a panacea to end all compaction problems and replace inspection.;,