protein function prediction using neighbor...
TRANSCRIPT
Final Draft – 12/10/2012 – Prepared for Computational Biology And Chemistry (CBAC) journal
Protein function prediction using Neighbor Relativity in protein-protein
interaction network
Sobhan Moosavi1, Masoud Rahgozar1, Amir Rahimi2
1Database Research Group,
School of Electrical and Computer Engineering,
, University of Tehran,
Tehran, Iran
{Sobhan.moosavi, Rahgozar}@ut.ac.ir
2Department of Bioinformatics,
Institute of Biochemistry and Biophysics,
University of Tehran
Tehran, Iran
Abstract. There is a large gap between the number of discovered proteins and the number of functionally
annotated ones. Due to the high cost of determining protein function by wet-lab research, function prediction
has become a major task for computational biology and bioinformatics. Some researches utilize the proteins
interaction information to predict function for un-annotated proteins. In this paper, we propose a novel
approach called "Neighbor Relativity Coefficient" (NRC) based on proteins interaction network topology
which estimates the functional similarity between two neighbor proteins. NRC is calculated for each pair of
proteins using their graph-based features including distance, common neighbors and the number of paths
between them. In order to assign functions to an un-annotated protein, NRC estimates a weight for each
neighbor to transfer its annotation to the un-annotated protein. Finally, the un-annotated protein will be
annotated by the top score transferred functions. We also investigate the effect of using different coefficients
for various types of functions. The proposed method has been evaluated on Saccharomyces cerevisiae and
Homo sapiens interaction networks. The performance analysis demonstrates that NRC yields better results in
comparison with previous protein function prediction approaches that use protein interaction network.
Keywords: Protein function prediction, Neighbor Relativity Coefficient, Path connectivity, Protein
Interaction network
1. Introduction
The increasing number of proteins with unknown functions in the post genomic era has opened an important
challenge for computational methods to predict functions for un-annotated proteins. In the past decade, several
approaches have been developed which use protein-protein interaction networks information. These approaches
can be categorized into two main groups: direct annotation schemes and module assisted schemes (Sharan et al.,
2007). The first group uses protein connections for function prediction by a general assumption that the closer
proteins in the network have more chance to have similar functions. The second group tries to identify some
modular clusters in the network and assigns function to un-annotated proteins based on the known functions in
the related cluster. In direct annotation group, neighborhood counting (Schwikowski et al., 2000) is the simplest
approach which counts the frequency of functions among direct neighbors of an un-annotated protein and then,
selects the top k frequent functions and assigns them to the protein. According to (Deng et al., 2003; Ahmed et
al., 2011; Wong, 2011) the shortcomings of neighborhood counting method are as follows: (a) ignoring the full
topology of the network and considering only direct neighbors; (b) taking equal weights for all interactions in
the network; (c) lack of significance level for function assignment; and (d) neglecting function frequency in the
Final Draft – 12/10/2012 – Prepared for Computational Biology And Chemistry (CBAC) journal
entire interaction network. In (Hishigaki et al., 2001), the authors proposed to use the chi-square distribution to
predict protein functions, based on function density among protein neighbors and provided a significance level
for function assignment. They also proposed to use the n-neighborhood to exploit the topology of the network
for function prediction. However, they did not consider any difference between the proteins with different
network distances. In (Chua et al., 2006), the authors used first and second level neighbors of an un-annotated
protein and assigned them different weights according to the network topology. This method also considers
reliability of interactions between protein pairs and function frequency in the entire network and could
overcome the neighborhood counting and chi-square methods in results.
In the second group, as stated in (Sharan et al., 2007), some of module assisted methods (Brun et al., 2003;
Milenkovic and Przulj, 2008) used only the information extracted from network topology; and some
others(Hanisch et al., 2002; Ideker et al., 2002; Luscombe et al., 2004; Balazsi et al., 2005; Wachi et al., 2005)
used further sources of information such as gene expression measurements. Although a comprehensive and
systematic study is needed to confirm the results; according to some primary evaluation, the prediction
performance of the direct methods is more accurate than the module-assisted methods (Sharan et al., 2007).
In this paper, we propose a novel approach named “Neighbor Relativity Coefficient” (NRC) which can be
considered as a direct annotation scheme, according to the aforementioned categorization. NRC is an indicator
which determines the influence of each neighbor for assigning function to an un-annotated protein. The results
show that the performance of this approach is higher than other state of the art methods in protein function
prediction that use protein-protein interaction network.
2. Material and Method
2.1. The datasets
The Core datasets of the molecular interaction networks of Saccharomyces cerevisiae and Homo sapiens
(release 10/27/2011) were downloaded from the Database of Interacting Proteins (DIP) 1 (Xenarios et al., 2000;
Xenarios et al., 2001). We also used the Gene Ontology (GO) 2 description of proteins functions which was
obtained from UniProt website3.The GO system is a hierarchical set of functions which contains three
categories: Cellular-component, Molecular-function and Biological-process (Ashburner et al., 2000). In this
system, each protein may be annotated by several GO terms in each category. The functionally un-annotated
proteins and the interactions with other organisms’ proteins were filtered out from the original datasets to make
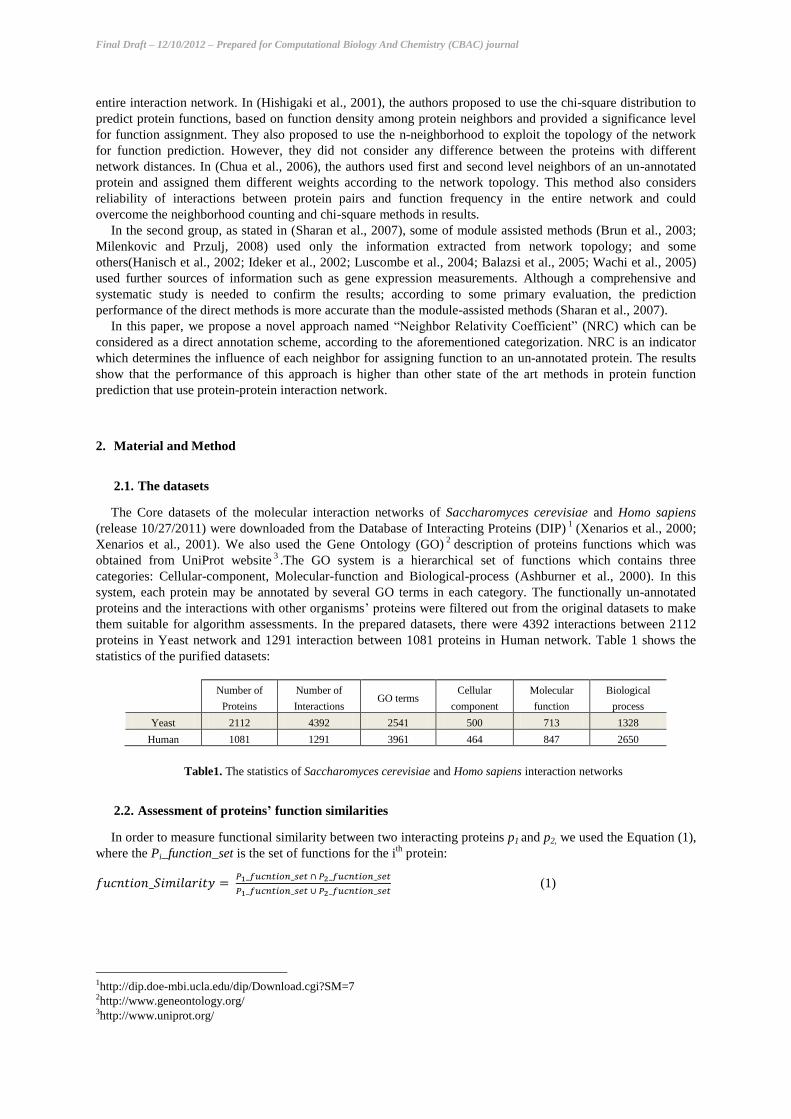
them suitable for algorithm assessments. In the prepared datasets, there were 4392 interactions between 2112
proteins in Yeast network and 1291 interaction between 1081 proteins in Human network. Table 1 shows the
statistics of the purified datasets:
Number of
Proteins
Number of
Interactions GO terms
Cellular
component
Molecular
function
Biological
process
Yeast 2112 4392 2541 500 713 1328
Human 1081 1291 3961 464 847 2650
Table1. The statistics of Saccharomyces cerevisiae and Homo sapiens interaction networks
2.2. Assessment of proteins’ function similarities
In order to measure functional similarity between two interacting proteins p1 and p2, we used the Equation (1),
where the Pi_function_set is the set of functions for the ith
protein:
(1)
1http://dip.doe-mbi.ucla.edu/dip/Download.cgi?SM=7 2http://www.geneontology.org/ 3http://www.uniprot.org/

Final Draft – 12/10/2012 – Prepared for Computational Biology And Chemistry (CBAC) journal
2.3. Proposed algorithm
We propose a novel approach for assigning function to an un-annotated protein based on its neighbor’s
functional annotation by estimating the proteins relativity. The main concept of our approach is based on the
assumption that the more interacting protein pairs are more likely to have common functional properties than the
less interacting pairs. NRC determines the weight of each neighbor in assigning its functions to an un-annotated
protein as defined by Equation (2). In this equation, NRC is calculated for each protein pairs in the network
using some graph-based features including their distance, their common neighbors and the number of paths
between them. In assigning function to un-annotated proteins, each neighbor scores up its functions as candidate
functions regarding to its NRC value. Finally, the candidate functions with higher scores will be assigned to the
un-annotated protein.
( ) ( ) (∑
( ) )
| |
| | | | | | (2)
In the above Equation, u and v are representing two proteins which have the maximum x-step distance in the
interaction network. Fx(d) is a function of the distance between two interacting proteins and defined by Equation
(3). In Fx(d), β is a constant that varies for three GO categories (table 2) due to different reduction rates of
function similarity upon distance in each category (Figure 2).
( ) {
(3)
We have proposed “protein path connectivity” as a new measure for network connectivity which is used in
NRC Equation. Protein path connectivity is based on paths between two proteins in interaction network and is
calculated as follows:
( ) ∑ ( ) (4)
Here, Ux is the set of all paths between u and v with maximum length x; and p is a path with the length L(p)
as a member of Ux. According to this definition, proteins with more paths and shorter path-lengths are more
tightly connected in the interaction network. Figure1 shows an example for calculation of this new measure.
Figure1. Calculation of Proteins_path_Connectivity for a pair of nodes in a sample graph
Similar to the propositions in (Brun et al., 2003; Chua et al., 2006), we propose another measure for proteins
relativity called Common Neighbor Ratio which is defined as follows:
( ) | |
| | | | | | (5)
Here, Nu is a set of proteins containing u and all direct neighbors of u; and Nv is a set which includes v and all
direct neighbors of v. The coefficient α is a constant to tune the effect of the number of common neighbors; and
is determined experimentally by grid search (table 2).
Final Draft – 12/10/2012 – Prepared for Computational Biology And Chemistry (CBAC) journal
Saccharomyces cerevisiae Homo sapiens
α β α β
Cellular-Component 2 1.5 1.2 0.4
Molecular-Function 1.1 1.2 1.1 0.3
Biological-Process 1.1 1.4 1.0 1.1
Table2. The values for tuning parameters of NRC Equation (α and β) which are determined by grid search.
2.4. Assessment of algorithms
The Leave-One-Out procedure was used to compare function prediction power of NRC with three well-
known methods including: the neighborhood counting (Schwikowski et al., 2000), chi-square (Hishigaki et al.,
2001) and FS-Weight (Chua et al., 2006; Chua et al., 2007). Since NRC uses both direct and indirect neighbors’
information for function prediction, analysis on other methods have been executed in two levels: in the first
level (tagged with #1), only direct neighbors have been considered; and in the second level(tagged with #1&2),
both direct and indirect neighbors were used to predict function by aforementioned methods. Three comparison
measures: Precision, Recall and F-Score values were calculated for different methods using the following
Equations where kp is the number of correctly predicted functions for protein p, mp is the total number of
functions predicted for protein p and np is the number of all known functions of protein p.
∑
∑ (6)
∑
∑ (7)
( )
( ) (8)
3. Results
3.1. The relationship between function similarity and network distance
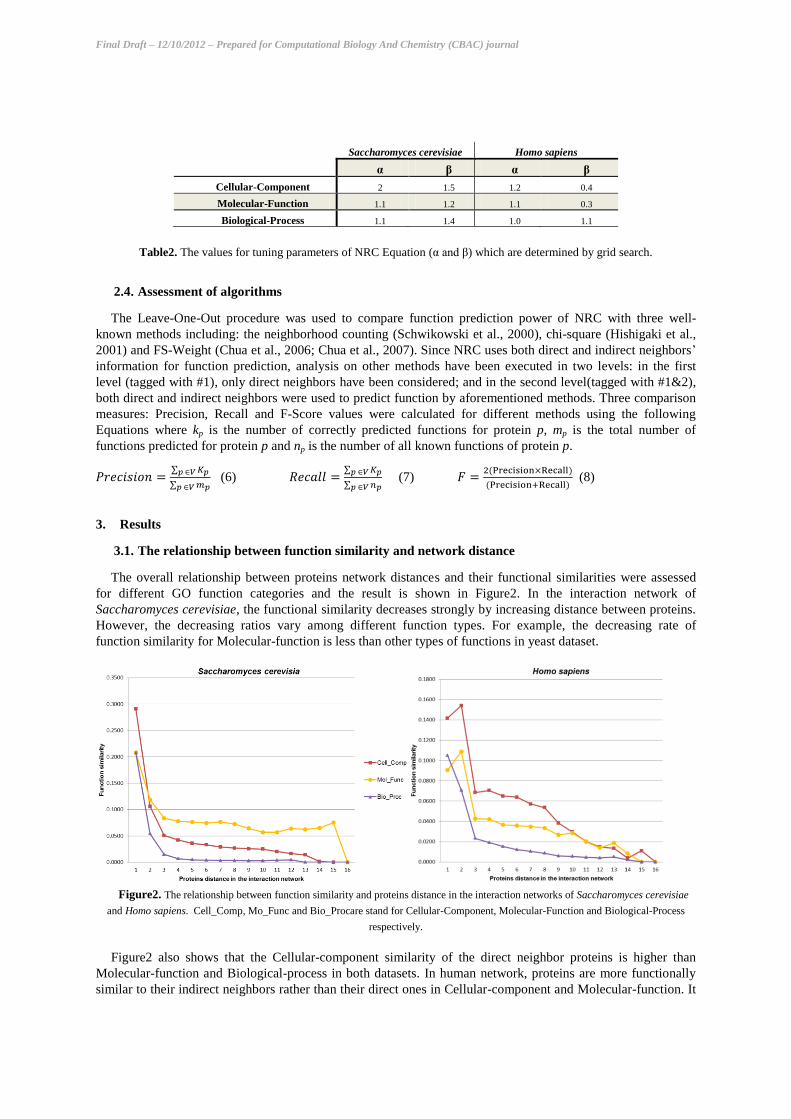
The overall relationship between proteins network distances and their functional similarities were assessed
for different GO function categories and the result is shown in Figure2. In the interaction network of
Saccharomyces cerevisiae, the functional similarity decreases strongly by increasing distance between proteins.
However, the decreasing ratios vary among different function types. For example, the decreasing rate of
function similarity for Molecular-function is less than other types of functions in yeast dataset.
Figure2. The relationship between function similarity and proteins distance in the interaction networks of Saccharomyces cerevisiae
and Homo sapiens. Cell_Comp, Mo_Func and Bio_Procare stand for Cellular-Component, Molecular-Function and Biological-Process
respectively.
Figure2 also shows that the Cellular-component similarity of the direct neighbor proteins is higher than
Molecular-function and Biological-process in both datasets. In human network, proteins are more functionally
similar to their indirect neighbors rather than their direct ones in Cellular-component and Molecular-function. It
Final Draft – 12/10/2012 – Prepared for Computational Biology And Chemistry (CBAC) journal
might be the consequence of the fact that the human interaction network is not as saturated as yeast interaction
network (Hart et al., 2006) and more direct interactions might be discovered by future researches.
3.2. Function prediction assessment
Since the ability of NRC method in assigning function to un-annotated proteins was assessed on
Saccharomyces cerevisiae and Homo sapiens networks, the same evaluation were implemented for the other
three methods (Schwikowski et al., 2000; Hishigaki et al., 2001; Chua et al., 2006).
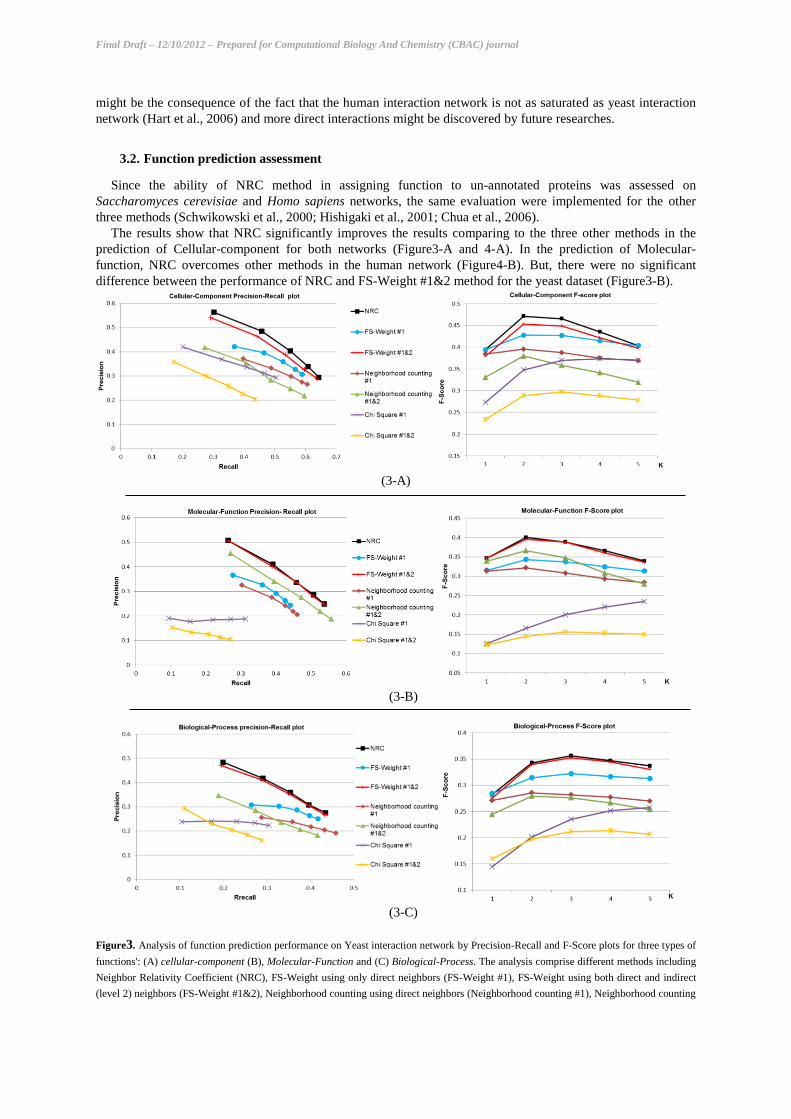
The results show that NRC significantly improves the results comparing to the three other methods in the
prediction of Cellular-component for both networks (Figure3-A and 4-A). In the prediction of Molecular-
function, NRC overcomes other methods in the human network (Figure4-B). But, there were no significant
difference between the performance of NRC and FS-Weight #1&2 method for the yeast dataset (Figure3-B).
(3-A)
(3-B)
(3-C)
Figure3. Analysis of function prediction performance on Yeast interaction network by Precision-Recall and F-Score plots for three types of
functions': (A) cellular-component (B), Molecular-Function and (C) Biological-Process. The analysis comprise different methods including
Neighbor Relativity Coefficient (NRC), FS-Weight using only direct neighbors (FS-Weight #1), FS-Weight using both direct and indirect
(level 2) neighbors (FS-Weight #1&2), Neighborhood counting using direct neighbors (Neighborhood counting #1), Neighborhood counting
Final Draft – 12/10/2012 – Prepared for Computational Biology And Chemistry (CBAC) journal
using both level 1 and 2 neighbors (Neighborhood counting#1&2), Chi-Square with n=1 (Chi Square #1) and Chi-Square with n=2 (Chi
Square #1&2).
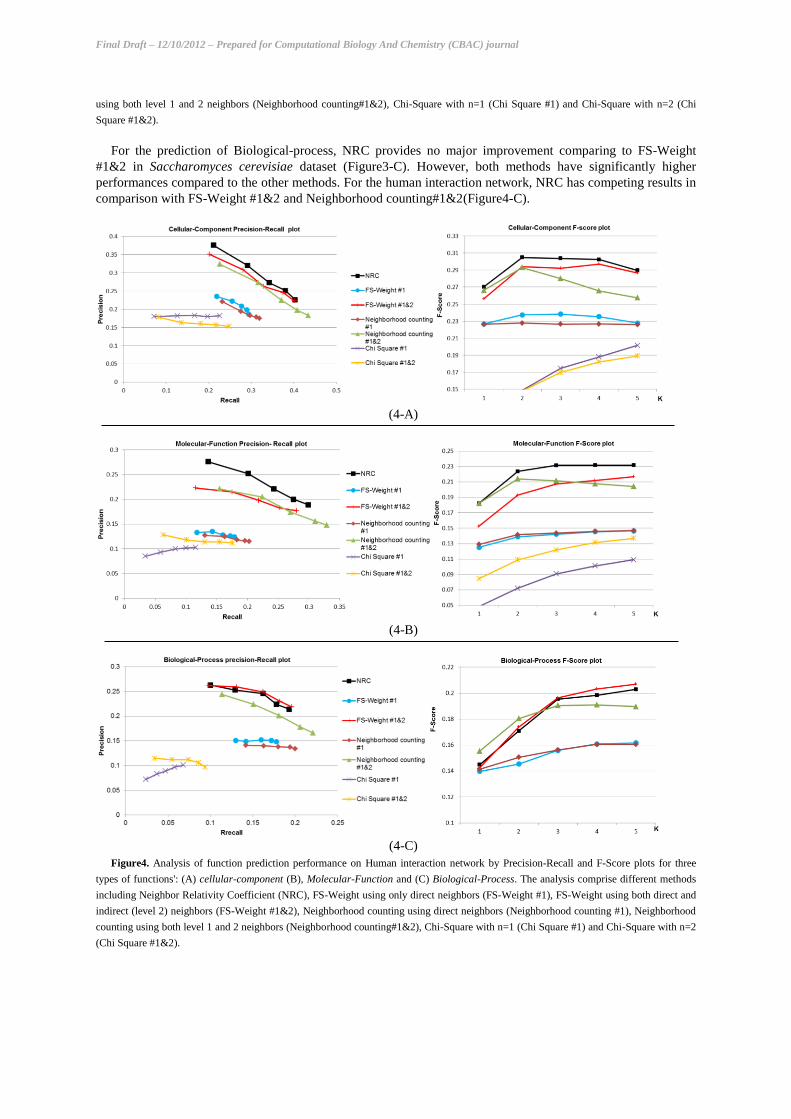
For the prediction of Biological-process, NRC provides no major improvement comparing to FS-Weight
#1&2 in Saccharomyces cerevisiae dataset (Figure3-C). However, both methods have significantly higher
performances compared to the other methods. For the human interaction network, NRC has competing results in
comparison with FS-Weight #1&2 and Neighborhood counting#1&2(Figure4-C).
(4-A)
(4-B)
(4-C)
Figure4. Analysis of function prediction performance on Human interaction network by Precision-Recall and F-Score plots for three
types of functions': (A) cellular-component (B), Molecular-Function and (C) Biological-Process. The analysis comprise different methods
including Neighbor Relativity Coefficient (NRC), FS-Weight using only direct neighbors (FS-Weight #1), FS-Weight using both direct and
indirect (level 2) neighbors (FS-Weight #1&2), Neighborhood counting using direct neighbors (Neighborhood counting #1), Neighborhood
counting using both level 1 and 2 neighbors (Neighborhood counting#1&2), Chi-Square with n=1 (Chi Square #1) and Chi-Square with n=2
(Chi Square #1&2).

Final Draft – 12/10/2012 – Prepared for Computational Biology And Chemistry (CBAC) journal
4. Discussion
In this study, we have proposed an approach for protein function prediction based on protein-protein
interaction network. This method attributes the functions of neighbor proteins to un-annotated protein using
their graph-based relativity. The results demonstrate that using NRC as an influencing coefficient for each
neighbor in assigning function to un-annotated proteins increases the prediction performance. In order to
estimate functional relativity of two proteins, NRC combines various topological aspects of the network
including distance of proteins in the network, common neighbor ratio and the number of paths between them.
Each of these factors represents a different aspect of relation between two proteins in the network. Combination
of these factors in the NRC equation provides an appropriate estimate of functional relativity of two proteins.
The distribution of functional similarity in the network is different for various GO function types. So, using
different tuning parameters (α and β) for each GO function type is an advantage of NRC compared to the other
methods. The appropriate performance of NRC on both human and yeast interaction networks reveals the
generality and the stability of this method.
For Chi-Square methods (Chi-Square #1 and Chi-Square #1&2), the weak prediction outcomes may be the
result of network sparseness in this investigation. As claimed in (Hishigaki et al., 2001), the Chi-Square method
works better on dense parts of interaction network.
Excluding the Chi-Square method, using level 1 and 2 neighbors simultaneously increases the prediction
performance for all others. The neighborhood counting method, despite its simplicity, has notable performance
when uses both level 1 and 2 neighbors. However, since it does not consider any difference between direct and
indirect neighbors, it produces lower performance than NRC and FS-Weight #1&2 in most cases.
NRC exploits the topological information of interaction networks. This information in conjunction with other
complementary sources of information (such as frequency of each function in the network, co-occurrence of
functions in neighbors, compatibility of functions existing in one protein and the effect of interaction type on
annotation transferring from a known protein to an un-annotated interacting protein) might improve the results.
The best combination of this information for function prediction can be achieved using the state-of-the-art data-
fusion techniques.
5. Conclusion
Protein interaction networks contain helpful information for understanding the role of proteins in cells and
predicting function for un-annotated proteins. In this research, we proposed a new approach that uses topology
of protein-protein interaction networks for assigning function to un-annotated proteins. This method combines
three topological feature of interaction network to predict function relativity of each protein pairs. The proposed
approach provides a general concept of functional relativeness in the networks which can be used in defining the
relativeness of the properties of two nodes in various graph-based representations.
References
Ahmed, K.S., Saloma, N.H., Kadah, Y.M., 2011. Improving the Prediction of Yeast Protein Function Using
Weighted Protein-Protein Interactions. Theoretical Biology and Medical Modelling 8, 11-17.
Ashburner, M., Ball, C.A., Blake, J.A., Botstein, D., Butler, H., Cherry, J.M., Davis, A.P., Dolinski, K., Dwight,
S.S., Eppig, J.T., Harris, M.A., Hill, D.P., Issel-Tarver, L., Kasarskis, A., Lewis, S., Matese, J.C.,
Richardson, J.E., Ringwald, M., Rubin, G.M., Sherlock, G., 2000. Gene Ontology: Tool for the
Unification of Biology. The Gene Ontology Consortium. Nature Genetics 25, 25-29.
Balazsi, G., Barabasi, A.L., Oltvai, Z.N., 2005. Topological Units of Environmental Signal Processing in the
Transcriptional Regulatory Network of Escherichia Coli. Proceeding of the National Academy of
Sciences of the United States of The America 102, 7841-7846.
Brun, C., Chevenet, F., Martin, D., Wojcik, J., Guenoche, A., Jacq, B., 2003. Functional Classification of
Proteins for the Prediction of Cellular Function from a Protein-Protein Interaction Network. Genome
Biology 5, 6-17.
Chua, H.N., Sung, W.K., Wong, L., 2006. Exploiting Indirect Neighbours and Topological Weight to Predict
Protein Function from Protein-Protein Interactions. BIOINFORMATICS 22, 1623-1630.
Final Draft – 12/10/2012 – Prepared for Computational Biology And Chemistry (CBAC) journal
Chua, H.N., Sung, W.K., Wong, L., 2007. Using Indirect Protein Interactions for the Prediction of Gene
Ontology Functions. BMC Bioinformatics 8, 8-20.
Deng, M., Zhang, K., Mehta, S., Chen, T., Sun, F., 2003. Prediction of Protein Function Using Protein-Protein
Interaction Data. Journal of Computational Biology 10, 947-960.
Hanisch, D., Zien, A., Zimmer, R., Lengauer, T., 2002. Co-Clustering of Biological Networks and Gene
Expression Data. BIOINFORMATICS 18, 145-154.
Hart, G.T., Ramani, A.K., Marcotte, E.M., 2006. How Complete Are Current Yeast and Human Protein-
Interaction Networks? Genome Biology 7, 120-128.
Hishigaki, H., Nakai, K., Ono, T., Tanigami, A., Takagi, T., 2001. Assessment of Prediction Accuracy of
Protein Function from Protein--Protein Interaction Data. Yeast 18, 523-531.
Ideker, T., Ozier, O., Schwikowski, B., Siegel, A.F., 2002. Discovering Regulatory and Signalling Circuits in
Molecular Interaction Networks. BIOINFORMATICS 18, 233-240.
Luscombe, N.M., Babu, M.M., Yu, H., Snyder, M., Teichmann, S.A., Gerstein, M., 2004. Genomic Analysis of
Regulatory Network Dynamics Reveals Large Topological Changes. Nature 431, 308-312.
Milenkovic, T., Przulj, N., 2008. Uncovering Biological Network Function Via Graphlet Degree Signatures.
cancer informatics 6, 257-273.
Schwikowski, B., Uetz, P., Fields, S., 2000. A Network of Protein-Protein Interactions in Yeast. Nature
Biotechnology 18, 1257-1261.
Sharan, R., Ulitsky, I., Shamir, R., 2007. Network-Based Prediction of Protein Function. Molecular Systems
Biology 3, 88-100.
Wachi, S., Yoneda, K., Wu, R., 2005. Interactome-Transcriptome Analysis Reveals the High Centrality of
Genes Differentially Expressed in Lung Cancer Tissues. BIOINFORMATICS 21, 4205-4208.
Wong, L., 2011. Using Biological Networks in Protein Function Prediction and Gene Expression Analysis.
Internet Mathematics 7, 274-298.
Xenarios, I., Fernandez, E., Salwinski, L., Duan, X.J., Thompson, M.J., Marcotte, E.M., Eisenberg, D., 2001.
Dip: The Database of Interacting Proteins: 2001 Update. Nucleic Acids Research 29, 239-241.
Xenarios, I., Rice, D.W., Salwinski, L., Baron, M.K., Marcotte, E.M., Eisenberg, D., 2000. Dip: The Database
of Interacting Proteins. Nucleic Acids Research 28, 289-291.