prototype bea-bls industry-level production account for ... › sites › default › files ›...
TRANSCRIPT

A Prototype BEA/BLS Industry‐Level Production Account for the United States
Susan Fleck* Steven Rosenthal* Matthew Russell** Erich H. Strassner**
Lisa Usher*
Final version: November, 2012
Presented at 2nd World KLEMS Conference
Harvard University Cambridge, Massachusetts
August 9‐10, 2012
*Office of Productivity and Technology, Bureau of Labor Statistics, U.S. Department of Labor;
Washington, DC 20212. Contacts: Susan Fleck, Email: [email protected] , Steven Rosenthal,
Email: [email protected], and Lisa Usher, Email: [email protected]
** Industry Economic Accounts, Bureau of Economic Analysis, U.S. Department of Commerce; Washington, DC 20230. Contacts, Matthew Russell, Email: [email protected], Erich H. Strassner, Email: [email protected] The views expressed in this paper are solely those of the authors and are not necessarily those of the Bureau of Economic Analysis, U.S. Department of Commerce and Bureau of Labor Statistics, U.S. Department of Labor.

1
A Prototype BEA/BLS Industry‐Level Production Account for the United States
By Susan Fleck, Steven Rosenthal, Matthew Russell, Erich H. Strassner, and Lisa Usher
In recent years, much interest has been paid to structural changes at the industry level in the
United States economy and their implications for competitiveness. The most‐recent business
cycle and subsequent recovery have furthered these interests in understanding the sources of
economic growth, including output, input, and multifactor productivity (MFP) growth across all
industries—both goods‐ and services‐producing industries—in the U.S. economy.
Gross Domestic Product (GDP) by Industry statistics provide detailed information on the
industry sources of aggregate value added growth, but do not include estimates of the
contributions of capital and labor inputs and MFP to economic growth. MFP measures the
output per unit of capital, labor, and intermediate inputs, and is an important component of
growth in GDP. MFP growth is calculated as the growth that cannot be explained by changes in
the combined contribution of these factor inputs. The official MFP measures provide
information on components of economic growth in the market economy; but they do not
report detailed information on the nonmarket economy. While these two sets of statistics
share a common economic accounting framework; in the United States, they are prepared by
two separate agencies. GDP statistics are published by the Bureau of Economic Analysis (BEA),
U.S. Department of Commerce and MFP and labor productivity statistics are published by the
Bureau of Labor Statistics (BLS), U.S. Department of Labor. Differences in concepts and
methods used by each agency persist due to the different nature of each program, but each
statistical program depends on the other to prepare its measures.
This paper builds on the GDP by industry statistics produced by the BEA and the capital, labor
and MFP statistics produced by the BLS to assemble an industry‐level production account for
the United States that is consistent with GDP. The key feature of this internally‐consistent
We thank Billy Jolliff, Sarah Osborne, and Peter Kuhbach of the Bureau of Economic Analysis and Kevin Delaney, Mark Dumas, Bhavani Khandrika, and Randall Kinoshita of the Bureau of Labor Statistics for substantial contributions to the development of this prototype account. Carol E. Moylan of BEA and John Ruser of BLS provided valuable guidance to this project. We are also grateful to Dale Jorgenson, Mun Ho, and Jon Samuels for their advice and consultation throughout this project and also for sharing underlying datasets from their work which proved to be of great benefit in developing this account.

2
prototype account is to provide values, prices, and quantities of outputs and inputs used in the
industry production process. This set of accounts allows one to decompose the industry
contributions of inputs and MFP to the sources of GDP growth at the aggregate level.
Productivity statistics integrated with National Economic Accounts’ GDP statistics have long
been sought to provide a rich source of information for policy makers, business analysts, and
economists. The usefulness of such integrated analysis on the sources of growth within the
framework of the U.S. national income and product accounts (NIPAs) was first presented by
Jorgenson and Landefeld (2006) in A New Architecture for the U.S. National Accounts.
This effort is the latest in a series of collaborations that was formalized in 2002 between the
BEA and the BLS to better harmonize and reconcile GDP, GDP by industry, and productivity
statistics. Early work involved reconciling price differences between the two agency’s measures
of industry output to improve industry comparisons. Fraumeni, Harper, Powers, and Yuskavage
(FHPY) (2006) detailed the agency collaborations toward reconciling output measures where
common data sources were used; the authors also developed a conceptual framework and
illustrative production account for the nonfarm business sector. An important step undertaken
by BEA around this time involved integrating the National Accounts’ GDP statistics with the
annual GDP by industry and input‐output statistics (Moyer et al. 2004, Lawson et al. 2006).
Subsequently, Strassner, Medeiros, and Smith (2005) of BEA produced detailed KLEMS (K‐
capital, L‐labor, E‐energy, M‐materials, and S‐purchased services) estimates of inputs within the
framework of the integrated Industry Accounts. Harper, Moulton, Rosenthal, and Wasshausen
(2008) first implemented an integrated production account for the private business sector as
outlined by FHPY (2006), made recommendations of how to expand the production account to
cover the total economy, and presented alternative rental prices to improve the measurement
of capital services for the nonmarket economy. 1 Most recently, Harper, Khandrika, Kinoshita,
1 This analysis laid the groundwork for BLS to produce total economy measures of output per unit of input that included the coverage of non‐market production by government and nonprofit institutions. The study also developed cross‐agency understanding of the methodological differences between BLS private business measures and BEA GDP. Improved data tables with these measures are now updated on a periodic basis by both agencies “Summary Integrated Production Account Tables (April 21, 2011) are available at http://bea.gov/national/integrated_prod.htm. “1987‐2010 Total Economy Production Account Tables’ are available at http://www.bls.gov/mfp/mprdload.htm.

3
and Rosenthal (2010) of BLS integrated the BEA KLEMS statistics to publish BLS non‐
manufacturing MFP measures. 2
This paper builds on these previous efforts by developing a prototype BEA/BLS industry‐level
production account for the period 1998‐2010 on a 2002 North American Industry Classification
(NAICS) basis. The account incorporates gross output, value added, and intermediate inputs—
including energy, materials, and purchased services—statistics by industry from the BEA, and
labor and capital input measures by industry from BLS. BEA data are consistent with the
Industry Accounts’ statistics as of December 2011. The BLS labor and capital measures were
also produced in 2011, and reflect adjustments that were made where necessary to provide
consistency in concepts and coverage for this prototype account.3
We present contributions of KLEMS inputs and MFP to gross output growth at roughly the 3‐
digit NAICS level of industry detail based on a gross‐output production accounting framework. 4
The gross output concept differs from the sectoral concept used by the BLS in its industry‐level
MFP statistics. The sectoral approach excludes intermediate production and purchases that
come from within the industry (i.e., intra‐industry transactions) from both output and inputs.
This is the primary conceptual difference between the MFP measures presented here and the
official BLS productivity statistics.5 Both approaches are discussed in Schreyer (2001).
We use the gross‐output approach in this prototype, industry‐level production account because
it provides a clear crosswalk to published BEA GDP, GDP by industry, and Input‐Output
statistics, including estimates of gross output, value added, and intermediate inputs by
industry. The starting point for this prototype production account is the fundamental economic
accounting identity that under the zero profit assumption, the value of gross output equals the
2 This article also presented Domar percentage‐point contributions of these industries and sectors to private business multifactor productivity growth. 3 BLS regularly publishes labor and capital measures that are consistent with NIPA industry‐level definitions, but with differences in coverage and concepts that will be discussed later in this paper. For this account, we incorporate data across all legal forms of organization at the industry level to ensure consistency with GDP. 4 Jorgenson, Gollop, and Fraumeni (1987) and Jorgenson, Ho, and Stiroh (2005) rely on gross output measures. 5 The National Academy of Sciences (1979) (Reese) Panel to Review Productivity Statistics recommended a sectoral framework for measuring productivity. Aggregating industry‐level sectoral output to the total economy produces value‐added output. The sectoral framework provides a unifying rationale of output measurement from detailed industry to major sectors.

4
value of payments for KLEMS inputs to production, including intra‐industry transactions.6 The
complete set of accounts that we present in this paper decomposes changes in these values
over time into changes in prices and changes in quantities, thus permitting an index number
estimate of MFP growth by industry. This study also includes estimates of the Domar‐weighted
contributions of industry MFP to economy‐wide MFP. We also include illustrative results of a
labor composition adjustment to BLS labor hours for purposes of understanding its impact on
estimating the contribution of labor input and MFP by industry.7 This adjustment for labor
composition reflects the heterogeneity of each industry’s workforce and yields a symmetric
treatment of labor and capital services in this prototype, production account.
The remainder of the paper proceeds in five sections. We provide a first look at prototype
industry‐level results. We present BLS MFP productivity measures and compare them with the
industry production account results. We describe the methodology for this prototype industry‐
level account, including a description of how the various datasets are compiled. We discuss
some of the conceptual and estimation challenges that require resolution before this account
can be released on a regular basis. Lastly, we conclude with comments on possible future work
and next steps in this important collaboration.
A FIRST LOOK AT PROTOTYPE RESULTS
An important contribution of this prototype, BEA/BLS industry‐level production account is that
it can be used to trace the sources of U.S. economic growth across all goods‐ and services‐
producing industries in the U.S. economy. This prototype, integrated account presents the
contributions of both value added and intermediate input factors of production, and also the
contribution of MFP to U.S. real gross output growth, at roughly the 3‐digit NAICS industry level
as published in the U.S. Industry Economic Accounts. This section highlights the sources of U.S.
6 Intra‐industry purchases can be a relatively important source of production for certain industries; for example, the Semiconductor industry relies heavily on intra‐industry transactions to produce microprocessor chips. 7 Domar weights consist of a ratio of current dollar gross output divided by aggregate value added. These weights are unique in that they sum to more than one, reflecting the fact that an increase in an industry’s productivity has a direct effect on the industry’s output as well a secondary effect through the output of one industry delivered to another as intermediate inputs.

5
economic growth over the period 1998‐2010, including MFP trends during this period at the
industry level, and also details the contributions of each industry’s MFP to economy‐wide MFP.
Sources of U.S. Output Growth, 1998‐2010
With the development of a prototype industry‐level production account spanning all industries
integrated within an Input‐Output framework, useful information can be generated by tracing
the sources of output growth across each industry’s KLEMS inputs—both its primary, value
added inputs, and its secondary, intermediate inputs—and to MFP. Table A further
demonstrates the usefulness of such integrated analysis within a framework that is consistent
with GDP, by presenting the sources of aggregate value added growth for the United States that
are attributable to the primary, value added inputs of capital and labor, and to MFP.
Industry contributions for each input and MFP were generated and evaluated over several
periods. The contributions from at least one of the primary, value added inputs of capital and
labor, or secondary, intermediate inputs of energy, materials, and purchased services were
greater than MFP growth in more than 75 percent of the 63 industries included in this account.
In the top three industries with the largest percent changes in gross output—positive or
negative—intermediate input contributions were the largest contributor to the percent
changes in gross output, reflecting its relative weight as a well as recent trends in the sourcing
of production (Table B). In six of the top 10 industries with the strongest output growth,
intermediate inputs were the most significant factor. Negative intermediate input contributions
were the largest contributor in all but one of the ten industries that showed the largest output
decline (Table 3).
All Industry Value‐Added Growth 1.90
Aggregate Labor Contribution 0.20
College Graduate 0.46
No College Degree ‐0.25
Aggregate Capital Contribution 1.15
Aggregate MFP Growth 0.56
Table A: Aggregate factor contributions to GDP Growth, 1998‐2010
*Growth i s expressed as the di fference in natura l logs . Individua l components
may not sum to tota ls due to rounding

6
Rental and leasing and information and data processing services, two capital‐intensive
industries, were among the industries with the largest capital contributions to output growth.
The capital contribution of rental and leasing was 2.89 percentage points to output growth of
1.7 percent. Capital contributed 1.76 percentage points to real output growth of 7.8 percent
for information and data processing services.
Similarly, several labor‐intensive industries had the highest labor contribution to output growth
(see Table B and Table 3 in the appendix). Computer systems design and related services,
education services, and ambulatory health care services were among the industries with the
largest labor contributions to output growth.
In the top 10 industries ranked by size of workforce for 2010, the sources of output growth
were mixed (Table C). Among the largest employment industries ranked by size of
employment, labor was the greatest input contribution for state and local government, at 0.83
percentage point and in ambulatory health care services, at 1.60 percentage points. Among
these 10 industries, wholesale trade and retail trade were the industries which showed the
Description Capital Labor Intermediate Energy Material Service MFP Output
Support activities for mining 0.13 0.78 6.26 0.27 2.98 3.01 1.70 8.86
Securities, commodity contracts, investments ‐0.39 0.85 5.36 ‐0.02 0.10 5.28 2.52 8.33
Information and data processing services 1.76 0.34 3.93 0.03 0.60 3.31 1.77 7.81
Federal Government 0.10 0.36 2.23 0.04 0.26 1.92 0.22 2.90
Federal Reserve banks, credit intermediation,and related activities 1.38 0.12 1.93 0.00 0.03 1.90 0.67 4.10
Description Capital Labor Intermediate Energy Material Service MFP Output
Rental and leasing services and lessors of intangible assets 2.89 ‐0.11 0.22 ‐0.02 0.00 0.24 ‐1.31 1.69
Information and data processing services 1.76 0.34 3.93 0.03 0.60 3.31 1.77 7.81
Legal services 1.68 0.39 ‐0.33 ‐0.01 ‐0.05 ‐0.27 ‐1.80 ‐0.06
Broadcasting and telecommunication 1.66 ‐0.36 1.35 ‐0.01 0.28 1.08 1.79 4.44
Publishing 1.62 ‐0.41 1.05 ‐0.02 ‐0.09 1.16 0.16 2.43
Description Capital Labor Intermediate Energy Material Service MFP Output
Computer systems design and related services ‐0.13 2.30 1.54 ‐0.01 0.28 1.26 2.52 6.23
Educational services 0.21 1.67 0.96 0.03 0.16 0.77 ‐1.19 1.65
Ambulatory health care services 0.29 1.60 0.85 0.00 0.11 0.73 0.53 3.27
Warehousing and storage 0.39 1.52 1.67 0.11 0.20 1.37 0.27 3.86
Management of companies and enterprises 1.19 1.44 1.01 0.00 0.20 0.81 ‐2.54 1.11
Table B: Largest Factor Input Contributions to Output Growth 1998‐2010 [percentage point]
Largest Intermediate Contributions
Largest Capital Contributions
Largest Labor Contributions

7
greatest capital contributions as the largest contributor to output growth.8 The intermediate
inputs contribution was the largest contributor to output growth in federal government at 2.23
percentage points, led by the contribution of purchased‐services inputs. In food services and
drinking places, the intermediate input contribution of 0.74 percentage point was also led by
purchased‐services inputs. In hospitals and nursing and residential care facilities, the
intermediate inputs contribution of 1.70 percentage points was also the most significant
contributor to output growth, with, once again, purchased‐services inputs accounting for the
largest contribution. MFP growth or declines were the largest contributors to output growth or
declines in administrative and support services at 1.22 percentage points, other services at ‐
1.33 percentage points, and construction, at ‐1.33 percentage points for these selected
industries.
Labor composition
In this prototype, we decompose the labor contributions to output growth into demographic
characteristics that account for the contributions of the college‐educated workforce and those
workers that did not attend college. This adjustment to labor input allows for the contribution
of labor to reflect changes in the composition of the skill level of the labor force over time, in
addition to the number of hours worked by industry.
8 Wholesale and Retail trade output measures reflect the gross margin output concept, which subtracts the costs of goods sold from its sales and inventories and therefore also excludes them from its input costs.
Table C: Contributions to Output Growth From 10 Largest Employment Industries, 1998‐2010 [percentage point]
2010
Employment Description Capital Labor Intermediates Energy Material Service MFP Output
19541 State and local 0.19 0.83 0.68 0.01 0.12 0.55 ‐0.40 1.30
14743 Retail trade 0.99 ‐0.08 0.83 ‐0.03 0.27 0.59 0.31 2.05
9506 Food services and drinking places ‐0.04 0.47 0.74 0.01 0.00 0.72 0.45 1.63
7818 Hospitals and nursing and residential care facilities 0.27 0.96 1.70 0.02 0.11 1.57 ‐0.13 2.79
7150 Administrative and support services 0.81 ‐0.22 ‐0.08 0.00 0.04 ‐0.11 1.22 1.72
6743 Other services, except government 0.41 0.22 0.44 ‐0.02 ‐0.18 0.65 ‐1.33 ‐0.26
6024 Ambulatory health care services 0.29 1.60 0.85 0.00 0.11 0.73 0.53 3.27
5767 Construction 0.34 ‐0.30 ‐1.12 ‐0.03 ‐0.93 ‐0.16 ‐1.33 ‐2.41
5520 Wholesale trade 0.92 ‐0.17 1.21 0.00 0.28 0.93 0.76 2.71
5425 Federal 0.10 0.36 2.23 0.04 0.26 1.92 0.22 2.90

8
In over 80 percent of the industries measured, the contributions from the college workforce
were higher than those that did not attend college, reflecting the industries’ shift in demand
toward college educated workers (see Table 4 in the appendix). The median contribution of
workers with a college education was 0.07 percentage point while the non‐college educated
workers’ subtracted 0.19 percentage point from economy‐wide output growth over the period
1998‐2010.
Ranking the industries by college educated contributions shows that computer systems design
and related services, management of companies and enterprises, and education services have
the largest labor contributions to output growth (Table D).
Warehousing and storage, social assistance, and administrative and support services had the
highest labor contributions of non‐college‐educated labor to output growth.
MFP growth trends at the industry level
“High‐tech” industries showed some of the strongest MFP growth over the period 1998‐2010
(Table E). Computer and electronic product manufacturing, information and data processing
services, computer systems design and related services, and broadcasting and
telecommunications were among the industries with the largest MFP growth. These
Information‐communications‐technology‐producing industries were among the top 10
industries with MFP growth.
Description College Labor No College Labor Labor Composition
Warehousing and storage 0.26 1.27 1.52
Social assistance 0.36 0.20 1.07
Ambulatory health care services 1.07 0.53 1.60
Management of companies and enterprises 2.42 ‐0.88 1.44
Computer systems design and related services 2.10 0.20 2.30
Educational services 1.52 0.16 1.67
*Note component input contributions may not sum to total labor contributions due to rounding.
Table D: Labor Contribution, 1998‐2010 [percentage point]
No College Largest Contributions
College Largest Contributions

9
Description 1998‐2000 2000‐2007 2007‐2010 1998‐2010
Computer and electronic product manufacturing 12.2 8.5 10.7 9.6
Computer systems design and related services ‐0.5 3.1 3.2 2.5
Broadcasting and telecommunication ‐0.1 2.8 0.6 1.8
Information and data processing services ‐13.0 6.4 0.8 1.8
Oil and gas extraction ‐12.8 ‐1.0 0.1 ‐2.7
Management of companies and enterprises ‐0.3 ‐2.6 ‐3.8 ‐2.5
Legal services 0.2 ‐2.1 ‐2.4 ‐1.8
Securities, commodity contracts, investments 5.3 1.0 4.2 2.5
Apparel and leather and allied products 1.2 1.3 11.8 3.9
Construction ‐0.6 ‐2.2 0.2 ‐1.3
Table E: Multifactor Productivity Growth for Selected Industries [pe rcent change ]
From 1998‐2010, computer and electronic products manufacturing led MFP growth at an
average annual rate of 9.6 percent (See Table 2 in the appendix). This MFP growth was driven
by rising output, at a 5.5 percent average annual rate, and falling intermediate inputs, at a 6.6
percent average annual rate. Computer systems design and related services MFP grew 2.5
percent at an average annual rate, driven by strong output growth. Oil and gas extraction
showed the largest MFP decline during the period, falling at an average annual rate of 2.7
percent, driven by intermediate inputs growth of 2.2 percent. Management of companies and
enterprises and legal services were also among the industries with the largest average annual
declines in MFP, decreasing 2.5 percent and 1.8 percent at average annual rates, respectively.
Contributions to economy‐wide MFP
From 1998‐2010, the economy‐wide MFP grew at an average annual rate of 0.56 percent. Both
goods‐producing industries and services‐providing industries had positive contributions to
aggregate MFP growth through the period 1998‐2010. Services‐ producing industries
contributed about 0.23 percentage point to the economy‐wide MFP while goods‐producing
industries contributed 0.33 percentage point.
From 2000‐2007, economy‐wide MFP increased at an average annual rate of 0.61 percent,
while MFP increased at an average annual rate of 0.17percent from 2007‐2010. The goods‐
producing sector accounted for more of the increase in MFP, adding 0.14 percentage point of
the 0.17 percentage point increase from 2007‐2010.

10
Goods‐producing sector9 contributions to economy‐wide MFP
From 1998‐2010, computer and electronic products manufacturing contributed 0.33
percentage point to economy‐wide MFP, significantly more than any other industry (Table F).
The Farms industry was a distant second within the goods‐producing sector, contributing 0.04
percentage point to the increase in economy‐wide MFP. Miscellaneous manufacturing was also
among the leading contributors, adding 0.02 percentage point to economy‐wide MFP.
The contribution of computer and electronic products manufacturing to economy‐wide MFP
growth experienced a leveling‐off in recent years. Over the period studied, the contributions
from computer and electronic products manufacturing were the greatest in the 1998‐2000
period, 0.60 percentage point; in the more recent period of 2007‐2010, the contribution was
0.28 percentage point. This trend is consistent with BLS estimates of the contributions of 3‐
digit manufacturing industries to private non‐farm business MFP. 10 The trend also confirms the
accepted story of an IT‐induced productivity speed‐up in the last half of the 1990s.
Services‐producing sector11 contributions to economy‐wide MFP
From 1998‐2010, the securities, commodity contracts, and investments and broadcasting and
telecommunications industries were among the top contributors to economy‐wide MFP
9 In the U.S. Industry Economic Accounts, the goods‐producing sector consists of agriculture, forestry, fishing, and hunting; mining; construction; and manufacturing. 10 See http://www.bls.gov/mfp/mfgcon.pdf, Bureau of Labor Statistics (2012). 11 In the U.S. Industry Economic Accounts, the services‐producing sector consists of utilities; wholesale trade; retail trade; transportation and warehousing; information; finance, insurance, real estate, rental, and leasing; professional and business services; educational services, health care, and social assistance; arts, entertainment, recreation, accommodation, and food services; and other services, except government.
Description 1998‐2000 2000‐2007 2007‐2010 1998‐2010
Computer and electronic products 0.600 0.274 0.278 0.329
Farms 0.063 0.012 0.085 0.039
Miscellaneous manufacturing 0.034 0.019 0.024 0.023
Machinery ‐0.028 0.028 0.038 0.021
Nonmetallic mineral products ‐0.015 ‐0.006 ‐0.005 ‐0.007
Utilities 0.111 ‐0.023 ‐0.061 ‐0.010
Oil and gas extraction ‐0.123 ‐0.015 0.010 ‐0.027
Construction ‐0.059 ‐0.210 0.014 ‐0.129
Total Goods 0.773 0.279 0.144 0.328
Table F: Contributions to Multifactor Productivity Growth From Selected Goods Producing Industries [percentage point]

11
growth, with securities, commodity contracts, and investments contributing the most, 0.08
percentage point (Table G).
During the 2000‐2007 sub‐period, all services‐producing sector related information‐
communications‐technology producing industries added to economy‐wide MFP growth,
including publishing (which includes software publishing), broadcasting and
telecommunications, information and data processing services, and computer systems design
and related services. Wholesale trade was also among the largest contributors to MFP growth,
contributing 0.11 percentage point to economy‐wide MFP growth during this period.
From 2007‐2010, Federal Reserve banks, credit intermediation, and related activities led the
increase in aggregate MFP, adding 0.17 percentage point to MFP growth. Credit intermediation,
and related activities and securities, commodity contracts, and investments, was also among
the largest contributors to the increase in MFP over this period, increasing aggregate MFP
growth by 0.14 percentage point. These positive contributions were partly offset by negative
contributions by the real estate industry, which subtracted 0.23 percentage point.
BLS MFP and Industry Contributions to BLS MFP‐ a comparison
The output measures used in the BLS MFP measures are constructed to be as consistent as
possible with the BLS major sector labor productivity measures (except that the MFP measures
exclude government enterprises). This consistency allows BLS MFP data to help explain the
sources of growth in the official labor productivity series. In a model where capital and labor
are the measured inputs, sources of labor productivity growth include increases in capital
Description 1998‐2000 2000‐2007 2007‐2010 1998‐2010
Securities, commodity contracts, and investments 0.167 0.033 0.145 0.084
Broadcasting and telecommunications ‐0.004 0.129 0.026 0.081
Wholesale trade 0.179 0.111 ‐0.114 0.066
Administrative and support services ‐0.012 0.061 0.057 0.048
Federal Reserve banks, credit intermediation, and related activities 0.020 ‐0.006 0.171 0.043
Computer systems design and related services ‐0.008 0.048 0.057 0.041
Information and data processing services ‐0.094 0.057 0.007 0.019
Publishing industries (includes software) ‐0.115 0.041 ‐0.009 0.002
Real estate 0.193 ‐0.018 ‐0.235 ‐0.037
State and local ‐0.059 ‐0.064 ‐0.029 ‐0.055
Other services, except government ‐0.021 ‐0.065 ‐0.059 ‐0.056
Management of companies and enterprises ‐0.008 ‐0.068 ‐0.104 ‐0.067
Total Service 0.155 0.335 0.028 0.228
Table G: Contributions to Multifactor Productivity Growth From Selected Service Providing Industries [percentage point]

12
intensity (i.e., capital deepening) and improvements in the skills of the labor force (i.e., labor
composition). Additional sources of labor productivity are attributed to multifactor
productivity, which may reflect changes in a variety of factors that are not included as
measured inputs, including technology change, economies of scale, and improvements in
management techniques or organization of production, among other factors.
For BLS official estimates of private business and private nonfarm business MFP, the
relationship of aggregate multifactor productivity to aggregate labor productivity is given by the
following equation:
d(ln Y‐ ln L) = d ln A + wk[d(ln K‐ln L)] + wl [d ln LC] ,
where:
Y=output L=labor K=capital LC=labor composition d denotes the derivative with respect to time wi denotes the cost share weight of input i, ( i = k, l )
This equation shows that labor productivity growth is decomposed into the contribution of
multifactor productivity growth, the contribution resulting from K/L substitution (capital
deepening) and the contribution of the labor composition effect. This relationship between
MFP and labor productivity ties the private business and private nonfarm business MFP
measures to the official published estimates of business and nonfarm business labor
productivity, with the caveat that government enterprises is excluded.
Furthermore, the BLS industry contributions roughly sum to the official published estimates of
private business and private nonfarm business MFP. When compared to the industry‐level
Domar contributions to economy‐wide MFP for the industry production account measures
presented in this paper, the industry‐level Domar contributions to private business sector MFP
are comparable in magnitude and order. Table H below shows BLS multifactor productivity

13
growth for selected industries. For tables I and J, the Domar weighting scheme is applied based
on the relative importance of each industry to total private business MFP.
BLS MFP growth rates for selected industries
Table H shows that the BLS MFP growth rates for selected industries are similar to the industry
production account MFP growth rates. One major exception is the 2007‐2010 MFP growth rate
for apparel and leather and applied products. Computer and electronic products similarly show
the largest MFP growth of these industries, an average annual rate of 11.0% for the 1998‐2010
period.
Description 1998‐2000 2000‐2007 2007‐2010 1998‐2010
Computer and Electronic Products 14.1 9.9 11.7 11.0
Computer Systems Design and Related Services ‐1.1 3.1 3.3 2.4
Broadcasting and Telecommunications 0.4 3.3 0.5 2.1
Information and Data Processing Services ‐15.3 5.6 1.1 0.7
Oil and Gas Extraction ‐9.3 ‐0.6 ‐0.2 ‐2.0
Management of Companies and Enterprises 0.6 ‐1.1 ‐2.5 ‐1.2
Legal Services 1.3 ‐0.1 ‐1.0 ‐0.1
Securities, Commodity Contracts, and Investments 8.6 2.0 2.5 3.2
Apparel and Leather and Applied Products 2.6 4.2 2.6 3.6
Construction ‐0.2 ‐2.0 0.7 ‐1.0
Table H: BLS Multifactor Productivity Growth for Selected Industries

14
Goods‐producing sector contributions to BLS private business MFP
For the 1998‐2010 period, the industry contributions to BLS private business MFP show similar
results to the industry production account contributions. As expected, computer and electronic
products dominate the contributions to private business MFP, 0.43 percentage points,
approximately a third of the total MFP growth rate for the 1998‐2010 period.
Description 1998‐2000 2000‐2007 2007‐2010 1998‐2010
Computer and Electronic Products 0.81 0.35 0.34 0.43
Farm 0.11 0.02 0.14 0.06
Miscellaneous Manufacturing 0.05 0.03 0.05 0.04
Machinery ‐0.05 0.05 0.09 0.04
Nonmetallic Mineral Products ‐0.02 ‐0.01 0.00 ‐0.01
Utilities ‐0.22 0.10 0.08 0.04
Oil and extraction ‐0.13 ‐0.02 ‐0.03 ‐0.04
Construction ‐0.02 ‐0.25 0.07 ‐0.13
PRIVATE BUSINESS MFP 1.79 1.44 0.45 1.25
Table I. Contributions to Private Business Multifactor Productivity Growth from Selected Goods Producing Industries
Services‐producing sector contributions to BLS private business MFP
As in the industry production account measures, securities, commodity contracts, and
investments, broadcasting and telecommunications, and wholesale trade show the highest
contributions to private business multifactor productivity growth.
Description 1998‐2000 2000‐2007 2007‐2010 1998‐2010
Securities, commodity contracts, and investments 0.38 0.08 0.16 0.15
Broadcasting and telecommunications 0.02 0.19 0.03 0.12
Wholesale trade 0.19 0.19 ‐0.12 0.11
Administrative and Support Services 0.01 0.07 0.04 0.05
Federal Reserve banks, credit intermediation, and related activities 0.09 ‐0.01 0.24 0.07
Computer systems design and related services ‐0.02 0.06 0.08 0.05
Information and data processing services ‐0.16 0.08 0.01 0.02
Publishing industries (includes software) ‐0.11 0.08 ‐0.01 0.03
Real Estate 0.18 0.06 ‐0.31 ‐0.01
Other Service, except Government 0.04 ‐0.05 ‐0.04 ‐0.03
Management of Companies and Enterprises 0.02 ‐0.04 ‐0.10 ‐0.05
PRIVATE BUSINESS MFP 1.79 1.44 0.45 1.25
Table J: Contributions to Private Business Multifactor Productivity Growth from Selected Services Providing Industries
15
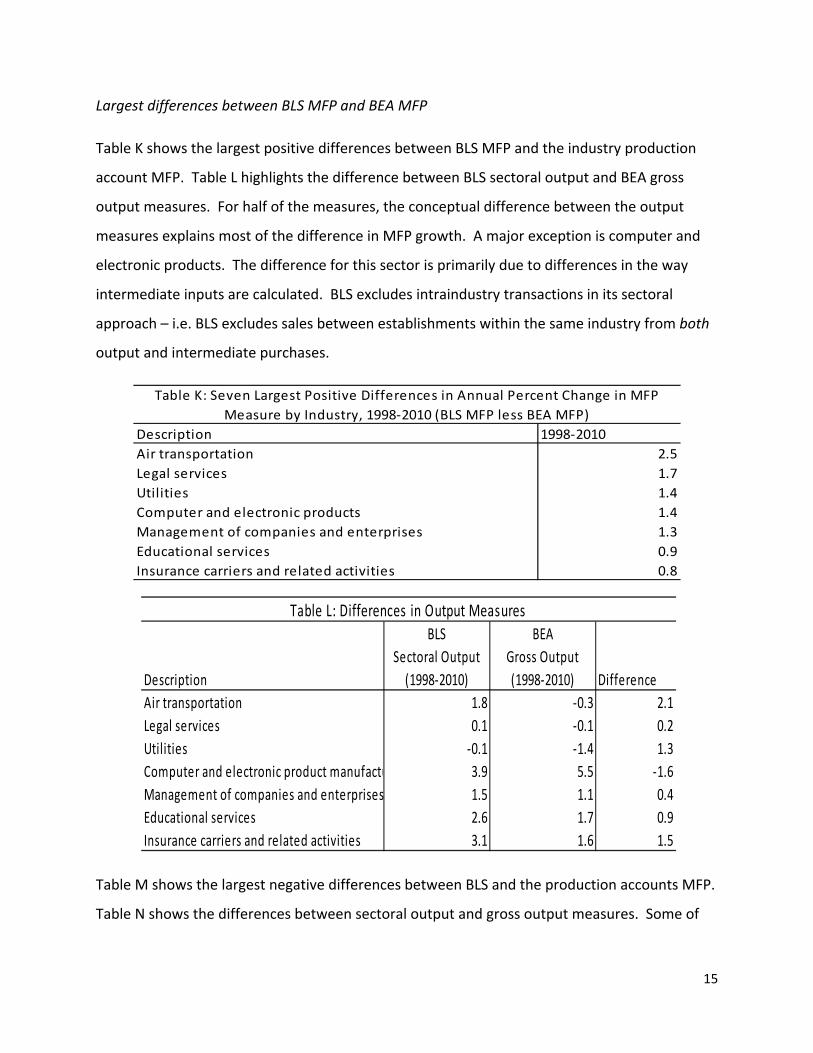
Largest differences between BLS MFP and BEA MFP
Table K shows the largest positive differences between BLS MFP and the industry production
account MFP. Table L highlights the difference between BLS sectoral output and BEA gross
output measures. For half of the measures, the conceptual difference between the output
measures explains most of the difference in MFP growth. A major exception is computer and
electronic products. The difference for this sector is primarily due to differences in the way
intermediate inputs are calculated. BLS excludes intraindustry transactions in its sectoral
approach – i.e. BLS excludes sales between establishments within the same industry from both
output and intermediate purchases.
Description 1998‐2010
Air transportation 2.5
Legal services 1.7
Utilities 1.4
Computer and electronic products 1.4
Management of companies and enterprises 1.3
Educational services 0.9
Insurance carriers and related activities 0.8
Table K: Seven Largest Positive Differences in Annual Percent Change in MFP
Measure by Industry, 1998‐2010 (BLS MFP less BEA MFP)
Description
BLS
Sectoral Output
(1998‐2010)
BEA
Gross Output
(1998‐2010) Difference
Air transportation 1.8 ‐0.3 2.1
Legal services 0.1 ‐0.1 0.2
Utilities ‐0.1 ‐1.4 1.3
Computer and electronic product manufactu 3.9 5.5 ‐1.6
Management of companies and enterprises 1.5 1.1 0.4
Educational services 2.6 1.7 0.9
Insurance carriers and related activities 3.1 1.6 1.5
Table L: Differences in Output Measures
Table M shows the largest negative differences between BLS and the production accounts MFP.
Table N shows the differences between sectoral output and gross output measures. Some of

16
the differences in MFP between the industries are due to the difference in output measures.
The rest are attributable to differences in intermediate inputs.
Description 1998‐2010
Funds, trusts, and other financial vehicles ‐1.6
Information and data processing services ‐1.1
Petroleum and coal products ‐0.6
Accommodation ‐0.6
Textile mills and textile product mills ‐0.5
Mining, except oil and gas ‐0.4
Apparel and leather and applied products ‐0.3
Table M: Seven Largest Negative Differences in Annual Percent Change in MFP
Measure by Industry, 1998‐2010 (BLS MFP less BEA MFP)
Description
Sectoral Output
(1998‐2010)
Gross Output
(1998‐2010) Difference
Funds, trusts, and other financial vehicles 2.6 2.6 0.0
Information and data processing services 8.3 7.8 0.5
Petroleum and coal products 0.7 1.4 ‐0.7
Accommodation 1.3 2.6 ‐1.3
Textile mills and textile product mills ‐5.5 ‐5.9 0.4
Mining, except oil and gas ‐1.2 ‐1.2 0.0
Apparel and leather and applied products ‐12.8 ‐12.3 ‐0.5
Table N: Differences in Output Measures
METHODOLOGY
This section provides a brief overview of the conceptual framework and estimation methods
used to prepare the prototype BEA/BLS industry‐level production account. We provide a
description of the gross‐output growth accounting framework, discuss the estimation methods
used to prepare our results, and summarize the source data methods used by BEA and BLS to

17
produce the gross output, value added, intermediate inputs, capital input, and labor input used
in this account, including adjustments we made to achieve better integration of these datasets.
Conceptual Overview of Measurement
For the prototype BEA/BLS production account framework, we assume the following type of
production function relating gross output of an industry to three factor inputs using the gross
output production function model: Q = F(K, L, II, t) where K stands for capital, L stands for
Labor, II stands for the intermediate inputs.12,13
Under the assumption of constant returns to scale, perfect competition, and factors being paid
their marginal product, the gross‐output growth model can be rearranged in terms of MFP
growth computed in the following, simplified way.
1. ∗ ∗ ∗
where Q = Gross Output K = Capital Input L = Labor Input II = Intermediate Inputs
PK = Price of Capital Pl = Price of Labor Pii = Price of Intermediate Inputs t = time
2. ∗ ∗ ∗
With the above assumptions, the unknown elasticities can be replaced with the observable
factor share, , for each input. Shown below is the factor share for capital input:
3.
12 For simplicity, we express total intermediate inputs instead of the separate cost components of energy, materials, and purchased services. 13 This model is also used by the BLS for its published measures for the business sector, with the exception that Q is sectoral output and II reflects the subtraction of intra‐industry inputs from intermediate inputs.

18
The assumption of constant returns to scale ensures that the factor shares sum to one.
4.
where 1
In discrete time, the input weights are two‐year averages of the cost shares for each input in
years t and t‐1, where v v , v ,
MFP growth can be rewritten in the following way, relating MFP growth for an industry as the
residual of the difference in the growth in output and the growth in the combined inputs:
5. MFP growth =∆lnQ ‐‐ v ∆ ln K v ∆ ln L v ∆ ln II
There are no assumptions restricting individual industries in this analysis of MFP, each industry
faces the above production function individually and without regard to any other industry.
Estimation methods – Aggregation
The MFP index is computed by dividing an index of real gross output by an index of combined
inputs. A combined real input measure is computed within a Tornqvist index number formula
that aggregates real intermediate inputs by industry for energy, materials, and purchased
services with the labor and capital input using average cost shares.14
The current‐dollar cost shares of the three main input components are generated using
published and computed datasets. The current dollar intermediate inputs measure is a sum of
the current dollar energy, material, and purchased‐services expenditures of an industry from
the BEA Annual Industry Accounts. The current dollar labor component is a measure of the
compensation of workers in that industry. The BEA published labor compensation figures are
supplemented to include the self‐employed compensation estimate that is detailed in the labor
14 BEA’s National and Industry accounts use Fisher‐ideal indexes to express official chain‐type price and quantity indexes. This study follows the productivity literature and uses the Tornqvist index for aggregation.

19
input section using the assumption that self‐employed workers receive similar wages to the
payrolled employees. Lastly, nominal capital compensation is computed as a residual of the
value of gross output less the sum of labor compensation and intermediate input
expenditures.15
The intermediate inputs average share is an industry’s current‐dollar expenditure on energy,
materials, and services divided by the value of gross‐output production averaged over two
periods. The average share for the remaining inputs is computed in a similar fashion. The
KLEMS measures are Tornqvist aggregated using the average cost shares and the quantity
indexes of each input.
Estimation Methods – Gross Output, Value Added, and Intermediate Inputs
The BEA Industry Accounts provide a time series of nominal and real gross output, intermediate
inputs, and value added for industries defined according to the 2002 NAICS (Mayerhauser and
Strassner, 2010). These accounts are integrated conceptually and statistically with final
expenditures and GDP from the NIPAs, and are prepared within a balanced input‐output
framework that allows for integrated analysis of industry output, inputs, employment, and final
demand. In 2005, these accounts were expanded to provide additional information on the
composition of intermediate inputs by industry, which made these accounts more useful to
observe changes in spending related to energy, materials, and purchased services (Strassner,
Medeiros, and Smith 2005).
The Industry Accounts methodology can be summarized in four broad steps16:
1. Prepare annual make tables. The make table shows the production of both primary and
secondary commodities (goods and services) by industries;
2. Prepare initial annual use tables. The use table shows the consumption of commodities
by industries (intermediate inputs) and by final demand, as well as the contribution of
value added by industry;
3. Balance the use table; and
15 This is a common assumption in productivity literature and ensures that the factor shares sum to unity. 16 See Mayerhauser and Strassner (2010) for the most complete description of the Industry Accounts methodology.

20
4. Prepare price and quantity indexes for gross output, intermediate inputs, and value
added.
On an annual basis, a wide array of source data as described in Gilmore, Lyndaker, Pack and
Randrianarivelo (2011) is used to update the annual time series. Nominal value added by
industry estimates are available for the compensation of employees and taxes on production
and imports less subsidies. The gross operating surplus component of value added by industry
is derived from gross domestic income data adjusted to an establishment basis. Annual survey
data available from the Census Bureau are used in updating industry and commodity gross
output as well as for intermediate inputs by industry and the cost categories of energy,
materials, and purchased services. Lastly, annual data are also used from the NIPAs and the
BEA International Transactions Accounts for updating estimates of final expenditures to assure
an integrated framework.
The balancing process ensures two simultaneous conditions. First, that each industry’s output
equals its intermediate inputs plus its value‐added components, and second, that the sum of
intermediate and final uses for each commodity is equal to its gross output. The use table is
balanced with a bi‐proportional scaling procedure that sequentially adjusts the rows and
columns to meet these two conditions and other predetermined controls, including NIPA final
expenditure category values including total GDP, industry compensation, and commodity and
industry gross output totals from the make table.17 Intermediate inputs, gross operating
surplus, and the commodity composition of final uses are subject to adjustment during the
balancing process.
Price‐adjusted measures of GDP by industry are prepared using double deflation using a Fisher‐
ideal index number formula, which allows gross output and intermediate inputs to be deflated
separately and real value added computed as the residual. Price and quantity indexes for gross
output by industry are derived by deflating the commodities produced by an industry as part of
its gross output. Price and quantity indexes for intermediate inputs are derived by deflating the
commodities that are consumed by an industry as intermediate inputs. The domestic and
17 The use table balancing incorporates over 350 final expenditure category “controls” as published in the NIPAs.

21
imported portions of intermediate inputs are deflated separately to account for the
commodities purchased as inputs from domestic and from foreign sources.18 Intermediate
inputs at a detailed product level are disaggregated to obtain the domestic and imported
portions of intermediate inputs included in each KLEMS input‐cost category. For each detailed
commodity used by an industry, the portion attributable to imports is calculated as the
economy‐wide ratio of commodity imports to the total domestic supply of the commodity.19
Real value added is computed as the difference between real output and real intermediate
inputs within a Fisher‐ideal index‐number formula.
Estimation Methods – Capital Input
Capital inputs for the MFP measures are computed in accordance with a service flow concept
for physical capital assets—equipment, structures, inventories, and land. Capital inputs for
major sectors are determined in three main steps: 1) A very detailed array of capital stocks is
developed for various asset types in various industries; 2) asset‐type capital stocks are
aggregated for each industry to measure capital input for the industry; and 3) industry capital
inputs are aggregated to measure sectoral level capital input.
Financial assets are excluded from capital services measures. The aggregate capital services
measures are obtained by Tornqvist aggregation of the capital stocks for each asset type within
each of 65 NAICS industry groupings using estimated rental prices for each asset type. Each
rental price reflects the nominal rate of return to all assets within the industry and rates of
economic depreciation and revaluation for the specific asset; rental prices are adjusted for the
effects of taxes. Current‐dollar capital costs can be defined as each asset’s rental price
multiplied by its constant‐dollar stock, adjusting for capital composition effects.
18 Intermediate inputs at a detailed product level are disaggregated to obtain the domestic and imported portions of intermediate inputs included in each KLEMS category using the so‐called import comparability, or proportionality, assumption. For each detailed commodity used by an industry, the portion attributable to imports is calculated as the economy‐wide ratio of commodity imports to the total domestic supply of the commodity. 19 For example, if imports represent 35 percent of the domestic supply of semiconductors, then the estimates in the import‐use table assume that imports comprise 35 percent of the value of semiconductors in each industry that uses semiconductors.

22
Asset Detail
The asset detail consists of 86 asset types for fixed business equipment and software,
structures, inventories, and land. BLS measures of capital stocks for equipment and structures
are prepared using NIPA data on real gross investment. Real stocks are constructed as vintage
aggregates of historical investments (in real terms) in accordance with an "efficiency" or service
flow concept (as distinct from a price or value concept). The efficiency of each asset is assumed
to deteriorate only gradually during the early years of an asset's service life and then more
quickly in its later life. These "age/efficiency" schedules are based, to the extent possible, on
empirical evidence of capital deterioration. Inventory stocks are developed using data from the
NIPA and IRS. BLS measures farm and nonfarm nonmanufacturing final inventories and
manufacturing inventories by stage of processing: finished goods, work in process, and
materials and supplies. Farm land input is based on data from the Economic Research Service of
the U.S. Department of Agriculture. A benchmark for nonfarm land is estimated by applying a
land‐structure ratio based on unpublished estimates by the BLS to the value of structures.
Among equipment, BLS provides additional detail on information processing equipment and
software (IPES). IPES is composed of four broad classes of assets: computers and related
equipment, software, communications equipment, and other IPES equipment. Computers and
related equipment includes mainframe computers, personal computers, printers, terminals,
tape drives, storage devices, and integrated systems. Software is comprised of pre‐packaged,
custom, and own‐account software. Communications equipment is not further differentiated.
Other IPES includes medical equipment and related instruments, electromedical instruments,
nonmedical instruments, photocopying and related equipment, and office and accounting
machinery. Structures include nonresidential structures and residential capital that are rented
out by profit‐making firms or persons.
Capital Stocks
A central concept in the production of BLS capital measures is that of the "productive" capital
stock, or the stock measured in efficiency units. Conceptually, the productive stock represents
the amount of new investment required to produce the same capital services actually produced

23
by existing assets of all vintages. Thus, total current services from assets of all vintages are
proportional to the productive stock. It is this measure of capital stock that is directly
associated with productivity. The measurement of the productive stock involves vintage
aggregation, which requires historical data on real investment and an "age/efficiency" function
that describes the pattern of services that capital goods supply as they age.
BLS computes each type of stock by the perpetual inventory method. The stock at the end of a
period is equal to a weighted sum of all past investment, where the weights are the asset's
efficiency (defined below) as of a given age.
Mathematically, the productive stock Kt, at the end of the period t is given by:
Kt= =t s‐tI2t‐
where It is investment in period t and st is the efficiency function.
The efficiency function is a schedule that indicates the quantity of services provided by an asset
of a given age, relative to a new asset of the same type. This function is generally assigned a
value of 1.00 when the asset is new and declines as the asset ages, eventually approaching or
reaching zero. Consequently, investments in the more distant past contribute less to current
output.
The mathematical form BLS uses for the age/efficiency relationship is the hyperbolic function:
st = where 0<t<L
st = 0 t>L
where st is the relative efficiency of a t‐year‐old asset L is the service life t is the age of the asset
is the parameter allowing the shape of the curve to vary.
BLS uses an efficiency function that declines initially at one‐half the straight‐line depreciation
rate for equipment (=0.5) and at one‐fourth the straight‐line rate for structures (=0.75).

24
Rental Prices
The "implicit rental price" of capital is based on the neoclassical principle that inputs should be
aggregated using weights that reflect their marginal products. The assumption used to
formulate the rental price expression is that the purchase price of a capital asset equals the
discounted value of the stream of services (and, hence, implicitly the rents) that the asset will
provide.
Rental prices are calculated for each asset as
Ct=
+ ptxt
where
ut is the corporate income tax rate zt is the present value of $1 of tax depreciation allowances et is the effective rate of the investment tax credit rt is the nominal rate of return on capital dt is the average rate of economic depreciation pt is the deflator for new capital goods
pt is the revaluation of assets due to inflation in new goods prices xt is the rate of property taxation on wealth
The following equation is used to derive the implicit internal rate of return, rt, by substituting ct
from the above equation in the product ct Kt:
Y K p x K p d p 1 u z e1 u
K p 1 u z e1 u
where Yt is capital income Kt is productive capital stock.
After determining the internal rate of return in each industry, rental prices are computed
separately for each type of asset within each industry.

25
Government, Non‐Profit, and Owner‐Occupied Capital
For the purposes of the industry production account, BLS prepared capital measures that are
conceptually consistent with the total economy production accounts as described in Harper,
Moulton, Rosenthal, and Wasshausen, 2009. These measures are not consistent with BLS
major sector published measures, which exclude government, household and non‐profit
institutions, and owner‐occupied housing capital .
For the industry production account, the addition of government, household and non‐profit
institutions, and owner‐occupied housing capital measures require detailed capital stock for
each so that a rental price can be calculated. Industry‐specific rates of return are used in
generating rental prices for non‐profit and owner‐occupied housing. For government (Federal,
State, and Local), rental prices are based on a weighted average of the rates of return and
capital gains for the private business industries to calculate capital income, capital stock, and
capital input. A detailed breakdown of capital data for the government stock, owner‐occupied
housing, and non‐profits was collected from the BEA NIPA tables in order to generate rental
prices on those assets.
Estimation Methods – Labor Input
Labor Hours
The labor hours reflect annual hours worked. Hours are measured separately for different
categories of workers in each industry and are then summed. Hours for each industry and class
of worker are calculated as the product of employment, average weekly hours, and 52 weeks
per year. They are also adjusted to reflect hours at work. The measures generally reflect the
data and methods underlying the hours used in the BLS industry productivity and cost
measures, but have been adjusted where necessary to improve consistency with the BEA
industry accounts. Hours for NIPA industries were aggregated from estimates for more detailed
industries.
The primary source of hours and employment data is the BLS Current Employment Statistics
(CES) program. The CES data are based on payroll records from a sample of establishments in

26
which the probability of sample selection is related to the establishment size. Data on
employment and hours are collected monthly; the reference period for these data is the payroll
period including the 12th of the month. Jobs rather than persons are counted in the CES, so
that multiple jobholders are counted more than once. Average weekly hours for production
and nonsupervisory workers are obtained directly from the CES, while those for nonproduction
and supervisory workers are derived using data from the Current Population Survey (CPS) in
conjunction with the CES data.20
To adjust from hours paid to hours worked, ratios of hours at work to hours‐paid, developed
from information on employer leave practices in the BLS National Compensation Survey (NCS),
are used to adjust the CES paid hours (which includes paid holidays, sick leave and vacation
time) to an hours‐worked basis. The BLS Hours at Work Survey provided the ratios for years
prior to 2000.
To include the self‐employed, data from the Current Population Survey (CPS) are used to
estimate the number of self‐employed workers (partners and proprietors) and their hours. The
CPS, a monthly survey of households, counts persons employed, not jobs. Information about
primary and secondary jobs for each person is identified and processed separately in order to
accurately assign employment and hours estimates to the proper industry and worker category.
CPS‐based hours of the self‐employed reflect hours worked.
To include employment and hours in other sectors not covered by CES data, other source data
are used. Estimates of employment and hours for industries in the farm sector are based on
data from the U.S. Department of Agriculture. Measures for industries in the nonfarm
agriculture sector are based primarily on data from the CPS, together with data from the BLS
Quarterly Census of Employment and Wages (QCEW). For mining industries, estimates of
nonproduction worker hours are derived from data collected by the Mine Safety and Health
Administration. Employment data for the postal service industry are from the CES survey, but
estimates of hours for this industry are from the U.S. Postal Service.
20 “Construction of Average Weekly Hours for Supervisory and Nonproduction Wage and Salary Workers in Detailed Industries”, available at http://www.bls.gov/lpc/iprswawhtechnote.pdf.
27
Labor Composition
Accounting for labor composition—that is, adjusting labor input of total hours by industry to
reflect differences in time and skill—has become an important component of productivity
measurement. The importance of this work has been described by Jorgenson, Gollop, and
Fraumeni (1987), and by BLS (1993), among others. Just as a key component of including
heterogeneous types of assets for capital allows for the measurement of not just the increases
in investment, but also the shift in investment to asset types with a higher marginal product;
similarly, including a labor input measure that captures demographic characteristic improves
the MFP measure by not just capturing an increase in hours worked, but also industry shifts
toward higher‐skilled workers.
Consequently, we have incorporated labor composition indexes in the quantity measures of
labor input in this prototype, integrated account. These measures account for the
heterogeneity of the workforce across sex, employment class, age, and education. This
approach in measuring labor input is currently used by BLS in official nonfarm business
productivity, and is being investigated at the industry level.
A labor composition index was generated using the comprehensive set of hours’ measures from
BLS and labor matrices of demographic characteristics provided by Dale Jorgenson Associates
(DJA) consistent with data used in Jorgenson, Ho, and Samuels (2012). The 192 unique
demographic categories are divided by gender, class of worker, age (8 categories), and
education (6 categories).
Using the DJA labor matrices, a set of compensation shares were generated for payrolled
workers. These shares were multiplied by the published BEA labor compensation figures to
produce a 63 industry set of 96 unique demographic categories of compensation for payrolled
workers. Similarly, a set of hours’ shares were generated and applied to the BLS payrolled
worker hours to allocate payrolled hours by industry by 96 demographic categories.21 The
21 While detailed data exist for self‐employed income from the National Accounts, a labor compensation measure
for the self‐employed does not exist mainly for reasons of conceptual problems. A common assumption in the
productivity literature and one adopted by this study is to assume that the payrolled compensation per hour is the

28
payrolled compensation data are consistent with published BEA data and the self‐employed
compensation estimates are based on the assumption that payrolled employees of a given
demographic characteristic will receive similar compensation per hour of work as the self‐
employed workers.
CONCEPTUAL AND MEASURMENT CHALLENGES
While this prototype industry‐level production account represents an important step in
integrating the national accounts with MFP statistics, concerns and challenges remain.
Differences arise in part because of the different goals of each agency. BEA’s mission is to
promote a better understanding of the U.S. economy by providing the most timely, relevant,
and accurate economic accounts, which has led to the development of a set of accounts that
provides complete and consistent coverage of the domestic output of the entire economy. The
BLS mission has been to provide maximum reliability in its productivity measures using
economic concepts and methods that are most appropriate for measuring productivity, and to
ensure consistency between its official labor productivity series and multifactor productivity
series. As a result, some of the data presented here reflect differences in concepts and
coverage from the official BLS productivity data. Some challenges remain, including:
The use of a gross output concept for measuring multifactor productivity in the production
accounts contrasts with the sectoral industry output approach used in the official productivity
measures produced by BLS. BLS adjusts output and intermediate inputs to exclude the double‐
counting that occurs when sales between firms in the same industry or sector are included.
Double counting occurs both in the output measure and in the purchased intermediates used to
produce that output, and therefore is added identically to both the numerator and
denominator of the productivity ratio. Inputs of materials produced and consumed in the same
sector are already represented by the inputs used to make them. Counting both the intra‐
sector transaction and the inputs that they embody gives an overstated importance to these
same as the self‐employed compensation per hour. BEA adjusted this assumption in two cases where anecdotal
evidence suggested that this assumption may not be valid and the results from the model suggested a change,
those two industries were NAICS 624 –Social Assistance and NAICS Performing arts, spectator sports, museums,
and related activities.

29
inputs relative to other inputs. Additionally, adding the same transactions to both the
numerator and denominator of the productivity equation causes productivity change to be
dampened. Further complications arise when the degree of integration within industries
changes over time. If a reporting establishment is later split into two establishments for
reporting purposes, or if two establishments are later combined into a single facility, this can
bias the productivity data over time. Use of sectoral output and input measures avoids these
problems.
The production accounts and MFP measures presented here reflect output consistent with GDP
for the total economy. These accounts are in keeping with the BEA goal to measure total
domestic production. Official BLS productivity measures exclude certain activities because
reliable data are lacking to construct output estimates independently of input costs. Estimates
for real gross products of general government, private households, and nonprofit institutions,
are largely based on labor compensation. Owner‐occupied housing and rental value of
nonprofit equipment and buildings have no adequate measures for corresponding labor inputs.
Government enterprises are excluded because subsidies account for a substantial portion of
capital income. Therefore there is no adequate measure of government enterprise capital
income in GDP.
Because of these issues, BLS constructs private business and private nonfarm business MFP
measures that exclude from GDP general government, government enterprises, private
households, nonprofit institutions, and the rental value of owner occupied dwellings. The
private business sector accounted for approximately 74 percent of gross domestic product in
2010. In the more aggregate sectors, private business and private nonfarm business, the
delivery of goods to final users closely corresponds to value added output. In these measures,
output, consisting of only goods and services sold to final consumers, is measured net of price
changes and inter‐industry transactions and the input measure is an aggregate of labor input
and capital service flows.
For its total economy production account measures, BLS replaces the capital consumption
allowances that are included in GDP with its own measures of nominal capital services of

30
government and nonprofit assets, therefore altering GDP to account for a more complete
estimate of capital services input. This adjustment to GDP is based on recommendations in the
Harper, Moulton, Rosenthal, and Wasshausen (2008) paper on BLS‐BEA integrated GDP‐
productivity accounts.
This prototype confirms a long‐standing challenge related to the presence of negative MFP
growth within the non‐manufacturing sector, implying the likelihood that some mis‐
measurement of outputs and/or inputs remains.22 Long‐term declining productivity in such
industries as construction, management of companies, rental and leasing services, legal services
and other services is counter‐intuitive and raises questions about the accuracy of the data.
Challenges remain in accurately measuring the output of many industries. These results suggest
further work by BEA and BLS to reconcile output differences, as well as work with the U.S.
Census Bureau to continue to improve services‐sector measurement, including the expansion of
business expense data reported on the annual business expenses and services annual surveys
which would be used to improve the measurement of intermediate inputs by industry.
For many of the industries presented here the MFP trends are similar to those published by
BLS, but for some industries these trends differ. Reconciling the reasons for these differences
will be part of the ongoing collaborative work of the two agencies.
CONCLUSION AND POSSIBLE NEXT STEPS
This paper provides an important down‐payment on an integrated, industry‐level production
account for the United States. It builds on a long‐standing history of collaboration between BEA
and BLS and illustrates the importance of understanding the sources of economic growth,
including KLEMS inputs and MFP growth, within an integrated National Economic Accounts
framework, as first described by Jorgenson and Landefeld (2006).
However, much work remains before a BEA/BLS industry‐level production account will be
released on a regular basis. Challenges to a regular release include an increasingly tough U.S.
22 Harper, Khandrika, Kinoshita, and Rosenthal (2010) provide a clear exposition of both the so‐called “productivity paradox” of negative multifactor productivity growth as well as some of the improvements that have occurred in services sector measurement.

31
budgetary resource environment for introducing new initiatives in addition to methodology
considerations seeking resolution in future work.
This prototype was prepared absent any new resources at BEA or BLS, which poses a practical
challenge for continuing this initiative in future years. Within BEA, there are many near‐term
initiatives to improve the accuracy, relevance, and timeliness of its National and Industry
Accounts. For example, Strassner and Wasshausen (2011) recently described BEA’s work on a
fiscal year 2013 budget initiative to produce U.S. quarterly GDP by industry on a near “real‐
time” basis, which currently is also unfunded. Within BLS, resource constraints and other
important initiatives pose a challenge to expanding work in the productivity program. For
example, BLS is also working on developing a prototype for calculating quarterly MFP.
Further work to incorporate a labor composition adjustment at the industry level remains a
research item on both the BEA and BLS’ research agenda. This project makes use of the DJA
labor matrices used in similar studies such as that by Jorgenson, Ho, and Samuels (2012). The
illustrative adjustments incorporated into this account are based on a good approximation, but
further work remains in this area. BLS is close to finalizing a methodology to incorporate
industry labor composition measures into its official major sector manufacturing and NIPA‐level
industry MFP measures.
This initiative to produce an integrated, industry‐level production account, despite budgetary
considerations, remains one of the BEA’s flagship projects (Moyer 2009). Toward this goal, BEA
has been working to produce an internally consistent industry‐level production account,
consistent with GDP, that incorporates capital measures based on a set of assumptions that are
consistent with BEA’s fixed assets account. Using the assumption that the age‐efficiency profile
is defined by a constant geometric rate along with similar tax factors as was used in the BLS
measure, an alternate capital measure was computed and below is an illustrative example of
some of the results that were generated. The age‐efficiency assumption implies a geometric
pattern in the acquisition price of capital goods as well as a geometric rate of economic
depreciation, which is consistent with BEA measures of private investment in equipment and

32
software in the NIPAs and in the Fixed Assets account. Since the age‐price profile is geometric,
the age efficiency profile must also follow the same geometric pattern. 23
BEA BLS BEA BLS BEA BLS BEA BLS
Apparel and leather and allied products ‐2.1 ‐2.2 ‐2.4 ‐2.8 ‐5.0 ‐3.9 ‐5.9 ‐3.8
Furniture and related products 1.1 1.4 1.6 1.5 ‐3.9 ‐2.3 ‐4.3 ‐3.3
Miscellaneous professional, scientific, and technical 9.0 8.4 8.8 8.6 3.9 3.8 3.1 2.7
Description
1998‐2010 2007‐2010 2009‐20102000‐2007
Results are present for two manufacturing industries and one service sector industry where the
rates of capital input growth are similar. Despite the differing assumptions with respect to the
capital input model, the two measures are remarkably similar in the time periods evaluated.
Since official BLS statistics are available through 2010 and the underlying NIPA data are also
available through 2010, growth rates incorporate one extra year of data in this comparison.
The MFP produced likely would have yielded similar results as well since the capital input
measures would not have differed by much.
23 Jorgenson, Ho, Stiroh (2005) page 152.

33
REFERENCES AND BIBLIOGRAPHY
Baldwin, John R., Tarek M. Harchaoui, “The Integration of the Canadian Productivity Accounts Within The System of National Accounts: Current Status And Challenges Ahead,” 2005, NBER Working Paper 11107, February JEL No. C67, E22, O47.
Bureau of Labor Statistics. June 26, 2012. “Multifactor Productivity rends in Manufacturing, 2010.” www.bls.gov/news.release/pdf/prod5.pdf.
Bureau of Labor Statistics 1993. Labor Composition and U.S. Productivity Growth, 1948‐1990, U.S. Government Printing Office.
Dean, Edwin, and Michael Harper, 2001. “The BLS Productivity Measurement Program,” in Charles R. Hulton, Edwin R. Dean and Michael J. Harper, New Developments in Productivity Analysis. University of Chicago Press, 55‐84.
Diewert, Erwin W. “Exact and Superlative Index Numbers,” 1976. Journal of Econometrics 4, North Holland Publishing Company, 115‐145.
Diewert, Erwin W. Revised 2007. “Measuring Productivity in the System of National Accounts,” Discussion Paper Number DP07‐06, The University of British Columbia.
Fraumeni, Barbara M., Michael J. Harper, Susan G. Powers, and Robert E. Yuskavage. 2006. “An Integrated BEA/BLS Production Account: A First Step and Theoretical Considerations.” In Dale W. Jorgenson, J. Steven Landefeld, and William D. Nordhaus, eds., A New Architecture for the U.S. National Accounts. University of Chicago Press, 355‐438
Gilmore, Teresa L., Amanda S. Lyndaker, Sarah J. Pack, and Simon N. Randrianrarivelo. 2011. “Annual Industry Accounts: Revised Statistics for 2003‐2010,” Survey of Current Business 91(December): 15‐27.
Harper, Michael, Bhavani Khandrika, Randal Kinoshita, and Steven Rosenthal. 2010. “Nonmanufacturing industry contributions to multifactor productivity, 1987‐2006,” Monthly Labor Review 133 (June) 16‐31.
Harper, Michael, Brent Moulton, Steven Rosenthal, and Dave Wasshausen, 2009. “Integrated GDP‐Productivity Accounts.” American Economic Review 99(2): 74‐79.
Jorgenson, Dale W., Frank Gollop, Barbara Fraumeni, Producivity and U.S. Economic Growth. 1987. Harvard University Press.
Jorgenson, D.W., and Z. Griliches. 1967. “The Explanation of Productivity Change.” Review of Economic Studies (July): 249‐283.
Jorgenson, Dale W., Mun S. Ho, Jon Samuels, 2012. “A Prototype Industry‐Level Production Account for the United States, 1947‐2010” Paper for the 2nd World KLEMS Conference, Harvard University, August 9‐10, 2012.
Jorgenson, Dale W., Mun S. Ho, Jon Samuels, 2010. “New Data on U.S. Productivity Growth By Industry,” Paper for World KLEMS Conference, Harvard University, August 19‐20, 2010

34
Jorgenson, Dale W., Mun S. Ho, Kevin Stiroh, 2005. Productivity, Information Technology and the American Growth Resurgence, Volume 3.
Jorgenson, Dale W. and J. Steven Landefeld. 2006. “Blueprint for Expanded and Integrated U.S. Accounts: Review, Assessment, and Next Steps.” In Dale W. Jorgenson, J. Steven Landefeld, and William D. Nordhaus eds., A New Architecture for the U.S. National Accounts. University of Chicago Press, 13‐112.
Lawson, Ann M., Brian C. Moyer, Sumiye Okubo, and Mark A. Planting. 2006. “Integrating Industry and National Economic Accounts: First Steps and Future Improvements.” In Dale W. Jorgenson, J. Steven Landefeld, and William D. Nordhaus eds., A New Architecture for the U.S. National Accounts. University of Chicago Press, 215‐261.
Mayerhauser, Nicole M. and Erich H. Strassner. 2010. “Preview of the Comprehensive Revision of the Annual Industry Accounts: Changes in Definitions, Classifications, and Statistical Methods.” Survey of Current Business 90 (March): 21‐34.
Moyer, Brian C. “Future Directions for the Industry Accounts,” Survey of Current Business 89 (June): 29‐32.
Moyer, Brian C., Mark A. Planting, Mahnaz Fahim‐Nader, and Sherlene K.S. Lum. 2004. “Preview of the Comprehensive Revision of the Annual Industry Accounts: Integrating the Annual Input‐Output Accounts and the Gross‐Domestic‐Product‐by‐Industry Accounts.” Survey of Current Business 84(March): 38–51.
National Academy of Sciences. 1979. Measurement and Interpretation of Productivity. National Research Council. Washington, D.C.
Schreyer, Paul. 2001. Productivity Manual: A Guide to the Measurement of Industry‐Level and Aggregate Productivity Growth. Paris: Organisation for Economic Co‐operation and Development, March.
Solow, Robert M., 1957. Technological Change and the Aggregate Production Function, The Review of Economics and Statistics, Vol. 39 No. 3 August 312‐320.
Strassner, Erich H., Gabriel W. Medeiros, and George M. Smith. 2005. “Annual Industry Accounts: Introducing KLEMS Input Estimates for 1997–2003.” Survey of Current Business 85(September): 31–65.
Strassner, Erich H. and David B. Wasshausen. “Prototype Quarterly Statistics on U.S. Gross Domestic Product by Industry, 2007‐2011.” Survey of Current Business 92 (June): 49–65.
OECD. 2001. OECD Productivity Manual: A Guide to the Measurement of Industry‐Level and Aggregate Productivity Growth. Paris: Organisation for Economic Cooperation and Development.
U S. Department of Labor Bulletin 2034 “Capital Stock Estimates for Input‐Output Industries: Methods and Data,” 1979.

35
Chart 1
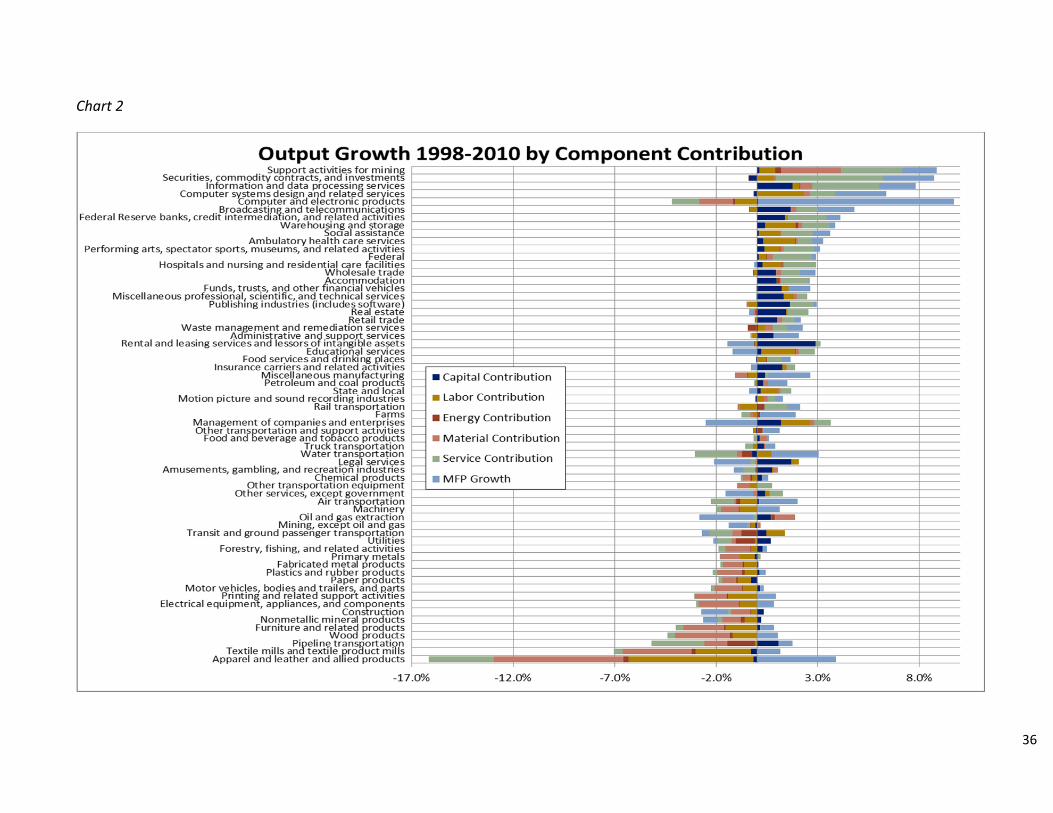
36
Chart 2

37
Chart 3

38
Chart 4
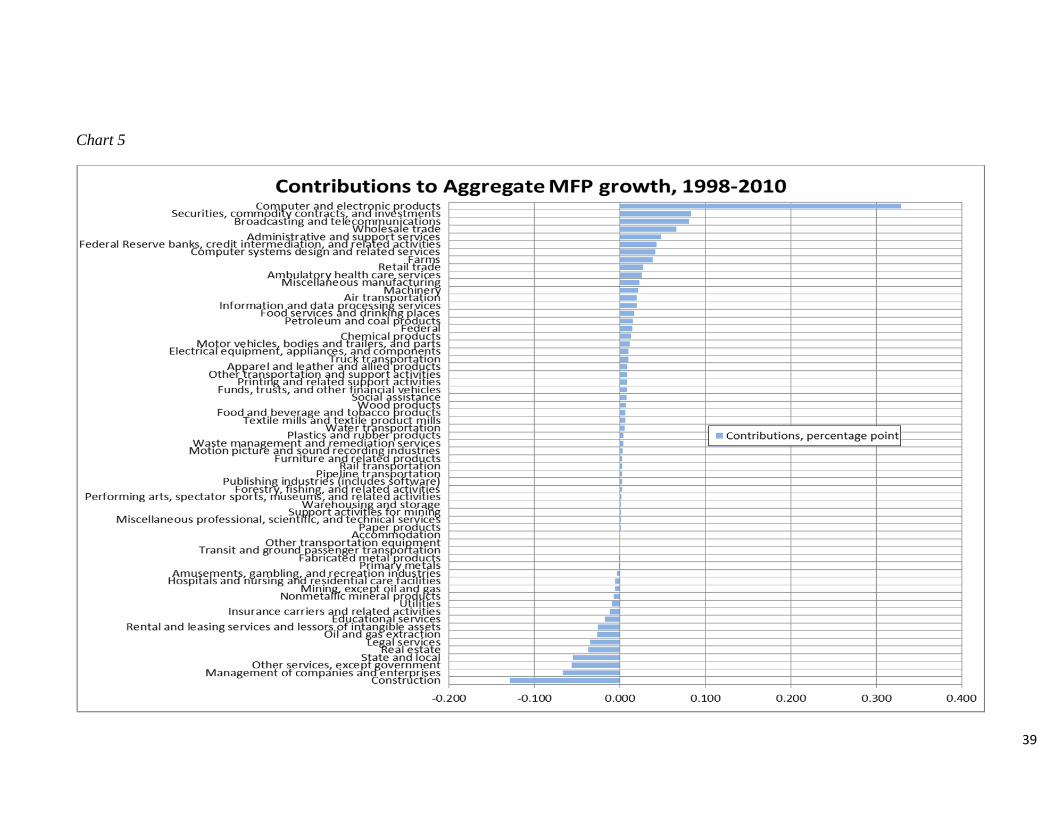
39
Chart 5

40
Chart 6
‐4.0 ‐2.0 0.0 2.0 4.0 6.0 8.0 10.0 12.0
Oil and Gas Extraction Mining, except Oil and Gas
Management of Companies and Enterprises Rental and Leasing Services and Lessors of Intangible Assets
Mining Construction
Other Services, except Goverment Nonmetallic Mineral Products
Accommodation Funds, Trusts, and Other Financial Vehicles
Amusements, Gambling, and Recreation Industries Educational Services
Real Estate Legal Services
Hospitals and Nursing and Residential Care Facilities Transit and Ground Passenger Transportation
Food and Beverage and Tobacco ProductsForestry, Fishing, and Related Activities
Paper ProductsWarehousing and Storage
Petroleum and Coal ProductsMotion Picture and Sounds Recording Industries
Furniture and Related ProductsInsurance Carriers and Related Activities
Fabricated Metal ProductsPrimary Metals
Ambulatory Health Care Services Publishing Industries (includes software)
Food Services and Drinking Places Textile Mills and Textile Product Mills
Performing Arts, Spectator Sports, Museums, and Related Activities Information and Data Processing Services
Miscellaneous Professional, Scientific, and Technical Services Waste Management and Remediation Services
Rail Transportation Retail Trade
Truck Transportation Printing and Related Support Activities
Pipeline Transportation Transportation Equipment
Plastics and Rubber ProductsOther Transportation and Support Activities
Administrative and Support Services Electrical Equipment, Appliances, and Components
Chemical ProductsFederal Reserve Banks, Credit Intermediation, and Related Activities
Social Assistance Utilities
Wholesale Trade Machinery
Wood ProductsSupport Activities for Mining
Broadcasting and Telecommunications Water Transportation
Farms Computer Systems Design and Related Services
Miscellaneous ManufacturingSecurities, Commodity Contracts, and Investments
Apparel and Leather and Applied ProductsAir Transportation
Computer and Electronic Products
BLS Multifactor Productivity Growth 1998‐2010
Multifactor Productivity Growth 1998‐2010

41
Chart 7
‐15.0 ‐10.0 ‐5.0 0.0 5.0 10.0 15.0
Apparel and Leather and Applied ProductsTextile Mills and Textile Product Mills
Furniture and Related ProductsPipeline Transportation
Wood ProductsNonmetallic Mineral Products
Electrical Equipment, Appliances, and ComponentsConstruction
Printing and Related Support ActivitiesPrimary MetalsPaper Products
Plastics and Rubber ProductsFabricated Metal ProductsMining, except Oil and Gas
MachineryTransit and Ground Passenger Transportation
Forestry, Fishing, and Related Activities Amusements, Gambling, and Recreation Industries
Chemical ProductsOther Transportation Equipment
Utilities Other Services, except Goverment
Water Transportation Legal Services
Food and Beverage and Tobacco ProductsOil and Gas Extraction
Farms Other Transportation and Support Activities
Petroleum and Coal ProductsTruck Transportation Rail Transportation Accommodation
Miscellaneous ManufacturingMining
Management of Companies and Enterprises Food Services and Drinking Places
Administrative and Support Services Rental and Leasing Services and Lessors of Intangible Assets
Air Transportation Retail Trade
Waste Management and Remediation Services Real Estate
Miscellaneous Professional, Scientific, and Technical Services Funds, Trusts, and Other Financial Vehicles
Educational Services Wholesale Trade
Motion Picture and Sounds Recording Industries Insurance Carriers and Related Activities Publishing Industries (includes software)
Ambulatory Health Care Services Hospitals and Nursing and Residential Care Facilities
Federal Reserve Banks, Credit Intermediation, and Related Activities Performing Arts, Spectator Sports, Museums, and Related Activities
Computer and Electronic ProductsWarehousing and Storage
Social Assistance Computer Systems Design and Related Services
Broadcasting and Telecommunications Information and Data Processing Services
Support Activities for Mining Securities, Commodity Contracts, and Investments
BLS Sectoral Output Growth 1998‐2010
Sectoral Output Growth 1998‐2010

42
Description 1998‐2000 2000‐2007 2007‐2010 1998‐2010
Farms 0.063 0.012 0.085 0.039
Forestry, fishing, and related activities 0.008 0.008 ‐0.014 0.002
Oil and gas extraction ‐0.123 ‐0.015 0.010 ‐0.027
Mining, except oil and gas 0.018 ‐0.014 ‐0.002 ‐0.006
Support activities for mining 0.033 ‐0.010 0.007 0.001
Utilities 0.111 ‐0.023 ‐0.061 ‐0.010
Construction ‐0.059 ‐0.210 0.014 ‐0.129
Food and beverage and tobacco products 0.021 0.018 ‐0.029 0.006
Textile mills and textile product mills 0.008 0.006 0.007 0.006
Apparel and leather and allied products 0.009 0.005 0.016 0.009
Wood products 0.002 0.008 0.009 0.007
Paper products 0.005 0.006 ‐0.015 0.000
Printing and related support activities 0.005 0.011 0.004 0.008
Petroleum and coal products ‐0.013 0.022 0.018 0.015
Chemical products 0.026 0.054 ‐0.093 0.013
Plastics and rubber products 0.009 0.006 ‐0.003 0.004
Nonmetallic mineral products ‐0.015 ‐0.006 ‐0.005 ‐0.007
Primary metals 0.008 ‐0.008 0.007 ‐0.002
Fabricated metal products 0.013 0.008 ‐0.031 ‐0.001
Machinery ‐0.028 0.028 0.038 0.021
Computer and electronic products 0.600 0.274 0.278 0.329
Electrical equipment, appliances, and components 0.037 0.007 ‐0.003 0.010
Motor vehicles, bodies and trailers, and parts ‐0.024 0.057 ‐0.070 0.012
Other transportation equipment 0.023 0.014 ‐0.050 ‐0.001
Furniture and related products 0.002 0.003 0.003 0.003
Miscellaneous manufacturing 0.034 0.019 0.024 0.023
Wholesale trade 0.179 0.111 ‐0.114 0.066
Retail trade ‐0.021 0.013 0.091 0.027
Air transportation 0.031 0.031 ‐0.013 0.020
Rail transportation 0.015 0.001 ‐0.002 0.003
Water transportation ‐0.002 0.008 0.005 0.005
Truck transportation 0.024 0.009 0.003 0.010
Transit and ground passenger transportation 0.003 ‐0.001 ‐0.003 ‐0.001
Pipeline transportation 0.017 0.001 ‐0.003 0.003
Other transportation and support activities 0.005 0.021 ‐0.018 0.008
Warehousing and storage ‐0.006 0.003 0.003 0.001
Publishing industries (includes software) ‐0.115 0.041 ‐0.009 0.002
Motion picture and sound recording industries ‐0.036 0.020 ‐0.011 0.003
Broadcasting and telecommunications ‐0.004 0.129 0.026 0.081
Information and data processing services ‐0.094 0.057 0.007 0.019
Federal Reserve banks, credit intermediation, and 0.020 ‐0.006 0.171 0.043
Securities, commodity contracts, and investments 0.167 0.033 0.145 0.084
Insurance carriers and related activities 0.049 ‐0.024 ‐0.024 ‐0.012
Funds, trusts, and other financial vehicles ‐0.006 0.010 0.013 0.008
Real estate 0.193 ‐0.018 ‐0.235 ‐0.037
Rental and leasing services and lessors of intangibl ‐0.148 ‐0.020 0.042 ‐0.026
Legal services 0.004 ‐0.041 ‐0.045 ‐0.035
Miscellaneous professional, scientific, and technica ‐0.099 0.008 0.048 0.000
Computer systems design and related services ‐0.008 0.048 0.057 0.041
Management of companies and enterprises ‐0.008 ‐0.068 ‐0.104 ‐0.067
Administrative and support services ‐0.012 0.061 0.057 0.048
Waste management and remediation services 0.007 0.003 0.003 0.004
Educational services ‐0.012 ‐0.018 ‐0.021 ‐0.018
Ambulatory health care services 0.089 ‐0.001 0.046 0.026
Hospitals and nursing and residential care facilities ‐0.018 ‐0.016 0.027 ‐0.005
Social assistance 0.000 0.012 0.004 0.008
Performing arts, spectator sports, museums, and re 0.011 ‐0.004 0.010 0.002
Amusements, gambling, and recreation industries 0.002 ‐0.003 ‐0.009 ‐0.004
Accommodation ‐0.001 0.008 ‐0.019 0.000
Food services and drinking places 0.064 0.026 ‐0.037 0.017
Other services, except government ‐0.021 ‐0.065 ‐0.059 ‐0.056
Federal ‐0.051 0.028 0.027 0.015
State and local ‐0.059 ‐0.064 ‐0.029 ‐0.055
Sum 0.928 0.614 0.171 0.556
Table 1. Contributions to Aggregate Multifactor Productivity Growth [percentage point]

43
Description 1998‐2000 2000‐2007 2007‐2010 1998‐2010
Farms 3.0 0.6 3.7 1.8
Forestry, fishing, and related activities 1.8 2.0 ‐4.9 0.2
Oil and gas extraction ‐12.8 ‐1.0 0.1 ‐2.7
Mining, except oil and gas 3.2 ‐2.4 ‐0.1 ‐0.9
Support activities for mining 13.2 ‐1.3 1.0 1.7
Utilities 3.4 ‐0.5 ‐2.1 ‐0.2
Construction ‐0.6 ‐2.2 0.2 ‐1.3
Food and beverage and tobacco products 0.4 0.4 ‐0.6 0.1
Textile mills and textile product mills 0.8 1.0 1.8 1.2
Apparel and leather and allied products 1.2 1.3 11.8 3.9
Wood products 0.2 0.9 1.7 1.0
Paper products 0.3 0.5 ‐1.2 0.0
Printing and related support activities 0.5 1.2 0.6 0.9
Petroleum and coal products ‐1.0 1.6 0.6 0.9
Chemical products 0.6 1.2 ‐1.9 0.3
Plastics and rubber products 0.5 0.4 ‐0.1 0.3
Nonmetallic mineral products ‐1.5 ‐0.6 ‐0.4 ‐0.7
Primary metals 0.4 ‐0.3 0.3 0.0
Fabricated metal products 0.5 0.4 ‐1.2 0.0
Machinery ‐0.9 1.3 2.0 1.1
Computer and electronic products 12.2 8.5 10.7 9.6
Electrical equipment, appliances, and components 3.0 0.8 ‐0.6 0.8
Motor vehicles, bodies and trailers, and parts ‐0.5 1.4 ‐2.2 0.2
Other transportation equipment 1.1 0.9 ‐2.9 0.0
Furniture and related products 0.2 0.5 1.5 0.7
Miscellaneous manufacturing 2.9 1.7 2.3 2.1
Wholesale trade 2.0 1.3 ‐1.4 0.8
Retail trade ‐0.2 0.1 1.1 0.3
Air transportation 2.4 3.2 ‐1.3 1.9
Rail transportation 3.4 0.3 ‐0.4 0.6
Water transportation ‐0.6 3.3 2.0 2.3
Truck transportation 1.2 0.4 0.3 0.5
Transit and ground passenger transportation 1.0 ‐0.3 ‐1.4 ‐0.4
Pipeline transportation 6.6 0.1 ‐2.0 0.7
Other transportation and support activities 0.4 2.0 ‐1.8 0.8
Warehousing and storage ‐2.0 0.8 0.6 0.3
Publishing industries (includes software) ‐4.5 1.7 ‐0.4 0.2
Motion picture and sound recording industries ‐4.7 2.6 ‐1.5 0.4
Broadcasting and telecommunications ‐0.1 2.8 0.6 1.8
Information and data processing services ‐13.0 6.4 0.8 1.8
Federal Reserve banks, credit intermediation, and re 0.4 0.0 2.4 0.7
Securities, commodity contracts, and investments 5.3 1.0 4.2 2.5
Insurance carriers and related activities 1.1 ‐0.6 ‐0.4 ‐0.3
Funds, trusts, and other financial vehicles ‐0.6 1.3 1.6 1.1
Real estate 1.3 ‐0.1 ‐1.5 ‐0.2
Rental and leasing services and lessors of intangible a ‐7.4 ‐1.1 2.2 ‐1.3
Legal services 0.2 ‐2.1 ‐2.4 ‐1.8
Miscellaneous professional, scientific, and technical ‐1.6 0.1 0.7 0.0
Computer systems design and related services ‐0.5 3.1 3.2 2.5
Management of companies and enterprises ‐0.3 ‐2.6 ‐3.8 ‐2.5
Administrative and support services ‐0.3 1.6 1.4 1.2
Waste management and remediation services 1.2 0.7 0.5 0.7
Educational services ‐0.9 ‐1.3 ‐1.3 ‐1.2
Ambulatory health care services 1.9 0.0 0.9 0.5
Hospitals and nursing and residential care facilities ‐0.4 ‐0.3 0.5 ‐0.1
Social assistance 0.1 1.2 0.4 0.8
Performing arts, spectator sports, museums, and rela 1.5 ‐0.4 1.0 0.3
Amusements, gambling, and recreation industries 0.2 ‐0.3 ‐1.4 ‐0.5
Accommodation ‐0.1 0.6 ‐1.1 0.1
Food services and drinking places 1.8 0.7 ‐1.0 0.5
Other services, except government ‐0.5 ‐1.5 ‐1.5 ‐1.3
Federal ‐0.8 0.4 0.4 0.2
State and local ‐0.5 ‐0.5 ‐0.2 ‐0.4
Table 2: Multifactor Productivity Growth [percent growth]

44
Descrption Output Capital Labor Energy Material Service MFP
Farms 1.16 0.03 ‐0.17 0.11 ‐0.17 ‐0.43 1.78
Forestry, fishing, and related activities ‐1.41 0.27 ‐0.29 ‐0.05 ‐1.21 ‐0.33 0.21
Oil and gas extraction ‐0.95 0.68 0.03 0.16 1.02 ‐0.17 ‐2.67
Mining, except oil and gas ‐1.21 ‐0.08 ‐0.22 ‐0.03 0.18 ‐0.14 ‐0.93
Support activities for mining 8.86 0.13 0.78 0.27 2.98 3.01 1.70
Utilities ‐1.40 0.69 ‐0.11 ‐0.92 ‐0.21 ‐0.67 ‐0.23
Construction ‐2.41 0.34 ‐0.30 ‐0.03 ‐0.93 ‐0.16 ‐1.33
Food and beverage and tobacco products 0.42 0.12 ‐0.01 0.02 0.34 ‐0.17 0.12
Textile mills and textile product mills ‐5.87 ‐0.29 ‐2.74 ‐0.19 ‐3.40 ‐0.42 1.17
Apparel and leather and allied products ‐12.26 ‐0.18 ‐6.14 ‐0.26 ‐6.39 ‐3.20 3.89
Wood products ‐3.39 0.01 ‐1.20 ‐0.14 ‐2.68 ‐0.38 1.00
Paper products ‐1.85 ‐0.28 ‐0.68 ‐0.06 ‐0.69 ‐0.18 0.04
Printing and related support activities ‐2.15 0.01 ‐1.42 ‐0.06 ‐1.59 ‐0.02 0.92
Petroleum and coal products 1.43 0.31 ‐0.07 0.01 0.24 ‐0.06 0.93
Chemical products ‐0.23 0.23 ‐0.22 ‐0.11 ‐0.39 ‐0.07 0.33
Plastics and rubber products ‐1.76 0.11 ‐0.62 ‐0.12 ‐1.21 ‐0.23 0.31
Nonmetallic mineral products ‐2.43 0.22 ‐0.61 ‐0.17 ‐0.92 ‐0.21 ‐0.73
Primary metals ‐1.66 ‐0.10 ‐0.77 0.05 ‐0.92 0.13 ‐0.04
Fabricated metal products ‐1.70 0.07 ‐0.63 ‐0.08 ‐0.95 ‐0.12 0.03
Machinery ‐0.89 0.02 ‐0.85 ‐0.04 ‐0.87 ‐0.25 1.09
Computer and electronic products 5.52 0.05 ‐1.08 ‐0.11 ‐1.65 ‐1.35 9.64
Electrical equipment, appliances, and components ‐2.17 ‐0.02 ‐0.82 ‐0.06 ‐1.97 ‐0.12 0.83
Motor vehicles, bodies and trailers, and parts ‐1.94 0.14 ‐0.70 ‐0.02 ‐1.36 ‐0.18 0.18
Other transportation equipment ‐0.24 0.04 ‐0.35 ‐0.01 ‐0.59 0.71 ‐0.03
Furniture and related products ‐3.17 0.15 ‐1.53 ‐0.08 ‐2.02 ‐0.38 0.69
Miscellaneous manufacturing 1.54 0.40 ‐0.45 ‐0.03 ‐0.60 0.17 2.05
Wholesale trade 2.71 0.92 ‐0.17 0.00 0.28 0.93 0.76
Retail trade 2.05 0.99 ‐0.08 ‐0.03 0.27 0.59 0.31
Air transportation ‐0.27 0.09 ‐0.84 ‐0.16 ‐0.12 ‐1.15 1.91
Rail transportation 1.17 0.05 ‐0.83 0.32 ‐0.13 1.12 0.65
Water transportation ‐0.01 ‐0.22 0.72 ‐0.52 ‐0.27 ‐2.06 2.32
Truck transportation 0.34 0.35 ‐0.19 0.03 0.01 ‐0.38 0.53
Transit and ground passenger transportation ‐1.35 0.48 0.88 ‐0.76 ‐0.44 ‐1.14 ‐0.36
Pipeline transportation ‐3.44 1.05 ‐0.09 ‐1.37 ‐1.12 ‐2.60 0.70
Other transportation and support activities 0.92 ‐0.05 ‐0.15 0.28 0.00 0.06 0.80
Warehousing and storage 3.86 0.39 1.52 0.11 0.20 1.37 0.27
Publishing industries (includes software) 2.43 1.62 ‐0.41 ‐0.02 ‐0.09 1.16 0.16
Motion picture and sound recording industries 1.20 ‐0.08 0.34 0.00 0.16 0.39 0.38
Broadcasting and telecommunications 4.44 1.66 ‐0.36 ‐0.01 0.28 1.08 1.79
Information and data processing services 7.81 1.76 0.34 0.03 0.60 3.31 1.77
Federal Reserve banks, credit intermediation, and 4.10 1.38 0.12 0.00 0.03 1.90 0.67
Securities, commodity contracts, and investments 8.33 ‐0.39 0.85 ‐0.02 0.10 5.28 2.52
Insurance carriers and related activities 1.59 1.24 0.18 0.00 0.05 0.41 ‐0.29
Funds, trusts, and other financial vehicles 2.57 1.22 0.32 ‐0.01 ‐0.01 ‐0.04 1.08
Real estate 2.14 1.44 0.05 ‐0.06 ‐0.11 1.04 ‐0.22
Rental and leasing services and lessors of intangib 1.69 2.89 ‐0.11 ‐0.02 0.00 0.24 ‐1.31
Legal services ‐0.06 1.68 0.39 ‐0.01 ‐0.05 ‐0.27 ‐1.80
Miscellaneous professional, scientific, and technic 2.47 1.32 0.51 ‐0.01 0.14 0.53 0.00
Computer systems design and related services 6.23 ‐0.13 2.30 ‐0.01 0.28 1.26 2.52
Management of companies and enterprises 1.11 1.19 1.44 0.00 0.20 0.81 ‐2.54
Administrative and support services 1.72 0.81 ‐0.22 0.00 0.04 ‐0.11 1.22
Waste management and remediation services 1.83 0.05 0.35 ‐0.43 0.39 0.72 0.73
Educational services 1.65 0.21 1.67 0.03 0.16 0.77 ‐1.19
Ambulatory health care services 3.27 0.29 1.60 0.00 0.11 0.73 0.53
Hospitals and nursing and residential care facilitie 2.79 0.27 0.96 0.02 0.11 1.57 ‐0.13
Social assistance 3.60 0.08 1.07 0.02 0.03 1.55 0.85
Performing arts, spectator sports, museums, and r 3.09 0.37 0.77 0.03 0.15 1.51 0.26
Amusements, gambling, and recreation industries ‐0.10 0.76 0.08 ‐0.09 0.20 ‐0.59 ‐0.46
Accommodation 2.60 0.97 0.03 0.11 0.07 1.36 0.05
Food services and drinking places 1.63 ‐0.04 0.47 0.01 0.00 0.72 0.45
Other services, except government ‐0.26 0.41 0.22 ‐0.02 ‐0.18 0.65 ‐1.33
Federal 2.90 0.10 0.36 0.04 0.26 1.92 0.22
State and local 1.30 0.19 0.83 0.01 0.12 0.55 ‐0.40
Table 3: Contributions to Output Growth, 1998‐2010 [percentage point]

45

46
Description
2009 Value
Added Share
Domar
Weight MFP Growth
Contribution
to Aggregate
MFP
Computer and electronic products 1.5 0.035 9.6 0.329
Securities, commodity contracts, and investments 1.2 0.033 2.5 0.084
Broadcasting and telecommunications 2.4 0.047 1.8 0.081
Wholesale trade 5.5 0.084 0.8 0.066
Administrative and support services 2.6 0.040 1.2 0.048
Federal Reserve banks, credit intermediation, and r 3.8 0.064 0.7 0.043
Computer systems design and related services 1.2 0.016 2.5 0.041
Farms 0.8 0.021 1.8 0.039
Retail trade 6.0 0.096 0.3 0.027
Ambulatory health care services 3.6 0.050 0.5 0.026
Miscellaneous manufacturing 0.6 0.011 2.1 0.023
Machinery 0.8 0.024 1.1 0.021
Air transportation 0.4 0.011 1.9 0.020
Information and data processing services 0.6 0.009 1.8 0.019
Food services and drinking places 2.1 0.037 0.5 0.017
Petroleum and coal products 0.7 0.030 0.9 0.015
Federal 4.4 0.068 0.2 0.015
Chemical products 1.7 0.044 0.3 0.013
Motor vehicles, bodies and trailers, and parts 0.2 0.039 0.2 0.012
Electrical equipment, appliances, and components 0.4 0.010 0.8 0.010
Truck transportation 0.8 0.019 0.5 0.010
Apparel and leather and allied products 0.1 0.004 3.9 0.009
Other transportation and support activities 0.7 0.010 0.8 0.008
Printing and related support activities 0.2 0.009 0.9 0.008
Funds, trusts, and other financial vehicles 0.2 0.008 1.1 0.008
Social assistance 0.6 0.009 0.8 0.008
Wood products 0.1 0.008 1.0 0.007
Food and beverage and tobacco products 1.6 0.054 0.1 0.006
Textile mills and textile product mills 0.1 0.006 1.2 0.006
Water transportation 0.1 0.003 2.3 0.005
Plastics and rubber products 0.5 0.015 0.3 0.004
Waste management and remediation services 0.3 0.005 0.7 0.004
Motion picture and sound recording industries 0.4 0.007 0.4 0.003
Furniture and related products 0.2 0.006 0.7 0.003
Rail transportation 0.2 0.005 0.6 0.003
Pipeline transportation 0.1 0.002 0.7 0.003
Publishing industries (includes software) 1.0 0.023 0.2 0.002
Forestry, fishing, and related activities 0.2 0.004 0.2 0.002
Performing arts, spectator sports, museums, and rel 0.5 0.008 0.3 0.002
Warehousing and storage 0.3 0.004 0.3 0.001
Support activities for mining 0.3 0.006 1.7 0.001
Miscellaneous professional, scientific, and technica 4.7 0.066 0.0 0.000
Paper products 0.4 0.014 0.0 0.000
Accommodation 0.7 0.015 0.1 0.000
Other transportation equipment 0.6 0.017 0.0 ‐0.001
Transit and ground passenger transportation 0.2 0.002 ‐0.4 ‐0.001
Fabricated metal products 0.8 0.023 0.0 ‐0.001
Primary metals 0.3 0.016 0.0 ‐0.002
Amusements, gambling, and recreation industries 0.4 0.007 ‐0.5 ‐0.004
Hospitals and nursing and residential care facilities 3.3 0.049 ‐0.1 ‐0.005
Mining, except oil and gas 0.3 0.005 ‐0.9 ‐0.006
Nonmetallic mineral products 0.2 0.009 ‐0.7 ‐0.007
Utilities 1.9 0.031 ‐0.2 ‐0.010
Insurance carriers and related activities 2.7 0.045 ‐0.3 ‐0.012
Educational services 1.1 0.015 ‐1.2 ‐0.018
Rental and leasing services and lessors of intangible 1.3 0.020 ‐1.3 ‐0.026
Oil and gas extraction 0.9 0.014 ‐2.7 ‐0.027
Legal services 1.5 0.019 ‐1.8 ‐0.035
Real estate 12.0 0.161 ‐0.2 ‐0.037
State and local 9.4 0.138 ‐0.4 ‐0.055
Other services, except government 2.4 0.042 ‐1.3 ‐0.056
Management of companies and enterprises 1.8 0.026 ‐2.5 ‐0.067
Construction 3.9 0.091 ‐1.3 ‐0.129
Sum 100.0 1.8 0.556
1‐Value added share is the share of industry value added to GDP
2‐ Domar weights are calculated as a ratio of gross output of an industry to GDP
3‐Aggregate MFP growth calculated as the sum of industry percentage point contributions to aggregate MFP
Table 5: Aggregate Multifactor Productivity Growth, Sorted by Contribution, 1998‐2010

47
Table 6. Contributions to BLS Aggregate Multifactor Productivity Growth (percentage point)
Description 1998 ‐2000 2000‐2007 2007‐2010 1998‐2010
Farms 0.11 0.02 0.14 0.06 Forestry, Fishing, and Related Activities 0.01 0.01 ‐0.02 0.00Oil and Gas Extraction ‐0.13 ‐0.02 ‐0.03 ‐0.04 Mining, except Oil and Gas 0.01 ‐0.02 0.00 ‐0.01 Support Activities for Mining 0.05 ‐0.01 0.01 0.00Utilities ‐0.22 0.10 0.08 0.04 Construction ‐0.02 ‐0.25 0.07 ‐0.13Food and Beverage and Tobacco Products ‐0.01 0.04 ‐0.05 0.01 Textile Mills and Textile Product Mills 0.01 0.01 ‐0.01 0.01Apparel and Leather and Applied Products 0.02 0.01 0.01 0.01Wood Products 0.02 0.01 ‐0.02 0.00 Paper Products 0.00 0.01 0.00 0.01Printing and Related Support Activities ‐0.04 ‐0.03 0.18 0.02 Petroleum and Coal Products 0.05 0.10 ‐0.05 0.05Chemical Products 0.02 0.01 0.02 0.01Plastics and Rubber Products 0.01 0.01 0.02 0.01 Nonmetallic Mineral Products ‐0.02 ‐0.01 0.00 ‐0.01Primary Metals 0.03 ‐0.01 0.02 0.00 Fabricated Metal Products 0.02 0.02 0.01 0.01Machinery ‐0.05 0.05 0.09 0.04 Computer and Electronic Products 0.81 0.35 0.34 0.43Electrical Equipment, Appliances, and Components 0.05 0.02 ‐0.01 0.02 Other Transportation Equipment 0.02 0.10 ‐0.01 0.06 Furniture and Related Products 0.00 0.01 ‐0.01 0.00Miscellaneous Manufacturing 0.05 0.03 0.05 0.04 Wholesale Trade 0.19 0.19 ‐0.12 0.11Retail Trade 0.02 0.07 0.18 0.09 Air Transportation 0.07 0.05 0.02 0.05Rail Transportation 0.02 0.00 0.00 0.00 Water Transportation 0.00 0.01 0.01 0.01 Truck Transportation 0.04 0.02 0.02 0.02 Transit and Ground Passenger Transportation 0.01 0.00 0.00 0.00 Pipeline Transportation 0.02 0.00 0.00 0.01Other Transportation and Support Activities 0.01 0.03 ‐0.02 0.01 Warehousing and Storage ‐0.01 0.00 0.01 0.00 Publishing Industries ‐0.11 0.08 ‐0.01 0.03 Motion Picture and Sounds Recording Industries ‐0.05 0.03 ‐0.01 0.01 Broadcasting and Telecommunications 0.02 0.19 0.03 0.12Information and Data Processing Services ‐0.16 0.08 0.01 0.02 Federal Reserve Banks, Credit Intermediation, and Related Activities 0.09 ‐0.01 0.24 0.07Securities, Commodity Contracts, and Investments 0.38 0.08 0.16 0.15 Insurance Carriers and Related Activities 0.14 ‐0.02 0.03 0.02 Funds, Trusts, and Other Financial Vehicles 0.02 ‐0.01 0.00 0.00 Real Estate 0.18 0.06 ‐0.31 ‐0.01 Rental and Leasing Services and Lessors of Intangible Assets ‐0.18 ‐0.02 0.06 ‐0.03Legal Services 0.03 0.00 ‐0.02 0.00 Computer Systems Design and Related Services ‐0.02 0.06 0.08 0.05Miscellaneous Professional, Scientific, and Technical Services ‐0.07 0.04 0.22 0.07 Management of Companies and Enterprises 0.02 ‐0.04 ‐0.10 ‐0.05Administrative and Support Services 0.01 0.07 0.04 0.05Waste Management and Remediation Services 0.01 0.00 0.00 0.00 Educational Services 0.01 ‐0.01 0.00 0.00Ambulatory Health Care Services 0.07 0.02 0.05 0.03 Hospitals and Nursing and Residential Care Facilities 0.00 ‐0.01 0.03 0.00Social Assistance 0.00 0.01 0.01 0.01Performing Arts, Spectator Sports, Museums, and Related Activities 0.02 0.00 0.01 0.00 Amusements, Gambling, and Recreation Industries 0.01 0.00 ‐0.01 0.00Accommodation 0.03 ‐0.01 ‐0.03 ‐0.01 Food Services and Drinking Places 0.05 0.03 ‐0.01 0.02Other Services, except Government 0.04 ‐0.05 ‐0.04 ‐0.03 TOTAL NMF CONTRIBUTIONS 0.59 0.72 0.63 0.68TOTAL MFG CONTRIBUTION 0.93 0.72 0.49 0.70 PRIVATE BUSINESS MFP 1.79 1.44 0.45 1.25

48
Table 7. BLS Multifactor Productivity Growth (percent growth‐BLS data)
1998 2000 2007 1998
Description ‐2000 ‐2007 ‐2010 ‐2010
Farms 4.1 0.7 5.1 2.4Forestry, Fishing, and Related Activities 1.6 2.6 ‐6.0 0.2
Oil and Gas Extraction ‐9.3 ‐0.6 ‐0.2 ‐2.0
Mining, except Oil and Gas 1.3 ‐2.5 ‐0.5 ‐1.3 Support Activities for Mining 14.3 ‐1.2 1.1 1.8 Utilities ‐6.2 2.9 2.3 1.2
Construction ‐0.2 ‐2.0 0.7 ‐1.0 Food and Beverage and Tobacco Products ‐0.1 0.7 ‐0.8 0.2
Textile Mills and Textile Product Mills 0.9 1.6 ‐1.7 0.7Apparel and Leather and Applied Products 2.6 4.2 2.6 3.6 Wood Products 0.8 1.0 3.6 1.6
Paper Products 0.7 0.7 ‐1.2 0.3
Printing and Related Support Activities 0.1 1.3 0.0 0.8Petroleum and Coal Products ‐2.8 0.4 2.3 0.3
Chemical Products 1.0 1.9 ‐0.9 1.0
Plastics and Rubber Products 0.7 0.6 1.5 0.8 Nonmetallic Mineral Products ‐1.7 ‐0.7 ‐0.1 ‐0.7 Primary Metals 1.9 ‐0.4 1.7 0.5
Fabricated Metal Products 0.6 0.6 0.1 0.5 Machinery ‐1.4 1.6 2.9 1.4
Computer and Electronic Products 14.1 9.9 11.7 11.0Electrical Equipment, Appliances, and Components 3.6 1.4 ‐1.6 1.0 Transportation Equipment 0.3 1.7 ‐0.9 0.8
Furniture and Related Products 0.4 1.1 ‐0.9 0.5
Miscellaneous Manufacturing 3.2 2.0 4.1 2.7Wholesale Trade 2.0 2.1 ‐1.4 1.2
Retail Trade 0.2 0.6 1.6 0.8
Air Transportation 5.4 5.3 1.8 4.5 Rail Transportation 3.4 0.4 ‐0.2 0.7 Water Transportation ‐0.7 3.4 2.0 2.4
Truck Transportation 1.7 0.6 0.6 0.8 Transit and Ground Passenger Transportation 3.3 ‐0.2 ‐1.1 0.1
Pipeline Transportation 7.2 0.2 ‐1.9 0.8Other Transportation and Support Activities 0.8 2.0 ‐1.6 0.9 Warehousing and Storage ‐1.8 0.6 1.0 0.3
Publishing Industries ‐4.1 2.4 ‐0.4 0.6 Motion Picture and Sounds Recording Industries ‐7.5 3.7 ‐1.7 0.4 Broadcasting and Telecommunications 0.4 3.3 0.5 2.1
Information and Data Processing Services ‐15.3 5.6 1.1 0.7
Federal Reserve Banks, Credit Intermediation, and Related Activities 1.6 0.0 3.3 1.1 Securities, Commodity Contracts, and Investments 8.6 2.0 2.5 3.2 Insurance Carriers and Related Activities 4.7 ‐1.0 1.1 0.5
Funds, Trusts, and Other Financial Vehicles 1.3 ‐0.7 ‐1.2 ‐0.5 Real Estate 2.1 0.6 ‐3.6 ‐0.2
Rental and Leasing Services and Lessors of Intangible Assets ‐7.0 ‐1.0 2.4 ‐1.2Legal Services 1.3 ‐0.1 ‐1.0 ‐0.1 Computer Systems Design and Related Services ‐1.1 3.1 3.3 2.4
Miscellaneous Professional, Scientific, and Technical Services ‐0.9 0.5 2.4 0.7 Management of Companies and Enterprises 0.6 ‐1.1 ‐2.5 ‐1.2 Administrative and Support Services 0.1 1.3 0.9 1.0
Waste Management and Remediation Services 1.4 0.7 0.5 0.7 Educational Services 0.9 ‐0.8 0.1 ‐0.3
Ambulatory Health Care Services 1.2 0.3 0.8 0.6 Hospitals and Nursing and Residential Care Facilities ‐0.1 ‐0.3 0.7 0.0
Social Assistance 0.0 1.4 1.0 1.1 Performing Arts, Spectator Sports, Museums, and Related Activities 3.1 0.1 0.5 0.7
Amusements, Gambling, and Recreation Industries 1.3 ‐0.5 ‐0.8 ‐0.3Accommodation 1.7 ‐0.7 ‐1.7 ‐0.5 Food Services and Drinking Places 1.5 0.8 ‐0.2 0.6
Other Services, except Government 0.8 ‐1.0 ‐1.0 ‐0.7