psat meta data analysis project - soest meta data analysis project mike musyl, ... allows...
TRANSCRIPT

PSAT Meta Data Analysis ProjectMike Musyl, Rich Brill, Yonat Swimmer, Lianne McNaughton
Michael Domeier, Nicole Nasby-Lucas, Molly Lutcavage, Ben Galuardi, Francois Royer, Steve Wilson, Joe Liddle

• Failure rates (percent reporting)
• Percentage of retrieved depth, temperature, and geolocation data
• Retention rates
• Longevity of attachment
This study is designed to look at variables explaining:
Comparisons to be made using data from 662 PSATs Comparisons to be made using data from 662 PSATs deployments worldwidedeployments worldwide

It is anticipated that:
Patterns will emerge with respect to:attachment methodologies, target species,experimental design.
Allows unprecedented critical appraisal of the overall efficacy of PSAT technology.
Cost Benefit analysis to improve experimental design

Variables in the PSAT Performance Evaluation:
Tag Birthday Tag Serial Number
Programmed Pop-off date Date Deployed
Age of Tag at Deployment Species Tagged
Sex Days-at-liberty
% Temperature % Depth
% Geolocation ARGOS latitude
ARGOS longitude RD1500
Swivel Tether material
Tag Head Attachment methods
Manufacturer

662 PSATs deployed on 18 Species
2000-2004Bigeye thresher (7) Bigeye Tuna (4)
Black Marlin (57) Blue Marlin (34)
Blue Shark (32) Green Turtle (1)
Loggerhead turtle (8) Olive Ridley turtle (15)
Short-fin Mako shark (4) Silky Shark (4)
Striped Marlin (200) Swordfish (36)
Oceanic White-tip shark (8) Yellowfin Tuna (17)
Basking shark (1) Great White (48)
Tarpon (40) Bluefin tuna (146)

Difficult problemPSAT failure rates
• Never hear from failed PSATS• Very few PSATs recovered for inspection • Exact failure mode(s) unknown
•Shouldn't limit discovery
•Exploration of data reveals much
• Ideas to improve methods

Tag Failure Modes• Battery failure – passivation over time (temperature
dependent)?
• Rupture of pressure housings/seals, contraction/expansion, etc. – (extensive vertical movements = low reporting rates of PSATs swordfish & bigeye thresher sharks)?
• Sharks predation/nuptial bites• (sharks attracted to the EMF of PSATs,• very few tagged males report back)?
• Damage to antennae by predation • or fouling organisms?
• Malfunction other than battery• -Fusible link and/or RD1500?

Attachment Failure
79%Responded
No response21%
System Failure
662 PSATs Deployed
Tag Damaged
Pressure Housing Fails
Battery Fails
Diving stresses Housing
Severance Failure
Detaches early80%
Hits Pop off20%
animal dies(sample Hawaii)
Taghead/tether failsSeverance Mechanism Failure: too early
Tetherbreaks
Taghead rots out
Mono chaffedPin breaks on nosecone
nupital bitesAnimal is eaten
corrosional link failure - temp dependent?
repeated dives stress housingAnimal dives
faster than pop off mechanism
RD1500, 1800 failure
Out of ARGOS view Tag Failure
RiskAssessmentTree
P(Hits Pop-off|Responds)=19.5%
P(Before Pop-off|Responds)=80.5%
•Blue: We can estimate now.
•Yellow: Others have done it.
•Green: We have plans to do it.
•Grey: Perhaps unknowable?

Of 662 PSATs attached to sharks, billfish, tunas and turtles, 520 or 79% reported data.
87 or 17% hit their programmed pop-off date
142 or 21% Non-reporting tags is not synonymous with mortality.

18 Species grouped into 4 Depth classes
4 Depth classes group 18 species0=Littoral1=Epi-Pelagic2=Meso Pelagic3=Bathy-Pelagic
Some species ns=1 ns=4; smallTo Improve Power:
Use relevant grouping variables


Epi-Pelagic
Meso-Pelagic
Bathy-Pelagic


18 SpeciesProportion at Liberty
0. 00
0. 25
0. 50
0. 75
1. 00
pct pop
0. 0 0. 2 0. 4 0. 6 0. 8 1. 0 1. 2
STRATA: Speci es=1 Speci es=4 Speci es=6 Speci es=10Speci es=11 Speci es=12 Speci es=14 Speci es=15Speci es=16 Speci es=17 Speci es=18

4 Depth ClassesProportion at Liberty
Conjecture: Pressure!

Geographic Location
• Retention model has Latitude at pop off• Tagger teams operate in different regions.• Thus tagger team is also a REGION
variable.

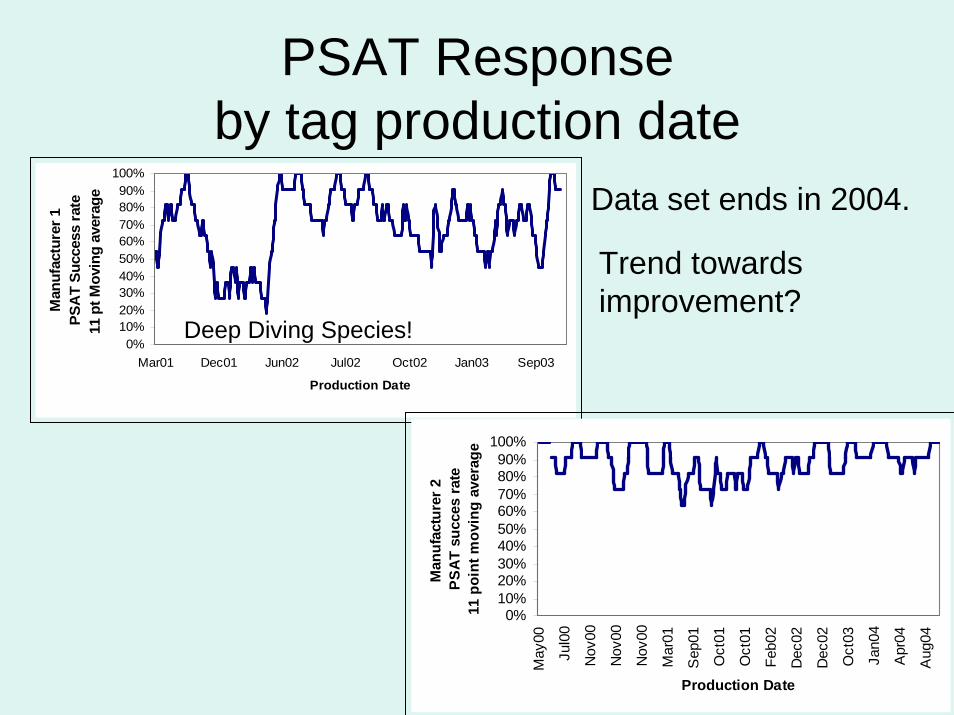
PSAT Response by tag production date
0%10%20%30%40%50%60%70%80%90%
100%
Mar01 Dec01 Jun02 Jul02 Oct02 Jan03 Sep03
Production Date
Man
ufac
ture
r 1PS
AT
Succ
ess
rate
11 p
t Mov
ing
aver
age
0%10%20%30%40%50%60%70%80%90%
100%
May
00
Jul0
0
Nov
00
Nov
00
Nov
00
Mar
01
Sep
01
Oct
01
Oct
01
Feb0
2
Dec
02
Dec
02
Oct
03
Jan0
4
Apr
04
Aug
04
Production Date
Man
ufac
ture
r 2PS
AT
succ
es ra
te 1
1 po
int m
ovin
g av
erag
e
Data set ends in 2004.
Trend towards improvement?
Deep Diving Species!

Spurious ‘Bad Batch’???
0%10%20%30%40%50%60%70%80%90%
100%
Mar01 Dec01 Jun02 Jul02 Oct02 Jan03 Sep03
Production Date
Man
ufac
ture
r 1PS
AT
Succ
ess
rate
11 p
t Mov
ing
aver
age
Overall response rate 31%...however depth class is implicated!
Dec 2001 to March 2002

PSAT Response Rate

Non-response rates by depth class and manufacturer. SE in parentheses. Depth class
Manufacturer PSAT Responded
PSAT No
Response
No response%
by depth and manufacturer
No Response%
by depth class
0 MT 3 3 50%(20.4%) WC 29 5 15%(6.1%)
20%(6.3%)
1 MT 97 34 26%(3.8%) WC 178 19 10%(2.1%)
16%(2%)
2 MT 137 43 24%(3.2%) WC 55 8 13%(4.2%)
21%(2.6%)
3 MT 18 30 63%(7.0%) WC 3 0 0%(0.0%)
59%(6.9%)
OVERALL ALL
Depths BOTH
Manufacturers 520 142 21%(1.6%)

PSAT non-response rate by Depth class
0%10%20%30%40%50%60%70%80%90%
100%
0 1 2 3Depth Class
Dud
rate


Logistic Regression
• LOGIT or Log Odds • Binary responses with Binomial distribution• X can be categorical, ordinal or continuous• Maximum likelihood estimates of parameters β• Exp(β) is ODDS of the event.• Categories are compared to baseline.
xβαπ
π+=⎟
⎠⎞
⎜⎝⎛−1
log

Comment on Interpretations
• Parameters β are ‘log odds’• Exp(β) of parameters are ODDS of the
event.• Comparisons to LAST category.
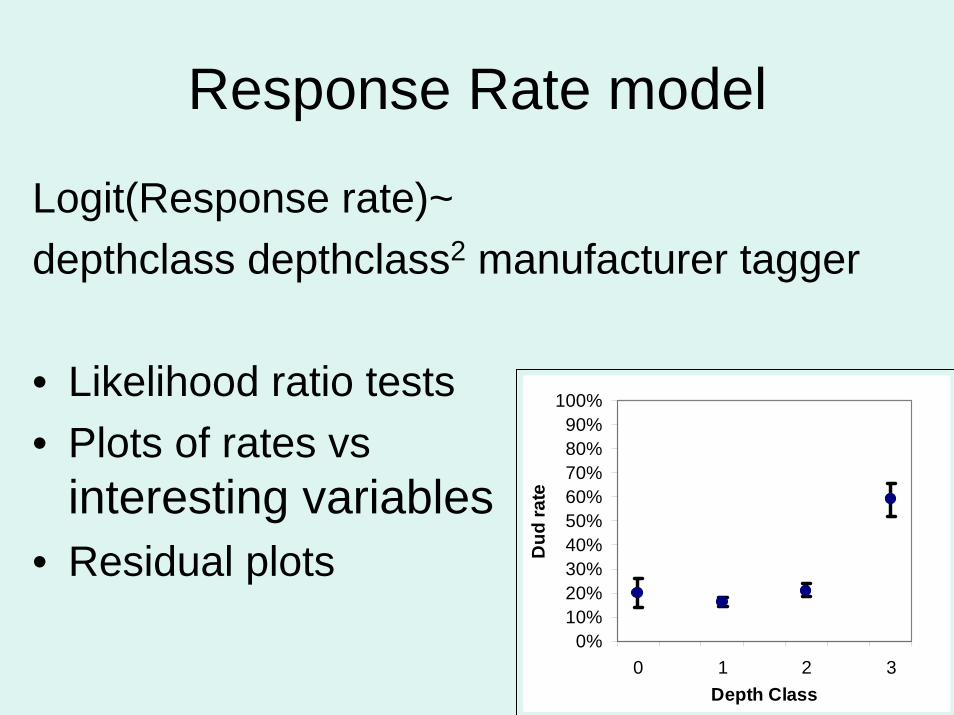
Response Rate model
Logit(Response rate)~depthclass depthclass2 manufacturer tagger
• Likelihood ratio tests• Plots of rates vs
interesting variables• Residual plots
0%10%20%30%40%50%60%70%80%90%
100%
0 1 2 3Depth Class
Dud
rate

Parameter β^ SE p-valueIntercept 1.60 0.45 0.0004Depthclass (0,1,2,3) 0.66 0.52 0.2Depthclass2 -0.34 0.15 0.02Manufacturer: MT vs WC -0.70 0.13 <0.0001Tagger:BrMus vs Swimmer -0.41 0.24 0.09Tagger:Domeier vs Swimmer -0.38 0.22 0.078Tagger:Lutcavage vs Swimmer 0.89 0.26 0.0006
Logistic Regression:
PSAT Reporting Rate

Age at Deployment
• Older PSATs have fewer non-reporters.• Tag age effect disappears with depth
class.• Why?
Older tags on Epi-Pelagic species.• Depth class is the key variable.
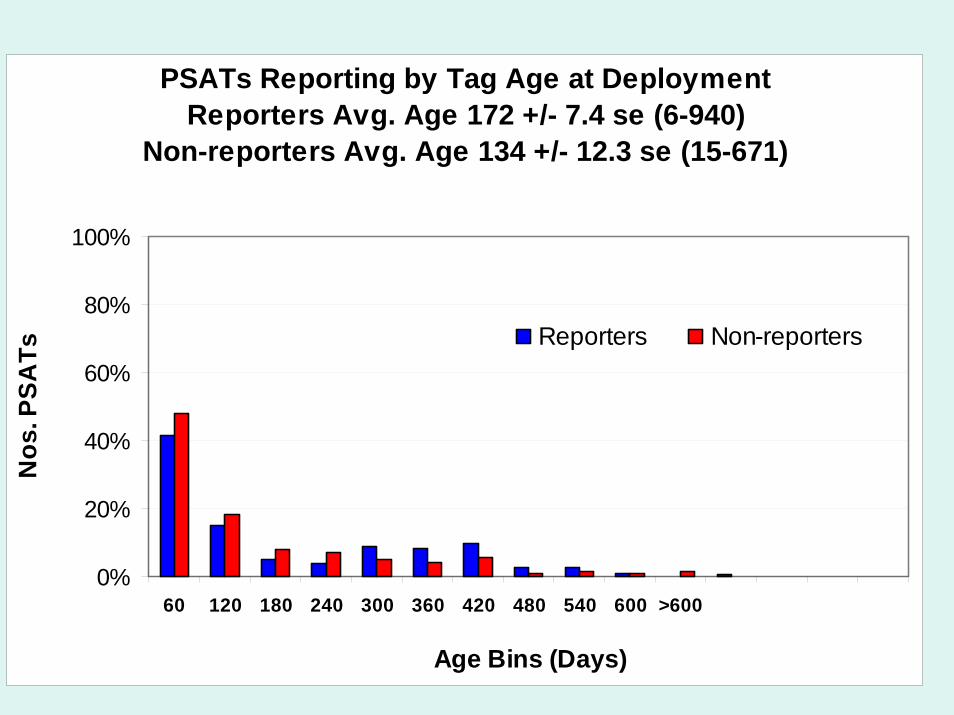
PSATs Reporting by Tag Age at DeploymentReporters Avg. Age 172 +/- 7.4 se (6-940)
Non-reporters Avg. Age 134 +/- 12.3 se (15-671)
0%
20%
40%
60%
80%
100%
60 120 180 240 300 360 420 480 540 600 >600
Age Bins (Days)
Nos
. PSA
Ts
Reporters Non-reporters

Conclusions PSAT Response Rate
• Depth class is implicated in non-responding PSATS.
• Age at deployment is a non-issue.• Tagger team is a stand in for regional
differences.

PSAT %data returned

Difference in types of data: WC
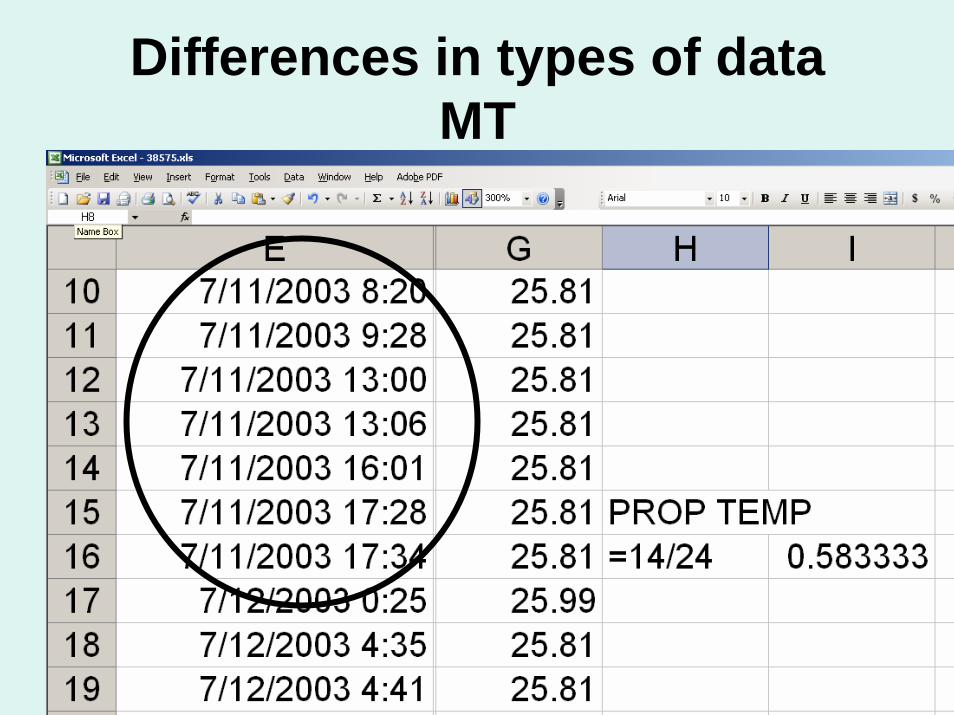
Differences in types of dataMT

Example
We assert: Equivalent.
Comparison is valid.
propTemp=Ntemp/(setpopdays*24/interval)
Ntemp=101; Setpop=184 days; 6hr intervals
propTemp=101/(184*24/6)=0.137

Swordfish - fraction of days at liberty with geolocations = 9%
0
50
100
150
200
Dep
th (m
)Blue marlin
= Geolocations
0100200300400500600700800
Dept
h(m
)
= No geolocationsbigeye tuna and bigeye thresher sharks
80% Deep diving species rarely return good geo location data.<13%

%Geolocation Data PSATs
0 0.2 0.4 0.6 0.8 1 1.2
Alopias superciliosus
Xiphias gladus
Prionace glauca
Thunnus thynnus
Caretta caretta
Carcharodon carcharias
Thunnus obesus
Isurus oxyrinchus
Megalops atlanticus
Tetrapturus audax
Makaira indica
Thunnus albacares
Lepidochelys olivacea
Carcharhinus longimanus
Makaira nigricans
Carcharhinus falciformes
Chelonia mydas
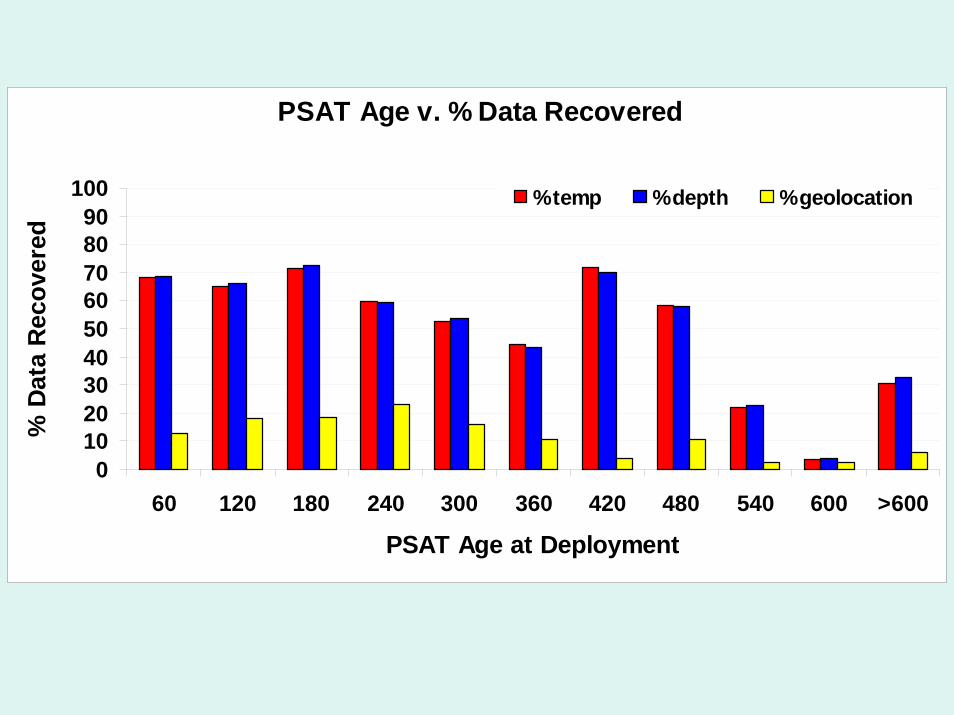
PSAT Age v. % Data Recovered
0102030405060708090
100
60 120 180 240 300 360 420 480 540 600 >600
PSAT Age at Deployment
% D
ata
Rec
over
ed
%temp %depth %geolocation

Proportion of data points vsPSAT age at deployment
Manuf act urer 1 2
0. 00
0. 25
0. 50
0. 75
1. 00
DepAge
0 100 200 300 400 500 600 700 800 900 1000

Proportion of data pointsvs. Depth class
Manuf act urer 1 2
0. 00
0. 25
0. 50
0. 75
1. 00
Dept hcl ass
0. 0 1. 0 2. 0 3. 0 3. 5

Proportion of data pointsvs Latitude
Manuf act urer 1 2
0. 00
0. 25
0. 50
0. 75
1. 00
ARGOSl at
-40 -30 -20 -10 0 10 20 30 40 50 60 70

Why is missing-ness important?0
100
200
300
400
5009/4 9/5 9/6 9/7 9/8 9/9
Dep
th (m
)
Bigeye Thresher Shark

Optimal Set pop days:Thought experiment
• Suppose you argued set pop off days=10?Few days at liberty, so then data value could be
improved with optimal set pop>10.• Suppose you argued set pop off days=1000?
Then battery wears out...no data. Optimal set pop off must be less than1000.
CONCLUSION: There exists an optimal set pop off days >10 and <1000.
Answer depends on species, manufacturer and latitude.

Conclusions on PSAT data returned
• Deep diving species poor candidates for geo-location data.
• Age at deployment, depth class, species and latitude are all influential.
• Microwave Telemetry returns larger proportion of expected data points than Wildlife Computers.
• Large gaps in time series are problematic.

PSATRETENTION

PSAT Retention rates by depth class
0%10%20%30%40%50%60%70%80%90%
100%
0 1 2 3
Depth class
Per
cent
of P
SATs
hi
tting
set
pop
off
day

PSAT Retention ratesby tagger team
0%10%20%30%40%50%60%70%80%90%
100%
BrMus Domeier Lutcavage
Tagger Team
Per
cent
of P
SAT
s hi
tting
se
t pop
off
day

Retention Rates of Billfish tags
0
10
20
30
40
50
60
70
80
90
flopper metal nylon plastic umbrella
% D
AL
of p
op-o
ff

Swivel Augmentation on DAL
0102030405060708090
100
flopper harness metal turtle
%D
AL
of P
op-o
ff No SwivelSwivel
n=29 n=18 - 9 n=8 - 1
n=10 - 10

Logistic Model for Retention Success
Parameter β^ SE pIntercept -3.21 0.48 <0.0001
Depth class 0.54 0.23 0.0203Tagger BrMus vs Lutcavage -0.75 0.59 0.2069Tagger Domeier vs Lutcavage 1.27 0.36 0.0005Tag-head Flopper vs Umbrella 1.75 0.82 0.0319Tag-head Nylon vs Umbrella -0.85 0.38 0.0233Tag-head Stainless vs Umbrella 0.53 0.39 0.1733Tag-head Titan. vs Umbrella -1.63 0.66 0.0130
Latitude 0.02 0.008 0.0182

Residual Plots
t agger BrMus Domei er Lut cavag Swi mmer
-3
-2
-1
0
1
2
DepAge
0 100 200 300 400 500 600 700 800 900 1000

ODDS of Retention
Odds of retention increases with each depth class by a multiplicative factor of 1.72.
Odds of retention increases with each degree of latitude by a multiplicative factor of 1.02.
Odds of retention increases with flopper/swivel tag-heads by a multiplicative factor of 5.75 compared to umbrellas.

PSAT Retention Conclusions• Deeper diving species more likely to
retain the tags.• Floppers increase probability of tag
retention.• Species in colder Latitudes more like to
retain tag.• Domeier’s tagger team has best
retention rates.

Overall Conclusions• Bathy-Pelagic has higher non-response
rate. Implicates pressure.• More data returned for MT tags.• There exists an optimal set pop days
dependent on species.• Floppers increase tag retention.• Depth, Latitude increase retention.Implicating temperature.

Mahalo’sMahalo’s To:To:• John Sibert
• Michael Laurs
• Scientists, Crew and Officers of the NOAA RV Townsend Cromwell and the Elton Oscar Sette
• JIMAR
• PIFSC/NOAA
