public attitudes and satisfaction - world meteorological
TRANSCRIPT

GfK NOP
Public Attitudes and Satisfaction: quantitative research Report - 2009
A research report for COI on behalf of the
Public Weather Service/The Met Office
Provided by: GfK NOP Social Research
Your contact: Tim Buchanan
Phone:+44 (0)20 7890 9786
Fax: +44 (0)20 7890 9589
E-Mail: [email protected]
GfK NOP
Contents
1 Introduction ..........................................................................................1
2 In Short .................................................................................................1
3 Key Findings ..........................................................................................2
3.1 Awareness and Visibility of Forecasts ................................................ 2
3.2 Satisfaction with Weather Forecasts.................................................. 2
3.3 Use of Forecasts ............................................................................. 3
4 Detailed Findings...................................................................................4
4.1 Awareness and Visibility of Forecasts ................................................ 5
4.1.1 Frequency of seeing or hearing a forecast............................. 5 4.1.2 Where forecasts are seen most often ................................... 7 4.1.3 Frequency of seeing or hearing forecasts, by method ............ 9 4.1.4 Channels used.................................................................. 13
4.2 Satisfaction with Weather Forecasts................................................ 16
4.2.1 Ease of understanding....................................................... 16 4.2.2 Accuracy .......................................................................... 18 4.2.3 Everything wanted............................................................ 20 4.2.4 Things wanted from a weather forecast that are not usually
provided .......................................................................... 21 4.3 Use of Forecasts ........................................................................... 22
4.3.1 How much weather affects normal routine.......................... 22 4.3.2 Whether a point is made of seeing or listening to a forecast
every day......................................................................... 24 4.3.3 Whether particular attention is paid to a forecast if it comes
on ................................................................................... 26 4.3.4 Frequency of certain actions as a result of a weather forecast27 4.3.5 Reasons for not taking action ............................................ 28 4.3.6 Overall usefulness of weather forecasts .............................. 29
Appendices ...................................................................................................... i
Methodology ............................................................................................... i
The Questionnaire ....................................................................................... ii
Sample Profile ............................................................................................ vi

GfK NOP
1
1 Introduction
The Public Weather Service (PWS) provides a range of weather information and services that
allow the public to “optimise or mitigate against the impact of weather” in their daily
activities. It is funded by the Ministry of Defence through the Public Weather Service
Customer Group (PWSCG) which has set it a series of requirements. To measure their
effectiveness against these requirements the Central Office of Information (COI), on behalf of
the PWS, commissioned GfK NOP to conduct a series of surveys to ascertain public
satisfaction levels with the service they provide. This report covers the findings of 3 surveys
conducted in November 2007, November 2008 and November 2009.
2 In Short
Across the three surveys
Nearly all consider forecasts easy to understand
Nine out of ten think weather forecasts are useful (very or fairly)
Between seven and eight out of ten think that weather forecasts are accurate (very or
fairly)
Television is the medium used by most people most often for forecasts
Most look at or hear a forecast at least once a day
There has been very little movement in findings across the three waves of research

GfK NOP
2
3 Key Findings
3.1 Awareness and Visibility of Forecasts
Eight out of ten see or listen to forecasts at least once a day (see p5).
Around three quarters of those who see or hear forecasts get their forecasts from television
and 13% from the radio. Other media are used by far fewer respondents (see p7).
BBC TV is the channel watched most often for TV forecasts, followed by ITV. Use of other
terrestrial channels is negligible and only around 4% of respondents get weather forecasts
from Sky (see p13).
BBC national radio is the station listened to most often for radio forecasts followed by local
commercial radio stations (see p14).
The BBC website is used most often for online forecasts followed at much lower levels by
Google (see p15).
3.2 Satisfaction with Weather Forecasts
Most (90+%) find forecasts easy to understand with BBC TV followed by ITV forecasts
considered the easiest to understand (see pages 16 and 17).
Two thirds (66%) consider forecasts fairly accurate (a further 8% very accurate). The most
accurate forecasts are considered to come from BBC TV followed by ITV (see pages 18 and
19).
BBC TV is thought to provide the forecast most likely to give respondents everything they
want from a weather forecast, followed by ITV (see p20).
Most want nothing more from forecasts (see p21).
GfK NOP
3
3.3 Use of Forecasts
Around a fifth of respondents say that the weather affects their normal routine to do with
work or housekeeping whilst around a third say the same about the weather affecting their
normal routine to do with leisure (see pages 22 and 23).
Just over a third of respondents make a particular point of watching a forecast daily, a fifth
do so sometimes and c45% just watch or listen to it if it comes on (see p24).
Just under half of respondents always pay particular attention to forecasts if they come on
whilst they are watching TV or listening to the radio, a third sometimes pay attention and a
fifth say that they do not pay particular attention (see p26).
Respondents are more likely to take an umbrella or change clothes as a result of a weather
forecast (66% very or fairly often) than to undertake alternative activities (27% very or fairly
often) or change travel plans (16% very or fairly often) (see p27).
Overall, around nine out of ten respondents in each year consider weather forecasts either
very or fairly useful (see p29).

GfK NOP
4
4 Detailed Findings
The full findings from the three surveys are discussed in this section. There are few
differences in evidence across the three years, and even where differences are statistically
significant, unless they are showing a continuing trend in any one direction little should be
read from any single change. Where such trends are in evidence they are highlighted.
Demographic and regional differences are highlighted where they are consistent across the 3
waves of research. Where no differences are mentioned they are either not statistically
significant or did not appear in every wave of research (which would indicate a trend).
The table below gives an estimate of the difference you would need to see between waves of
the survey (based on 2200 interviews) if it were conducted using a random probability survey
to be sure there is a real difference. It is not strictly applicable for a quota survey, which is
what these surveys were, but it is useful as a guide. The proportions in the blue boxes
represent the value of a finding and below it the difference required to indicate (at 95%
levels of confidence) that it is a statistically significant difference.
5% 10% 15% 20% 25% 30% 35% 40% 45%
or 95%
or 90%
or 85%
or 80%
or 75%
or 70%
or 65%
or 60%
or 55%
50%
2200 1.3 % 1.8 % 2.1 % 2.4 % 2.6 % 2.7 % 2.8 % 2.9 % 2.9 % 3.0 %
While wave on wave differences may apparently show significant differences it is wise not to
read too much into this unless a trend is witnessed over more than one wave or the change
is maintained in subsequent waves, hence isolated statistically significant differences have
not been highlighted in the following sections.

GfK NOP
4.1 Awareness and Visibility of Forecasts
In this section we explore frequency of seeing or hearing forecasts and where forecasts are
seen or heard.
4.1.1 Frequency of seeing or hearing a forecast
To establish awareness, respondents were first asked how often they saw or heard a weather
forecast. The majority indicate that they do so at least once a day, and while the differences
are not quite significant there is a trend upwards for more than once a day and downward for
once a day. The proportion who say ‘never’ or ‘less often’ is also dropping over time.
How often do you see or hear a weather forecast?
4%
3%
1%
6%
7%
42%
38%
3%
2%
1%
7%
6%
41%
40%
2%
1%
1%
7%
8%
40%
41%
Never
Less often
Once or twice amonth
Once or twice aweek
Several times aweek
Once a day
More than oncea day
2009
2008
2007
Base: all (‘07 2204, ‘08 2223, ’09 2207)
5

GfK NOP
6
Age had a bearing on frequency of watching or seeing a forecast in each year, with the 16-24
year olds more likely than others to never see or hear one and older respondents more likely
than others to see or hear a forecast more than once a day.
Table 1: Frequency of watching or listening to forecasts by age
Overall 16-24 year olds 65+ year olds
2007-09 2007 2008 2009 2007 2008 2009
Base: all (c2000)
%
(279)
%
(256)
%
(271)
%
(432)
%
(464)
%
(470)
%
More than once a day 35-41 19 20 20 52 55 56
Never 2-4 10 10 6 3 1 1

GfK NOP
4.1.2 Where forecasts are seen most often
Around three quarters of those who have ever seen or heard a forecast see it most often on
television. The second most common medium is radio but at a much lower level than for TV.
The use of the internet for looking at forecasts is low but seems to indicate a gradual rise
across the years and rises amongst the younger age groups (see overleaf). Only a very small
proportion of respondents use interactive text services or mobile phones as their primary
means of checking weather forecasts.
Where do you see or hear a weather forecast most often?
1%
6%
15%
77%
1%
0.40%
1%
7%
13%
77%
1%
8%
13%
76%
0.40%
0.40%
0.40%0.40%
*
*
1%
Other
Mobile phone
Interactive textservices
In a newspaper
On the internet
On the radio
On television
2009
2008
2007
*=less than 0.4% Base: all who see or hear a weather forecast (‘07 2112, ‘08 2164, ’09 2154)
7

GfK NOP
8
In all years younger respondents (up to the age of 34 or even 44) were significantly more
likely to look at forecasts over the internet than older respondents.
Table 2: Looking at forecasts via the internet by age
Total 16-24 25-34 35-44 45-54 55-64 65+ 2007 6% 13% 11% 6% 6% 3% 1%
2008 7% 10% 13% 13% 4% 2% *
2009 8% 11% 14% 10% 9% 4% * *=less than 0.5%

GfK NOP
4.1.3 Frequency of seeing or hearing forecasts, by method
Three quarters of those who see or hear weather forecasts saw a forecast on television at
least once a day. Again we see an upward trend of seeing or hearing a forecast more than
once a day. As with frequency of seeing or hearing forecasts at all, those aged 65+ are more
likely than others to have seen a TV forecast more than once a day whereas the 16-24 years
olds are more likely to say they have never seen TV weather.
How often do you usually see a weather forecast on television?
2%
9%
8%
41%
34%
4%
2%
8%
7%
41%
36%
4%
3%
2%
7%
9%
37%
38%
3%
3%
3%
Never
Less often
Once or twice amonth
Once or twice aweek
Several times aweek
Once a day
More than oncea day
2009
2008
2007
Base: all who see or hear a weather forecast (‘07 2112, ‘08 2164, ’09 2154)
9

GfK NOP
As we saw earlier, fewer people use the radio rather than TV as their primary source of
forecasts which explains the high proportion of ‘never’ in the chart below. Around two fifths
of those who ever see or hear weather forecasts listen to one on the radio at least once a
day.
How often do you usually hear a weather forecast on the radio
2%
7%
7%
19%
19%
36%
3%
8%
7%
20%
18%
35%
9%
3%
7%
7%
19%
19%
33%
11%10%
Never
Less often
Once or twice amonth
Once or twice aweek
Several times aweek
Once a day
More than oncea day
2009
2008
2007
Base: all who see or hear a weather forecast (‘07 2112, ‘08 2164, ’09 2154)
10

GfK NOP
The internet is used even less frequently than TV or radio, although there is a definite drop in
the proportion who say ‘never’ across the 3 surveys. As we noted before the internet is more
likely to be used for forecasts by the 16-44 year olds (around 18% once a day or more) than
those aged 45+ (around 7-10% over the same frequency).
How often do you usually see a weather forecast on the internet?
4%
6%
3%
7%
3%
61%
5%
7%
5%
9%
4%
54%
9%
5%
9%
5%
9%
5%
9%
65%
9%
Never
Less often
Once or twice amonth
Once or twice aweek
Several times aweek
Once a day
More than oncea day
2009
2008
2007
Base: all who see or hear a weather forecast (‘07 2112, ‘08 2164, ’09 2154)
11

GfK NOP
Forecasts in newspapers are looked at about as frequently as forecasts on the internet.
There exists a significant difference between those aged 65+, 16-18% of whom across all 3
years look at a newspaper forecast at least once a day, and younger respondents (7-9% of
16-24 year olds look at newspaper forecasts at least once a day).
How often do you usually see a weather forecast in a newspaper?
3%
7%
3%
10%
1%
65%
2%
7%
3%
11%
1%
62%
9%
3%
8%
4%
10%
1%
62%
11%9%
Never
Less often
Once or twice amonth
Once or twice aweek
Several times aweek
Once a day
More than oncea day
2009
2008
2007
Base: all who see or hear a weather forecast (‘07 2112, ‘08 2164, ’09 2154)
Frequency of use of mobile phone weather forecasts has not been charted as this is never
used by 90% of respondents.
12

GfK NOP
4.1.4 Channels used
As the chart below clearly indicates, the BBC is the most popular television channel for
weather forecasts, a popularity which is growing, followed by ITV which is diminishing in
popularity over the three waves of the survey. Other TV channels are used by only a small
minority of respondents.
On which TV channel do you see a weather forecast most often?
5%
1%
33%
55%
3%
5%
1%
1%
31%
58%
4%
1%
4%
1%
1%
29%
59%
*
2%
5%
1%
Don't know
Other
Sky
Channel 5
Channel 4
ITV
BBC TV
2009
2008
2007
*=less than 0.5% Base: all who ever see a weather forecast on television (‘07 2061, ‘08 2088, ’09 2078)
13

GfK NOP
A similar question was asked about radio stations amongst those who hear weather forecasts
via the radio. The BBC is again the most common source of forecasts, at a national level, but
local commercial radio stations were the next most likely followed by BBC local radio at
around half the rate of local commercial radio.
On which station do you hear a weather forecast most often
6%
14%
41%
4%
6%
14%
26%
45%
7%
4%
8%
11%
26%
44%
7%
6%
26%
4%
Don't know
Other
Nationalcommercial radio
BBC local radio
Local commercialradio
BBC nationalradio
2009
2008
2007
Base: all who ever hear a weather forecast on a radio (‘07 1392, ‘08 1373, ’09 1399)
Respondents in Northern Ireland were consistently more likely than others to listen to BBC
local radio and those in London more likely than any other region to say ‘Other’.
14

GfK NOP
The BBC is again the most likely choice when it comes to getting forecasts from a website
with Google the next most popular site but at much lower levels.
On which website do you see a weather forecast most often?
3%
8%
42%
9%
2%
7%
14%
48%
10%
22%
1%
11%
14%
42%
11%
21%
15%
23%
Don't know
Other
ITV
Met Office
BBC
2009
2008
2007
Base: all who ever see a weather forecast on a website (‘07 699, ‘08 822, ’09 944)
15

GfK NOP
4.2 Satisfaction with Weather Forecasts
Several questions were asked about the quality of weather forecasts giving us a general
feeling for how satisfied people are with them. The next sections explore ease of
understanding, perceptions of accuracy and the usefulness of weather forecasts.
4.2.1 Ease of understanding
A general question on how easy or difficult weather forecasts are to understand revealed that
most find it easy, with more saying ‘very easy’ than ‘fairly easy’.
When you see or hear a weather forecast, how easy or difficult would you say it is to understand?
1%
4%
55%
1%
3%
36%
59%
1%
3%
41%
54%
1%
*
39%
*
*
*
*
Don't know
Very difficult
Fairly difficult
Neither easy nordifficult
Fairly easy
Very easy
2009
2008
2007
*=less than 0.5% Base: all who see or hear a weather forecast (‘07 2112, ‘08 2164, ’09 2154)
16

GfK NOP
The next chart shows which of the channels people think have the weather forecast that is
the easiest to understand. The response to this question may be affected by what people
watch, see or listen to on a regular basis. So they may cite their regular channel weather
forecast as the easiest to understand.
Which weather forecast is the easiest to understand?
1%
2%
1%
3%
5%
3%
22%
39%
1%
2%
7%
3%
3%
3%
21%
41%
1%
3%
8%
3%
3%
2%
18%
42%
3%
14%
7%
1%
2%
17%
*
3%
16%
Don't know
No one easier thanothers
Only see/hear one
Other
Any internet
Any newspaper
Other radio
BBC Radio
Other TV
ITV
BBC TV
2009
2008
2007
*=less than 0.5% Base: all who see or hear a weather forecast (‘07 2112, ‘08 2164, ’09 2154)
17

GfK NOP
4.2.2 Accuracy
When asked about accuracy a majority in each wave consider weather forecasts fairly
accurate as the chart below indicates.
Generally speaking, how accurate or inaccurate do you think most weather forecasts are?
7%
13%
9%
9%
10%
69%
9%
10%
14%
66%
8%
68%
2%
1%
1%
1%
2%
1%Don't know
Very inaccurate
Fairly inaccurate
Neither accuratenor inaccurate
Fairly accurate
Very accurate
2009
2008
2007
Base: all who see or hear a weather forecast (‘07 2112, ‘08 2164, ’09 2154)
More respondents in London than elsewhere think forecasts are very accurate (20%, 16%
and 15% in each of the 3 years respectively).
18
GfK NOP
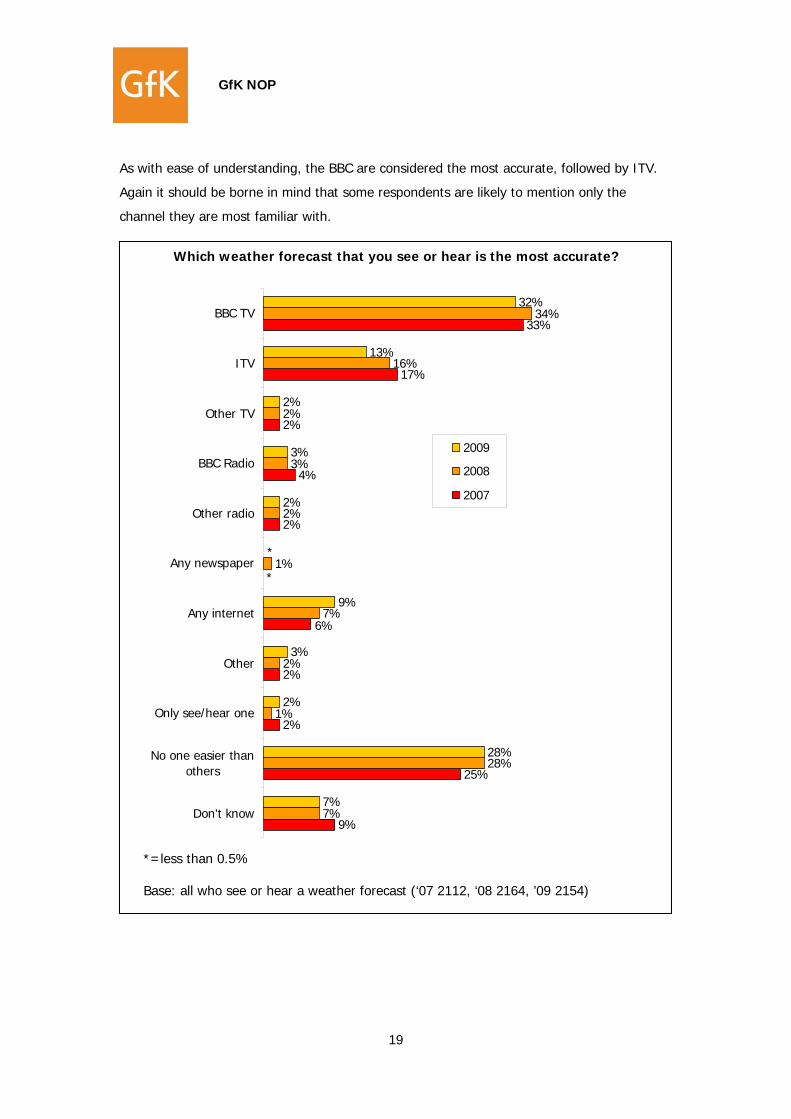
As with ease of understanding, the BBC are considered the most accurate, followed by ITV.
Again it should be borne in mind that some respondents are likely to mention only the
channel they are most familiar with.
Which weather forecast that you see or hear is the most accurate?
2%
2%
2%
4%
2%
17%
33%
1%
2%
7%
2%
3%
2%
16%
34%
2%
3%
9%
2%
3%
2%
13%
32%
*
6%
25%
9%
28%
7%
1%*
28%
7%Don't know
No one easier thanothers
Only see/hear one
Other
Any internet
Any newspaper
Other radio
BBC Radio
Other TV
ITV
BBC TV
2009
2008
2007
*=less than 0.5% Base: all who see or hear a weather forecast (‘07 2112, ‘08 2164, ’09 2154)
19

GfK NOP
4.2.3 Everything wanted
When asked which forecast is the most likely to provide everything wanted from a weather
forecast, BBC TV was again the most popular choice, followed by ITV.
Which weather forecast is the most likely to give you everything you want from a weather forecast?
3%
10%
3%
4%
3%
22%
40%
3%
11%
1%
3%
3%
22%
43%
3%
14%
3%
3%
2%
18%
42%
9%
6%
1%
2%
7%
6%
8%
7%
*
Don't know
No one easier thanothers
Other
Any internet
Any newspaper
Other radio
BBC Radio
Other TV
ITV
BBC TV
2009
2008
2007
Base: all who see or hear a weather forecast (‘07 2112, ‘08 2164, ’09 2154)
20

GfK NOP
4.2.4 Things wanted from a weather forecast that are not usually provided
There was little consistency in what people want that is not usually provided except that the
majority said ‘nothing’. Other than that better accuracy came top of the requests followed by
more local information and longer range forecasts. The ‘other’ category included such things
as wind speed, driving conditions, tide times, hours of sunshine, isobars to be shown, reports
on other countries, better graphics, flood warnings and jet stream information.
Are there any things you want from a weather forecast that you don’t usually get?
1%
1%
1%
2%
3%
7%
11%
1%
0%
1%
2%
2%
5%
9%
1%
2%
1%
1%
2%
3%
7%
11%
75%
1%
1%
1%
79%
2%
74%
1%
Nothing
Other
Clearer symbols
Sunburn warnings
Pollution indicators
Allergy indicators
More detail bytime of day
Longer rangeforecast
More localinformation
Better accuracy
2009
2008
2007
Base: all who see or hear a weather forecast (‘07 2112, ‘08 2164, ’09 2154)
21

GfK NOP
4.3 Use of Forecasts
The paragraphs in this section explore what use people make of the forecasts available, first
looking at how much of an issue weather is to respondents.
4.3.1 How much weather affects normal routine
Two questions were asked of all respondents about the effect weather has on normal
routine. The first of these covered work or housekeeping. As the chart indicates a fifth to a
quarter of respondents say a fair amount or a great deal wave on wave. The proportion who
say a fair amount is rising across the 3 surveys.
How much would you say your normal routine for work or housekeeping is affected by the weather?
30%
13%
30%
14%
7%
28%
17%
7%
1%
49%
7%
1%
49%
*
47%
Don't know
Not at all
A little
A fair amount
A great deal
2009
2008
2007
Base: all (‘07 2204, ‘08 2223, ’09 2207)
22

GfK NOP
The second question looked at the effect of weather on leisure activities. As can be seen
below weather is more likely to have an impact on leisure than it did on work or
housekeeping, with around three in ten to a third saying a great deal or a fair amount.
How much would you say your normal routine for leisure is affected by the weather?
33%
21%
32%
21%
9%
31%
24%
11%
9%
36%
1%
38%
*
34%
*Don't know
Not at all
A little
A fair amount
A great deal
2009
2008
2007
Base: all (‘07 2204, ‘08 2223, ’09 2207)
23

GfK NOP
4.3.2 Whether a point is made of seeing or listening to a forecast every day
Overall there exists a split of around a third of people who make a special point of watching a
forecast daily, with over 40% only watching or listening if it comes on and the balance,
around a fifth, making a special point sometimes, presumably if they have a weather
dependent activity coming up.
Do you make a point of hearing or seeing a forecast every day, or do you just watch or listen if one comes on while you are
watching TV or listening to the radio?
16%
33%
17%
36%
18%
33%
47%
4%
45%
2%
46%
3%It varies/don't
know
Just if comes on
Sometimes makea special point
Always make aspecial point
2009
2008
2007
Base: all who see or hear a weather forecast (‘07 2112, ‘08 2164, ’09 2154)
24

GfK NOP
25
The split by whether people make a point of watching the weather daily or just happen to
catch it if it comes on is driven to some extent by age, with those aged 16-34 more likely
than those older to see it only when it comes on and older people more likely to make a
special point of catching a forecast. This backs up the trend that some younger people are
less concerned about weather.
16-34 year olds 35+ year olds
2007 2008 2009 2007 2008 2009
Base: all who see or hear a weather forecast
(617)
%
(634)
%
(628)
%
(1495)
%
(1530)
%
(1526)
%
Always makes a special point 22 23 20 38 41 39
Sometimes makes a special point 15 17 20 16 17 17
Just if it comes on 56 56 55 43 40 42
It varies/don’t know 7 4 5 3 2 3
GfK NOP
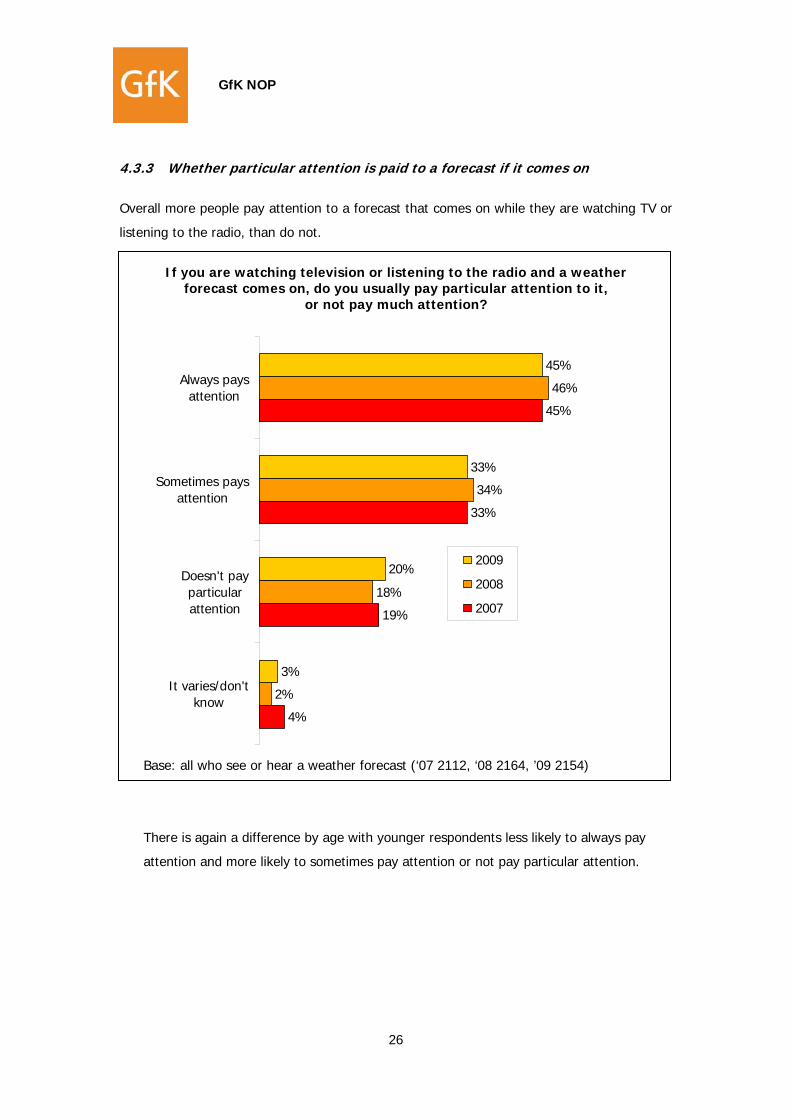
4.3.3 Whether particular attention is paid to a forecast if it comes on
Overall more people pay attention to a forecast that comes on while they are watching TV or
listening to the radio, than do not.
If you are watching television or listening to the radio and a weather forecast comes on, do you usually pay particular attention to it,
or not pay much attention?
33%
45%
34%
46%
33%
45%
4%
19%
2%
18%
3%
20%
It varies/don'tknow
Doesn't payparticularattention
Sometimes paysattention
Always paysattention
2009
2008
2007
Base: all who see or hear a weather forecast (‘07 2112, ‘08 2164, ’09 2154)
There is again a difference by age with younger respondents less likely to always pay
attention and more likely to sometimes pay attention or not pay particular attention.
26
GfK NOP
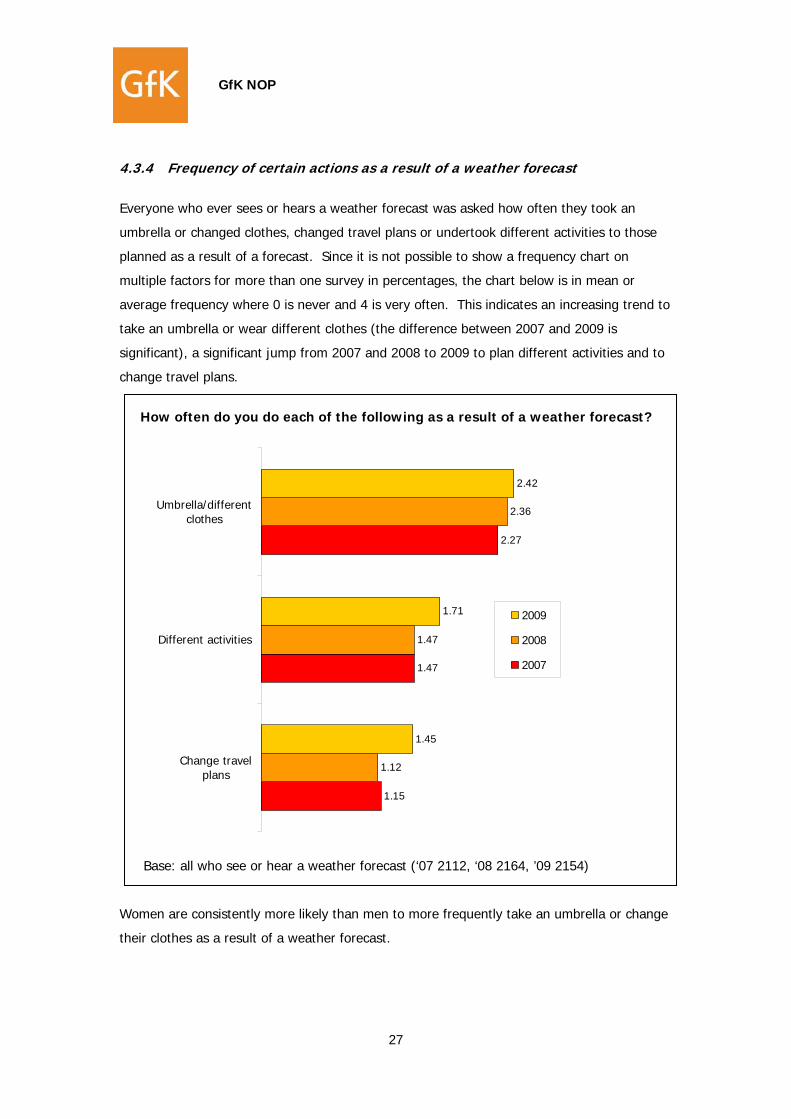
4.3.4 Frequency of certain actions as a result of a weather forecast
Everyone who ever sees or hears a weather forecast was asked how often they took an
umbrella or changed clothes, changed travel plans or undertook different activities to those
planned as a result of a forecast. Since it is not possible to show a frequency chart on
multiple factors for more than one survey in percentages, the chart below is in mean or
average frequency where 0 is never and 4 is very often. This indicates an increasing trend to
take an umbrella or wear different clothes (the difference between 2007 and 2009 is
significant), a significant jump from 2007 and 2008 to 2009 to plan different activities and to
change travel plans.
How often do you do each of the following as a result of a weather forecast?
1.15
1.47
2.27
1.12
1.47
2.36
1.45
1.71
2.42
Change travelplans
Different activities
Umbrella/differentclothes
2009
2008
2007
Base: all who see or hear a weather forecast (‘07 2112, ‘08 2164, ’09 2154) Women are consistently more likely than men to more frequently take an umbrella or change
their clothes as a result of a weather forecast.
27

GfK NOP
4.3.5 Reasons for not taking action
For the first time in 2009 a further question was included to ask respondents who take action
as a result of a weather forecast not very often, rarely or never, why that is the case. As the
chart below indicates, the primary reason given was that respondents were not really
concerned about the weather or that it wouldn’t put them off doing things. This is followed,
fairly closely in the case of whether people would change their travel plans for the day, by
the weather not affecting travel plans. Other reasons came in at much lower levels. The
‘other’ categories included such things as always having an umbrella on them/in the car, only
changing activities if they were doing something weather dependent, like sailing, or still have
to get things done regardless of the weather.
You say you (take an umbrella/wear different clothes, do different activities,
change travel plans) (not very often, rarely, never). Why is that?
7%15%
5%
8%
10%
10%
39%
28%
26%
44%
53%
45%
6%
5%
7%
9%
4%
4%
Change your travelplans for the day
(1612)
Plan a differentactivity for the day
(1430)
Take an umbrella orwear differentclothes (873)
I'm not really concerned with the weather/wouldn't put me off doing things
The weather doesn't affect my travel plans
I don't go out very much so it doesn't really apply
Don't think the forecast will be right
Other
Don't know
Base: All who not very often, rarely or never take action as a result of weather forecasts
(number in brackets after the statements).
28

GfK NOP
4.3.6 Overall usefulness of weather forecasts
The final question was about overall usefulness of forecasts and as the chart below indicates,
in all 3 surveys a large majority consider them either fairly or very useful.
Overall, how useful would you say weather forecasts are these days?
8%
57%
8%
58%
32%
9%
59%
28%
32%
2%
1%
1%
1%
2%
1%Don't know
Not at all useful
Not very useful
Fairly useful
Very useful
2009
2008
2007
Base: all who see or hear a weather forecast (‘07 2112, ‘08 2164, ’09 2154)
29

GfK NOP
i
Appendices
Methodology
The research was carried out through face to face interviewing in all twelve UK government
regions. The survey was conducted as part of GfK NOP’s Random Location Omnibus service
which interviews a fresh, representative sample of around 2000 adults aged 16+ in the
United Kingdom per survey.
Respondents are selected using a random location methodology with quotas set on age and
by gender within working status. The size of sample within each region reflects the
population distribution of the UK. Interviews are conducted by GfK NOP’s own fully trained
face-to-face interviewers using Computer Assisted Personal Interviewing (CAPI) laptop
computers.
With the full omnibus sample of 2000 only Northern Ireland and the North East fall
significantly below the target of 100 interviews per region. In order to ensure a valid
comparison with these regions a second wave of the Omnibus was run in these two regions
only.
In 2007 2112 interviews were achieved between 22nd Nov and 4th Dec.
In 2008 2223 interviews were achieved between 13th and 25th November.
In 2009 2207 interviews were achieved between 5th and 17th November.

GfK NOP
ii
The Questionnaire
I would now like to ask you some questions about weather forecasts. Q1 How often do you usually see or hear a weather forecast? PROMPT IF NECESSARY More than once a day Once a day Several times a week Once or twice a week Once or twice a month Less often Never Don’t know IF NEVER GO TO Q11a. OTHERS ASK Q2 Q2 Where do you see or hear a weather forecast most often? PROMPT IF NECESSARY On television On the radio In a newspaper On the internet On mobile phone Interactive text services Other DK Q3 How often do you usually see or hear a weather forecast on television on the radio in a newspaper on the internet on your mobile phone More than once a day Once a day Several times a week Once or twice a week Once or twice a month Less often Never Don’t know IF EVER TV ASK Q4 Q4 On which tv channel do you see a weather forecast most often? BBC ITV Channel 4 Channel 5 Sky Other

GfK NOP
iii
DK IF EVER RADIO ASK Q5 Q5 On which station do you hear a weather forecast most often? BBC National Radio BBC local radio National commercial radio Local commercial radio Other DK IF EVER INTERNET ASK Q6 Q6 On which website do you see a weather forecast most often? Met Office BBC ITV Google Other DK ASK ALL WHO EVER SEE/HEAR WEATHER FORECASTS Q7 Which weather forecast is the easiest to understand? BBC TV ITV Other TV BBC radio Other radio Any newspaper Any internet Other Only see/hear one None DK Q8 Which weather forecast that you see or hear is the most accurate? BBC TV ITV Other TV BBC radio Other radio Any newspaper Any internet Other Only see/hear one None DK

GfK NOP
iv
Q9 Which weather forecast is the most likely to give you everything you want from a weather forecast? BBC TV ITV Other TV BBC radio Other radio Any newspaper Any internet Other None DK Q10 Are there are any things you want from a weather forecast that you don’t usually get? What are these? More local information Clearer symbols More detail by time of day Longer range forecast Pollution indicator Allergy indicators Sunburn warnings Better accuracy Other (write in) Nothing ASK ALL Q11a SHOWCARD A How much would you say your normal routine for work or housekeeping is affected by the weather? READ OUT A great deal A fair amount A little Not at all DK Q11b SHOWCARD A AGAIN How much would you say your normal routine for leisure is affected by the weather? READ OUT A great deal A fair amount A little Not at all DK ASK ALL EXCEPT THOSE WHO SAID NEVER AT Q1. Q12 Do you make a point of hearing or seeing a weather forecast every day, or do you just watch or listen if one comes on while you are watching tv or listening to the radio? Always Make special point Sometimes make special point Just if comes on

GfK NOP
v
It varies/DK Q13 If you are watching television or listening to the radio and a weather forecast comes on, do you usually pay particular attention to it, or not pay much attention? IF PAYS ATTENTION ONLY TO FIRST ONE HEARD, CODE AS PAYS ATTENTION Always pays attention Sometimes pays attention Doesn’t pay special attention Varies/DK Q14 How often do you do each of the following as a result of a weather forecast? How often do you … Take an umbrella or wear different clothes as a result of a weather forecast Change your travel plans for the day as a result of a weather forecast Plan a different activity for the day as a result of a weather forecast Very often Fairly often Not very often Rarely Never DK Q14b was asked in 2009 only For each statement the respondent said ‘not very often’, ‘rarely’ or ‘never’ ask Q14b Q14b You say you (statement at Q14) (not very often/rarely/never)? Why is that? Don't think the forecast will be right/ not correct for my area The weather doesn't affect my travel plans I'm not really concerned with the weather/wouldn't put me off doing things I don't go out very much so it doesn't really apply Other (specify) Don't know Q15 SHOWCARD B When you see or hear a weather forecast, how easy or difficult would you say it is to understand? IF VARIES, PROBE FOR FORECAST SEEN/HEARD MOST OFTEN Very easy Fairly easy Neither easy nor difficult Fairly difficult Very difficult Don’t Know

GfK NOP
vi
Q16 SHOWCARD C Generally speaking, how accurate or inaccurate do you think most weather forecasts are? Very accurate Fairly accurate Neither accurate nor inaccurate Fairly inaccurate Very inaccurate Don’t know Q17 SHOWCARD D And overall, how useful would you say weather forecasts are these days? Very useful fairly useful not very useful not at all useful
GfK NOP
vii
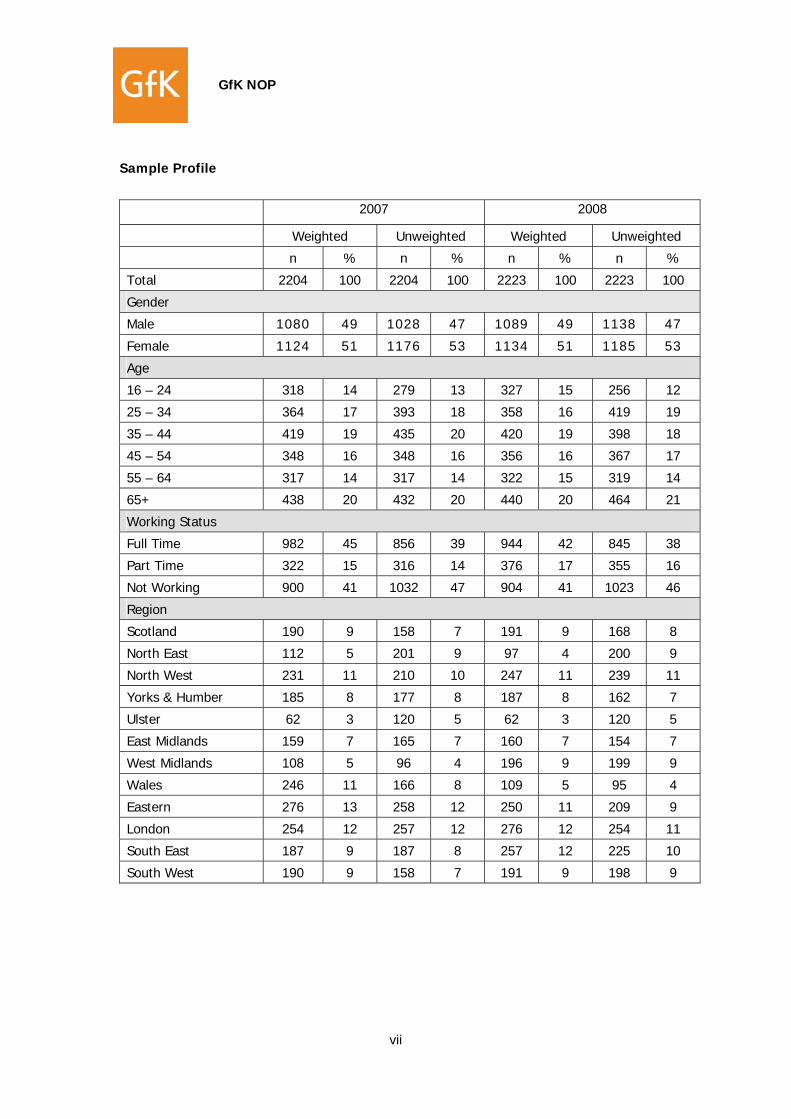
Sample Profile
2007 2008
Weighted Unweighted Weighted Unweighted
n % n % n % n %
Total 2204 100 2204 100 2223 100 2223 100
Gender
Male 1080 49 1028 47 1089 49 1138 47
Female 1124 51 1176 53 1134 51 1185 53
Age
16 – 24 318 14 279 13 327 15 256 12
25 – 34 364 17 393 18 358 16 419 19
35 – 44 419 19 435 20 420 19 398 18
45 – 54 348 16 348 16 356 16 367 17
55 – 64 317 14 317 14 322 15 319 14
65+ 438 20 432 20 440 20 464 21
Working Status
Full Time 982 45 856 39 944 42 845 38
Part Time 322 15 316 14 376 17 355 16
Not Working 900 41 1032 47 904 41 1023 46
Region
Scotland 190 9 158 7 191 9 168 8
North East 112 5 201 9 97 4 200 9
North West 231 11 210 10 247 11 239 11
Yorks & Humber 185 8 177 8 187 8 162 7
Ulster 62 3 120 5 62 3 120 5
East Midlands 159 7 165 7 160 7 154 7
West Midlands 108 5 96 4 196 9 199 9
Wales 246 11 166 8 109 5 95 4
Eastern 276 13 258 12 250 11 209 9
London 254 12 257 12 276 12 254 11
South East 187 9 187 8 257 12 225 10
South West 190 9 158 7 191 9 198 9

GfK NOP
viii
2009
Weighted Unweighted
n % n %
Total 2207 100 2207 100
Sex
Male 1081 49 1057 48
Female 1126 51 1150 52
Age
16 – 24 329 15 271 12
25 – 34 351 16 388 18
35 – 44 413 19 412 19
45 – 54 357 16 369 17
55 – 64 320 14 297 13
65+ 437 20 470 21
Working Status
Full Time 964 44 815 37
Part Time 337 15 298 14
Not Working 906 41 1094 50
Region
Scotland 188 8 183 8
North East 97 4 210 10
North West 245 11 224 10
Yorks & Humber 188 8 174 8
Ulster 62 3 112 5
East Midlands 159 7 186 8
West Midlands 194 9 147 7
Wales 108 5 105 5
Eastern 228 10 152 7
London 271 12 272 12
South East 277 13 235 11
South West 190 9 207 9