public education network national civic index analysis presented by celinda lake, joshua ulibarri...
TRANSCRIPT
Public Education Network National Civic Index
Analysis
Presented by Celinda Lake, Joshua Ulibarri and Christopher Panetta
June - 2008
1726 M St., NW Suite 500
Washington, DC 20036Phone: 202-776-9066
Fax: 202-776-9074www.lakeresearch.com
1936 University AveSuite 300
Berkeley, CA 94704Phone: 510-286-2097

2
Summary Description of Methods:
Interview dates: May 8 – May 14, 2008
The survey reached 1220 adults nationwide, including a base sample of 1000 adults, an oversample of 100 Latino/as, and an oversample of 100 African-American adults.
The data were weighted slightly by age, education, race, and party identification in order to ensure that it accurately reflects the demographic configuration of these populations.
Margin of error for the base sample is +/- 3.1 percentage points. The MOE is larger when quoting data for subgroups.
This presentation reports from data from 2006. The 2006 data is from the Civic Index poll of 1900 adults with oversamples of 50 African Americans and 50 Latino/as. The report also draws upon data from a 2006 national survey of 1,001 adults conducted for the Give Kids Good Schools campaign.
3
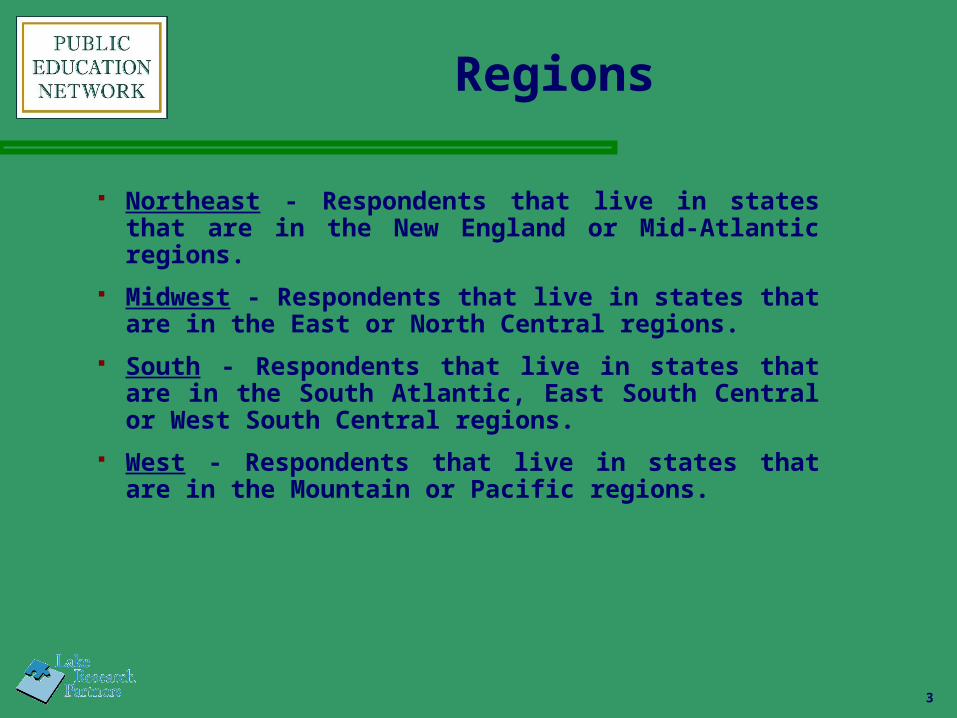
Regions
Northeast - Respondents that live in states that are in the New England or Mid-Atlantic regions.
Midwest - Respondents that live in states that are in the East or North Central regions.
South - Respondents that live in states that are in the South Atlantic, East South Central or West South Central regions.
West - Respondents that live in states that are in the Mountain or Pacific regions.

4
What is the Civic Index?
• The civic index was designed and implemented to measure a community’s perception of itself with regard to its public schools.
• The index is made up of many indicators, and those indicators are collapsed into ten categories used as the general measurements of the index.
• The ten index categories are: tolerance and inclusiveness, performance data, active parents, officeholder leadership, youth involvement, business community, media, school board, higher education, and civic organizations.
• The measurements of the community are then used as a guide to fix inequities or problems in community support for the local school system. The civic index survey would be re-administered every two years or so to measure the progress of the community.
• The Civic Index poll was originally developed in 2006. This is the second time it has been conducted with a national sample. In 2006, the Index was completed nationally and in four locations. This year, the Index has been completed nationally and in Paterson, New Jersey, and San Francisco, California.

5
Key Findings: Public Education
Nationally, this is a difficult and challenging time for public education. Americans focus on pocketbook issues like rising gas prices (22%) and jobs and the economy (19%) as top tier issues. Education is still important, but it is a second tier issue this year (12%) when in 2006 it was a top tier concern(16%). The goal is to continue to link public education to other top tier issues so that the attention paid to it remains high.
Adults also say that they are hearing less about education this year than in years past (16% more, 26% less), and they are not hearing enough about this issue in the campaigns (60% not enough, 4% too much). They want to hear more, but as the Index shows, officeholders and the media could be doing more to communicate on this important issue.
It is not surprising then that Americans are less likely this year than in 2006 to say education is an important issue when deciding their vote. Only 48% say it is either one of the most important or a very important issue when voting for President. A third (35%) say it is somewhat important, but Americans rarely vote on issues that are “somewhat important” to them. Comparatively, in 2006, 56% of Americans said education was one of the most important or a very important vote-issue (asked for Congress).
In the end, most Americans believe there is little accountability in our political system when it comes to public education. Sixty-three percent believe elected officials are not held accountable on this issue while 29% believe they are held accountable.

6
Key Findings: Public Involvement
Americans are also frustrated with public schools. Twenty-six percent say their local schools have improved over the last five years while 32% say they have declined. Similarly, 40% say schools nationally are declining while 15% say they have improved over the last five years. In the 2006 Index test, 26% said schools had improved, and 27% said they had declined locally. Nationally, 26% say schools have improved locally while 32% say they have declined. In 2006, 36% said schools nationally had declined and only 16% said they had improved.
On the other hand, while Americans are frustrated with public schools and do not feel they are hearing enough about these issues in the campaigns, they give their communities decent ratings for involvement with public schools. Sixty-eight percent say their communities take a lot or some responsibility for public schools, and 59% say they personally have done something in the last year to support public schools. Both ratings are very similar to findings in 2006.

7
Key Findings: The National Index
The Index has shown great stability since 2006. The overall rank order is the same with the Tolerance and Inclusiveness category receiving the highest ratings and Officeholders receiving lower ratings.
There is a noticeable but small decrease in the ratings adults offer for most indicators. It is a small decrease, but it is more meaningful when we look at intensity (those who rate a “5”) and because it is fairly consistent across the indicators and the categories.
Interestingly, the Tolerance and Inclusiveness category has actually received a bump in its mean to 3.9, up from 3.6. Conversely, five other categories went down slightly and the rest held steady.

The Perception of Public Education
Education has receded as a top of mind issue in this current context when adults
focus on soaring gas prices and a slumping economy.
9
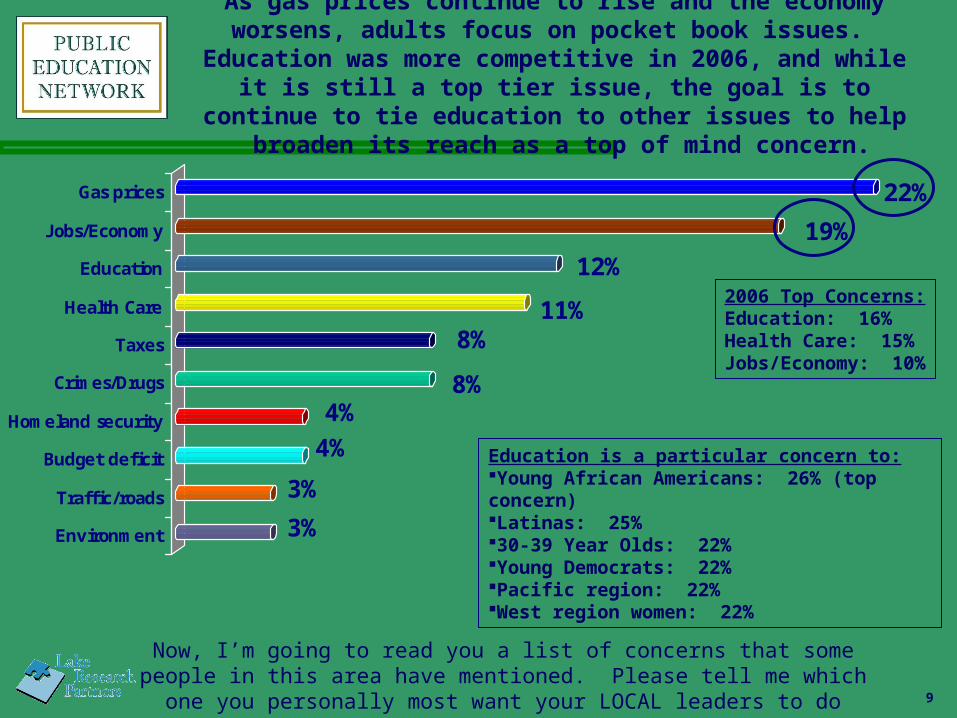
As gas prices continue to rise and the economy worsens, adults focus on pocket book issues.
Education was more competitive in 2006, and while it is still a top tier issue, the goal is to continue to tie education to other issues to help broaden its
reach as a top of mind concern.
3%
3%
4%4%
8%
8%11%
12%19%
22%
Environment
Traffic/roads
Budget deficit
Homeland security
Crimes/Drugs
Taxes
Health Care
Education
Jobs/Economy
Gas prices
2006 Top Concerns:Education: 16%Health Care: 15%Jobs/Economy: 10%
Education is a particular concern to:Young African Americans: 26% (top concern)Latinas: 25%30-39 Year Olds: 22%Young Democrats: 22%Pacific region: 22%West region women: 22%
Now, I’m going to read you a list of concerns that some people in this area have mentioned. Please tell me which one you personally
most want your LOCAL leaders to do something about?

10
Both men and women are most concerned with gas prices and the economy. Women
are slightly more focused on education than men, but even among that audience, it is
currently a second tier issue.
13%
14%
21%
22%
9%
9%
9%
10%
18%
21%
Health Care
Education
J obs/ Econ
Gas prices
Crime/ Drugs
Taxes
Health Care
Education
J obs/ Econ
Gas pricesMen
Women

11
African Americans and Latino/as focus on education to a greater extent than do white adults. For
African Americans and Latinos, education does become a top tier issue concern competitive with
gas prices and the economy.
11%20%
22%
10%
10%10%
16%20%
24%
11%18%
20%23%
Crime/ Drugs
Health Care
J obs/ Economy
Education
Gas prices
J obs/ Econ
Education
J obs/ Econ
Gas prices
Education
Health care
J obs/ Econ
Gas prices
White
African American
Latino

12
In this environment, even parents are focusing on the
issues through an economic lens.
10%
13%
18%
23%
9%
16%
20%
22%
Education
Health care
J obs/ Economy
Gas prices
Health care
Education
Gas prices
J obs/ Economy
Parents of children age 18 and under
Non-Parents
13
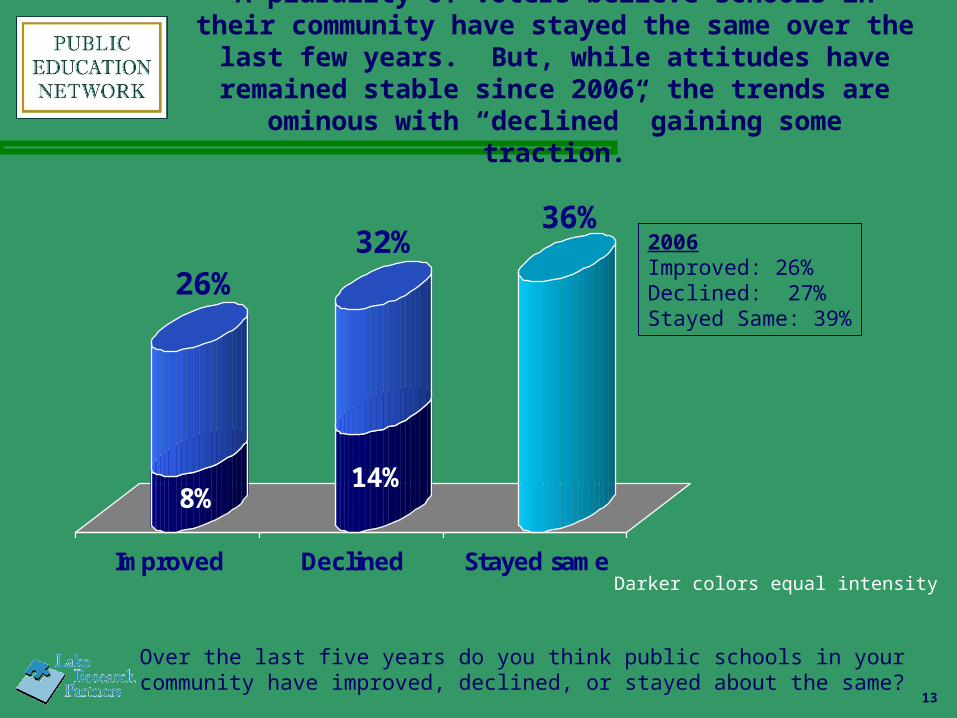
A plurality of voters believe schools in their community have stayed the same over the last few years. But, while attitudes have remained stable since 2006, the trends are ominous with
“declined” gaining some traction.
8%
26%
14%
32%36%
Improved Declined Stayed same
Over the last five years do you think public schools in your community have improved, declined, or stayed about the same?
2006Improved: 26%Declined: 27%Stayed Same: 39%
Darker colors equal intensity

14
Latinos are most optimistic about the schools in their community, while white adults have more critical attitudes, and
African Americans are somewhere in between.
26% 24%
30%
36%
32%35%
28%
20%
36%35%36%38%
Improved Declined Stayed Same
All White African American Latino/a

15
Parents have a more positive view of their public schools than do non-
parents. This may be because they have a closer connection to public
schools.
26%
33%
23%
32%32%32%36%
31%
38%
Improved Declined Stayed Same
All Parents Non-Parents
2006 Among Parents:Improved: 27%Declined: 28%Stayed the Same: 40%

16
Adults in the South are the only geographic group that are net positive about schools in their community – and even then, they
are basically split.
26%22%
26%
32%
19%
32%
37%
30%29%
36% 36%36%36%
30%
41%
Improved Declined Stayed Same
All Northeast Midwest South West

17
As is typical, adults are more negative toward schools nationally than they are toward their local public schools. Similar to their attitudes toward local schools, the ratings for schools
nationally trend negative.
3%
15%
19%
40%38%
Improved Declined Stayed same
Over the last five years do you think public schools nationally have improved, declined, or stayed about the same?
2006Improved: 16%Declined: 36%Stayed Same: 35%
Darker colors equal intensity

18
Latino/as, who are most optimistic about schools locally, believe schools
nationally are declining.
15% 15%16%16%
40%40%36%37% 38%36%
45%41%
Improved Declined Stayed Same
All White African American Latino/a
19
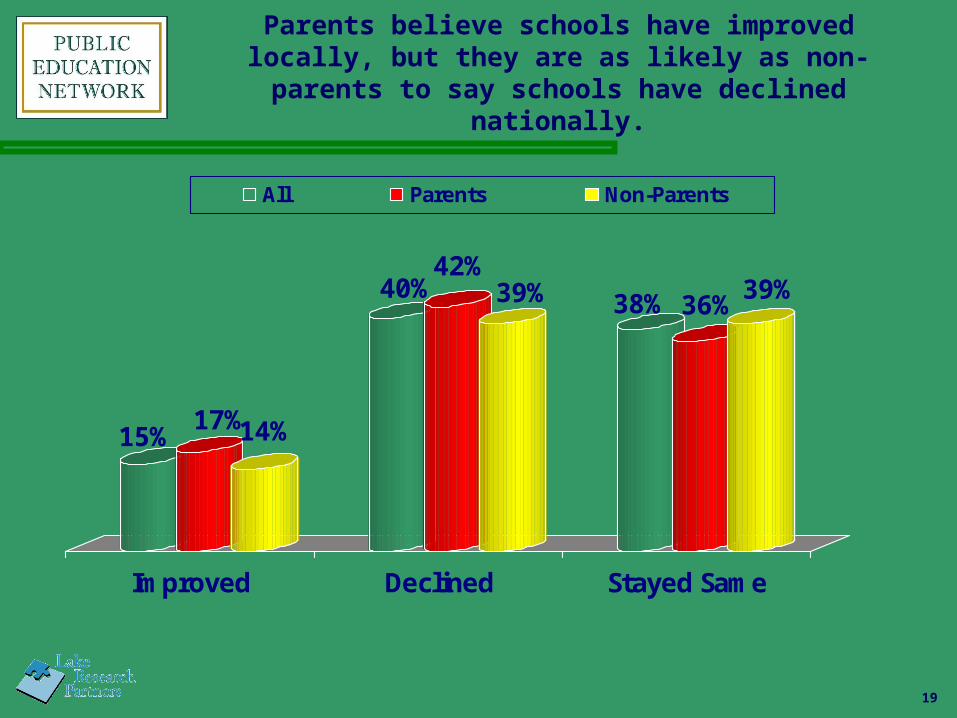
Parents believe schools have improved locally, but they are as likely as non-parents
to say schools have declined nationally.
15%17%14%
40%42%
39% 38% 36%39%
Improved Declined Stayed Same
All Parents Non-Parents
20
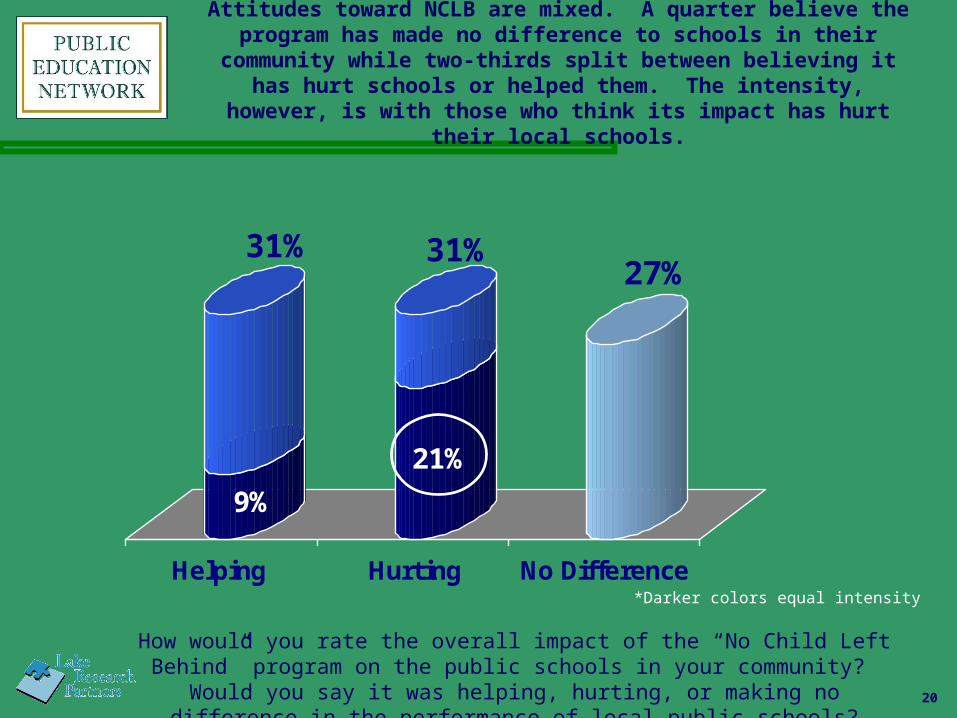
Attitudes toward NCLB are mixed. A quarter believe the program has made no difference to schools in their
community while two-thirds split between believing it has hurt schools or helped them. The intensity, however, is
with those who think its impact has hurt their local schools.
9%
31%
21%
31%27%
Helping Hurting No Difference
How would you rate the overall impact of the “No Child Left Behind” program on the public schools in your community? Would you say it was helping, hurting, or making no difference in the performance of
local public schools?
*Darker colors equal intensity

21
Latinos, who have the most positive outlook on local schools, are tied with
African Americans in their belief that NCLB has helped more than hurt, but white adults believe the program has hurt
schools.
Total White
African American
Latino/a
Helping 31% 27% 41% 39%Hurting 31% 34% 21% 23%No difference
27% 27% 30% 26%

22
Both parents and non-parents are divided on NCLB’s impact
on schools.
31% 32%30% 31%33%
30%27% 25%
28%
Helping Hurting No Diff
All Parents Non-Parents

23
Independents are the most likely to feel NCLB is hurting the performance of public schools. Democrats and
Republicans are split, with Republicans endorsing the program and Democrats more divided.
31% 30%
36%
20%
31%32%
28%
40%
27%28%
25%
30%
Helping Hurting No Diff
All Democrats Republicans Independents
Community Involvement in
Public EducationAmericans give their communities
decent ratings for levels of involvement with public schools.

25
Americans think people in their communities take responsibility for ensuring quality public schools.
Attitudes have held steady since 2006. There is not as much intensity as there could be, but overall, the
attitudes are positive.
29%
68%
5%
28%
Responsibility No Responsibility
How much responsibility do you think people in your community take for ensuring there are quality public schools in your
community – a lot, some, a little, or none at all.
2006:A lot/Some 70%Little/None: 26%
*Darker colors equal intensity
26
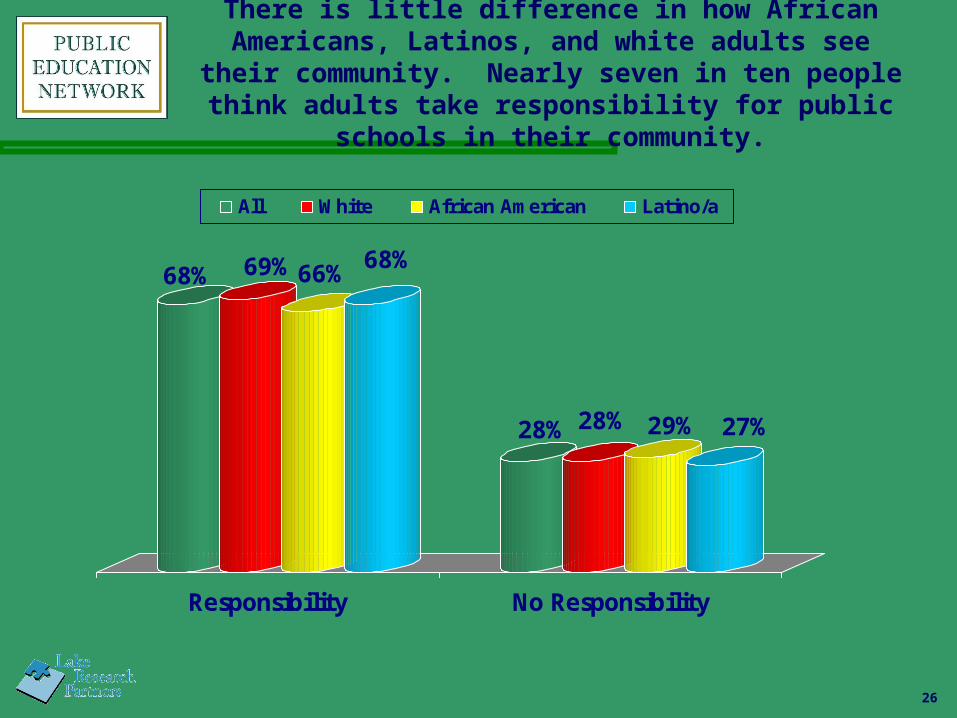
There is little difference in how African Americans, Latinos, and white adults see their community. Nearly seven in ten people think adults take responsibility for public schools in
their community.
68% 69%66%68%
28% 28% 29% 27%
Responsibility No Responsibility
All White African American Latino/a

27
Similarly, respondents say that in the past year they have done something to support public schools in their area. In fact, slightly more
adults say they have done something this year compared to 2006.
59%
40%
Yes No
2006:Yes: 54%No: 40%
In the past year, have YOU personally done anything to support public schools in your local area?

28
African Americans and Latino/as report doing the most personally to support public schools. African Americans and Latinos are
more likely to be parents in this survey, which drives these numbers.
59% 57%63% 61%
40%42%
36% 37%
Yes No
All White African American Latino/a

29
Not surprisingly, three-quarters of parents report doing something to support public education, compared to about half of non-
parents.
59%
73%
51%
40%26%
48%
Yes No
All Parents Non-Parents

30
Adults, however, make careful distinctions. Fifty-nine percent say they have done something to
support public schools in their community, but only half say that means they are personally involved – a
share that is up somewhat since 2006.
17%
50%
27%
50%
Involved Not Involved
Honestly, how involved would you say you are in helping to make public schools better – very involved, somewhat
involved, not too involved, or not involved at all?
2006:Involved: 47%Not Involved: 52%
*Darker colors equal intensity
31
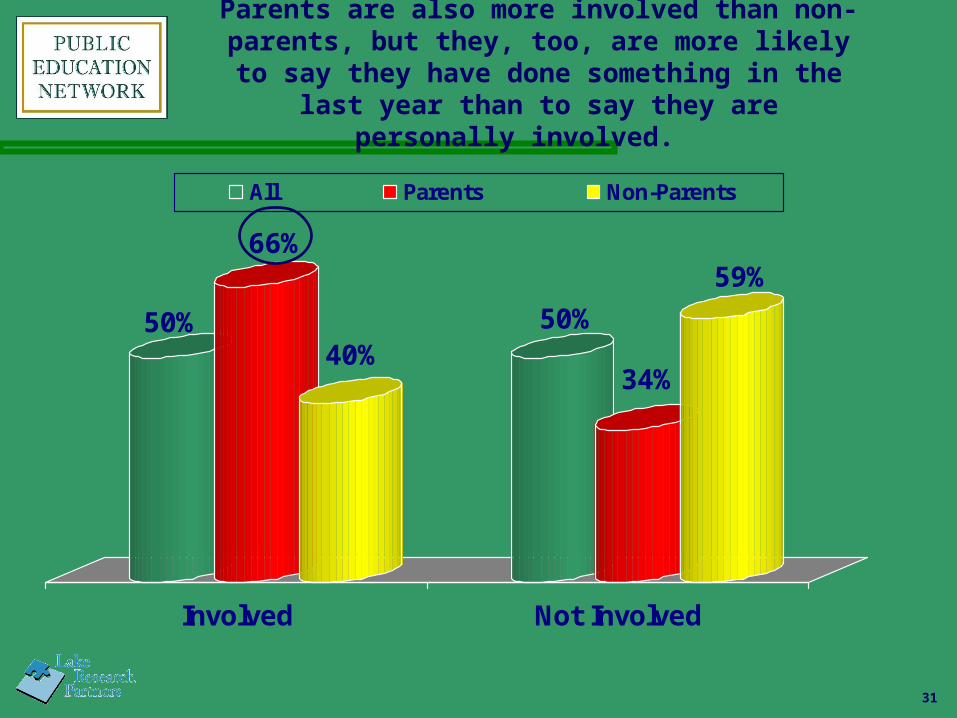
Parents are also more involved than non-parents, but they, too, are more likely to say they have done something in the last
year than to say they are personally involved.
50%
66%
40%50%
34%
59%
Involved Not Involved
All Parents Non-Parents

32
African Americans say they are the most personally involved in helping to make public
schools better. Whites report the lowest levels of involvement.
50% 47%
57% 54%50%
53%
40%45%
Involved Not Involved
All White African American Latino/a

33
Americans believe local businesses are involved in public schools, but ratings for businesses, local colleges,
churches, and civic organizations are down somewhat from the first Index test. This could be a reflection of the
general environment where education is less of a priority, but it does warrant monitoring the relationship.
35%
20%
25%
18%
19%
28%
21%
14%
47%
51%
54%
68%
Civic organizations
Churches and
Religious orgs
Local
colleges/universities
Local businesses
Don't know No Yes
Please tell me if the following are involved in your local public schools?
71% Yes in 2006
57% Yes in 2006
56% Yes in 2006
51% Yes in 2006
34
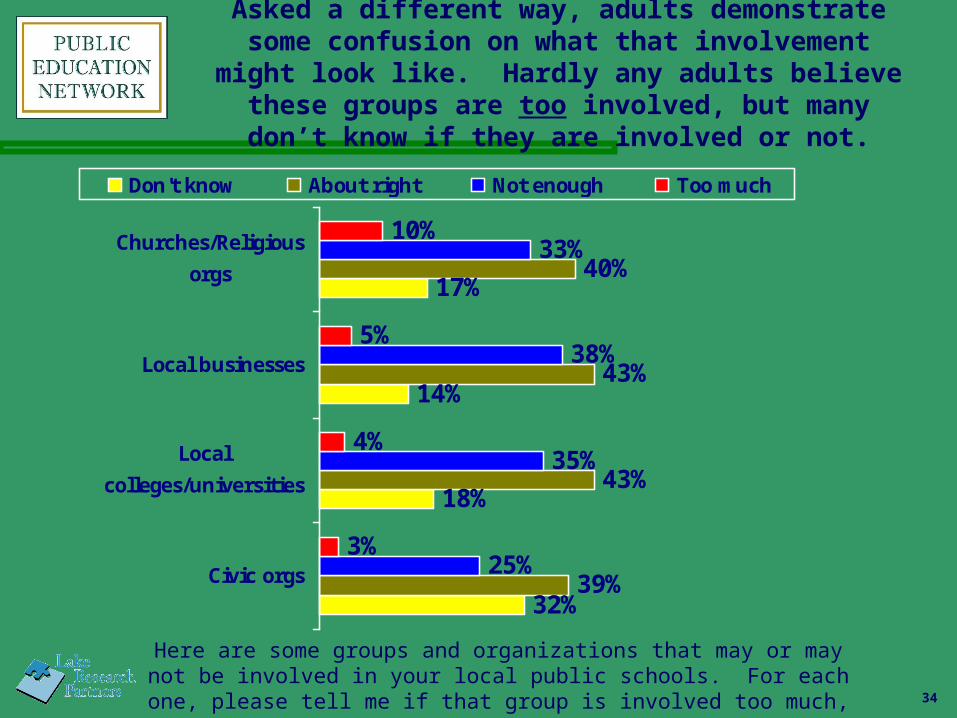
Asked a different way, adults demonstrate some confusion on what that involvement might look like. Hardly any adults believe
these groups are too involved, but many don’t know if they are involved or not.
32%
18%
14%
17%
39%
43%
43%
40%
25%
35%
38%
33%
3%
4%
5%
10%
Civic orgs
Local
colleges/universities
Local businesses
Churches/Religious
orgs
Don't know About right Not enough Too much
Here are some groups and organizations that may or may not be involved in your local public schools. For each one, please tell me if
that group is involved too much, not enough, or about right?

Information about Candidates and Public
Officials
Americans have not heard enough about public education in this year’s campaigns.
They think they have heard less than in years past.
36
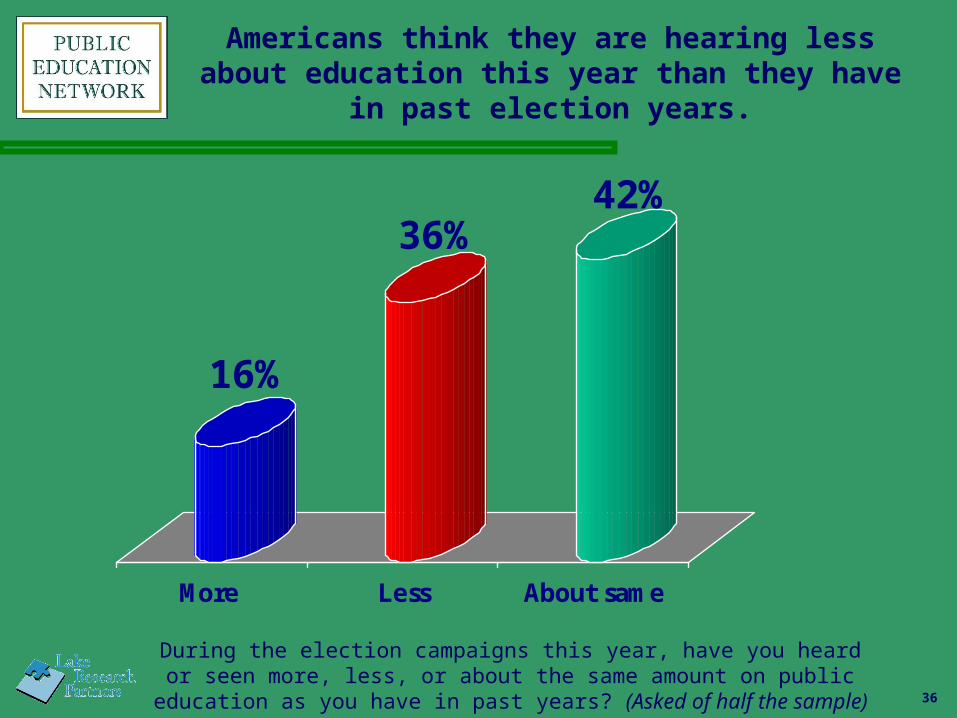
Americans think they are hearing less about education this year than they have
in past election years.
16%
36%42%
More Less About same
During the election campaigns this year, have you heard or seen more, less, or about the same amount on public education as you
have in past years? (Asked of half the sample)

37
Democrats are more likely than Republicans or independents to say they have been hearing more from
candidates about education this year than years past, buts still, only two in ten Democrats say they have heard more
while seven in ten have heard less or about the same.
16%
22%
12%
5%
36%
27%
37%39% 42%
46%
38%
46%
More Less About the same
All Democrats Republicans Independents

38
Similar to hearing less from candidates than in previous years, adults say they have not heard enough about public education this year and
they want to hear more.
4%
60%
28%
Too much Not Enough About right amount
During the election campaigns this year, do you think the candidates are focusing too much, not enough, or about the right amount of attention on public education? (Asked of half
the sample)

39
Reflecting their overall focus on pocketbook issues, only half of Americans say that public education is an issue that is important to them as they cast their ballots for President. A third say it is
“somewhat” important, but Americans do not often act on priorities that are only “somewhat” important to them.
6%
9%
35%
38%
10%
Not important at all
Not too important
Somewhat important
Very Important
One of the most important 47% Important
50% Not Important
Thinking about the Presidential election. Of all the issues that come up in the election, how important are the candidates’ positions on
education in helping you decide which candidate to vote for?
September 2006*:Important: 56%Not Important: 41%
Among adults who say education is top issue:Important: 62%Not Important: 36%
*PEN’s Give Kids Good Schools National Survey

40
Education is an important issue to parents, while non-parents are less likely to use it in their vote
criterion.
7%10%
36%35%
9%
5%7%
34%42%
10%
Not at all
Not too
Somewhat
Very
One of the most
Not at all
Not too
Somewhat
Very
One of the most 52% Important
44% Important
45% Not Important
53% Not Important
Parents
Non-Parents

41
Americans believe there is a lack of accountability in the political system when it
comes to public education. By two-to-one they believe elected officials are NOT held
accountable.
29%
63%
Held accountable Not held accountable
Do you think most elected officials are held accountable for their actions on public education or they not held accountable?
2006:Held accountable: 21%Not held accountable: 72%
*PEN’s Give Kids Good Schools National Survey

42
Voters have many sources of information when it comes to learning about a candidate’s stance on public education. Print media and
television dominate, but they are down from 2006. The Internet has risen in that time as a main source of news. However, the most
interesting finding is the decline in most other categories, which is a reflection of the overall lowered volume around public education this
year.
20%
35%
25%
29%
26%
37%
30%
48%
67%
12%
13%
19%
46%
50%
Community organizations
Candidates themselves
Radio
Family/Friends
Internet
TV media
Print media
2006 2008
From which of the following sources are you able to learn information about a candidate’s stance on public education?
[Multiple responses]

43
African Americans and Latino/as turn to TV for information about
candidates. Whites use print media more than television news.
Total White African Americ
an
Latino/a
Print Media 50% 52% 43% 42%
TV Media 46% 42% 61% 50%
Internet 35% 35% 28% 41%
Family/Friends
20% 20% 21% 21%
Radio 19% 19% 20% 19%
Candidates Themselves
13% 13% 16% 14%
Community Org
12% 11% 14% 12%In 2006, 35% of Latinos turned to the Internet

44
Americans have mixed reactions when it comes to the type of education stories that
appear in news reports. Four in ten think the stories are mostly bad, but a third thinks they
are mostly good.
32%41%
22%
Mostly good Mostly bad Both equally
When you think about news reports regarding your local public schools – both on television and in print - do you think the
information mostly reports on the good things happening in your public schools or mostly reports on the bad things happening in
your local public schools?
45
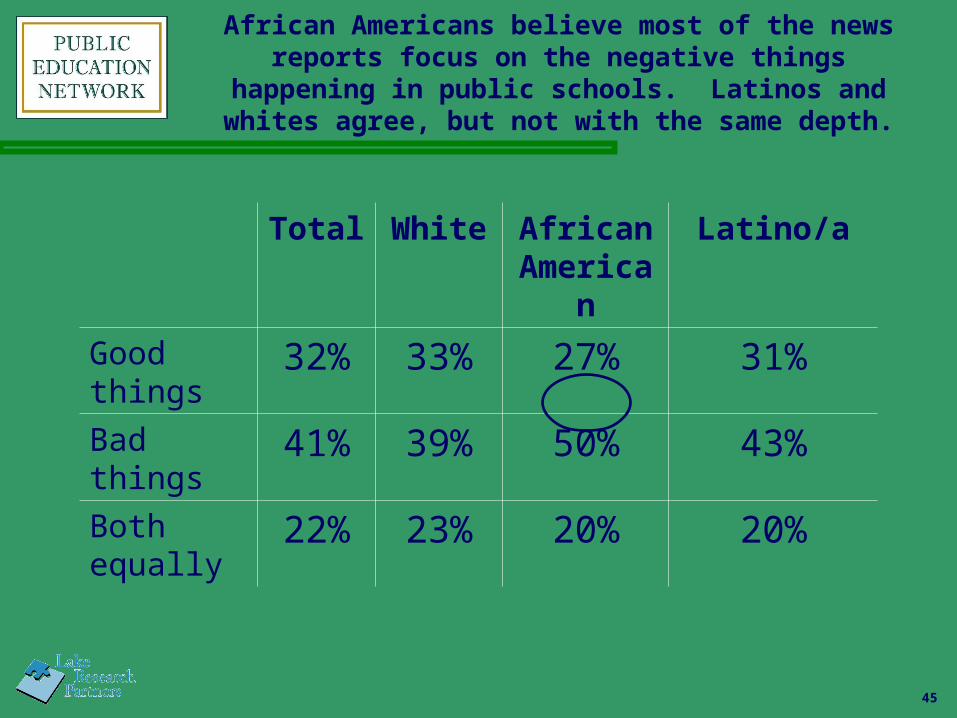
African Americans believe most of the news reports focus on the negative things happening in public schools. Latinos and whites agree, but
not with the same depth.
Total White African America
n
Latino/a
Good things
32% 33% 27% 31%
Bad things
41% 39% 50% 43%
Both equally
22% 23% 20% 20%
46
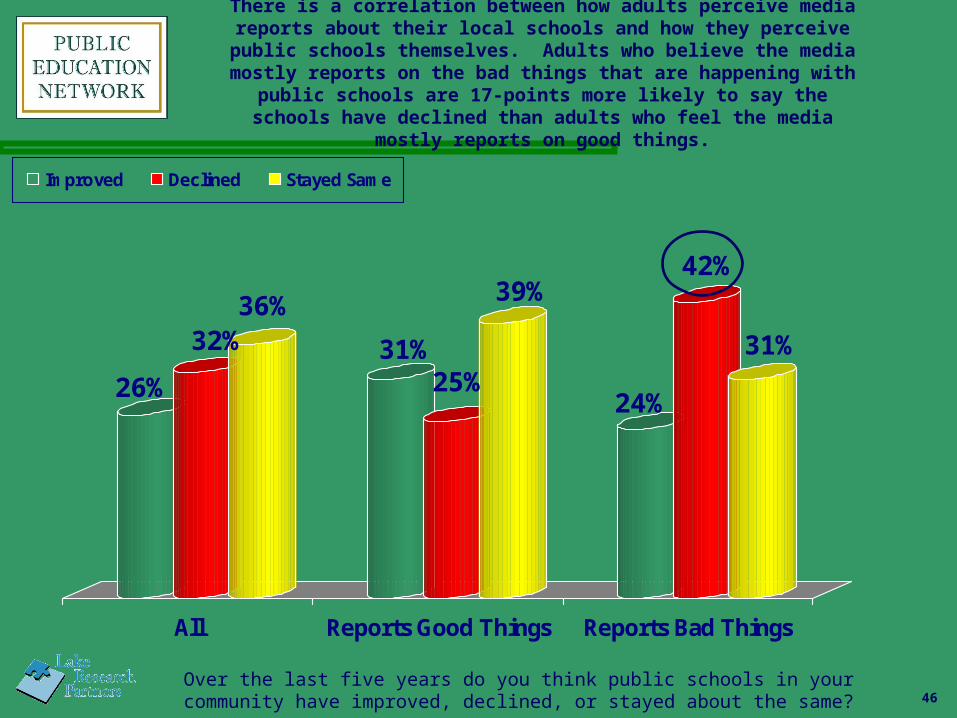
There is a correlation between how adults perceive media reports about their local schools and how they perceive
public schools themselves. Adults who believe the media mostly reports on the bad things that are happening with public schools are 17-points more likely to say the schools
have declined than adults who feel the media mostly reports on good things.
26%
32%36%
31%25%
39%
24%
42%
31%
All Reports Good Things Reports Bad Things
Improved Declined Stayed Same
Over the last five years do you think public schools in your community have improved, declined, or stayed about the same?
47
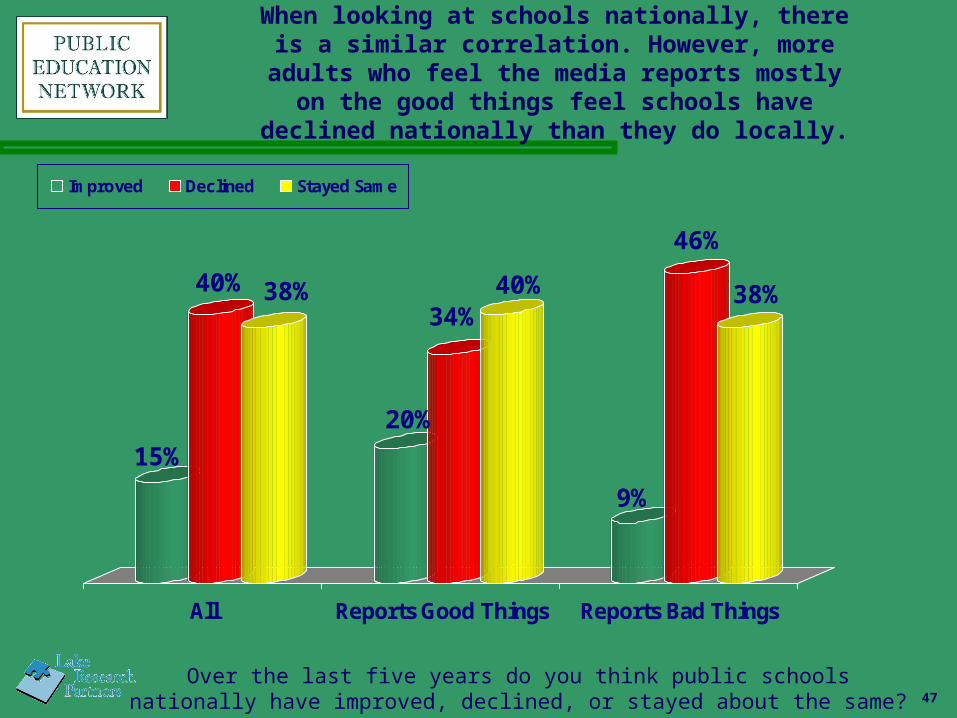
When looking at schools nationally, there is a similar correlation. However, more adults who feel the media reports mostly on the
good things feel schools have declined nationally than they do locally.
Over the last five years do you think public schools nationally have improved, declined, or stayed about the same?
15%
40% 38%
20%
34%40%
9%
46%
38%
All Reports Good Things Reports Bad Things
Improved Declined Stayed Same

The Index
The Index is remarkably stable compared to two years ago. The rank order of the categories is the same, and the means
are relatively stable. There has been a slight decline in ratings across the board, but this is probably reflective of the overall
lower emphasis on education this year than in years past.

49
Tolerance and Inclusiveness is the strongest Index category, just as it was in 2006. The rank order of each category is similar to 2006. Most categories have seen a
slight drop in overall ratings, but the Tolerance and Inclusiveness category has actually improved.
2.8
3.03.0
3.1
3.1
3.2
3.43.9
3.3
3.2
Tol/Inclus
Active Parents
Performance Data
School Board
Youth Involvement
Higher Education
Media
Business Community
Officeholder Leadership
Civic Organizations
For each one, I want you to think about your local community and how well it achieves these goals. I would like you to use a scale from ZERO
to FIVE where ZERO means your community does not achieve that goal at all and FIVE means your community achieves that goal
completely.
Means of combined index questions
Ranked by Mean Rating
2006:
3.6
3.4
3.5
3.2
3.2
3.1
3.2
3.2
2.9
3.2

50
In the combined Index ratings, there are few differences by race or ethnicity. African Americans
offer slightly higher ratings for parents in their communities, while Latinos are slightly more positive
toward elected leaders. Whites tend to follow the overall trends.
Total White African American
Latino/a
Tolerance and Inclusiveness 3.9 4.0 3.7 3.9Active Parents 3.4 3.3 3.5 3.3Performance Data 3.3 3.3 3.4 3.4School Board 3.2 3.3 3.3 3.1Youth Involvement 3.2 3.2 3.2 3.3Higher Education 3.1 3.0 3.1 3.3Media 3.1 3.0 3.2 3.1Business Community 3.0 3.0 2.8 3.0Officeholder Leadership 3.0 2.9 3.0 3.2Civic Organizations 2.8 2.8 2.9 2.9
51
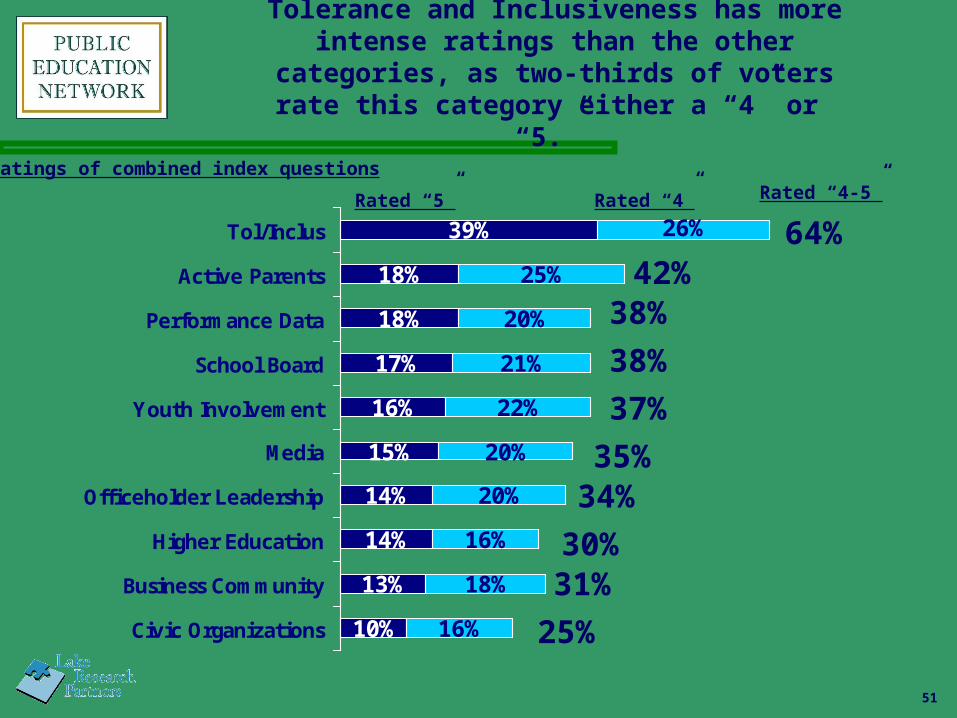
Tolerance and Inclusiveness has more intense ratings than the other
categories, as two-thirds of voters rate this category either a “4” or “5.”
39%
18%
18%
17%
16%
15%
14%
14%
13%
10%
25%
20%
21%
22%
20%
20%
16%
18%
16%
26%Tol/Inclus
Active Parents
Performance Data
School Board
Youth Involvement
Media
Officeholder Leadership
Higher Education
Business Community
Civic Organizations
64%42%
38%
38%
37%
35%34%
31%
25%
Ratings of combined index questions
Rated “5” Rated “4” Rated “4-5”
30%
52
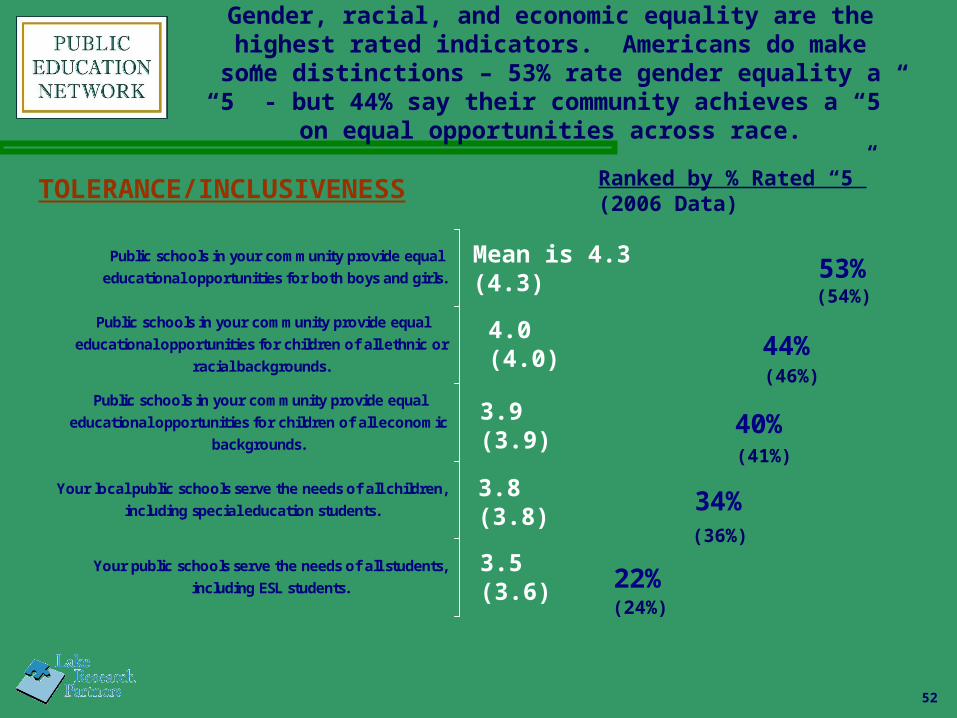
Gender, racial, and economic equality are the highest rated indicators. Americans do make some distinctions – 53% rate gender equality a “5” - but 44% say their community achieves a “5” on equal
opportunities across race.
53%
44%
40%
34%
22%
Public schools in your community provide equal
educational opportunities for both boys and girls.
Public schools in your community provide equal
educational opportunities for children of all ethnic or
racial backgrounds.
Public schools in your community provide equal
educational opportunities for children of all economic
backgrounds.
Your local public schools serve the needs of all children,
including special education students.
Your public schools serve the needs of all students,
including ESL students.
Mean is 4.3(4.3)
4.0(4.0)
3.9(3.9)
3.8(3.8)
3.5(3.6)
TOLERANCE/INCLUSIVENESS Ranked by % Rated “5”(2006 Data)
(54%)
(46%)
(41%)
(36%)
(24%)
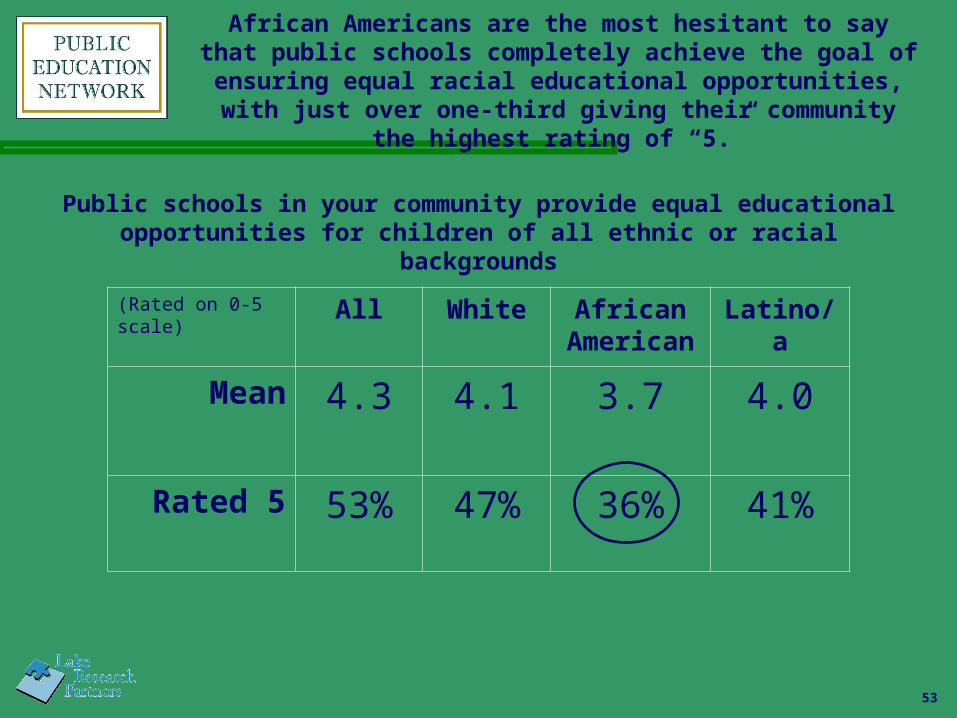
53
Public schools in your community provide equal educational opportunities for children of all ethnic or racial backgrounds
(Rated on 0-5 scale)
All White African America
n
Latino/a
Mean 4.3 4.1 3.7 4.0
Rated 5 53% 47% 36% 41%
African Americans are the most hesitant to say that public schools completely achieve the goal of
ensuring equal racial educational opportunities, with just over one-third giving their community the
highest rating of “5.”

54
Women and men hold very similar attitudes when it comes to gender
equity in public schools in their communities.
Public schools in your community provide equal educational opportunities for both boys and girls
All Men Women
Mean 4.3 4.3 4.3
Rated 5 53% 53% 53%

55
Across racial and ethnic groups, whites and Latino/as give the highest marks for providing equal opportunities for children of all economic backgrounds, while African Americans give the
lowest ratings.
Public schools in your community provide equal educational opportunities for children of all
economic backgrounds.
All White African America
n
Latino/a
Mean 3.9 4.0 3.5 3.9
Rated 5 40% 42% 30% 40%
56
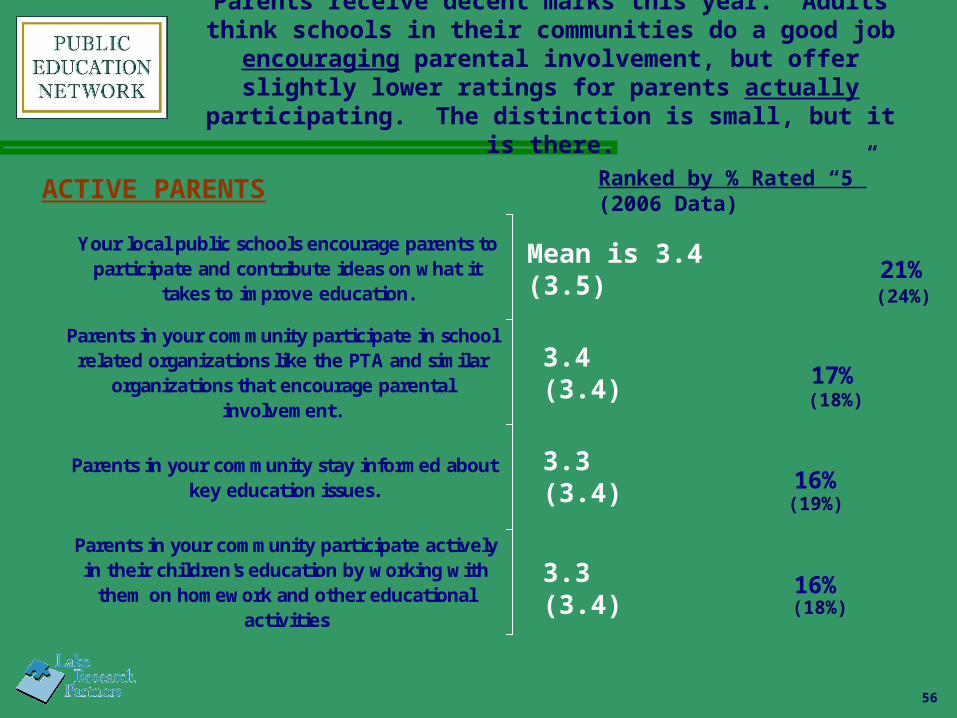
Parents receive decent marks this year. Adults think schools in their communities do a good job
encouraging parental involvement, but offer slightly lower ratings for parents actually
participating. The distinction is small, but it is there.
21%
16%
16%
17%
Your local public schools encourage parents toparticipate and contribute ideas on what it
takes to improve education.
Parents in your community participate in schoolrelated organizations like the PTA and similar
organizations that encourage parentalinvolvement.
Parents in your community stay informed aboutkey education issues.
Parents in your community participate activelyin their children's education by working with
them on homework and other educationalactivities
ACTIVE PARENTS
Mean is 3.4(3.5)
Ranked by % Rated “5”(2006 Data)
3.4(3.4)
3.3(3.4)
3.3(3.4)
(24%)
(18%)
(19%)
(18%)
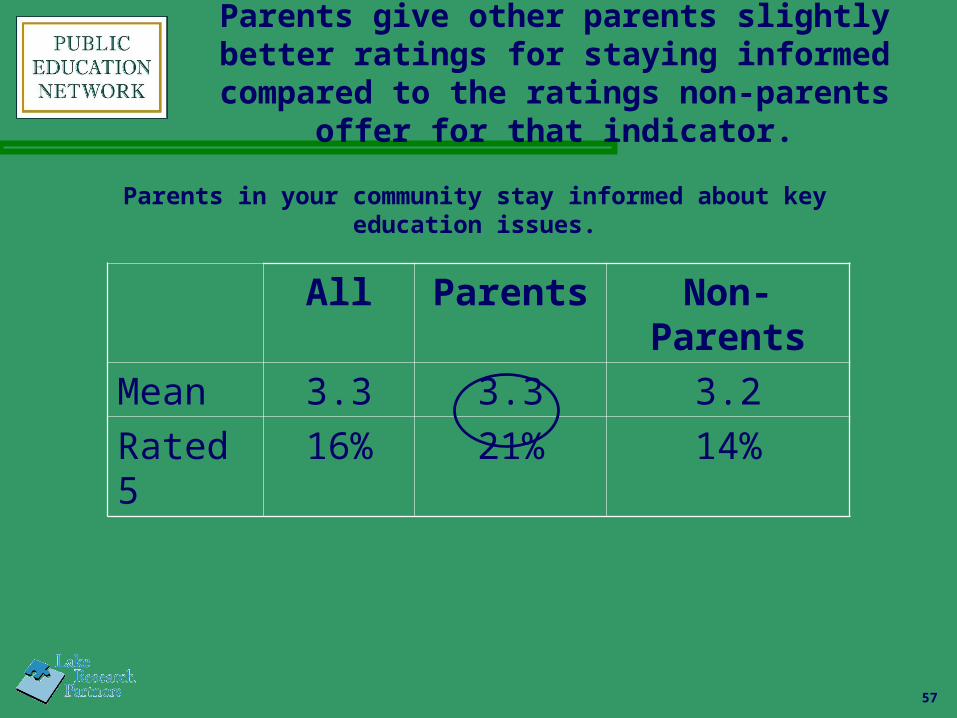
57
Parents give other parents slightly better ratings for staying informed
compared to the ratings non-parents offer for that indicator.
Parents in your community stay informed about key education issues.
All Parents Non-Parents
Mean 3.3 3.3 3.2
Rated 5
16% 21% 14%
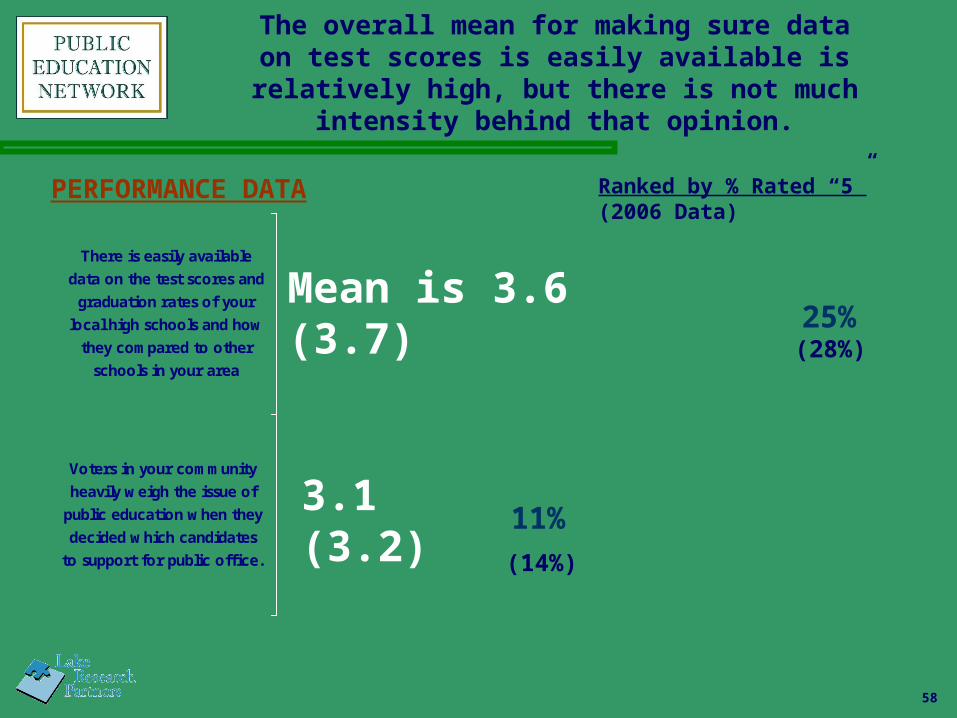
58
The overall mean for making sure data on test scores is easily available is
relatively high, but there is not much intensity behind that opinion.
25%
11%
There is easily available
data on the test scores and
graduation rates of your
local high schools and how
they compared to other
schools in your area
Voters in your community
heavily weigh the issue of
public education when they
decided which candidates
to support for public office.
PERFORMANCE DATA
Mean is 3.6(3.7)
3.1(3.2)
Ranked by % Rated “5”(2006 Data)
(28%)
(14%)

59
The public gives voters in their community better marks for voting in the school board elections
than paying attention to what the school board is doing – but that could have spiked because of this
year’s high-turnout Presidential primaries.
22%
11%
Members in your community not only votein Presidential elections, but also vote in
local school board elections
Voters in your community pay attention towhat the school board is doing, by attending
school board meetings, watching schoolboard meetings on TV, or reading about the
school board in the newspaper or otherprint media
SCHOOL BOARD
Mean is 3.5(3.3)
3.0(3.1)
(16%)
(13%)
Ranked by % Rated “5”(2006 Data)
60
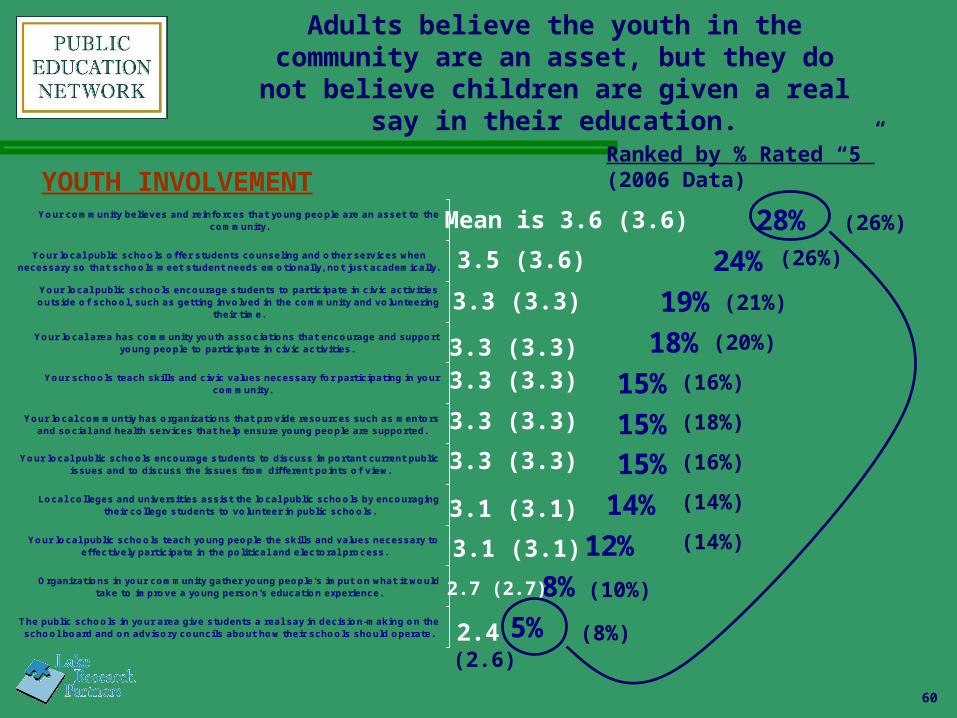
Adults believe the youth in the community are an asset, but they do
not believe children are given a real say in their education.
28%24%
19%18%
15%15%15%
14%12%
8%5%
Your community believes and reinforces that young people are an asset to thecommunity.
Your local public schools offer students counseling and other services whennecessary so that schools meet student needs emotionally, not just academically.
Your local public schools encourage students to participate in civic activitiesoutside of school, such as getting involved in the community and volunteering
their time.
Your local area has community youth associations that encourage and supportyoung people to participate in civic activities.
Your schools teach skills and civic values necessary for participating in yourcommunity.
Your local communtiy has organizations that provide resources such as mentorsand social and health services that help ensure young people are supported.
Your local public schools encourage students to discuss important current publicissues and to discuss the issues from different points of view.
Local colleges and universities assist the local public schools by encouragingtheir college students to volunteer in public schools.
Your local public schools teach young people the skills and values necessary toeffectively participate in the political and electoral process.
Organizations in your community gather young people's imput on what it wouldtake to improve a young person's education experience.
The public schools in your area give students a real say in decision-making on theschool board and on advisory councils about how their schools should operate.
YOUTH INVOLVEMENTMean is 3.6 (3.6)
3.5 (3.6)
3.3 (3.3)
3.3 (3.3)
3.3 (3.3)
3.1 (3.1)
3.1 (3.1)
2.7 (2.7)
2.4
3.3 (3.3)
Ranked by % Rated “5”(2006 Data)
(26%)
(26%)
(21%)
(16%)
(18%)
(16%)
(14%)
(14%)
(10%)
(8%)(2.6)
3.3 (3.3) (20%)

61
The media fares decently in this year’s National Index, but it is not an overwhelming endorsement. Remember, these adults think they hear less than
they want to hear on candidates’ education positions and they weigh that in the ratings they give to the
media and officeholders.
20%
9%
15%
Your local news media, including TV and printmedia, reports on the educational platforms ofcandidates when they run for state and local
office*
Your local news reporting, including TV andprint media, helps the public understand thepublic education issues by regularly reporting
in-depth on public school issues.
Your local news media, including TV and printmedia, reports on the voting record of electedofficials when it comes to public education andthe extent of which elected officials keep their
campaign promises in regards to publiceducation*
MEDIA
*Asked of half the sample
Mean is 3.3(3.4)
3.1(3.2)
2.7(3.0)
Ranked by % Rated “5”(2006 Data)
(22%)
(18%)
(15%)
62
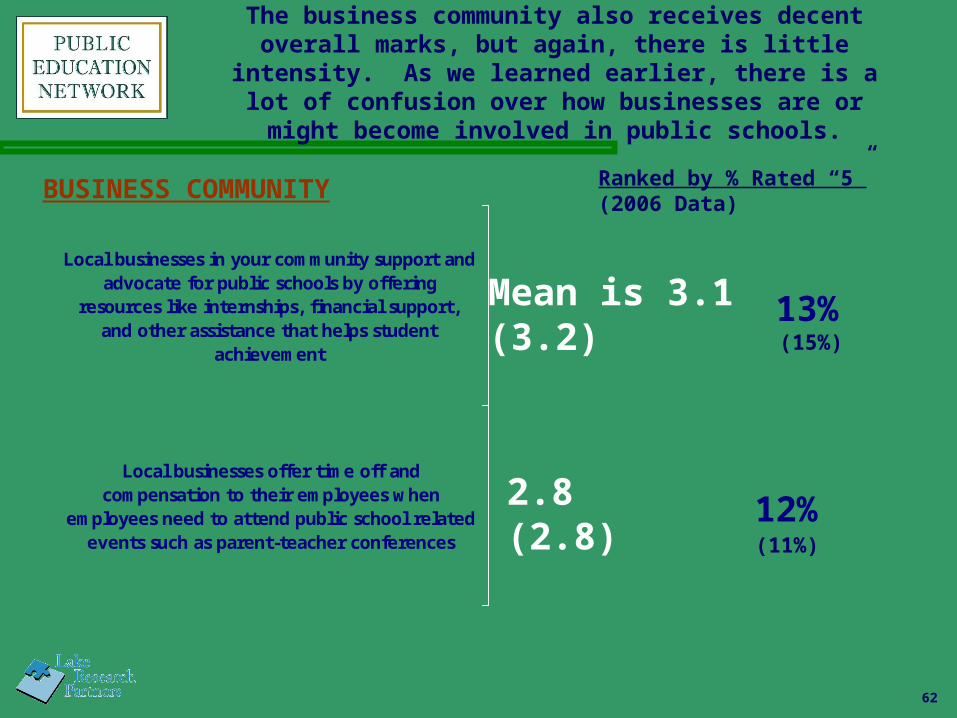
The business community also receives decent overall marks, but again, there is little intensity. As we learned earlier, there is a lot of confusion
over how businesses are or might become involved in public schools.
13%
12%
Local businesses in your community support andadvocate for public schools by offering
resources like internships, financial support,and other assistance that helps student
achievement
Local businesses offer time off andcompensation to their employees when
employees need to attend public school relatedevents such as parent-teacher conferences
BUSINESS COMMUNITY
Mean is 3.1(3.2)
2.8(2.8)
(15%)
Ranked by % Rated “5”(2006 Data)
(11%)
63
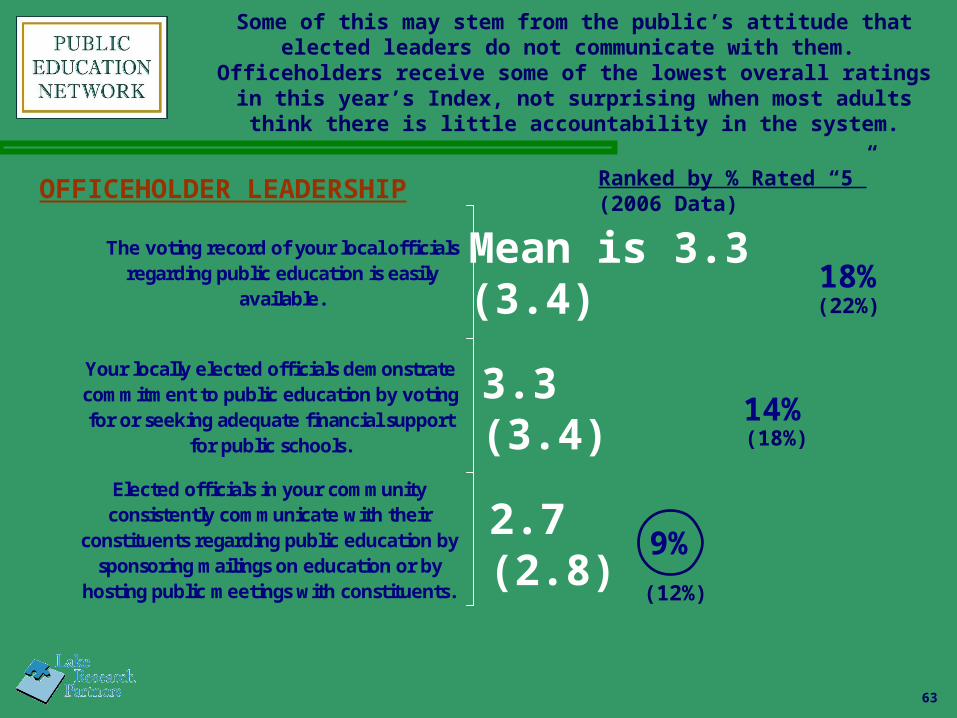
Some of this may stem from the public’s attitude that elected leaders do not communicate with them.
Officeholders receive some of the lowest overall ratings in this year’s Index, not surprising when most adults think
there is little accountability in the system.
18%
14%
9%
The voting record of your local officialsregarding public education is easily
available.
Your locally elected officials demonstratecommitment to public education by votingfor or seeking adequate financial support
for public schools.
Elected officials in your communityconsistently communicate with their
constituents regarding public education bysponsoring mailings on education or by
hosting public meetings with constituents.
OFFICEHOLDER LEADERSHIP
Mean is 3.3(3.4)
3.3(3.4)
2.7(2.8)
Ranked by % Rated “5”(2006 Data)
(22%)
(18%)
(12%)

64
Civic organizations also receive lower ratings, perhaps because there is lingering confusion on what constitutes a civic organization. The
language may need tweaking in future research.
10%
9%
Organizations in your community makeattempts to gather information about the
area’s public schools and share thatinformation with parents in the
community.
Local organizations work to improve low-performing schools.
CIVIC ORGANIZATIONS
Mean is 2.9(3.0)
2.8(2.9)
Ranked by % Rated “5”
(11%)
(11%)
1726 M St., NW Suite 500
Washington, DC 20036Phone: 202-776-9066
Fax: 202-776-9074www.lakeresearch.com
1936 University AveSuite 300
Berkeley, CA 94704Phone: 510-286-2097