public research universities: changes in state funding · pdf filethe lincoln project:...
TRANSCRIPT
Public Research Universities: Changes in State Funding
A Publication of The Lincoln Project: Excellence and Access in Public Higher Education

© 2015 by the American Academy of Arts & Sciences
All rights reserved.
isbn: 0-87724-106-6
This publication is available online at https://www.amacad.org/LincolnProject.
The views expressed in this publication are those held by the contributors and are not necessarily those of the Officers and Members of the American Academy of Arts & Sciences.
Please direct inquiries to: American Academy of Arts & Sciences 136 Irving Street Cambridge, ma 02138-1996 Telephone: 617-576-5000 Fax: 617-576-5050 Email: [email protected] Web: www.amacad.org
Cover: The lights on the map represent the locations of Carnegie-classified Very High Research Activity and High Research Activity public universities in the United States as of September 2015.

The Lincoln Project: Excellence and Access in Public Higher Education
Public Research Universities: Changes in State Funding
IntroductionPublic research universities serve a distinct and indispensable role in America’s educational landscape, producing research and scholarship that drive innovation and graduating thousands of educated citizens, leaders, and professionals in each state annually. While other institutions may also address this mission, public research universities hold a unique social contract to meet these challenges together as effectively, efficiently, and affordably as possible. But today, public research universities are confronted with unprecedented reductions in state investment.

Higher education is the third-largest priority in state gen-eral fund budgets (the portion financed primarily by taxes), after elementary and secondary education and Medicaid.1 In 2014, higher education accounted for approximately 9.4 percent of state general funding: about half as much as gen-eral fund spending on Medicaid, and one-fourth of state k–12 education spending.2
Measured in inflation-adjusted dollars per full-time equiv-alent (fte) student, states have been cutting this support for well over a decade, and spending cuts accelerated in response to the Great Recession. Between 2008 and 2013, states cut appropriation support per fte student in the median public research university by more than 26 percent (overall, support per fte student at the median public institution was cut by more than 20 percent).
The decline in support in part reflects difficult choices states have made in response to manda-tory spending programs like Medicaid, rising pension contributions, and a desire to preserve k–12 education.3
Today, public research universities still rely on state appropriations for approximately 51 percent of their educational revenue, although the percentage fluctuates widely by institution—ucla, for example, receives only 7 percent of its funding from the state. For most public institutions, further cuts could be devastating.
In this climate, the American Academy of Arts & Sciences created the Lincoln Project: Excel-lence and Access in Public Higher Education to study the importance of public research uni-versities, analyze economic trends affecting their operations, and recommend new strategies to sustain these critical institutions. In its first publication, Public Research Universities: Why They Matter, the Lincoln Project demonstrated the many ways in which public research universities are a vital public good.4 This publication examines state financing of higher education, describes the challenges that state governments face, and assesses the prospects for greater state support in the future.
Between 2008 and 2013, states cut appropriation support by more than
20 percent
per full-time equivalent student in the median public institution, and cut support to the median public research university by more than
26 percent.
2 The Lincoln Project: Excellence and Access in Public Higher Education

Section 1: An Overview of State Funding for Higher Education
Higher Education is the third-largest spending area in the typical state budget. In this figure, "All Other" is defined as expenditures from revenue sources that are restricted by law for particular governmental functions or activities. Source: National Association of State Budget Officers, State Expenditure Report: Examining Fiscal 2012–2014 State Spending (Washington, D.C.: National Association of State Budget Officers, 2015). See also State Higher Education Executive Officers (SHEEO) Association, SHEF: FY 2014—State Higher Education Finance (Boulder, Colo.: State Higher Education Executive Officers Association, 2015); State Higher Education Executive Officers Association and Illinois State University Center for the Study of Education Policy, “Grapevine Compilation of State Fiscal Support for Higher Ed-ucation, Fiscal Year 2014–2015,” http://education.illinoisstate.edu/grapevine/; National Center for Education Statistics, IPEDS [Integrated Postsecondary Education Data System] (U.S. Department of Education, Institute of Education Scienc-es), https://nces.ed.gov/ipeds/; and David A. Tandberg and Casey Griffith, “State Support of Higher Education: Data, Measures, Findings, and Directions for Future Research,” in Higher Education: Handbook of Theory and Research, vol. 28, ed. Michael B. Paulsen (Dordrecht: Springer Netherlands, 2013), 613–685, http://link.springer.com/10.1007/978-94 -007-5836-0_13.
$0
$50
$100
$150
$200
$250
$300
Elementary & Secondary
Education
Medicaid
Bill
ions
of D
olla
rs
HigherEducation
Corrections Public Assistance
Transportation All Other
Figure 1: State General Fund Expenditures in 2014 (Estimated), by Category
Public Research Universities: Changes in State Funding 3
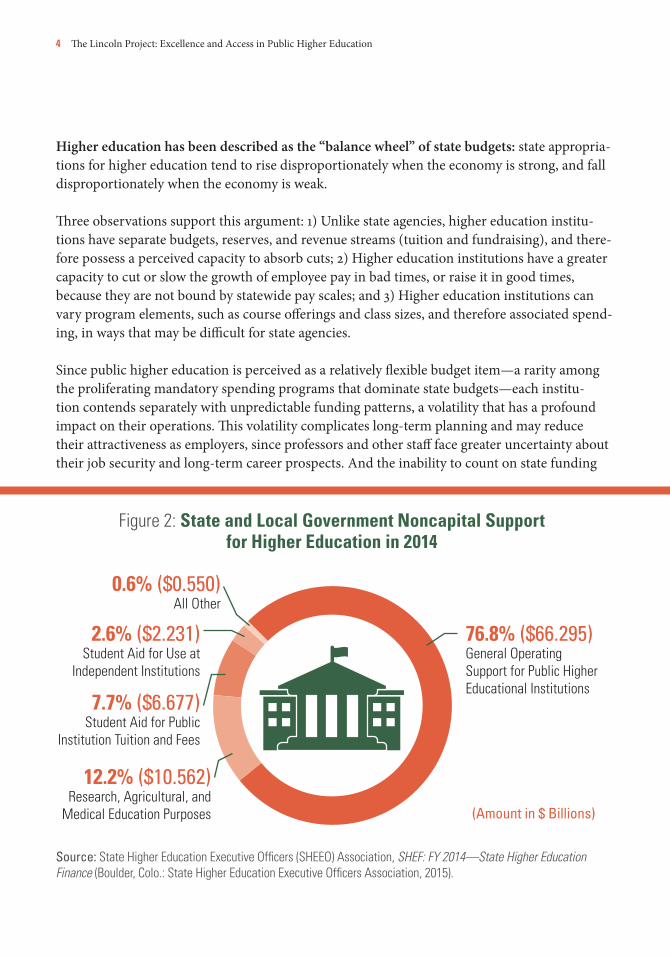
Higher education has been described as the “balance wheel” of state budgets: state appropria-tions for higher education tend to rise disproportionately when the economy is strong, and fall disproportionately when the economy is weak.
Three observations support this argument: 1) Unlike state agencies, higher education institu-tions have separate budgets, reserves, and revenue streams (tuition and fundraising), and there-fore possess a perceived capacity to absorb cuts; 2) Higher education institutions have a greater capacity to cut or slow the growth of employee pay in bad times, or raise it in good times, because they are not bound by statewide pay scales; and 3) Higher education institutions can vary program elements, such as course offerings and class sizes, and therefore associated spend-ing, in ways that may be difficult for state agencies.
Since public higher education is perceived as a relatively flexible budget item—a rarity among the proliferating mandatory spending programs that dominate state budgets—each institu-tion contends separately with unpredictable funding patterns, a volatility that has a profound impact on their operations. This volatility complicates long-term planning and may reduce their attractiveness as employers, since professors and other staff face greater uncertainty about their job security and long-term career prospects. And the inability to count on state funding
Source: State Higher Education Executive Officers (SHEEO) Association, SHEF: FY 2014—State Higher Education Finance (Boulder, Colo.: State Higher Education Executive Officers Association, 2015).
(Amount in $ Billions)
76.8% ($66.295)General OperatingSupport for Public Higher Educational Institutions
0.6% ($0.550)All Other
12.2% ($10.562)Research, Agricultural, and
Medical Education Purposes
7.7% ($6.677)Student Aid for Public
Institution Tuition and Fees
2.6% ($2.231)Student Aid for Use at
Independent Institutions
Figure 2: State and Local Government Noncapital Supportfor Higher Education in 2014
4 The Lincoln Project: Excellence and Access in Public Higher Education
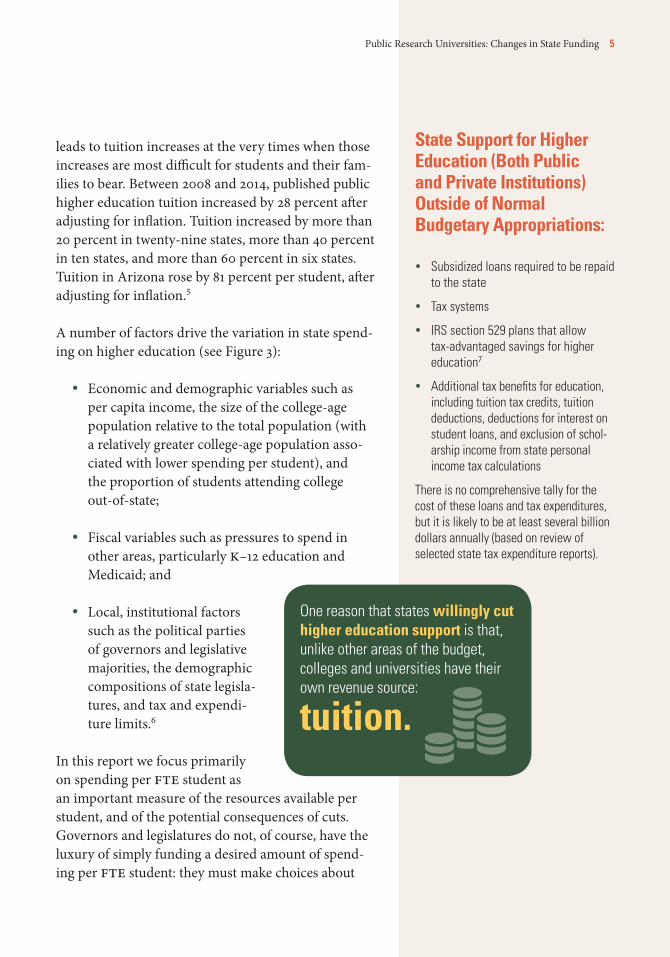
leads to tuition increases at the very times when those increases are most difficult for students and their fam-ilies to bear. Between 2008 and 2014, published public higher education tuition increased by 28 percent after adjusting for inflation. Tuition increased by more than 20 percent in twenty-nine states, more than 40 percent in ten states, and more than 60 percent in six states. Tuition in Arizona rose by 81 percent per student, after adjusting for inflation.5
A number of factors drive the variation in state spend-ing on higher education (see Figure 3):
Economic and demographic variables such as per capita income, the size of the college-age population relative to the total population (with a relatively greater college-age population asso-ciated with lower spending per student), and the proportion of students attending college out-of-state;
Fiscal variables such as pressures to spend in other areas, particularly k–12 education and Medicaid; and
Local, institutional factors such as the political parties of governors and legislative majorities, the demographic compositions of state legisla-tures, and tax and expendi-ture limits.6
In this report we focus primarily on spending per fte student as an important measure of the resources available per student, and of the potential consequences of cuts. Governors and legislatures do not, of course, have the luxury of simply funding a desired amount of spend-ing per fte student: they must make choices about
State Support for Higher Education (Both Public and Private Institutions) Outside of Normal Budgetary Appropriations:
Subsidized loans required to be repaid to the state
Tax systems
IRS section 529 plans that allow tax-advantaged savings for higher education7
Additional tax benefits for education, including tuition tax credits, tuition deductions, deductions for interest on student loans, and exclusion of schol-arship income from state personal income tax calculations
There is no comprehensive tally for the cost of these loans and tax expenditures, but it is likely to be at least several billion dollars annually (based on review of selected state tax expenditure reports).
One reason that states willingly cut higher education support is that, unlike other areas of the budget, colleges and universities have their own revenue source:
tuition.
Public Research Universities: Changes in State Funding 5

how much funding to provide for public priorities such as k–12 education, higher education, corrections, and health care, in dollar terms. The amount needed or desired will depend in part on whether the population involved is growing or shrinking—more or fewer children in school, students in college, prisoners in prisons, and elderly persons in nursing homes—but must fit into overall priorities. Except for k–12 education, there is no universal access guarantee. While higher education funding will not necessarily follow enrollment, spending per fte student is a good indicator of how overall changes in spending will affect students.
WY
IL
AK
WA
OR
CA
NV
ID
MT ND
MN
IA
MO
AR
LA
MS AL GA
FL
SC
NCTN
KY
IN OH
WV VA
PA
NY
VTNHMA
RI
NJ
DEMD
CT
ME
WI
MI
SD
NE
KS
OK
HI
State Support ($) per Full-Time Equivalent Student
≥ $16,000$14,000 to $15,999$12,000 to $13,999$10,000 to $11,999
COUT
AZNM
TX
Figure 3: State Support for Public Higher Education (All Colleges and Universities) in 2014,
per Full-Time Equivalent Student
$8,000 to $9,999$6,000 to $7,999$4,000 to $5,999$2,000 to $3,999
State support for public higher education per full-time equivalent student ranges from about $3,000 to over $18,000. Source: State Higher Education Executive Officers (SHEEO) Association, SHEF: FY 2014—State Higher Education Finance (Boulder, Colo.: State Higher Education Executive Officers Association, 2015).
6 The Lincoln Project: Excellence and Access in Public Higher Education

Section 2: The Decline in State FundingOverall, states have been cutting their support for higher education for well over a decade. Reductions were most dramatic between 2001 and 2004, and in the wake of the Great Recession and its accompanying decline in tax revenue. Although spending increased slightly in 2013 and again in 2014, these increases are dwarfed by the magnitude of prior cuts, and spending per fte student in 2014 was nearly 30 percent below its level in 2000, after adjusting for inflation (see Figure 4). And in many states, even with a turnaround in the level of state funding, the situ-ation has gotten worse due to corresponding tuition-increase freezes or caps. In states where tui-tion is constrained, universities are experiencing a net loss even when states do increase funding.
-40
-35
-30
-25
-20
-15
-10
-5
0
5
2000 2001 2003 2004 2005 2006 2007 2008 2009 2010 2011 2012 2013 2014
Perc
ent C
hang
e
Figure 4: Percent Change in State Support for Public Higher Education(All Colleges and Universities) per Full-Time Equivalent Student,
in Constant 2014 $, since 2000
Despite modest increases in 2013 and 2014, state support for public higher education per full-time equivalent student remains nearly 30 percent below spending in 2000, after adjusting for inflation using the State Higher Education Finance cost adjustment. Source: State Higher Education Executive Officers (SHEEO) Association, SHEF: FY 2014—State Higher Education Finance (Boulder, Colo.: State Higher Education Executive Officers Association, 2015).
Public Research Universities: Changes in State Funding 7

As a result of sustained cuts and governmental spending pressures elsewhere, higher education has declined as a share of state budgets. While states once spent more on higher education than Medicaid, higher education has been overtaken, and the gap is widening. The higher education share of general fund spending fell from 14.6 percent in 1990 to 9.4 percent in 2014, while the Medicaid share more than doubled, from 9.5 percent to 19.1 percent. States now spend more than twice as much on Medicaid as they do on higher education.
The higher education share of general fund spending fell from
14.6 percent in 1990 to 9.4 percent in 2014.
0%
2%
4%
6%
8%
10%
12%
14%
16%
18%
20%
1990 1992 1994 1996 1998 2000 2002 2004 2006 2008 2010 2012 2014
Medicaid
Higher Education
14.6%
9.4%9.5%
19.1%
Figure 5: Higher Education (All Colleges and Universities)and Medicaid as Share of State General Fund Expenditures
Higher education has fallen as a share of state budgets, while Medicaid has risen. Source: National Association of State Budget Officers, State Expenditure Report (various years, 1990–2014) (Washington, D.C.: National Association of State Budget Officers, 1991–2015), http://www.nasbo.org/publications-data/state-expenditure-report/archives.
8 The Lincoln Project: Excellence and Access in Public Higher Education
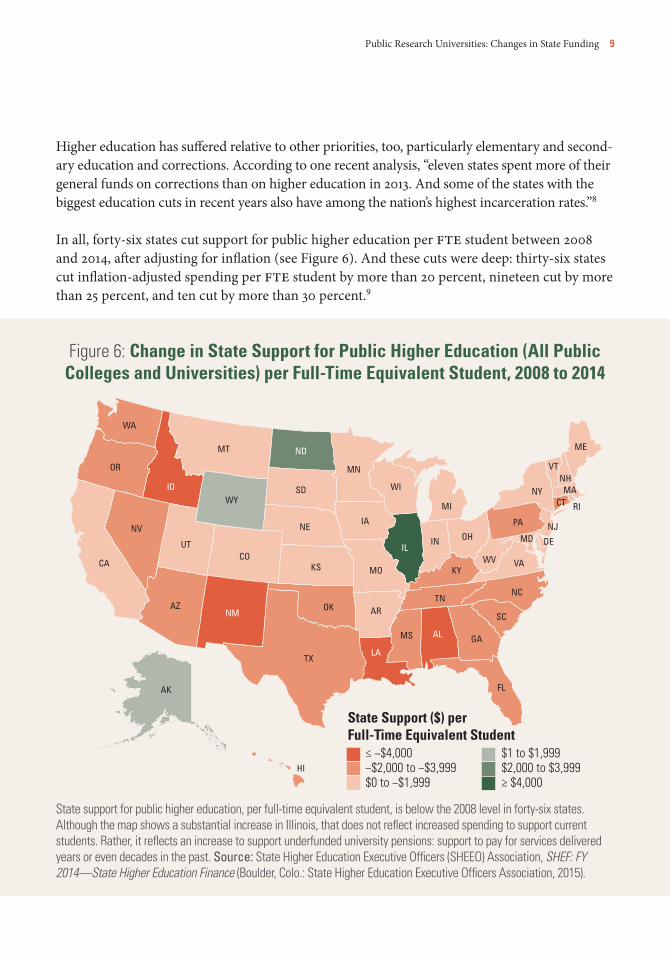
Higher education has suffered relative to other priorities, too, particularly elementary and second-ary education and corrections. According to one recent analysis, “eleven states spent more of their general funds on corrections than on higher education in 2013. And some of the states with the biggest education cuts in recent years also have among the nation’s highest incarceration rates.”8
In all, forty-six states cut support for public higher education per fte student between 2008 and 2014, after adjusting for inflation (see Figure 6). And these cuts were deep: thirty-six states cut inflation-adjusted spending per fte student by more than 20 percent, nineteen cut by more than 25 percent, and ten cut by more than 30 percent.9
State support for public higher education, per full-time equivalent student, is below the 2008 level in forty-six states. Although the map shows a substantial increase in Illinois, that does not reflect increased spending to support current students. Rather, it reflects an increase to support underfunded university pensions: support to pay for services delivered years or even decades in the past. Source: State Higher Education Executive Officers (SHEEO) Association, SHEF: FY 2014—State Higher Education Finance (Boulder, Colo.: State Higher Education Executive Officers Association, 2015).
WY
IL
AK
WA
OR
CA
NV
ID
MT ND
MN
IA
MO
AR
LA
MS AL GA
FL
SC
NCTN
KY
IN OH
WV VA
PA
NY
VTNHMA
RI
NJ
DEMD
CT
ME
WI
MI
SD
NE
KS
OK
HI
State Support ($) perFull-Time Equivalent Student
≤ −$4,000−$2,000 to −$3,999$0 to −$1,999
COUT
AZNM
TX
Figure 6: Change in State Support for Public Higher Education (All PublicColleges and Universities) per Full-Time Equivalent Student, 2008 to 2014
$1 to $1,999$2,000 to $3,999≥ $4,000
Public Research Universities: Changes in State Funding 9

State Spending on CorrectionsIn general, state spending on corrections has grown much faster than education spending over the last three decades. In eleven states, corrections has now surpassed higher education as a percentage of funding.
5.6%
Elementary &Secondary Education
Higher Education Corrections
Figure 7: Growth in State General Fund Spending,Adjusted for Inflation, 1986–2013
69%
141%
Source: Center on Budget and Policy Priorities analysis of data from National Association of State Budget Officers, State Expenditure Report (various years, 1986–2013) (Washington, D.C.: National Association of State Budget Officers, 1987–2014), http://www.nasbo.org/publications-data/state-expenditure-report/archives.
10 The Lincoln Project: Excellence and Access in Public Higher Education

Source: The Henry J. Kaiser Family Foundation, “Distribution of State General Fund Expenditures (in millions): Fiscal Year 2013,” http://kff.org/other/state-indicator/distribution-of-general-fund-spending/. Note also that when excluding appropriations for community colleges and technical schools, additional states—including California—have spent more on corrections than on higher education in recent years.
Figure 8: Corrections and Higher Education Spending as Percentage of State General Fund Expenditures (FY2013)
25%
20%
15%
10%
5%
0%
Higher Education
ORMI AZ VT CO PA NH DE RI MA CT
Corrections
Public Research Universities: Changes in State Funding 11

Section 3: Public Research Universities Have Been Hit Harder than Public Higher Education in General
While public higher education in general has been hit by cuts in state support, public research universities have been hit harder. Between 2008 and 2013, inflation-adjusted state appropriation support for public higher education per fte student declined by 26.3 percent in the median public research university. Of the 138 public research universities for which there was comparable data, inflation-adjusted support per fte student declined by more than 20 per-cent at 98 institutions, and declined by more than 40 percent at 29 institutions.10
To be sure, tuition increases have abated recently in response to modest increases in state sup-port in 2013 and 2014. Indeed, states that have continued with deep cuts are now the outliers. In Washington State, the latest budget reportedly provides for tuition reductions of 15–20 percent at four-year institutions, making it the only state to provide widespread tuition cuts.11 Other states have experienced modest increases in state support, but with corresponding tuition freezes. For example, the University of California recently agreed to freeze resident undergrad-uate tuition for two years in exchange for additional state support of 4 percent per year for two years. California expects to raise nonresident tuition by 8 percent.12
Between 2008 and 2013, inflation-adjusted state appropriation support for public higher education per full-time equivalent student
declined by 26 percentin the median public research university.
12 The Lincoln Project: Excellence and Access in Public Higher Education

0% 5% 10% 15% 20% 25% 30% 35%
StateAppropriations
Federal, State,Local Grants
and Contracts
Private Giftsand Grants
and Contracts
Net Tuitionand Fees
2001
2006
2012
Figure 9: Revenue Sources of Public Research Universities,2001, 2006, and 2012
Public research universities are increasingly reliant on tuition and fees in the wake of cuts in state appropriations. Data shown represent public research universities that are members of the Association of American Universities. Source: COGR Costing Committee, “Finances of Research Universities, June 2014 Version” (New York; Washington, D.C.: Council on Governmental Relations, 2014).
Public Research Universities: Changes in State Funding 13
Major State Spending Items that Compete with Higher Education for Resources
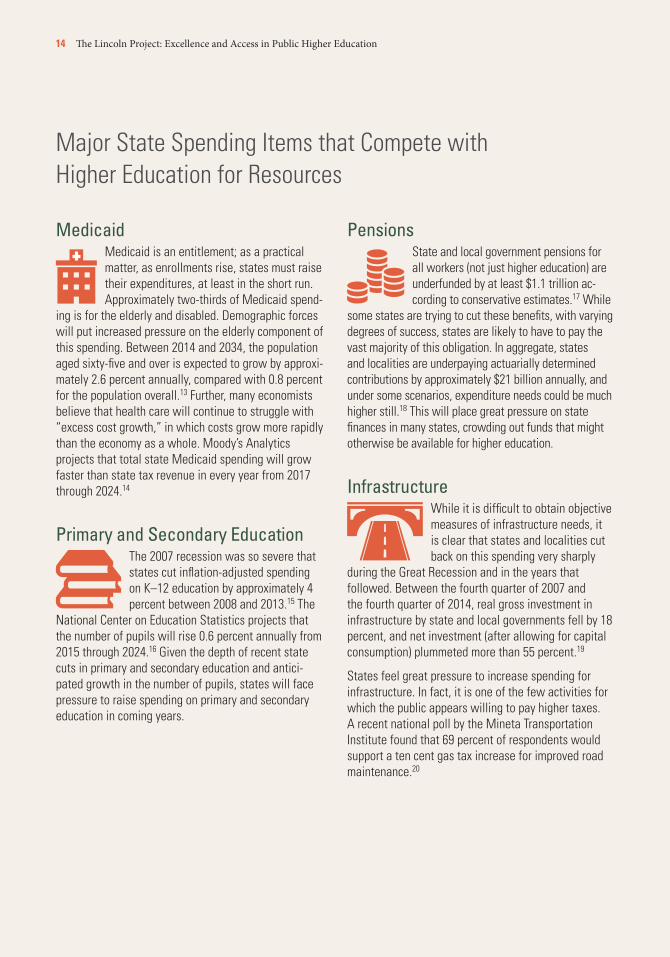
MedicaidMedicaid is an entitlement; as a practical matter, as enrollments rise, states must raise their expenditures, at least in the short run. Approximately two-thirds of Medicaid spend-
ing is for the elderly and disabled. Demographic forces will put increased pressure on the elderly component of this spending. Between 2014 and 2034, the population aged sixty-five and over is expected to grow by approxi-mately 2.6 percent annually, compared with 0.8 percent for the population overall.13 Further, many economists believe that health care will continue to struggle with “excess cost growth,” in which costs grow more rapidly than the economy as a whole. Moody’s Analytics projects that total state Medicaid spending will grow faster than state tax revenue in every year from 2017 through 2024.14
Primary and Secondary EducationThe 2007 recession was so severe that states cut inflation-adjusted spending on K–12 education by approximately 4 percent between 2008 and 2013.15 The
National Center on Education Statistics projects that the number of pupils will rise 0.6 percent annually from 2015 through 2024.16 Given the depth of recent state cuts in primary and secondary education and antici-pated growth in the number of pupils, states will face pressure to raise spending on primary and secondary education in coming years.
PensionsState and local government pensions for all workers (not just higher education) are underfunded by at least $1.1 trillion ac-cording to conservative estimates.17 While
some states are trying to cut these benefits, with varying degrees of success, states are likely to have to pay the vast majority of this obligation. In aggregate, states and localities are underpaying actuarially determined contributions by approximately $21 billion annually, and under some scenarios, expenditure needs could be much higher still.18 This will place great pressure on state finances in many states, crowding out funds that might otherwise be available for higher education.
InfrastructureWhile it is difficult to obtain objective measures of infrastructure needs, it is clear that states and localities cut back on this spending very sharply
during the Great Recession and in the years that followed. Between the fourth quarter of 2007 and the fourth quarter of 2014, real gross investment in infrastructure by state and local governments fell by 18 percent, and net investment (after allowing for capital consumption) plummeted more than 55 percent.19
States feel great pressure to increase spending for infrastructure. In fact, it is one of the few activities for which the public appears willing to pay higher taxes. A recent national poll by the Mineta Transportation Institute found that 69 percent of respondents would support a ten cent gas tax increase for improved road maintenance.20
14 The Lincoln Project: Excellence and Access in Public Higher Education
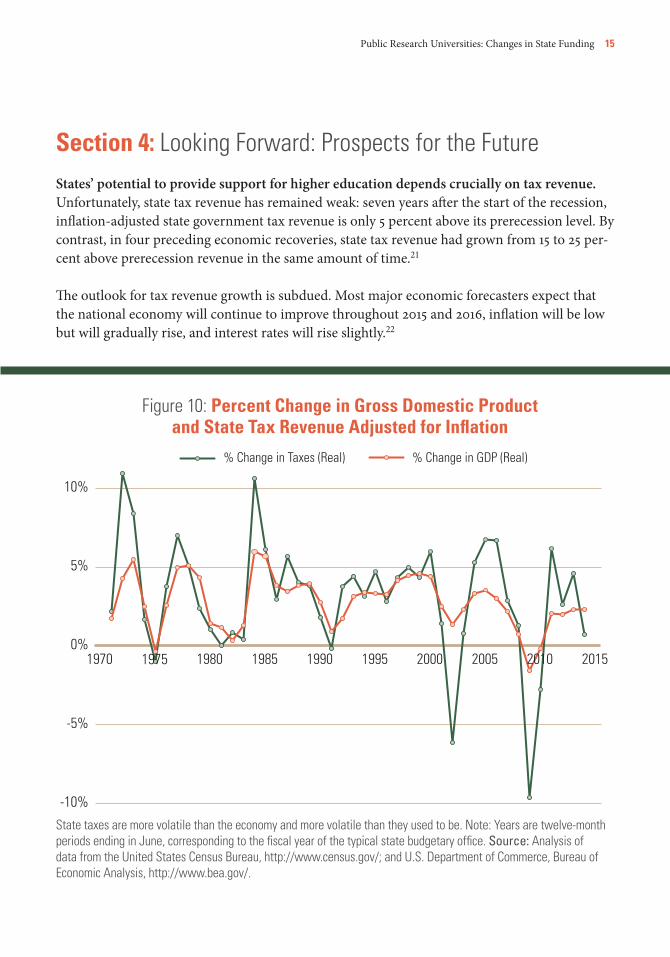
Section 4: Looking Forward: Prospects for the FutureStates’ potential to provide support for higher education depends crucially on tax revenue. Unfortunately, state tax revenue has remained weak: seven years after the start of the recession, inflation-adjusted state government tax revenue is only 5 percent above its prerecession level. By contrast, in four preceding economic recoveries, state tax revenue had grown from 15 to 25 per-cent above prerecession revenue in the same amount of time.21
The outlook for tax revenue growth is subdued. Most major economic forecasters expect that the national economy will continue to improve throughout 2015 and 2016, inflation will be low but will gradually rise, and interest rates will rise slightly.22
-10%
-5%
0%
5%
10%
1970 1975 1980 1985 1990 1995 2000 2005 2010 2015
% Change in Taxes (Real) % Change in GDP (Real)
Figure 10: Percent Change in Gross Domestic Productand State Tax Revenue Adjusted for Inflation
State taxes are more volatile than the economy and more volatile than they used to be. Note: Years are twelve-month periods ending in June, corresponding to the fiscal year of the typical state budgetary office. Source: Analysis of data from the United States Census Bureau, http://www.census.gov/; and U.S. Department of Commerce, Bureau of Economic Analysis, http://www.bea.gov/.
Public Research Universities: Changes in State Funding 15
State income taxes and sales taxes accounted for 35.9 percent and 31.3 percent, respectively, of state tax revenue in fiscal year 2014. Income taxes are unlikely to grow much faster than the overall economy over the next several years: progressive tax structures will drive growth up slightly, but this will likely be offset by drag from slow growth in nonwage income. Sales taxes have grown more slowly than the economy for more than forty years.23 This is a result of the difficulty in taxing the service industry and in collecting taxes on Internet sales, among other causes. The sales tax is likely to continue to grow more slowly than the economy for years to come. Thus, the overall outlook is for relatively slow revenue growth in the two major tax sources for the typical state.24
ConclusionTax revenue, although growing, is growing slowly. States face increases in spending areas that are difficult or impossible to cut, particularly Medicaid and pension contributions. They also face demands for spending on primary and secondary education: a popular priority that does not have its own revenue source (like tuition) and might more easily garner legislative sup-port. In addition, states have made sharp cuts in infrastructure spending and face considerable demand to restore some of that spending, allowing repairs of roads and bridges and improvements in other areas. Thus, higher education, despite its importance to the econ-omy, is continuing to fall behind these other priorities.
Most universities have instituted new pro-grams to reduce costs, but years of dramatic budget cuts have left little room for austerity: public research universities increasingly are expected to serve more Americans with less fund-ing. In response to this need, the Lincoln Project is developing new strategies for ensuring that public research universities continue to serve the nation as engines of innovation, growth, and opportunity for Americans of all backgrounds.
This is the second in a series of five publications that will examine the importance of our public research universities. Subsequent publications will include the current financial models of pub-lic research universities and how they are changing; and the impacts of the research conducted at these institutions on people, the economy, and the nation. Ultimately, the Lincoln Project will offer substantive policy recommendations for sustaining public research universities and will call on all funding partners—states, the federal government, philanthropies, business, and the public—to maintain and enhance their investment in them.
Public research universities increasingly are expected to serve more Americans with less funding.
16 The Lincoln Project: Excellence and Access in Public Higher Education
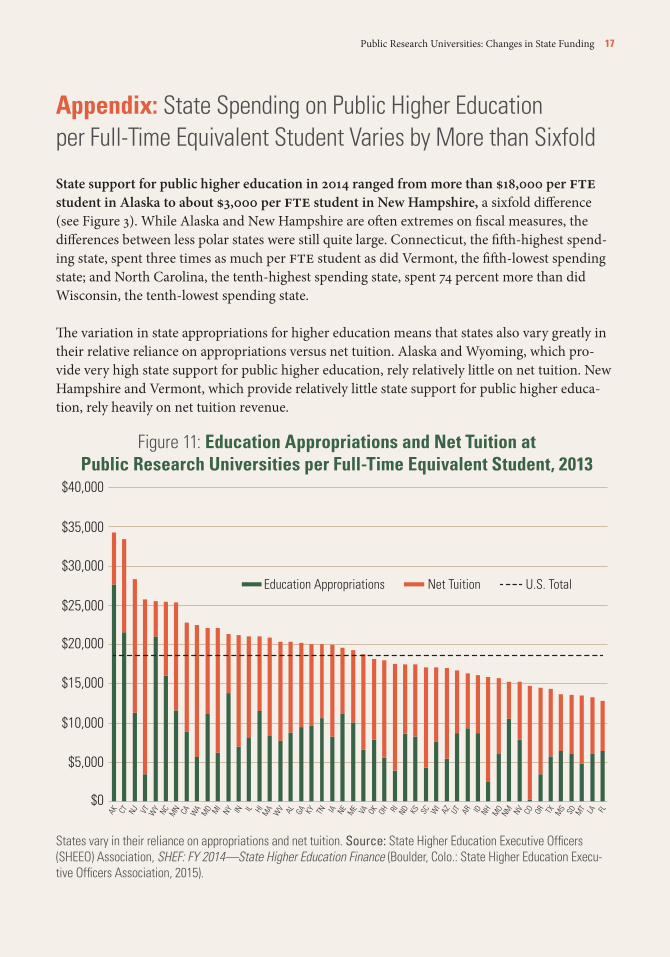
Appendix: State Spending on Public Higher Education per Full-Time Equivalent Student Varies by More than Sixfold
State support for public higher education in 2014 ranged from more than $18,000 per fte student in Alaska to about $3,000 per fte student in New Hampshire, a sixfold difference (see Figure 3). While Alaska and New Hampshire are often extremes on fiscal measures, the differences between less polar states were still quite large. Connecticut, the fifth-highest spend-ing state, spent three times as much per fte student as did Vermont, the fifth-lowest spending state; and North Carolina, the tenth-highest spending state, spent 74 percent more than did Wisconsin, the tenth-lowest spending state.
The variation in state appropriations for higher education means that states also vary greatly in their relative reliance on appropriations versus net tuition. Alaska and Wyoming, which pro-vide very high state support for public higher education, rely relatively little on net tuition. New Hampshire and Vermont, which provide relatively little state support for public higher educa-tion, rely heavily on net tuition revenue.
$0
$10,000
$5,000
$15,000
$30,000
$25,000
$20,000
$35,000
$40,000
AK CT NJ VT WY NC
MN CA WA
MD MI
NY IN IL HI MA
WV AL GA KY TN IA NE
ME VA OK OH RI ND KS SC WI
AZ UT AR ID NHM
ONM NV CO OR TX M
S SD MT LA FL
Figure 11: Education Appropriations and Net Tuition atPublic Research Universities per Full-Time Equivalent Student, 2013
Education Appropriations Net Tuition U.S. Total
States vary in their reliance on appropriations and net tuition. Source: State Higher Education Executive Officers (SHEEO) Association, SHEF: FY 2014—State Higher Education Finance (Boulder, Colo.: State Higher Education Execu-tive Officers Association, 2015).
Public Research Universities: Changes in State Funding 17
The relationship between education appropriations and net tuition also reflects state philos-ophies and policies about who should pay the costs of higher education. For example, New Mexico, which has a relatively high appropriation share, has a policy of keeping tuition low to allow a large number of students to participate. Vermont, by contrast, prefers to keep tuition higher for those who can afford college and provides significant financial assistance for those who cannot.25
How have changes in state support affected individual public university systems, and how have these institutions responded?
California“Prior to 2010–11, state funding was the larg-est single source of support for the education function of the University. Over the past ten years, state educational appropriations have fallen more than $1 billion in inflation- adjusted dollars despite uc’s enrollment growth. State educational appropriations constituted only 9 percent of uc’s operating budget in 2012–13 compared to 23 percent in 2001–02.”26
Colorado“Colorado State this year [2011] received $94 million in funding from the State of Colorado, a reduction of about $36 million over the past three years. Colorado State has managed these state funding cuts by freezing hiring and salaries, reducing expenses (with an emphasis on cuts to administration), and increasing student tuition.”27
New YorkIn New York, the percent change in state educational appropriations per fte stu-dent from 2008 to 2014 is –11.1 percent, a decrease of $1,154 per student. To offset these cuts, tuition has increased by $1,215 per fte student (21.3 percent) in the same six years.28
Tennessee“In Tennessee, total appropriations remain below fy2008 levels. As a result, in fy2015 there is no funding for general salary increases for state and university employees, leading the state to lag in providing com-pensation at the market rate. In order to maintain current operations and continue progress in supporting student success and completion, the in-state maintenance fee will increase 6 percent, from $9,780 to $10,366 for in-state students at the University of Ten-nessee, Knoxville. It should be noted that the University of Tennessee continues to allocate additional funding to student aid to keep the net cost of student fees as low as possible—expenditures for institutional scholarships and fellowships grew by over 233 percent from fy2003 to fy2013.”29
18 The Lincoln Project: Excellence and Access in Public Higher Education

Endnotes1 National Association of State Budget Officers, State Expenditure Report: Examining Fiscal 2012–2014 State Spending (Washington, D.C.: National Association of State Budget Officers, 2015). These numbers are for general fund spending rather than spending from all funds. In many states, higher education spending in other funds includes spending by institutions from tuition revenue and other sources not derived from states’ own resources, and thus does not measure state “effort” to fund higher educa-tion. The data in for 2014 are estimates collected before final fiscal reports for the 2014 fiscal year were complete. However, they are not forecasts prepared before the start of the fiscal year, and tend to offer good estimates of actual expenditures. See ibid., 102: “For higher education, states were requested to include expenditures made for capital construction, community colleges, vocational education, law, medical, veterinary, nursing and technical schools, and assistance to private colleges and universities, as well as tuition, fees and student loan programs. Higher education expenditures exclude federal research grants and endow-ments by universities.” Because the data in are for the general fund, most higher education capital expenditures are excluded.
2 Some reports have calculated different spending shares based upon total expenditures rather than general fund expenditures. Given that our focus is state tax support for higher education, the general fund is more appropriate here.
3 According to the Pew Charitable Trusts (The Pew Charitable Trusts, Fiscal Federalism Initiative, “Federal and State Funding of Higher Education: A Changing Landscape,” June 11, 2015, http://www.pewtrusts.org/en/research-and-analysis/issue-briefs/2015/06/federal -and-state-funding-of-higher-education), federal spending for higher education now exceeds state government spend-ing for higher education slightly, the result of a surge in federal spending after the Great Recession and sharp cut-backs in state spending. The nature of federal spending on higher education is very different from state spending: state funding is primarily for operating support to institutions, while federal spending is mainly for financial assistance to students (such as Pell grants), specific federal research projects, and veterans’ education benefits. In addition, the federal government provides nearly half again as much support for higher education through tax expenditures as it does through direct spending, particularly through the American Opportunity Tax Credit, the successor to the Hope Tax Credit.
4 American Academy of Arts & Sciences, Public Research Universities: Why They Matter (Cambridge, Mass.: Ameri-can Academy of Arts & Sciences, 2015).
5 Michael Mitchell, Vincent Palacios, and Michael Leachman, States are Still Funding Higher Education below Pre-Recession Levels (Washington, D.C.: Center on Budget and Policy Priorities, 2014), http://www.cbpp.org/research/states-are-still-funding-higher-education-below-pre -recession-levels; and Michael Mitchell and Michael Leach-man, Years of Cuts Threaten to Put College Out of Reach for More Students (Washington, D.C.: Center on Budget and Policy Priorities, 2015), http://www.cbpp.org/research/state-budget-and-tax/years-of-cuts-threaten-to-put -college-out-of-reach-for-more-students.
6 For recent reviews of research on this topic, see Jennifer A. Delaney and William R. Doyle, “State Spending on Higher Education: Testing the Balance Wheel over Time,” Journal of Education Finance 36 (4) (2011): 343–368; Jenni-fer A. Delaney and William R. Doyle, “The Role of Higher Education in State Budgets,” in State Postsecondary Educa-tion Research: New Methods to Inform Policy and Practice, ed. Kathleen M. Shaw and Donald E. Heller (Sterling, Va.: Stylus Publishing, 2007); and Michael K. McLendon, James C. Hearn, and Christine G. Mokher, “Partisans, Profession-als, and Power: The Role of Political Factors in State Higher Education Funding,” The Journal of Higher Education 80 (6) (2009): 686–713, doi:10.1353/jhe.0.0075.
7 National Conference of State Legislatures, “Saving for College: 529 Plans,” May 22, 2014, http://www.ncsl.org/research/education/saving-for-college-529-plans.aspx.
8 Mitchell, Palacios, and Leachman, States are Still Fund-ing Higher Education below Pre-Recession Levels.
9 Analysis derived from State Higher Education Execu-tive Officers (sheeo) Association, SHEF: FY 2014—State Higher Education Finance (Boulder, Colo.: State Higher Education Executive Officers Association, 2015). These numbers differ slightly from numbers in a report by the Center on Budget and Policy Priorities, likely because these numbers reflect updated data for 2014. See Mitchell, Palacios, and Leachman, States are Still Funding Higher Education below Pre-Recession Levels.
10 Analysis of ipeds data, see National Center for Education Statistics, ipeds [Integrated Postsecondary Education Data System] (U.S. Department of Education, Institute of Education Sciences), https://nces.ed.gov/ipeds/.
11 Stacy Teicher Khadaroo, “Dramatic Cuts to College Tui-tion in Washington State: Will Others Follow?” The Christian Science Monitor, July 2, 2015, http://www.csmonitor.com/USA/Education/2015/0702/Dramatic-cuts-to-college-tuition -in-Washington-State-Will-others-follow.
12 Bay City News, “University of California to Freeze Undergraduate Tuition for California Residents for 2
Public Research Universities: Changes in State Funding 19

Years,” May 14, 2015, http://abc7news.com/education/uc-to-freeze-undergraduate-tuition-for-ca-residents-for-2 -years/722871/.
13 Donald Boyd, The Potential Impact of Alternative Health Care Spending Scenarios on Future State and Local Government Budgets, The Future of U.S. Health Care Spending Conference, April 11, 2014 (Washington, D.C.: Engelberg Center for Health Care Reform at Brookings, 2014).
14 Dan White and Sarah Crane, Crowded Out: The Outlook for State Higher Education Spending (New York: Moody’s Analytics, 2015).
15 Donald J. Boyd and Lucy Dadayan, The Economy Recovers While State Finances Lag, The Blinken Report (Al-bany, N.Y.: Nelson A. Rockefeller Institute of Government, June 2015), http://www.rockinst.org/pdf/government_ finance/2015-06-23-Blinken_Report_Two.pdf.
16 Analysis of Institute of Education Sciences, National Center for Education Statistics, “Digest of Education Sta-tistics 2014,” Table 203.10, https://nces.ed.gov/programs/digest/d14/tables/dt14_203.10.asp.
17 Donald J. Boyd and Peter J. Kiernan, Strengthening the Security of Public Sector Defined Benefit Plans, The Blinken Report (Albany, N.Y.: Nelson A. Rockefeller Institute of Government, January 2014), http://www.rockinst.org/pdf/government_finance/2014-01-Blinken_Report_One.pdf.
18 Don Boyd, “National Economic Forces Affecting State Budgets and Pension Systems,” Governor’s Forum: Pen-sions at the Harris School, University of Chicago, Gleacher Center, Chicago, April 27, 2015.
19 Boyd and Dadayan, The Economy Recovers While State Finances Lag.
20 More than a dozen states considered gas tax increases in 2015, and the Nebraska legislature even overrode a gubernatorial veto of a gas tax increase. See ibid.
21 Boyd and Dadayan, The Economy Recovers While State Finances Lag.
22 For surveys of major forecasters, see The Wall Street Journal, “Economic Forecasting Survey,” http://projects.wsj .com/econforecast/; and Federal Reserve Bank of Philadel-phia, “Survey of Professional Forecasters,” http://www .philadelphiafed.org/research-and-data/real-time-center/survey-of-professional-forecasters/. For the latest forecasts available at the time of writing, see The Wall Street Journal, “wsj Economic Survey June 2015,” http://online.wsj.com/public/resources/documents/wsjecon0615.xls. See also Boyd and Dadayan, The Economy Recovers While State Finances Lag.
23 John L. Mikesell, “The Disappearing Retail Sales Tax,” State Tax Notes (March 5, 2012): 777–791.
24 Boyd and Dadayan, The Economy Recovers While State Finances Lag.
25 Julie Davis Bell, The Nuts and Bolts of the Higher Edu-cation Legislative Appropriations Process, Getting What You Pay For Policy Brief (Boulder, Colo.: National Conference of State Legislatures and Western Interstate Consortium for Higher Education, November 2008), http://www.wiche .edu/info/gwypf/bell_appropriations.pdf.
26 University of California, Accountability Report 2014 (Oakland: University of California Regents, 2015), “Chap-ter 12: University Finances and Private Giving,” http://accountability.universityofcalifornia.edu/2014/index/chapter/12.
27 Colorado State University, Financial Accountability Report: Fiscal Year 2011 Financial Highlights (Fort Collins: Colorado State University, 2012), 2, http://busfin.colostate .edu/finstmt/finacct11.pdf.
28 Mitchell, Palacios, and Leachman, States are Still Funding Higher Education below Pre-Recession Levels.
29 The University of Tennessee, Budget Document FY 2014–2015 (Knoxville: University of Tennessee System Budget Office, 2014), http://www.tennessee.edu/budget/docs/FY15_Proposed.pdf.
20 The Lincoln Project: Excellence and Access in Public Higher Education

The Lincoln Project: Excellence and Access in Public Higher Education
Advisory GroupRobert Birgeneau, Cochair, University of
California, Berkeley
Mary Sue Coleman, Cochair, University of Michigan
Lawrence S. Bacow, Tufts University
Gene D. Block, University of California, Los Angeles
Henry Brady, University of California, Berkeley
Phil Bredesen, former Governor of Tennessee
Nancy Cantor, Rutgers University–Newark
John T. Casteen III, University of Virginia
Jonathan Cole, Columbia University
Gray Davis, former Governor of California
Patrick Doyle, Domino’s Pizza, Inc.
David B. Frohnmayer†, University of Oregon
E. Gordon Gee, West Virginia University
Matthew Goldstein, The City University of New York
Donald Graham, Graham Holdings Company
Carl Guardino, Silicon Valley Leadership Group
Robert D. Haas, Levi Strauss & Co.
Jim Hackett, Steelcase
Ann Weaver Hart, University of Arizona
Michael Hout, New York University
Kay Bailey Hutchison, former United States Senator, Texas
Jim Leach, University of Iowa
Earl Lewis, The Andrew W. Mellon Foundation
Ann Marie Lipinski, Nieman Foundation for Journalism at Harvard University
George Miller, former United States Representative, California
William Powers, Jr., The University of Texas at Austin
John Rogers, Ariel Investments
Thomas Siebel, C3 Energy; First Virtual Group
Shirley M. Tilghman, Princeton University
Phyllis M. Wise, University of Illinois at Urbana-Champaign
Frank Yeary, CamberView Partners llc; University of California, Berkeley
Pauline Yu, American Council of Learned Societies
FundersThe William and Flora Hewlett Foundation
The Spencer Foundation
Carnegie Corporation of New York
Thomas and Stacey Siebel Foundation
Robert and Colleen Haas
Contributing AuthorDonald J. Boyd, Nelson A. Rockefeller
Institute of Government (affiliation given for identification purposes only)
Project StaffSamantha CarneyEliza BergJohn TessitoreElissa Chin Lu, ConsultantBeata FitzPatrick, Consultant
† Deceased
