public works - muni.org · the public works department was created in 2010, ... neighborhood...
TRANSCRIPT

Watershed Management
Communications
FacilityMaintenance
FleetMaintenance
ProjectManagement
StreetMaintenance
Other Service Areas (SA)
Public Art
Project Management
Survey
Public Works
Geotechnical Services
Administration
Finance
Data
Safety
Signals
Public Works
Design
Municipal Manager
EngineeringMaintenance and
OperationsAdministration Traffic
2012 Approved General Government Operating Budget
21 - 1

Public Works The Public Works Department was created in 2010, to deliver better service to customers, by combining the following departments:
Maintenance & Operations Project Management & Engineering (except Private Development) Traffic (except Transportation Planning) Community Planning & Development (1% for Arts) Development Services (Director and Admin)
Description
Public Works mission is to ensure the integrity and reliability of the Municipality of Anchorage's infrastructure through our Project Management & Engineering, Traffic, Maintenance & Operations, and Administration Divisions.
Department Services/Divisions
Project Management & Engineering Division o The Project Management & Engineering Division delivers completed Public
Works projects to meet the needs of our community. Our engineers perform all aspects of engineering and design for planning and construction of roads, sidewalks, storm drains, trails, and parks. Street designs include new construction and reconstruction, curbing and gutters, traffic signals, signage, and street lighting. Other key responsibilities of the Division include storm water run-off management, flood hazard reviews, right-of-way acquisition for municipal projects, and administration of Road Improvement District projects.
Traffic Division
o The Traffic Division promotes and ensures safe and efficient transportation. Responsibilities encompass the day-to-day operation of Anchorage's traffic signals and street signs. The Traffic Division provides services that move people and goods on city roads and pedestrian systems. We focus on addressing neighborhood traffic concerns and operations that maximize public safety.
The Maintenance and Operations Division
o The Maintenance and Operations Division performs a major portion of the maintenance needs on municipally-owned properties throughout Anchorage. Activities include street maintenance including snow removal, facility maintenance, fleet maintenance, communications, managing facility capital improvement projects, and a variety of other maintenance needs.
o Street Maintenance is one of the biggest, and costliest, responsibilities of municipal government. It's also one of the most necessary. The Street Maintenance Division must keep approximately 1,300 lane miles of streets at an adequate level of service and safety. An important function of Street Maintenance is to provide snow and ice removal to ensure a safe and accessible transportation system during winter months.
o Facility Maintenance provides the maintenance of over 164 municipal buildings and over 211 parks. Maintenance responsibility includes all facets of building maintenance including HVAC, carpentry, electrical, plumbing, mechanical, welding, painting, graffiti removal, and roofing repairs.
2012 Approved General Government Operating Budget
21 - 2

o Fleet Maintenance provides essential maintenance and repairs for 578 municipal vehicles and equipment, to include the Anchorage Police Department fleet of an additional 455 vehicles.
o Communications & Electronics provides expertise to ensure that public safety communications and electronic systems are fully functional for all Municipal agencies. Some of the supported systems are the Police and Fire 911 Centers, 12 microwave radio sites, mobile computer systems used by Police, Fire and Transit, 250 automatic defibrillators and nearly 3,000 mobile and portable two- way radios.
o Capital Projects provides project management services on major general government building renovations and new construction capital projects. This section is responsible for new construction such as the Mt. View Library, fire stations, and Eagle River Town Center. They are also responsible for all maintenance projects, which include things such as roof replacement, lighting, fire control systems, painting, heating, and any other miscellaneous projects related to facilities.
Administration Division
o The Public Works Administration Division is responsible for performing essential support tasks for administration of projects, personnel, finance, and budget issues. The Division is also the home of the Curator of Art for Public Spaces, and management of the 1% for Art Program. Division staff manages the Capital Improvements Program, the Adopt-a-Road Program, and Limited Road Service Areas (LRSA).
2012 Approved General Government Operating Budget
21 - 3

Direct Cost by DivisionEngineering 5,997,244 6,629,904 6,095,829 <8.06%>
Maintenance & Operations 68,262,223 81,408,204 85,409,728 4.92%
Other Service Areas 9,604,725 10,167,065 10,267,499 0.99%
Public Works Administration 1,288,611 1,892,918 2,170,965 14.69%
Traffic 4,448,757 4,515,788 4,363,986 <3.36%>
Direct Cost Total 89,601,560 104,613,879 108,308,007 3.53%
Intragovernmental ChargesCharges by Other Departments 17,705,205 11,823,001 11,214,457 <5.15%>
Charges to Other Departments (33,391,674) (30,085,267) (29,874,833) <0.70%>
Function Cost Total 73,915,091 86,351,613 89,647,631 3.82%
Program Generated Revenue (3,361,190) (3,719,085) (3,349,867) <9.93%>
Net Cost Total 70,553,901 82,632,528 86,297,764 4.44%
Direct Cost by Category
Personnel 27,520,799 30,232,313 29,846,193 <1.28%>
Supplies 3,859,470 4,674,554 4,503,243 <3.66%>
Travel 193 22,010 12,010 <45.43%>
Contractual/OtherServices 29,521,829 29,971,365 28,981,562 <3.30%>
Debt Service/Depreciation 28,501,671 39,641,017 44,892,379 13.25%
Equipment, Furnishings 197,597 72,620 72,620 -
Direct Cost Total 89,601,560 104,613,879 108,308,007 3.53%
Position Summary as Budgeted
Full-Time 249 246 240
Part-Time 21 21 21
Position Total 270 267 261
Public WorksDepartment Summary
2011Revised
2012Approved
2010Actuals
12 v 11% Chg
2012 Approved General Government Operating Budget
21 - 4

Direct Costs FT PT S/T
104,613,880 245 2 19
- Delete one-time funding for Street Maintenance operations (overtime during summer construction season in support of State funded road projects)
(67,000) - - -
- Delete 2011 one-time voter-approved Maintenance and Operations Facility Roof Reserve Bond (includes Libraries, Sullivan Arena and Museum); 2008 Prop 1
(340,000) - - -
- None - - - -
- General Obligation Bond debt service 5,251,362 - - -
- Salary and benefits adjustments 1,094,201 - - -
- New position in Girdwood Valley Service Area for operation and maintenance of roads, facilities, parks, and recreation; replaces two part-time positions were eliminated in Parks and Recreation
93,394 1 - -
- Delete O&M funding for Bond Proposition #5 that did not pass (2,000) - - -
110,643,837 246 2 19
- None - - - -
- Leave cash-out adjustment (883,924) - - -
- Charge capital projects for equipment rental associated with projects (316,342) - - -
- Reduce fleet equipment charges for equipment no longer needed that will be auctioned
(66,698) - - -
- Reclass Sr. Electronic Technician position to entry level to better enable career t k
(19,862) - - -
- Delete 2 Engineering Tech III positions; last filled April 2010; no impact on services
(218,804) (2) - -
- Delete Principal Accountant Position; last filled May 2011; no impact on services (106,311) (1) - -
- Delete Realty Officer I position; last filled April 2010; no impact on services (94,824) (1) - -
- Delete Sr. Office Associate position; last filled October 2009; no impact on services
(82,315) (1) - -
- Delete Technical Assistant in Traffic Division; (100,676) (1)
- Reduce amount available for small projects in Facility Maintenance Division; balance remaining $1,175,963.
(150,000) - - -
- Non-labor savings based on analysis of average spend in prior years for contractual services in Street Maintenance; $1,428,028 remains
(100,000) - - -
- Fuel and travel savings based on analysis of average spend in prior years in Street Maintenance Division; $1,381,667 remains
(110,000) - - -
Transfers (to)/from Other Agencies
Debt Service Changes
Public WorksReconciliation from 2011 Revised Budget to 2012 Approved Budget
Positions
2011 Revised Budget
2011 One-Time Requirements
Transfers (to)/from Other Agencies
2012 Proposed Budget Changes
Changes in Existing Programs/Funding for 2011
2012 Continuation Level
2012 Approved General Government Operating Budget
21 - 5

Direct Costs FT PT S/T
Public WorksReconciliation from 2011 Revised Budget to 2012 Approved Budget
Positions
- Savings based on analysis of average spend in prior years for repair and maintenance supplies in Street Maintenance Division; $1,281,514 remains
(96,411) - - -
- Contractual savings based on analysis of average spend in prior years in Street Maintenance Division; $1,428,028 remains
(223,763) - - -
- Utility savings based on analysis of average spend in prior years in the Facility Maintenance Division; $3,354,249 remains
(100,000) - - -
- Savings in professional services based on analysis of average spend in prior years in the Watershed Management Division; $434,960 remains
(150,000) - - -
- Voter approved ARDSA Bond O&M; 2011 Prop 4, 2010 Prop 1 111,100 - - -
- Voter approved Facility Roof Reserve Bond includes Libraries, Sullivan Arena and Museum; 2008 Prop 1
340,000 - - -
- Voter approved Facility Roof Repair Bond for the Sullivan Arena; 2008 Prop 1 10,000 - - -
- Voter approved Museum Roof Repair Bond for the Museum; 2008 Prop 1 23,000 - - -
- None - - - -
2012 Approved Budget 108,308,007 240 2 19
2012 S Revisions/Assembly Amendments/Mayor Vetoes
2012 Approved General Government Operating Budget
21 - 6

2010Actuals
2011Revised
2012Approved
12 v 11% Chg
Direct Cost by CategorySalaries and Benefits 5,405,514 5,873,949 5,489,874 <6.54%>
Supplies 29,102 62,877 62,877 -
Travel - - -
Contractual/Other Services 539,356 685,238 535,238 <21.89%>
Equipment, Furnishings 23,271 7,840 7,840 -
Manageable Direct Cost Total 5,997,244 6,629,904 6,095,829 <8.06%>
Debt Service, Depreciation - - -
Direct Cost Total 5,997,244 6,629,904 6,095,829 <8.06%>
Revenue by FundFund 101 - Areawide General 329,942 385,000 385,000 -
Revenue Total 329,942 385,000 385,000 -
Positions as Budgeted2010 Revised 2011 Revised 2012 Approved
Full Time Part Time Full Time Part Time Full Time Part Time
Administrative Officer 1 - 1 - 1 -
CAD Tech III - - 1 - - -
Civil Engineer II 13 - 11 - 11 -
Civil Engineer III 4 - 3 - 3 -
Civil Engineer IV 1 - 1 - 2 -
Deputy Director I 1 - 1 - - -
Deputy Director II - - - - 1 -
Division Director II - - 1 - - -
Eng Technician III 7 2 6 2 6 2
Engineer Tech IV - - 1 - 1 -
Engineering Technician IV 4 - 4 - 4 -
Environmental Specialist - - 1 - 1 -
Landscape Architect 1 - 1 - 1 -
Landscape Architect III 1 - 1 - 1 -
Municipal Surveyor 1 - 1 - 1 -
Office Associate 2 - 2 - - -
Prin Office Associate 1 - - - - -
Principal Admin Officer 1 - 1 - - -
Public Works Superintendent - - 1 - 1 -
Realty Officer I 1 - 1 - - -
Realty Officer II 1 - 1 - 1 -
Senior Office Associate 1 - 1 - 1 -
Sr Landscape Architect 2 - 1 - 1 -
Sr Office Associate - - 1 - 1 -
Positions as Budgeted Total 43 2 43 2 38 2
Public WorksDivision Summary
(Dept ID # 7310, 7320, 7321, 7322, 7323, 7324, 7330, 7340, 7360)
Engineering
2012 Approved General Government Operating Budget
21 - 7

Net Cost
Manageable Direct Cost 5,997,244 6,629,904 6,095,829 <8.06%>
Debt Service, Depreciation - - - -
Charges By Other Departments 3,730,339 3,561,861 3,314,810 <6.94%>
Charges to Other Departments (7,973,259) (8,474,783) (7,420,434) <12.44%>
Program Generated Revenue (329,942) (385,000) (385,000) -
Net Cost Total 1,424,381 1,331,982 1,605,205 20.51%
Direct Cost by CategorySalaries and Benefits
1101 - Straight Time Labor 3,092,836 3,700,818 3,539,447 <4.36%>
1201 - Overtime 159,739 138,550 138,550 -
1301 - Leave/Holiday Accruals 429,585 247,335 80,237 <67.56%>
1401 - Benefits 1,694,313 1,895,454 1,839,847 <2.93%>
1501 - Allow Differentials/Premiums 29,042 5,000 5,000 -
1601 - Vacancy Factor - (113,207) (113,207) -
Salaries and Benefits Total 5,405,514 5,873,949 5,489,874 <6.54%>
Supplies 29,102 62,877 62,877 -
Travel - - - -
Contractual/Other Services 539,356 685,238 535,238 <21.89%>
Equipment, Furnishings 23,271 7,840 7,840 -
Manageable Direct Cost Total 5,997,244 6,629,904 6,095,829 <8.06%>
Debt Service, Depreciation - - - -
Direct Cost Total 5,997,244 6,629,904 6,095,829 <8.06%>
Intra-Governmental ChargesCharges By Other Departments 3,730,339 3,561,861 3,314,810 <6.94%>
Charges to Other Departments (7,973,259) (8,474,783) (7,420,434) <12.44%>
Program Generated Revenue9141 - Inspections 234,875 285,000 235,000 <17.54%>
9199 - Miscellaneous Permits 68,764 75,000 125,000 66.67%
9411 - Platting Fees 24,900 25,000 25,000 -
9742 - Other Property Sales 83 - - -
9798 - Miscellaneous Revenues 1,320 - - -
Program Generated Revenue Total 329,942 385,000 385,000 -
Public WorksDivision Detail
(Dept ID # 7310, 7320, 7321, 7322, 7323, 7324, 7330, 7340, 7360)
Engineering
2011Revised
2012Approved
2010Actuals
12 v 11% Chg
2012 Approved General Government Operating Budget
21 - 8

2010Actuals
2011Revised
2012Approved
12 v 11% Chg
Direct Cost by CategorySalaries and Benefits 16,686,208 18,261,311 18,059,687 <1.10%>
Supplies 3,104,493 3,854,477 3,656,066 <5.15%>
Travel - 14,810 4,810 <67.52%>
Contractual/Other Services 19,860,116 19,602,889 18,763,086 <4.28%>
Equipment, Furnishings 109,735 33,700 33,700 -
Manageable Direct Cost Total 39,760,552 41,767,187 40,517,349 <2.99%>
Debt Service, Depreciation 28,501,671 39,641,017 44,892,379 13.25%
Direct Cost Total 68,262,223 81,408,204 85,409,728 4.92%
Revenue by FundFund 101 - Areawide General 96,597 95,100 95,100 -
Fund 129 - Eagle River Street Lighting SA 9,655 9,970 9,970 -
Fund 141 - Anchorage Roads & Drainage SA 1,462,744 1,628,455 1,299,237 <20.22%>
Revenue Total 1,568,997 1,733,525 1,404,307 <18.99%>
Positions as Budgeted2010 Revised 2011 Revised 2012 Approved
Full Time Part Time Full Time Part Time Full Time Part Time
Administrative Officer 1 - 1 - 1 -
Civil Engineer - 1 - 1 - 1
Civil Engineer II 1 - 2 - 2 -
Custdl Qlty Control Spec 1 - 1 - 1 -
Division Director I - - 1 - 1 -
Division Director II - - 1 - 1 -
Electronic Foreman 1 - 1 - 1 -
Electronic Tech Leadman 1 - 1 - 1 -
Eng Technician III 1 - 1 - 1 -
Engineering Technician II 1 - 1 - 1 -
Equipment Operations Tech I 3 - 3 - 3 -
Equipment Operations Tech II 1 - 1 - 1 -
General Foreman 8 - 8 - 7 -
Heavy Equipment Operator 28 - 28 - 28 -
Heavy Equipment Operator Ldmn 5 - 5 - 5 -
Journeyman Carpenter 7 - 7 - 7 -
Journeyman Certified Plumber 9 - 9 - 9 -
Journeyman Certified Plumber Foreman - - - - 1 -
Journeyman Wireman 7 - 7 - 7 -
Journeyman Wireman Foreman 1 - 1 - 1 -
Junior Admin Officer 1 - 1 - 1 -
Lead Plumber 1 - 1 - - -
Leadman Plumber 1 - - - - -
Leadman Plumber new01 - - 1 - 1 -
Light Equipment Operator 12 12 12 10 12 10
Public WorksDivision Summary
(Dept ID # 1610, 1634, 1657, 1658, 7410, 7430, 7470, 7472, 7671, 7740)
Maintenance & Operations
2012 Approved General Government Operating Budget
21 - 9

Positions as Budgeted2010 Revised 2011 Revised 2012 Approved
Full Time Part Time Full Time Part Time Full Time Part Time
Light Equipment Operator snow removal - - - 2 - 2
Maintenance & Operations Dir. 1 - - - - -
Maintenance Supervisor 1 - 1 - - -
Manager - - - - 2 -
Medium Equipment Operator 38 - 38 - 38 -
Office Associate 2 1 2 1 1 1
Prin Office Associate 1 - 1 - - -
Principal Admin Officer - - - - 1 -
PW Superintendent 2 - 2 - - -
Radio Installer II 1 - 1 - 1 -
Radio Installer III 2 - 2 - 2 -
Senior Admin Officer 3 - 2 - 2 -
Senior Office Associate 2 - 2 - 1 -
Special Admin Assistant II 1 - - - - -
Sr Electronic Technician 6 - 5 - 5 -
Street Maintenance Supvr 6 - 6 - 6 -
Superintendent - - - - 1 -
Warehouseman/Journeyman 1 - 1 - 1 -
Positions as Budgeted Total 158 14 157 14 154 14
Public WorksDivision Summary
(Dept ID # 1610, 1634, 1657, 1658, 7410, 7430, 7470, 7472, 7671, 7740)
Maintenance & Operations
2012 Approved General Government Operating Budget
21 - 10

Net Cost
Manageable Direct Cost 39,760,552 41,767,187 40,517,349 <2.99%>
Debt Service, Depreciation 28,501,671 39,641,017 44,892,379 13.25%
Charges By Other Departments 6,003,876 5,644,829 5,380,228 <4.69%>
Charges to Other Departments (17,178,051) (18,232,271) (18,936,315) 3.86%
Program Generated Revenue (1,568,997) (1,733,525) (1,404,307) <18.99%>
Net Cost Total 55,519,051 67,087,237 70,449,333 5.01%
Direct Cost by CategorySalaries and Benefits
1101 - Straight Time Labor 9,593,784 11,713,106 11,847,068 1.14%
1201 - Overtime 696,854 704,620 637,620 <9.51%>
1301 - Leave/Holiday Accruals 1,217,686 737,638 224,738 <69.53%>
1401 - Benefits 5,074,671 5,552,187 5,796,502 4.40%
1501 - Allow Differentials/Premiums 103,213 98,230 98,230 -
1601 - Vacancy Factor - (544,471) (544,471) -
Salaries and Benefits Total 16,686,208 18,261,311 18,059,687 <1.10%>
Supplies 3,104,493 3,854,477 3,656,066 <5.15%>
Travel - 14,810 4,810 <67.52%>
Contractual/Other Services 19,860,116 19,602,889 18,763,086 <4.28%>
Equipment, Furnishings 109,735 33,700 33,700 -
Manageable Direct Cost Total 39,760,552 41,767,187 40,517,349 <2.99%>
Debt Service, Depreciation 28,501,671 39,641,017 44,892,379 13.25%
Direct Cost Total 68,262,223 81,408,204 85,409,728 4.92%
Intra-Governmental ChargesCharges By Other Departments 6,003,876 5,644,829 5,380,228 <4.69%>
Charges to Other Departments (17,178,051) (18,232,271) (18,936,315) 3.86%
Program Generated Revenue9335 - Build America Bonds (BABs) Subsidy - 943,305 614,087 <34.90%>
9363 - SOA Traffic Signal Reimb 419,954 433,620 433,620 -
9499 - Reimbursed Cost 22,846 43,600 43,600 -
9522 - Recycle Rebate 5,838 - - -
9672 - Prior Yr Expense Recovery 29,367 - - -
9711 - Assessment Collections 601,916 160,000 160,000 -
9712 - P & I On Assessments 50,835 60,000 60,000 -
9722 - Premium On Bond Sales 345,043 - - -
9731 - Lease & Rental Revenue 93,000 93,000 93,000 -
9742 - Other Property Sales 13 - - -
9795 - Sale Of Contractor Specs 184 - - -
Program Generated Revenue Total 1,568,997 1,733,525 1,404,307 <18.99%>
Public WorksDivision Detail
(Dept ID # 1610, 1634, 1657, 1658, 7410, 7430, 7470, 7472, 7671, 7740)
Maintenance & Operations
2011Revised
2012Approved
2010Actuals
12 v 11% Chg
2012 Approved General Government Operating Budget
21 - 11

2010Actuals
2011Revised
2012Approved
12 v 11% Chg
Direct Cost by CategorySalaries and Benefits 486,928 499,252 599,686 20.12%
Supplies 232,048 248,140 248,140 -
Travel - - -
Contractual/Other Services 8,880,706 9,413,673 9,413,673 -
Equipment, Furnishings 5,043 6,000 6,000 -
Manageable Direct Cost Total 9,604,725 10,167,065 10,267,499 0.99%
Debt Service, Depreciation - - -
Direct Cost Total 9,604,725 10,167,065 10,267,499 0.99%
Revenue by FundFund 106 - Girdwood Valley SA 2,424 2,000 2,000 -
Fund 119 - ER/Chugiak/Birchwood Rr SA 56,867 17,060 17,060 -
Revenue Total 59,291 19,060 19,060 -
Positions as Budgeted2010 Revised 2011 Revised 2012 Approved
Full Time Part Time Full Time Part Time Full Time Part Time
General Foreman 1 - 1 - - -
Junior Accountant - - - - 1 -
Junior Admin Officer 1 - 1 - - -
New Girdwood - - - - 1 -
Office Associate - 1 - 1 - 1
Principal Admin Officer - - - - 1 -
Sr Admin Officer - - - - 1 -
Street Maintenance Supvr 1 - 1 - - -
Positions as Budgeted Total 3 1 3 1 4 1
Public WorksDivision Summary
(Dept ID # 7431, 7432, 7433, 7434, 7435, 7436, 7437, 7438, 7439, 7440, 7441, 7442, 7443,...)
Other Service Areas
2012 Approved General Government Operating Budget
21 - 12

Net Cost
Manageable Direct Cost 9,604,725 10,167,065 10,267,499 0.99%
Debt Service, Depreciation - - - -
Charges by Other Departments 620,323 428,171 421,165 <1.64%>
Charges To Other Departments (48,950) (48,950) (48,950) -
Program Generated Revenue (59,291) (19,060) (19,060) -
Net Cost Total 10,116,807 10,527,226 10,620,654 0.89%
Direct Cost by CategorySalaries and Benefits
1101 - Straight Time Labor 265,831 260,394 322,778 23.96%
1201 - Overtime 25,644 43,000 43,000 -
1301 - Leave/Holiday Accruals 42,653 17,420 6,622 <61.99%>
1401 - Benefits 152,658 153,578 202,426 31.81%
1501 - Allow Differentials/Premiums 142 24,860 24,860 -
Salaries and Benefits Total 486,928 499,252 599,686 20.12%
Supplies 232,048 248,140 248,140 -
Travel - - - -
Contractual/Other Services 8,880,706 9,413,673 9,413,673 -
Equipment, Furnishings 5,043 6,000 6,000 -
Manageable Direct Cost Total 9,604,725 10,167,065 10,267,499 0.99%
Debt Service, Depreciation - - - -
Direct Cost Total 9,604,725 10,167,065 10,267,499 0.99%
Intra-Governmental ChargesCharges by Other Departments 620,323 428,171 421,165 <1.64%>
Charges To Other Departments (48,950) (48,950) (48,950) -
Program Generated Revenue9499 - Reimbursed Cost 33,549 15,460 15,460 -
9672 - Prior Yr Expense Recovery 23,318 - - -
9731 - Lease & Rental Revenue 2,424 2,000 2,000 -
9798 - Miscellaneous Revenues - 1,600 1,600 -
Program Generated Revenue Total 59,291 19,060 19,060 -
Public WorksDivision Detail
(Dept ID # 7431, 7432, 7433, 7434, 7435, 7436, 7437, 7438, 7439, 7440, 7441, 7442, 7443,...)
Other Service Areas
2011Revised
2012Approved
2010Actuals
12 v 11% Chg
2012 Approved General Government Operating Budget
21 - 13

2010Actuals
2011Revised
2012Approved
12 v 11% Chg
Direct Cost by CategorySalaries and Benefits 1,233,036 1,826,925 2,104,972 15.22%
Supplies 2,673 10,180 10,180 -
Travel - - -
Contractual/Other Services 50,945 55,813 55,813 -
Equipment, Furnishings 1,957 - -
Manageable Direct Cost Total 1,288,611 1,892,918 2,170,965 14.69%
Debt Service, Depreciation - - -
Direct Cost Total 1,288,611 1,892,918 2,170,965 14.69%
Revenue by FundFund 101 - Areawide General 161 184,000 144,000 <21.74%>
Revenue Total 161 184,000 144,000 <21.74%>
Positions as Budgeted2010 Revised 2011 Revised 2012 Approved
Full Time Part Time Full Time Part Time Full Time Part Time
Accountant - - - - 1 -
Accounting Clerk III 1 - 1 - - -
Admin Officer - - - - 1 -
Administrative Officer 2 - 2 - - -
Civil Engineer III 1 - - - - -
Director of Public Works - - 1 - - -
Division Director I - - 1 - 1 -
Eng Technician III 1 - 1 - 1 -
Jr Accountant - - - - 1 -
Jr Admin Officer - - 1 - - -
Junior Accountant 1 - 1 - 3 -
Junior Admin Officer 2 - 3 - - -
Office Associate - - - - 2 -
Principal Accountant - - 1 - 1 -
Principal Admin Officer 1 - 1 - 1 -
Public Works Director - - - - 1 -
Public Works Superintendent - - 1 - - -
PW Superintendent 1 - - - - -
Senior Accountant - - - - 2 -
Senior Admin Officer 1 - 1 - 1 -
Senior Office Associate 1 - 1 - 1 -
Senior Staff Accountant 2 - - - - -
Superintendent - - - - 1 -
Positions as Budgeted Total 14 - 16 - 18 -
Public WorksDivision Summary
(Dept ID # 7221, 7325, 7652, 7661, 7210, 7222, 7326, 7331, 7429)
Public Works Administration
2012 Approved General Government Operating Budget
21 - 14

Net Cost
Manageable Direct Cost 1,288,611 1,892,918 2,170,965 14.69%
Debt Service, Depreciation - - - -
Charges By Other Departments 1,019,481 252,080 182,441 <27.63%>
Charges To Other Departments (2,137,793) (1,984,679) (2,220,179) 11.87%
Program Generated Revenue (161) (184,000) (144,000) <21.74%>
Net Cost Total 170,138 (23,681) (10,772) <54.51%>
Direct Cost by CategorySalaries and Benefits
1101 - Straight Time Labor 706,809 1,134,008 1,324,019 16.76%
1201 - Overtime 3,707 150 - -
1301 - Leave/Holiday Accruals 101,774 75,865 28,856 <61.96%>
1401 - Benefits 419,247 641,902 777,097 21.06%
1501 - Allow Differentials/Premiums 1,499 - - -
1601 - Vacancy Factor - (25,000) (25,000) -
Salaries and Benefits Total 1,233,036 1,826,925 2,104,972 15.22%
Supplies 2,673 10,180 10,180 -
Travel - - - -
Contractual/Other Services 50,945 55,813 55,813 -
Equipment, Furnishings 1,957 - - -
Manageable Direct Cost Total 1,288,611 1,892,918 2,170,965 14.69%
Debt Service, Depreciation - - - -
Direct Cost Total 1,288,611 1,892,918 2,170,965 14.69%
Intra-Governmental ChargesCharges By Other Departments 1,019,481 252,080 182,441 <27.63%>
Charges To Other Departments (2,137,793) (1,984,679) (2,220,179) 11.87%
Program Generated Revenue9492 - Service Fees-School Dist - 40,000 40,000 -
9499 - Reimbursed Cost - 104,000 104,000 -
9798 - Miscellaneous Revenues 161 40,000 - -
Program Generated Revenue Total 161 184,000 144,000 <21.74%>
Public WorksDivision Detail
(Dept ID # 7221, 7325, 7652, 7661, 7210, 7222, 7326, 7331, 7429)
Public Works Administration
2011Revised
2012Approved
2010Actuals
12 v 11% Chg
2012 Approved General Government Operating Budget
21 - 15

2010Actuals
2011Revised
2012Approved
12 v 11% Chg
Direct Cost by CategorySalaries and Benefits 3,709,112 3,770,876 3,591,974 <4.74%>
Supplies 491,155 498,880 525,980 5.43%
Travel 193 7,200 7,200 -
Contractual/Other Services 190,706 213,752 213,752 -
Equipment, Furnishings 57,591 25,080 25,080 -
Manageable Direct Cost Total 4,448,757 4,515,788 4,363,986 <3.36%>
Debt Service, Depreciation - - -
Direct Cost Total 4,448,757 4,515,788 4,363,986 <3.36%>
Revenue by FundFund 101 - Areawide General 1,402,799 1,397,500 1,397,500 -
Revenue Total 1,402,799 1,397,500 1,397,500 -
Positions as Budgeted2010 Revised 2011 Revised 2012 Approved
Full Time Part Time Full Time Part Time Full Time Part Time
Accountant 1 - 1 - - -
Associate Traffic Engineer 3 - 3 - 3 -
Asst Traffic Engineer II 2 - 2 - 2 -
Division Director II - - 1 - 1 -
Electronic Foreman 1 - 1 - 1 -
Electronic Tech Leadman 2 - 2 - 2 -
Eng Technician III 1 - 1 - - -
Engineering Technician I 1 - 1 - 1 -
Engineering Technician IV 3 - 3 - 3 -
Executive Assistant I 1 - - - - -
Paint & Sign Foreman 1 - 1 - 1 -
Paint & Sign Leadman 1 - 1 - 1 -
Paint & Sign Tech I - 4 - 4 - 4
Paint & Sign Tech II 2 - 2 - 2 -
Paint & Sign Tech III 2 - 2 - 2 -
Principal Admin Officer 1 - - - - -
Program & Policy Director 1 - - - - -
Sr Electronic Technician 6 - 5 - 5 -
Sr Office Associate - - - - 1 -
Technical Assistant 1 - 1 - 1 -
Traffic Engineer 1 - - - - -
Positions as Budgeted Total 31 4 27 4 26 4
Public WorksDivision Summary
(Dept ID # 7810, 7811, 7850, 7860, 7870, 7880, 7890)
Traffic
2012 Approved General Government Operating Budget
21 - 16

Net Cost
Manageable Direct Cost 4,448,757 4,515,788 4,363,986 <3.36%>
Debt Service, Depreciation - - - -
Charges by Other Departments 6,331,187 1,936,060 1,915,813 <1.05%>
Charges To Other Departments (6,053,621) (1,344,584) (1,248,956) <7.11%>
Program Generated Revenue (1,402,799) (1,397,500) (1,397,500) -
Net Cost Total 3,323,524 3,709,764 3,633,344 <2.06%>
Direct Cost by CategorySalaries and Benefits
1101 - Straight Time Labor 2,089,209 2,356,684 2,272,066 <3.59%>
1201 - Overtime 187,276 125,787 125,787 -
1301 - Leave/Holiday Accruals 259,212 154,115 66,877 <56.61%>
1401 - Benefits 1,146,797 1,212,371 1,205,325 <0.58%>
1501 - Allow Differentials/Premiums 26,618 43,068 43,068 -
1601 - Vacancy Factor - (121,148) (121,148) -
Salaries and Benefits Total 3,709,112 3,770,876 3,591,974 <4.74%>
Supplies 491,155 498,880 525,980 5.43%
Travel 193 7,200 7,200 -
Contractual/Other Services 190,706 213,752 213,752 -
Equipment, Furnishings 57,591 25,080 25,080 -
Manageable Direct Cost Total 4,448,757 4,515,788 4,363,986 <3.36%>
Debt Service, Depreciation - - - -
Direct Cost Total 4,448,757 4,515,788 4,363,986 <3.36%>
Intra-Governmental ChargesCharges by Other Departments 6,331,187 1,936,060 1,915,813 <1.05%>
Charges To Other Departments (6,053,621) (1,344,584) (1,248,956) <7.11%>
Program Generated Revenue9142 - Landscape Plan Review Pmt 18,718 25,000 25,000 -
9199 - Miscellaneous Permits 31,785 38,800 38,800 -
9363 - SOA Traffic Signal Reimb 1,262,200 1,262,200 1,262,200 -
9499 - Reimbursed Cost 77,683 70,000 70,000 -
9522 - Recycle Rebate 12,168 1,500 1,500 -
9672 - Prior Yr Expense Recovery 19 - - -
9742 - Other Property Sales 226 - - -
Program Generated Revenue Total 1,402,799 1,397,500 1,397,500 -
Public WorksDivision Detail
(Dept ID # 7810, 7811, 7850, 7860, 7870, 7880, 7890)
Traffic
2011Revised
2012Approved
2010Actuals
12 v 11% Chg
2012 Approved General Government Operating Budget
21 - 17

Amount Expected Expected
Award Expended Expenditures Balance at Grant
Grant Program Dept ID Amount As of 12/31/2011 in 2012 End of 2012 FT PT T Expiration
NPDES PERMIT REIMBURSEMENT 7271G 2,500,000 300,000 700,000 1,500,000 2 - - Dec-15
- Reimbursement from State of Alaska for Municipal efforts managed and performed as required by federal NPDES Permit
RAIN GARDEN PHASE III 27,000 27,000 - - - - - Dec-12- Reimbursement from U.S. Fish & Wildlife Service for continuation of the MOA Rain Garden Prg and development of other types of vegetated LID projects
FEDERAL HIGHWAY ADMINISTRATION/STATE PASS THRU - - - - - - -
(State Grant - Revenue Pass Thru)
- Provides funding to increase efficiencies with better/more updated signal timing plans to address intersection congestion and improving air quality. Includes improvements to the Traffic Control Center, and upgraded traffic signal software programs and signal controllers. (77214G Traffic Signalization 07-09) 77214G 1,307,353 1,134,343 - 173,010 * - - - Sep-11
- Provides funding to update signal timing plans to address intersection congestion and improve air quality. Supports development of a Traffic Management Center, emergency vehicle preemptionand transit priority. (77216G Traffic Signalization 10-12) 77216G 1,491,826 396,259 337,308 758,259 2 - - Nov-16
- Provides funding to the MOA to collect, analyze, and input information pertaining to pedestrian and vehicular volumes, crashes, and traffic studies. (77239G AMATS MOA Traffic Counts 09-11)
77239G 487,992 363,157 124,835 - - - - Dec-12
- Support the development of a Traffic Safety Database System. (77213G Traffic Safety Database) 77213G 1,387,642 1,385,453 - 2,189 * - - - Dec-11
- Project coordinated with the Anchorage Police Department, Community Councils, Anchorage School District (ASD), Hazardous Routes Committee, Parent Teacher Assoc., and others to assess the condition of all ASD student walking routes. Feasibility studies and preliminary engineering will also be conducted in areas identifiedas having safety concerns. Reflective sign post panels and signs will be installed at school zones and crossings. (77279G Safe Routes to School)
77279G 207,700 183,394 - 24,306 * - - - Dec-11
- Funding to apply Magnesium Chloride on Anchorage arterial roadways during peak dust periods to reduce airborne dust. (724611G AMATS Arterial Dust Control) 724611G 425,614 150,402 193,461 81,751 * - - - Dec-12
Total Grant Funding 3,940,009 1,355,604 2,539,515 4 - -
Total Direct Costs 108,308,007 240 21 -
Total Grant Funds and Direct Costs 109,663,611 244 21 -
* Expected balance will lapse at grant expiration.
Public WorksOperating Grant Funded Programs
Personnel
2012 Approved General Government Operating Budget
21 - 18

Anchorage: Performance. Value. Results
2012 Approved General Government Operating Budget
21 - 19

Design Section Engineering Division
Public Works Department Anchorage: Performance. Value. Results.
Mission
Design and prepare construction documents that produce safe, functional and cost-effective capital infrastructure projects, i.e., roads, drainage, parks and trail projects; and oversee development/maintenance of design criteria for municipal roads, trails, parks and drainage improvements within the Municipality.
Direct Services
• Design cost-effective infrastructure solutions. • Investigate and resolve property owner and public inquiries. • Maintain/update Municipality of Anchorage Standard Specifications (MASS). • Maintain/update Design Criteria Manual (DCM).
Accomplishment Goals
• Design capital improvement projects that are cost-effective, maintenance-friendly, and clearly communicate design intent to construction contractor within the schedule specified in the Capital Improvement Program.
• Investigate and respond to public inquiries within ten working days. Performance Measures
Progress in achieving goals shall be measured by:
2012 Approved General Government Operating Budget
21 - 20

Design Section Engineering Division
Public Works Department Anchorage: Performance. Value. Results.
Measure #1: 90% of project designs completed to meet Capital Improvement Program schedule
Engineering Division - Design Section90% of project designs completed to meet CIP schedule
1 0 0 1 1 2 3 0 0 0 0 01 0 0 0 1 1 3 0 0 0 0 00
1
2
3
4
5
6
Jan Feb* Mar* Apr May Jun Jul Aug* Sep* Oct* Nov DecMonth in 2011
No
of
De
sig
ns No. of
DesignsScheduled
DesignsCompletedon Time
100% 100%
50%
100%
* No projects scheduled to bid.* N j t h d l d t bid
Engineering Division - Design Section90% of project designs completed to meet CIP schedule
0 0 0 1 1 4 1 1 1 0 0 00 0 0 1 1 3 1 1 1 0 0 00
1
2
3
4
5
6
Jan Feb Mar Apr May Jun Jul Aug Sep Oct Nov Dec
Month in 2010
No
of
Des
ign
s
No. of Designs
Designs Completedon Time100% 100% 100%100%100%
75%
2012 Approved General Government Operating Budget
21 - 21

Design Section Engineering Division
Public Works Department Anchorage: Performance. Value. Results.
Measure #2: 75% of public inquires will be investigated and responded to within 72 hours.
Engineering Division - Design Section75% of public inquiries investigated and initial response within 72 hours
0 1 2 4 2 2 6 7 2 3 0 00 1 2 4 2 2 6 6 2 3 0 00
2
4
6
8
10
12
Jan* Feb Mar Apr May Jun Jul Aug Sept Oct Nov DecMonth in 2011
No
of
Pu
blic
Inq
uir
ies
No. of PublicInquiriesReceived
No. of PublicInquiriesResponded 100% 100%
100%
100%
100%
100%
86%
100%100%
* No public queries received.
Engineering Division - Design Section75% of public inquiries investigated and responded to within 72 hours
0 0 0 0 0 0 8 6 0 1 10 0 0 0 0 0 7 6 0 1 10
2
4
6
8
10
12
Jan Feb Mar Apr May Jun Jul Aug Sept Oct Nov
Month in 2010
No
of
Pu
blic
Inq
uir
ies
No. of PublicInquiries Received
No. of PublicInquiriesResponded
100%
100%100%
88%
2012 Approved General Government Operating Budget
21 - 22

Project Management Section Engineering Division
Public Works Department Anchorage: Performance. Value. Results.
Mission
Provide project management services aimed at delivering public capital improvement projects in a timely, cost-effective manner for residents, businesses and visitors within the Municipality who rely on public facilities for safe transportation and recreation.
Core Services
• Manage the specific planning and specific configuration of capital projects (i.e., roadways, drainage systems, parks, and trails).
• Manage the design of capital projects, to provide the greatest public benefit for the least private detriment.
• Manage the construction of those capital projects, to ensure the greatest cost-effectiveness with the least disruption to residents, businesses and the traveling public.
• Inform the public and listen to comments regarding the details of the above planning, design, and construction activities.
Accomplishment Goals
• The management of the planning, design, and construction of capital projects shall be accomplished in a cost-effective, timely, context-sensitive, and safe manner.
Performance Measures
Progress in achieving goals shall be measured by:
2012 Approved General Government Operating Budget
21 - 23

Project Management Section Engineering Division
Public Works Department Anchorage: Performance. Value. Results.
Measure #3: 90% of construction contracts substantially completed within contract time, including elective change orders
Engineering Division - Project Management Section 90% of construction contracts substantially completed within contract time,
excluding elective change orders
0 0 0 0 0 2 13
1 20 0 0 0 0 2 13
1 2
0
2
4
6
8
10
Janu
ary
February
March
April
May Jun Ju
lAug Sep Oct Nov Dec
Month in 2011
No
. of
Pro
jec
ts No. of Projects
No. Completedon Time100%
100%
100%100% 100%
Engineering Division - Project Management Section 90% of construction contracts substantially completed within contract time,
including elective change orders
7
16 15
22
37
0 06
1513
20
37
0 00
5
10
15
20
25
May Jun Jul Aug Sep Oct Nov Dec
Month in 2010
No
. of
Pro
jec
ts
No. of ProjectsNo. Completed on Time
91%
87%94%
86%100%
100%
91% Completed on Time
2012 Approved General Government Operating Budget
21 - 24

Project Management Section Engineering Division
Public Works Department Anchorage: Performance. Value. Results.
Measure #4: 75% of construction contract change orders less than 10% of the original contract prices, including elective change orders
Public Works Project Management & Engineering Capital ProjectsValues of Contracts and Change Orders
$3,972,446
$2,493,523
$-
$2,500,000
$5,000,000
$7,500,000
$10,000,000
2011 2010
Year
Dol
lar V
alue
Total OriginalContractsAmount
Total ChangeOrders Amount
2 of 22 (9%) of change orders
exceeded 10% of orignal contract
amount.
6 of 24 (25%) of change orders exceed 10% of orignal contract amount. Overall Public Works stands @ 3.3%
$115,843,997 $126,333,613
2012 Approved General Government Operating Budget
21 - 25

Geotechnical Services Section Engineering Division
Public Works Department Anchorage: Performance. Value. Results.
Mission
Assure all capital improvement projects meet established testing frequencies and that all appropriate test procedures are followed in an accurate and cost-effective manner.
Direct Services
• Provide geotechnical and environmental subsurface investigation, quality control/acceptance testing, and materials certification for municipal capital improvement projects
• New materials research. • Maintenance/operation of the Municipal Geotechnical Library.
Accomplishment Goals
• Quality control/acceptance testing will be conducted in a time-sensitive and cost-effective manner
Performance Measures
Using the quality control testing program for all Portland Cement Concrete used in our Capital Improvement Projects in a cost-effective manner. The use of quality control testing greatly increases the chances that the concrete used in our capital improvement projects will achieve the calculated design life, reducing maintenance costs. Progress in achieving goals shall be measured by:
2012 Approved General Government Operating Budget
21 - 26

Geotechnical Services Section Engineering Division
Public Works Department Anchorage: Performance. Value. Results.
Measure #5: 90 % of the requests for Portland Cement Concrete quality control testing responded to within three hours
Engineering
Geotechnical Services 90% of requests for quality control testing responded to within three hours
0 0 0 0 1 34 35 18 22 7 0 00 0 0 0 134 35
18 22 7 0 00
50
100
150
Jan Feb Mar Apr May Jun Jul Aug Sep Oct Nov Dec
Month in 2011
No
. o
f re
qu
ests
No. ofRequestsReceived
No.completedwithin threehours
100%100% 100%
100% 100%100%
Engineering
Geotechnical Services 90% of requests for quality control testing responded to within three hours
40 45 14 22 27148
393
6840 41 11 21 24137
393
680
100200300400500
Jan Feb Mar Apr May Jun Jul Aug Sep Oct Nov
Month in 2010
No
. o
f re
qu
ests
No. ofRequestsReceived
No.completedwithin threehours
95%
100%
93%
100% 91% 79% 89% 100%
2012 Approved General Government Operating Budget
21 - 27

Geotechnical Services Section Engineering Division
Public Works Department Anchorage: Performance. Value. Results.
Measure #6: 90% Percent of the Portland Cement Concrete quality control tests completed in two hours or less
Engineering
Geotechnical Services 90% of quality control tests completed within two hours or less
0 0 0 0 1
34 35
1822
9 0 00 0 0 0 1
34 35
1822
9 0 00
50
100
Jan Feb Mar Apr May Jun Jul Aug Sep Oct Nov Dec
Month in 2011
No
of
Te
sts
No. of Tests Requested
No. completed in two hours
100%
100% 100%
100% 100%
100%
Engineering
Geotechnical Services 90% of quality control tests completed within two hours or less
7 17 2556
105 105
187
525 15 22
53
95 95
187
52
0
50
100
150
200
250
May Jun Jul Aug Sep Oct Nov Dec
Month in 2010
No
of
Te
sts
No. of Tests Requested
No. completed in two hours
71% 88%
88%95%
90% 90%
100%
100%
2012 Approved General Government Operating Budget
21 - 28

Survey and ROW Section Engineering Division
Public Works Department Anchorage: Performance. Value. Results.
Mission
Provide professional land surveying and acquisition services to the Municipality in support of its Capital Improvement Program and its subdivision platting function.
Direct Services
• Review of subdivision plats for final approval by the Planning Division. • Provide survey data and mapping products to primarily support capital projects and other
Municipal agencies’ needs. Accomplishment Goals
• Provide land survey review for the Planning Division to meet their needs. • Provide surveys at a reasonable cost.
Performance Measures
Progress in achieving goals shall be measured by: Measure #7: 80% of plat submittals initially reviewed within ten working days
Engineering - Survey & ROW80% of plat submittals initially reviewed within ten working days
5
2
5
6
4
6
2
7 7
4
1
5
4
2
7
0
4
00
4
6 6
7
00
1
2
3
4
5
6
7
8
Jan Feb Mar Apr May Jun Jul Aug Sep Oct Nov Dec
Month in 2011
No
. of
Re
vie
ws
No. of Reviews
Reviews InitiatedWithin Ten Days
100%
100%
50%
80%
100%
100%
100%100%100%
100%
Prior year information not available
2012 Approved General Government Operating Budget
21 - 29

Survey and ROW Section Engineering Division
Public Works Department Anchorage: Performance. Value. Results.
Measure #8: Survey project costs not greater than 5% over the consultants’ proposed cost
Engineering: Survey & ROWSurvey project costs not greater than 5% over the consultant's proposed cost
0
10,000
20,000
30,000
40,000
50,000
60,000
1 2 3 4 5 6 7 8 9 10 11 12 13 14 15 16 17 18 19 20 21 22No. of Projects in 2011
Su
rvey
Co
st
Cost ProposalActual Costs
$000 NetSavings in 2011
Engineering Division - Survey & ROW SectionSurvey project costs not greater than 5% over the consultant's proposed cost
0
10,000
20,000
30,000
40,000
50,000
60,000
1 2 3 4 5 6 7 8 9 10 11 12 13 14 15 16 17 18 19 20 21
No. of Projects in 2010
Pro
ject
Co
st
Cost ProposalActual Costs
$39,800 NetSavings in 2010
Only one project was over 5% of consultant's proposed cost.
2012 Approved General Government Operating Budget
21 - 30

Watershed Management Section Engineering Division
Public Works Department Anchorage: Performance. Value. Results.
Mission Oversee the discharge of the municipal storm water system based on the federally mandated Alaska Pollution Discharge Elimination System (APDES) Permit which allows discharge from the municipal storm sewer system into waters of the U.S. Compliance with the APDES Permit is necessary to avoid penalties enforced by the Environmental Protection Agency in accordance with the Clean Water Act.
Direct Services
• Long-term negotiation and coordination of permit allowing the municipality to dispose of stormwater into waters of the U.S.
• Oversight of FEMA National Flood Insurance Program (NFIP) for Anchorage. Accomplishment Goals
• Ensure watershed management employees perform and are timely with permit plan reviews.
• Flood plain data is maintained as per regulatory (NFIP) requirements and accessible to public in timely manner.
• APDES inspections for commercial projects are performed within approved APDES permit requirements.
Performance Measures
Progress in achieving goals shall be measured by:
2012 Approved General Government Operating Budget
21 - 31

Prior year information not available.
Watershed Management Section Engineering Division
Public Works Department Anchorage: Performance. Value. Results.
Measure #9: 90 % of public project reviews performed within five days of Storm Water Pollution Prevention Plan (SWPPP) submittal.
Engineering Division - Watershed Management90% of public project reviews performed within five working days of SWPPP submittal
0 0 0 0
32 2
3
10 0 0 0
32 2
3
10
2
4
6
8
10
Jan Feb Mar Apr May Jun Jul Aug Sept Oct Nov Dec
Month in 2011
No
. o
f R
evie
ws
No. of Reviews
No. Completedwithin five days
100%
100%
100%
100%
100%
0%
Measure #10: 95 % of floodplain data requests addressed within four working days
Engineering Division - Watershed Management95% of floodplain data requests addressed within four working days
102
3242 46 42
33
0 0 0
96
3241 45 42
33
0 0 0
58
3249
58
3249
0
20
40
60
80
100
120
Jan Feb Mar Apr May Jun Jul Aug Sept Oct Nov DecMonth in 2011
No
. of
Re
qu
es
ts
No. of Requests
No. Completedwithin four days
100%
98%100%
94%
100%100% 98% 100%
100%
2012 Approved General Government Operating Budget
21 - 32

Prior year information not available.
Watershed Management Section Engineering Division
Public Works Department Anchorage: Performance. Value. Results.
Measure #11: 90 % of commercial APDES inspections performed within ten days
Engineering Division - Watershed Management90% of commercial inspections performed within ten working days
8
2 0 0
14
34
2022
27
37
8
2 0 0
14
34
2022
27
37
0
5
10
15
20
25
30
35
40
Jan Feb Mar Apr May Jun Jul Aug Sept Oct Nov Dec
Month in 2011
No
. o
f In
spec
tio
ns
No. of Inspections
No. Completedwithin ten days
100%
100%
100%
100%
100%100%
100%
100%
Explanatory Note: Municipal compliance with the permit is the responsibility of many different departments and individuals. Success depends on each department understanding their responsibilities and their role in overall success. Communication is the key to this success and Watershed Management Service’s performance in successful communication shall be demonstrated through both written and verbal means with each participating department.
2012 Approved General Government Operating Budget
21 - 33

Maintenance and Operations Division Public Works Department
Anchorage: Performance. Value. Results. Purpose
Protect, maintain, and improve Municipal roads and drainage systems through organized efforts and effective use of resources.
Core Services
• Snow and ice removal • Pothole repair • Storm drain structure maintenance
Accomplishment Goals
• Complete declared plow-outs within 72 hours of a snowfall four inches or more within Anchorage Roads and Drainage Service Area (ARDSA)
• Repair reported potholes within 24 hours within ARDSA • Annually inspect and clean “as required” all storm drain structures per Alaska
Pollution Discharge Elimination System (APDES) Phase II permit within ARDSA Performance Measures
Progress in achieving goals shall be measured by: • Complete declared plow-outs within 72 hours within ARDSA • Repair reported potholes within 24 hours within ARDSA • Year-to-date percentage of storm drain structures inspected and cleaned as required
within ARDSA.
Tracking information for these measures began January 1, 2010 Explanatory Information
2012 Approved General Government Operating Budget
21 - 34

Maintenance and Operations Division Public Works Department
Anchorage: Performance. Value. Results. Measure #1: Complete declared plow-outs within 72 hours within ARDSA
Street Maintenance Division2010/2011 Plow Out Information
6871
51
72
81
64 65
71
59
0102030405060708090
Jan 15th,2010
Feb 6th,2010
Feb 27th,2010
Mar 10th,2010
Nov 8th,2010
Nov 26th,2010
Dec 21st,2010
Feb 1st,2011
Feb 18th,2011
Dates of Declared Plow Outs
Ho
urs
Completed Plow Outs To Date
Performance Measure: Complete Declared Plow-Outs in less than 72 Hours
2012 Approved General Government Operating Budget
21 - 35

Maintenance and Operations Division Public Works Department
Anchorage: Performance. Value. Results. Measure #2: Repair reported potholes within 24 hours within ARDSA
Street Maintenance2010 and 2011 Pothole Repair Performance Measure
Measure: Percentage Reported Potholes Repaired Within 24 Hours
0%
20%
40%
60%
80%
100%
120%
Jan Feb Mar Apr May Jun Jul Aug Sep Oct Nov DecMonth
Pe
rce
nta
ge
Re
pa
ire
d
2010 PercentageReportedPotholesRepaired Within24 Hours
2011 PercentageReportedPotholesRepaired Within24 Hours
Goal = 80%
8
2
315
127117
87
325
233
134181
127436
20438
5
3
34
119
136
209
190
2012 Approved General Government Operating Budget
21 - 36

Maintenance and Operations Division Public Works Department
Anchorage: Performance. Value. Results. Measure #3: Year-to-date percentage of storm drain structures inspected and cleaned as required within ARDSA.
Street Maintenance Division Annual Storm Drain Inspections - 2011
0%
10%
20%
30%
40%
50%
60%
70%
80%
90%
100%
Jan Feb Mar Apr May Jun Jul Aug Sep Oct Nov DecMonth Inspected
Per
cen
tag
e o
f S
torm
Str
uct
ure
s % Inspected
Performance Measure: Inspect 100% of Storm Structures in ARDSA in 2011
Goal = 100%
1,572
2,289
3,821
861
290
1
Street Maintenance Division Annual Storm Drain Cleaning - 2011
0%
10%
20%
30%
40%
50%
60%
70%
80%
90%
100%
Jan Feb Mar Apr May Jun Jul Aug Sep Oct Nov DecMonth Cleaned
Per
cent
age
of S
torm
Str
uctu
res % Cleaned
Performance Measure: Clean 100% of Storm Structures in ARDSA identified as needing cleaning, based on Annual Storm Drain Inspections for 2011
Goal = 100%
625
635
807
42
2012 Approved General Government Operating Budget
21 - 37

Communications Section Maintenance and Operations Division
Public Works Department Anchorage: Performance. Value. Results.
Purpose
Operate and maintain emergency and general voice and data wireless systems for all Municipal general government agencies with a priority on first responders and 911 Dispatch Centers.
Direct Services
• Install, maintain, and repair wireless communication systems to maximize responder safety and efficient use of personnel and resources
• Provide technical expertise in the procurement and inventory management of electronic equipment to ensure compatibility and asset accountability
• Provide design and project management for communications system upgrades and acquisitions
• Maintain oversight of Federal Communications Commission (FCC)-related licensing to ensure compliance of federal rules and regulations
• Install, maintain, and repair biomedical equipment as used by Police and Fire responders to ensure functionality and reliability of life saving devices
• Install & maintain WiFi hot spot equipment within most municipal buildings Accomplishment Goals
• Minimize downtime of Fire, Police and General Government personnel • 100% of Fire & Medic apparatus have working, certified electronic defibrillators • Support the efficient, safe operations of emergency services by providing expeditious
maintenance of public safety radio equipment • 98% of police-assigned automatic electronic defibrillators are certified and operable on
any given day
Performance Measures Progress in achieving goals shall be measured by:
• % of on-duty Police/Fire equipment failures repaired or exchanged and returned to service within one hour, M/F 8 to 5
• % of scheduled preventative maintenance performed to manufacturer’s specification on Electronic defibrillators
• % of unscheduled repairs to Public Safety core service equipment/systems completed and returned to service within two hours, seven days a week, 24 hours a day
• Tracking information for these measures began January 1, 2011. Explanatory Information
2012 Approved General Government Operating Budget
21 - 38

Communications Section Maintenance and Operations Division
Public Works Department Anchorage: Performance. Value. Results.
Measure #4: Percent of on-duty Police/Fire equipment failures repaired or exchanged and returned to service within one hour, M/F 8 to 5
0%
10%
20%
30%
40%
50%
60%
70%
80%
90%
100%
Jan Feb Mar Apr May Jun Jul Aug Sept Oct Nov Dec
Month
% o
f o
n-d
uty
Po
lice
/Fir
e eq
uip
men
t fa
ilu
res
rep
aire
d o
r ex
chan
ged
an
d r
etu
rned
to
ser
vice
wit
hin
on
e h
ou
r, M
/F,
8-5
265 201 190 199 179 200 165 185 281 165
% of on-duty Police/Fire equipment failures repaired or exchanged and returned to service within one hour, M/F 8 to 5
Goal = 90%
Integrated 263 new radios for APD while short staffed due to vacancy
Prior year information not available.
2012 Approved General Government Operating Budget
21 - 39
Communications Section Maintenance and Operations Division
Public Works Department Anchorage: Performance. Value. Results.
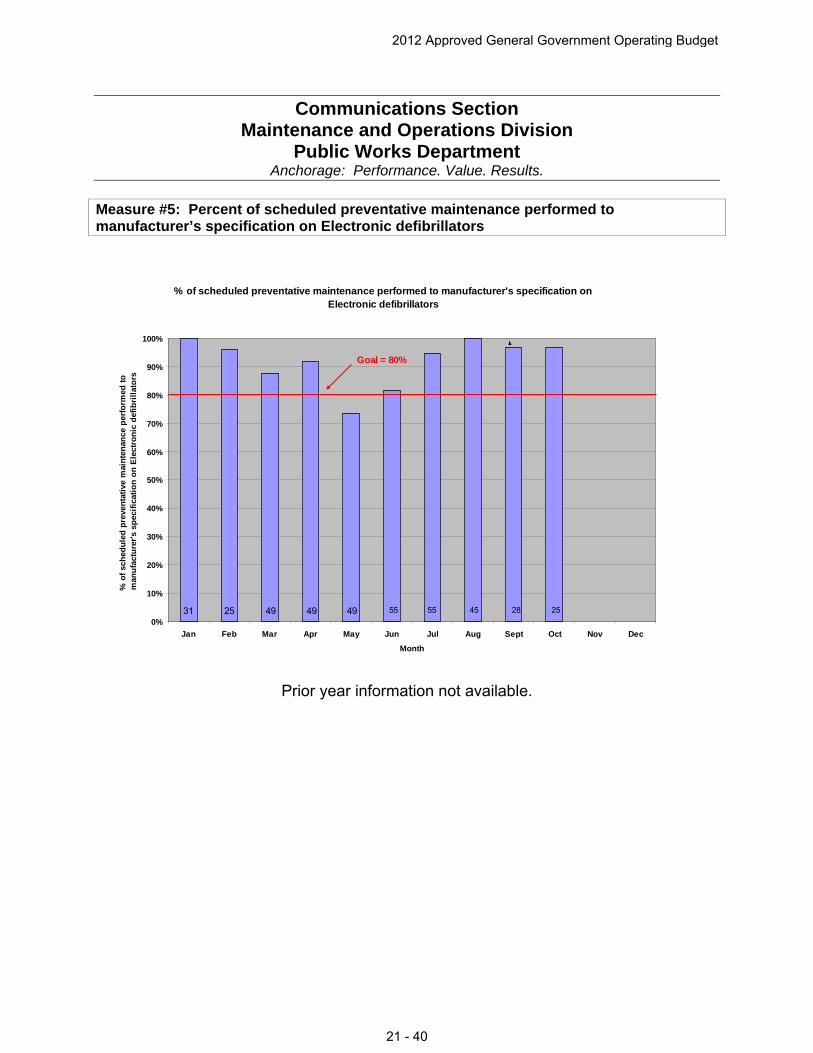
Measure #5: Percent of scheduled preventative maintenance performed to manufacturer’s specification on Electronic defibrillators
% of scheduled preventative maintenance performed to manufacturer's specification on Electronic defibrillators
0%
10%
20%
30%
40%
50%
60%
70%
80%
90%
100%
Jan Feb Mar Apr May Jun Jul Aug Sept Oct Nov Dec
Month
% o
f sc
hed
ule
d p
reve
nta
tive
mai
nte
nan
ce p
erfo
rmed
to
m
anu
fact
ure
r's
spec
ific
atio
n o
n E
lect
ron
ic d
efib
rill
ato
rs
28 25
Goal = 80%
31 25 49 49 49 55 55 45
Prior year information not available.
2012 Approved General Government Operating Budget
21 - 40

Communications Section Maintenance and Operations Division
Public Works Department Anchorage: Performance. Value. Results.
Measure #6: Percent of unscheduled repairs to Public Safety core service equipment/systems completed and returned to service within two hours, seven days a week, 24 hours a day
% of unscheduled repairs to Public Safety core service equipment/systems completed and returned to service within 2hrs, 7 days a week, 24hrs/day
0%
10%
20%
30%
40%
50%
60%
70%
80%
90%
100%
Jan Feb Mar Apr May Jun Jul Aug Sept Oct Nov Dec
Month
% o
f u
nsc
hed
ule
d r
epai
rs t
o P
ub
lic
Saf
ety
core
ser
vice
eq
uip
men
t/sy
stem
s co
mp
lete
d a
nd
ret
urn
ed t
o s
ervi
ce w
ith
in
2hrs
, 7
day
s a
wee
k, 2
4hrs
a d
ay
63 55 34 29 30 29 27 33 28 25
Goal = 99%
Prior year information not available.
2012 Approved General Government Operating Budget
21 - 41

Fleet Maintenance Section Maintenance and Operations Division
Public Works Department Anchorage: Performance. Value. Results.
Purpose
Preserve, maintain, and manage Municipal general government vehicles and equipment. Core Services
• Year-round maintenance of Municipal general government vehicles and equipment Accomplishment Goals
• Improve overall vehicle in-commission rate for all customers • Reduce fleet vehicle maintenance costs while providing safe, operable vehicles
Performance Measures Progress in achieving goals shall be measured by:
• Percent of police cruisers, general government, and heavy equipment vehicles in commission
• Percent of vehicles beyond depreciated life still in use for police cruisers, general government, and heavy equipment
• % of unscheduled repairs to Public Safety core service equipment/systems completed and returned to service within two hours, seven days a week, 24 hours a day
• Tracking information for these measures began January 1, 2010. Explanatory Information
2012 Approved General Government Operating Budget
21 - 42

Fleet Maintenance Section Maintenance and Operations Division
Public Works Department Anchorage: Performance. Value. Results.
Measure #7: Percent of police cruisers, general government, and heavy equipment vehicles in commission
80%
85%
90%
95%
100%
Jan Feb Mar Apr May Jun Jul Aug Sep Oct Nov Dec
APD Patrol Cars
2011
2010
Fleet Size: 455 454 463 463 462 460 461 463 464 471
80%
85%
90%
95%
100%
Jan Feb Mar Apr May Jun Jul Aug Sep Oct Nov Dec
General Government
2011
2010
Fleet 229 226 228 227 228 234 234 229 226 228
80%
85%
90%
95%
100%
Jan Feb Mar Apr May Jun Jul Aug Sep Oct Nov Dec
Heavy Equipment
2011
2010
Fleet Si
348 348 348 349 341 337 337 335 335 338
2012 Approved General Government Operating Budget
21 - 43

Fleet Maintenance Section Maintenance and Operations Division
Public Works Department Anchorage: Performance. Value. Results.
Measure #8: Percent of vehicles beyond depreciated life still in use for police cruisers, general government, and heavy equipment
Fleet Depreciation Rate(100% Depreciated)
0.0%
10.0%
20.0%
30.0%
40.0%
50.0%
APD Patrol GeneralPurpose
HeavyEquipment
2011 2010
Goal = 25%
2012 Approved General Government Operating Budget
21 - 44

Facility Maintenance Section Maintenance and Operations Division
Public Works Department Anchorage: Performance. Value. Results.
Purpose
Preserve, maintain, and improve Municipal facilities Core Services
• Maintenance of Municipal general government facilities Accomplishment Goals
• Improve response times to prioritized work order requests Performance Measures Progress in achieving goals shall be measured by:
• Percent of Priority 1 (emergency) work orders completed within 24 hours • Percent of Priority 2 (urgent) work orders completed within seven days • Percent of Priority 3 (priority) work orders completed within one month
• Tracking information for these measures began June 1, 2010. Explanatory Information
2012 Approved General Government Operating Budget
21 - 45

Facility Maintenance Section Maintenance and Operations Division
Public Works Department Anchorage: Performance. Value. Results.
Measure #9: Percent of Priority 1 (emergency) work orders completed within 24 hours
2011 - Priority One Work Orders
50%
60%
70%
80%
90%
100%
Jan
Feb Mar Apr May Jun Ju
lAug Sep Oct Nov Dec
Month
Pe
rce
nta
ge
% CompletedWithin Goal of24 Hours
7 6 9 6 8
Goal = 95%
6 9 8 6 6
2010 - Priority One Work Orders
50%
60%
70%
80%
90%
100%
Jan Feb Mar Apr May Jun Jul Aug Sep Oct Nov Dec
Month
Pe
rce
nta
ge
% CompletedWithin Goal of24 Hours
6
0
2 62
Goal = 95%
9
5
Data tracking initiated June 2010
2012 Approved General Government Operating Budget
21 - 46

Facility Maintenance Section Maintenance and Operations Division
Public Works Department Anchorage: Performance. Value. Results.
Measure #10: Percent of Priority 2 (urgent) work orders completed within seven days
2011 - Priority Two Work Orders
50%
60%
70%
80%
90%
100%
Jan
Feb Mar AprMay Ju
n Jul
Aug Sep Oct NovDec
Month
Nu
mb
er
of
Wo
rk O
rde
rs
% CompletedWithin Goal of 7Days
21 Goal = 90%25
32
22 33 27
75
33 26
31
2010 - Priority Two Work Orders
50%
60%
70%
80%
90%
100%
Jan
Feb Mar AprMay Ju
n Jul
Aug Sep Oct NovDec
Month
Nu
mb
er
of
Wo
rk O
rde
rs
% CompletedWithin Goal of 7Days
19
Goal = 90%
24
31
27 20 27
26
Data tracking initiated June 2010
2012 Approved General Government Operating Budget
21 - 47
Facility Maintenance Section Maintenance and Operations Division
Public Works Department Anchorage: Performance. Value. Results.
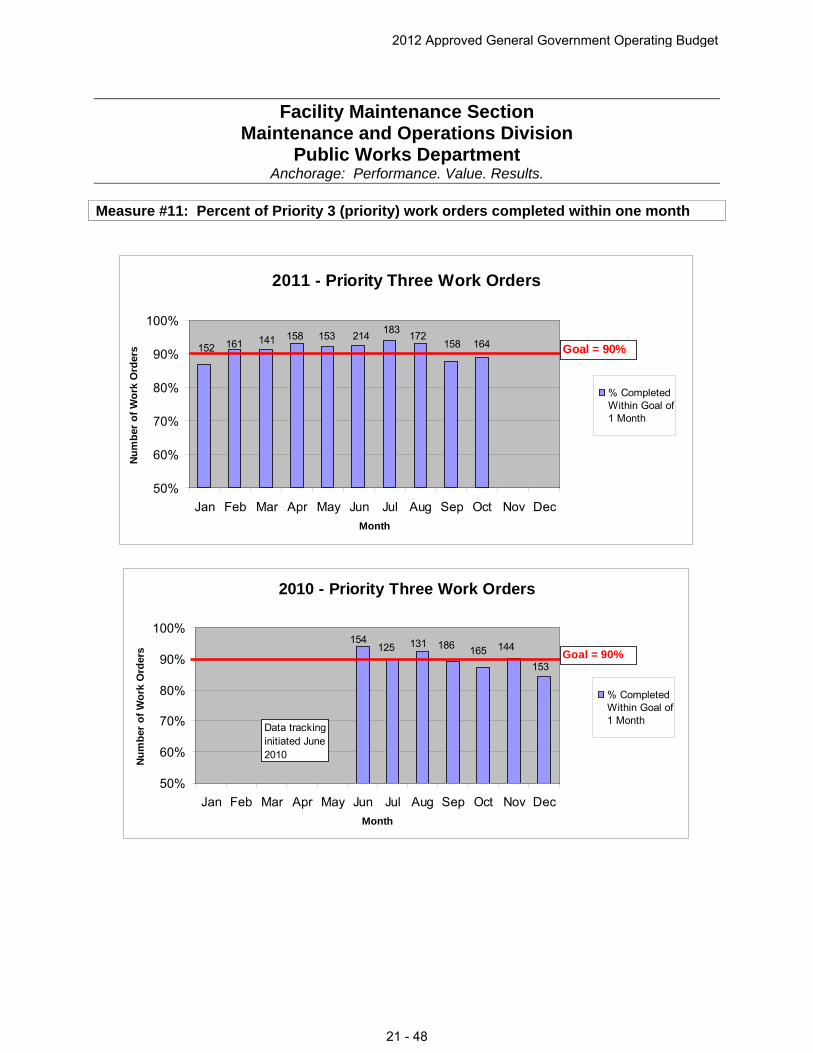
Measure #11: Percent of Priority 3 (priority) work orders completed within one month
2011 - Priority Three Work Orders
50%
60%
70%
80%
90%
100%
Jan Feb Mar Apr May Jun Jul Aug Sep Oct Nov DecMonth
Nu
mb
er o
f W
ork
Ord
ers
% CompletedWithin Goal of1 Month
152 161 141 158Goal = 90%
153 214 183 172158 164
2010 - Priority Three Work Orders
50%
60%
70%
80%
90%
100%
Jan Feb Mar Apr May Jun Jul Aug Sep Oct Nov DecMonth
Nu
mb
er o
f W
ork
Ord
ers
% CompletedWithin Goal of1 Month
125 131 186 165 Goal = 90%144
153
154
Data tracking initiated June 2010
2012 Approved General Government Operating Budget
21 - 48

Capital Projects Section Maintenance and Operations Division
Public Works Department Anchorage: Performance. Value. Results.
Purpose
Manage, design, and construct Municipal facility renovations and new construction projects that meet the needs of requesting departments within the available funding.
Core Services
• Project management of Municipal facility renovation and upgrade projects • Project management of new construction of Municipal facilities
Accomplishment Goals
• Reduce capital projects construction contracts with change orders Performance Measures
Progress in achieving goals shall be measured by: • Dollar values of construction contracts with change orders and Dollar values of
change order costs compared to original contract cost
• Tracking information for these measures began January 1, 2010. Explanatory Information
Measure #12: Dollar values of construction contracts with change orders, and Dollar values of change order costs compared to original contract cost
Facility Capital ProjectsValues for Contracts With Change Orders
$701,708
$31,753,639$30,731,535
$1,589,027
$-
$4,000,000
$8,000,000
$12,000,000
$16,000,000
$20,000,000
$24,000,000
$28,000,000
$32,000,000
2011 2010
Year
Dolla
r Val
ue
Total OriginalContracts Amount
Total ChangeOrders Amount
4 of 37 contracts (11%) with change orders exceeded 10% of orignal contract
amount
3 of 15 contracts (20%) with change orders exceed 10% year to date
2.3% of original contract amount
5.0% of original contract amount
2012 Approved General Government Operating Budget
21 - 49

Capital Projects Section Maintenance and Operations Division
Public Works Department Anchorage: Performance. Value. Results.
2011 Facility Capital Projects Contracts with Change Orders
$-
$200,000
$400,000
$600,000
$800,000
$1,000,000
$1,200,000
$1,400,000
$1,600,000
$1,800,000
$2,000,000
1 2 3 4 5 6 7 8 9 10 11
No. of Contracts
Am
ou
nt Original
Contract AmountChange Order Total
Of 15 total construction contracts; 11 have a change order (73%).
$14.7MFire Training Center Project (CO = 1.5%)
Elective change order to expand alarm system to other facilities (46.7%)
$5.9M
Sullivan Arena parking lot lights elective CO to repair additional lighting around facility (CO = 14.8%)
2010 Facility Capital Projects Contracts with Change Orders
$-
$200,000
$400,000
$600,000
$800,000
$1,000,000
$1,200,000
$1,400,000
$1,600,000
$1,800,000
$2,000,000
1 2 3 4 5 6 7 8 9 10 11 12 13 14 15 16
No. of Contracts
Am
ou
nt Original
Contract AmountChange Order Total
Of 37 total construction contracts; 16 have a change order (43%).
$2.9M $14.7M $3.15M
Mtn. View LibraryC/O added roadlandscaping (21%)
Transit Admin. Roof replacement uncovered addtl. Problems (22%)
2012 Approved General Government Operating Budget
21 - 50

Administration Division Public Works Department
Anchorage: Performance. Value. Results. Mission
Provide administrative, budgetary, fiscal, and personnel support to ensure departmental compliance with Municipal policies and procedures, codes, guidelines, and financial regulations.
Core Services
• Process accounts payable. • Process department payroll. • Submit Assembly documents.
Accomplishment Goals
• Develop Strategic Plan to establish department goals and objectives to increase efficiencies and productivity.
• Reduce payroll adjustments to correct time reporting errors. • Reduce accounts payable transactions requiring payment of late fees.
Performance Measures Progress in achieving goals shall be measured by:
• Strategic Plan completed by July 2013. • Annual cost payroll processing cost per employee. • Percent of accounts payable transactions paid by due date.
• Prior year data for the following measures is unavailable. Tracking information for these measures will begin July 1, 2010.
Explanatory Information
Measure #1: Strategic plan completed by July 2013.
Strategic Plan DevelopmentJuly 2010 thru June 2013
0%
10%
20%
30%
40%
50%
60%
70%
80%
90%
100%
1 2 3 4 5 6 7 8 9 10 11 12 13 14 15 16 17 18 19 20 21 22 23 24 25 26 27 28 29 30 31 32 33 34 35 36
Months (Beginning July-10)
Per
cen
t C
om
ple
te
ProjectedActual
2012 Approved General Government Operating Budget
21 - 51

Administration Division Public Works Department
Anchorage: Performance. Value. Results. Measure #2: Annual payroll processing cost per employee.
Annual Payroll Cost Per EmployeeGoal = Reduce Cost $1 from Prior Year
$738.28
$737.84
$735.00
$735.50
$736.00
$736.50
$737.00
$737.50
$738.00
$738.50
$739.00
$739.50
$740.00
2010 2011
Year
Pay
rol C
ost
Goal = $737.28
2012 Approved General Government Operating Budget
21 - 52

Administration Division Public Works Department
Anchorage: Performance. Value. Results. Measure #3: Percent of accounts payable vouchers paid by due date.
Accounts Payable Vouchers Paid Within 30 Days of Receipt
50%
55%
60%
65%
70%
75%
80%
85%
90%
95%
100%
Jan-1
0
Feb-10
Mar-10
Apr-10
May-10
Jun-1
0Ju
l-10
Aug-10
Sep-10
Oct-10
Nov-1
0
Dec-1
0
Jan-1
1
Feb-11
Mar-11
Apr-11
May-11
Jun-1
1Ju
l-11
Aug-11
Sep-11
Oct-11
Nov-1
1
Dec-1
1
Month - Year
Pe
rce
nta
ge
% On-Time
Goal = 90%
404
190 273
240
339 380
423
252 342
330
294 449
320
520
397435
434
461
553 648462
399
2012 Approved General Government Operating Budget
21 - 53

Traffic Division Public Works Department
Anchorage: Performance. Value. Results. Mission
Promote safe and efficient area-wide transportation that meets the needs of the community and the Anchorage Municipal Traffic Code requirements.
Direct Services
• Design, operate and maintain the Anchorage Traffic Signal System. • Design and maintain the Anchorage traffic control devices (signage/markings). • Provide the necessary transportation data to support the core services. • Provide traffic safety improvements in accordance with identified traffic safety issues. • Provide traffic impact review of development plans and building permits.
Accomplishment Goals
• Continuous improvement in the safe and efficient movement of people and goods • Timely investigation and response to community traffic inquiries. • Traffic operation improvements that maximize transportation safety and system
efficiency. Performance Measures
Progress in achieving goals shall be measured by: • % of failed detector warnings repaired within one business. • % of damaged stop Signs repaired/replaced within 2 hours of notification • % of community inquiries investigated and responded to within five working days
• Tracking information for these measures began January 1, 2011. Explanatory Information
2012 Approved General Government Operating Budget
21 - 54
Traffic Division Public Works Department
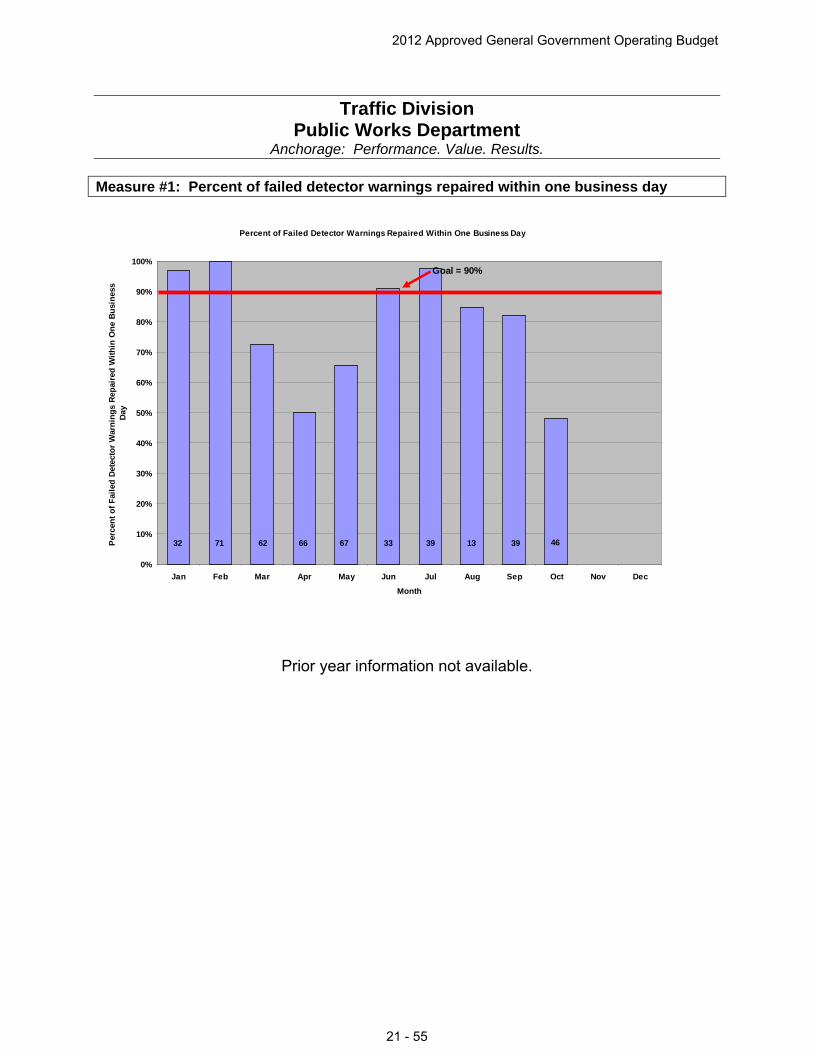
Anchorage: Performance. Value. Results. Measure #1: Percent of failed detector warnings repaired within one business day
Percent of Failed Detector Warnings Repaired Within One Business Day
0%
10%
20%
30%
40%
50%
60%
70%
80%
90%
100%
Jan Feb Mar Apr May Jun Jul Aug Sep Oct Nov Dec
Month
Per
cen
t o
f F
aile
d D
etec
tor
War
nin
gs
Rep
aire
d W
ith
in O
ne
Bu
sin
ess
Day
Goal = 90%
32 71 62 66 67 33 1339 39 46
Prior year information not available.
2012 Approved General Government Operating Budget
21 - 55

Traffic Division Public Works Department
Anchorage: Performance. Value. Results. Measure #2: Percent of damaged stop Signs repaired/replaced within 2 hours of notification
Percent of Damaged Stop Signs Repaired/Replaced Within 2 Hours of Notification
0%
10%
20%
30%
40%
50%
60%
70%
80%
90%
100%
Jan Feb Mar Apr May Jun Jul Aug Sep Oct Nov Dec
Month
Per
cen
t o
f D
amag
ed S
top
Sig
ns
Rep
aire
d/R
epla
ced
W
ith
in 2
Ho
urs
of
No
tifi
cati
on
Replacement Goal = 100%
6257 64 43 71 21 38 70 138 113 83
Prior year information not available.
2012 Approved General Government Operating Budget
21 - 56

Traffic Division Public Works Department
Anchorage: Performance. Value. Results. Measure #3: Percent of community inquiries investigated and responded to within 72 hours
Percent of Community Inquiries Responded to Within 72 Hours
0%
10%
20%
30%
40%
50%
60%
70%
80%
90%
100%
Jan Feb Mar Apr May Jun Jul Aug Sept Oct Nov Dec
Month
Per
cen
t o
f C
om
mu
nit
y In
qu
irie
s R
esp
on
ded
to
Wit
hin
72
Ho
urs
Goal = 90%
20 15 12 11 15 8 10 12 15 10
Prior year information not available.
2012 Approved General Government Operating Budget
21 - 57

PVR Measure WC: Managing Workers' Compensation Claims
Reducing job-related injuries is a priority for the Administration by ensuring safe work conditions and safe practices. By instilling safe work practices we ensure not only the safety of our employees but reduce the potential for injuries and property damage to the public. The Municipality is self-insured and every injury poses a financial burden on the public and the injured worker's family. It just makes good sense to WORK SAFE.
Results are tracked by monitoring monthly reports issued by the Risk Management Division.
Workers' Compensation Claims
Public Works
0
20000
40000
60000
80000
100000
120000
140000
160000
As of 7/31/2010 As of 7/31/2011 As of 9/30/2011
No Claims
2012 Approved General Government Operating Budget
21 - 58