pump station rehabilitation project business case id: c06 ... & c07 - ps 13 & 14...
TRANSCRIPT

Pump Station 13 & 14 Rehabilitation Project Business Case ID: C06 & C07
4/14/17
Page 1 of 10
Pump Station 13 Rehabilitation Pump Station 14 Rehabilitation
Pump Station 13
Project Purpose: To ensure that each pump station has adequate firm pumping capacity for the next fifty years and that each station operates effectively, efficiently, and reliably. Project Proposer/Champion: Proposer: Todd Gebert Project Co‐Champions: Mike Simon, Bruce Borelli, Dave Lundey, and John Bembinster Project Involvement: The Engineering Department will provide overall management of the project. The Mechanical and Electrical Maintenance Departments will be involved in the design and construction phases of the project to provide input into the design and to ensure that

Pump Station 13 & 14 Rehabilitation Project Business Case ID: C06 & C07
4/14/17
Page 2 of 10
the stations operate without interruption during construction. A consultant will be retained to provide design and construction services. Project History and Status: Pump Station 13 and Pump Station 14 are located along the Northeast Interceptor (Waunakee/DeForest Extension) which serves the northerly portions of the collection system, including the north side of the City of Madison and the villages of Waunakee and DeForest. Pump Station 13, located at 3634 Amelia Earhart Drive in the City of Madison, was placed into service in 1970. Pump Station 14, located at 5000 School Road in the City of Madison, was placed into service in 1971 and pumps its flows to Pump Station 13. The District’s Collection System Facilities Plan Update (2011) rated Pump Station 13 and Pump Station 14 as the fourth and sixth highest priorities, respectively, for condition needs among the District’s 17 stations. Given their similar age, proximity, and condition, the rehabilitation of these stations is being considered as a single project, although the projects may be separated at a later date for funding or other reasons. Capacity Upgrades Both stations contain three horizontal pumping units in a dry well/wet well configuration Both stations have adequate space for the addition of a fourth pump via existing connections to the wet well and discharge force main. The pumps at each station consist of two medium sized pumps to handle average daily flows (Pumps A and B) and one large pump for wet weather events (Pump C). Firm capacity is provided by either of the following pump combinations: (1). Pump C pumping alone; or (2). Pumps A and B pumping in parallel. Firm capacity upgrade projects were completed at each station in 2008. The goal of these projects was to ensure that each of the pump stations was able to meet firm capacity requirements for a short‐term period (approximately ten years). The upgrades consisted of replacing the small pump at each station with a slightly bigger unit. Rehabilitation of other pumps was also completed as part of the projects. Long‐term firm capacity upgrades were not a goal of the 2008 projects as it was understood that major electrical refurbishment at each station would be needed in approximately ten years and that any further capacity upgrades would be implemented at that time. A summary of existing flowrates and anticipated flowrates at each station is summarized in Table 1. Peak hourly flows for the year 2030 were prepared by CARPC in their MMSD Collection System Evaluation (2009). CARPC’s analysis of future flows assumed two rates of population growth: (1). Normal growth rate based on Traffic Analysis Zone (TAZ) data; and (2). High growth rate with an Uncertainty Factor (UF) applied to the TAZ

Pump Station 13 & 14 Rehabilitation Project Business Case ID: C06 & C07
4/14/17
Page 3 of 10
data. As seen in Table 1 the ratio of firm capacity to peak hourly flowrate, or adequacy ratio, varies significantly between the two population models.
Table 1 – Pump Station 13 and 14 Capacities and Projected Flows
Station Capacity
(mgd) Existing Flowrates
(mgd)
Future Peak Hourly Flowrates
(mgd)
Firm Capacity to Peak Flowrate
Pump Station Max Firm
2016 ADF (mgd)
2016 PHF (mgd)
2030 TAZ
2030 UF
Year 2016
2030 TAZ
2030 UF
13 20.2 20.0 6.53 19.42 21.6 25.8 1.03 0.93 0.78
14 15.6 15.0 4.13 13.20 14.6 16.2 1.14 1.03 0.93
Notes: (1). ADF = average daily flow; PHF = peak hourly flow (2). Existing peak hourly flow estimated using average daily flow and MMSD Madison Design Curve (3). Future flowrates as provided in CARPC’s 2009 MMSD Collection System Evaluation. TAZ = Traffic Analysis Zone data (normal population growth); UF = Uncertainty Factor (accelerated population growth).
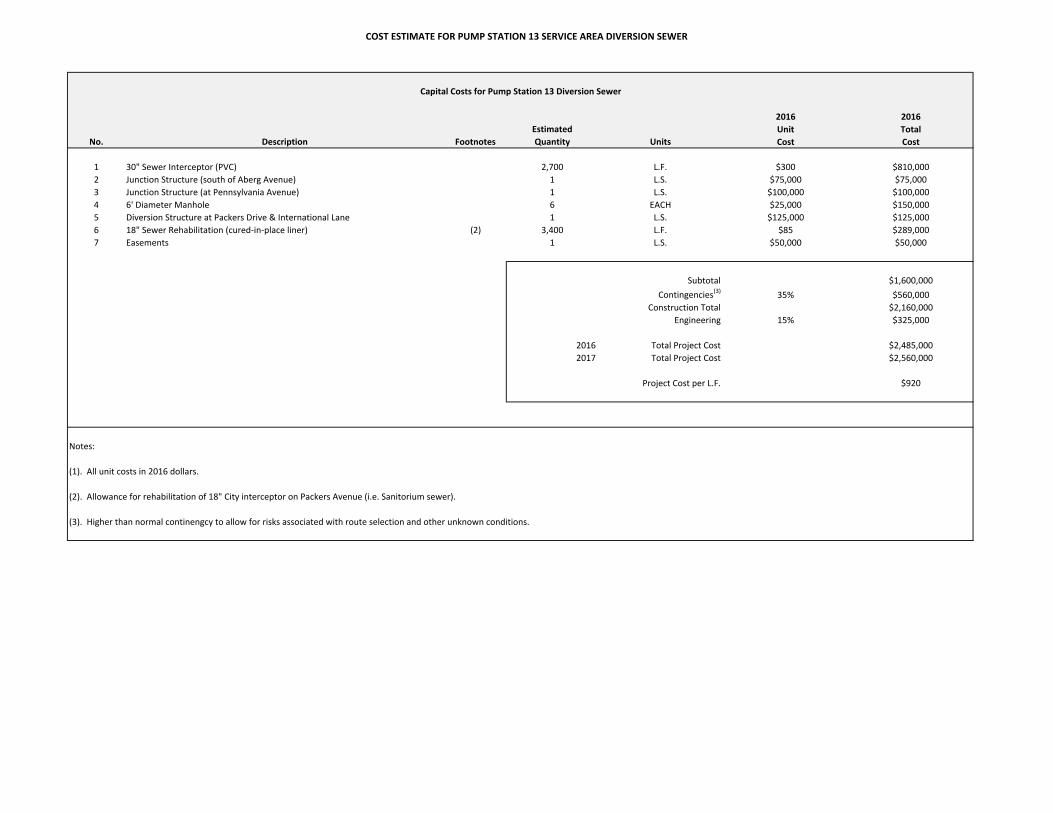
Attached Figures 1 and 2 show plots of actual and projected peak hourly flows at Pump Station 13 and Pump Station 14, respectively, for the period from 2000 to 2060. Both plots show significant variability in the estimated peak flowrate since 2000. The variability is likely due more to inflow and infiltration in these service areas than changes or trends in the generation of wastewater. Due to this variation it is difficult to estimate the year when firm capacity improvements are needed at these stations. In looking at both plots it appears that firm capacity upgrades are needed at Pump Stations 13 and 14 no later than about 2019 and 2032, respectively, based on CARPC’s TAZ projections. Firm capacity improvements should be implemented in or about 2020 to coincide with the replacement and refurbishment of electrical equipment that is discussed in the following section. It is possible to divert approximately 1.2 million gallons per day of flow from the Pump Station 13 service area to Pump Station 1 by constructing 2,700 feet of interceptor improvements along Packers Road near Oscar Mayer (see attached Figure 2 from business case for NEI‐Truax Extension Rehabilitation). If this diversion were constructed, the need for firm capacity improvements at Pump Station 13 could be postponed approximately 15 years to 2035 with the utilization of existing equipment.

Pump Station 13 & 14 Rehabilitation Project Business Case ID: C06 & C07
4/14/17
Page 4 of 10
Equipment Rehabilitation & System Improvements The District’s 2011 Collection System Facilities Plan Update included a condition assessment of each of its 17 pump stations across six categories. These categories included peak flow capacity, firm flow capacity, power system redundancy, mechanical condition, structural integrity, and electrical condition. The condition assessment was updated in May of 2017 to reflect recently completed projects or projects under construction as of this time. Compiling scores across all of the six categories, Pump Station 13 and Pump Station 14 received the first and third highest point totals, respectively, indicating the need for rehabilitation for these stations in the near‐term (see attached Table 5.1 from the facility plan, updated May 2017). Firm capacity needs were discussed in the previous section. A general description of other critical needs at each station is discussed in the remainder of this section. Power Redundancy Power redundancy at each station is rated in poor condition. Each station has a redundant power source but several weak links exist in the power system design. The power is fed to the station through a single transfer switch, bank of transformers, and low voltage feed. This type of design can result in longer than desirable outages if any of these parts of the system fail. Future improvements to this design are desired in the rehabilitation project. Electrical Condition The condition of electrical equipment at each station was rated between adequate and poor. The stations are 45‐46 years old and the electrical equipment is showing significant evidence of corrosion. Corrosion at these stations is accelerated due to the minimal amount of ventilation in the equipment room. The rehabilitation project will make substantial changes and additions to the HVAC system and prolong the life of future electrical equipment. Mechanical Condition As mentioned previously, a small firm capacity upgrade project was completed at each station in 2008. Pump A at each station was replaced and the B pump at each station was rehabilitated. Pump 14C was also rehabilitated as part of this project, including a small increase in capacity. As a result of this project, the pumps at each station are considered to be in good to excellent condition. It may be possible to utilize the existing pumps to meet long‐term capacity needs. Building and Structural Condition Both stations were rated as adequate with regard to the condition of the building. Although structurally sound, these stations are not heated and have poor ventilation. They do not currently meet DNR codes for the required amount of air changes per hour. The rehabilitation project will include substantial modification of the HVAC system to

Pump Station 13 & 14 Rehabilitation Project Business Case ID: C06 & C07
4/14/17
Page 5 of 10
meet these requirements and to protect the electrical equipment from corrosion. Flows at each station are currently calculated by multiplying each pump’s rating by its respective run time. It is recommended that each station be equipped with a permanent flow meter as part of the rehabilitation to achieve more accurate flow measurements. These measurements will be beneficial for future planning and for sewer service billing. The new meters will likely be installed underground in a vault adjacent to the existing buildings. Options: a. Description:
Pump Station 13 and Pump Station 14 both require firm capacity upgrades and rehabilitation of major electrical equipment. The general scope of the project is anticipated to include the following elements: installation of additional pumping equipment or replacement of all or some of the existing pumps to increase pumping capacity; improvements to the power systems to achieve the desired level of redundancy; replacement of major electrical and control equipment; new HVAC systems; installation of flow meters; installation of variable speed drives to provide system flexibility and energy savings; and possible enlargement of the existing building footprint to house new equipment.
b. Alternatives
Alternative 1 – Full rehabilitation of Pump Station 13 and Pump Station 14 Under this alternative each station will be rehabilitated in accordance with the description provided in the preceding section. It is assumed under this alternative that all existing pumps will be removed and replaced in order to meet future capacity needs (i.e. beyond the year 2060). Alternative 2 – Partial Rehabilitation at Pump Stations 13 and 14 (no diversion of flow from Pump Station 13 service area to Pump Station 1) As previously mentioned, each station has adequate space for the addition of a fourth pump (Pump D). Rather than replace all three of the existing pumps at each station, this alternative assumes that all of the existing pumps will remain in service and that firm capacity will be increased through the addition of a new Pump D at each station. Pump D will be of similar capacity to the C pump. Therefore, firm capacity for each station will be achieved by Pumps A or B pumping in parallel with either Pumps C or D. It is estimated that the addition of a fourth pump will provide satisfactory firm capacity at Pump Station 13 and Pump Station 14 to the years 2047 and 2045, respectively (assumes normal growth rate scenario).
Pump Station 13 & 14 Rehabilitation Project Business Case ID: C06 & C07
4/14/17
Page 6 of 10
Complete replacement and refurbishment of electrical equipment at Pump Stations 13 and 14 will be included as part of this alternative, similar to Alternative 1. Alternative 3 – Partial Rehabilitation at Pump Stations 13 and 14 (with flow diversion from Pump Station 13 service area to Pump Station 1) This alternative is similar to Alternative 2 in that a fourth pump will be added to each station and a complete electrical rehabilitation will be undertaken. The fourth pump could be added at the time of the electrical rehabilitation project (Alternative 3A) or it could be postponed until firm capacity is met at each station in approximately 2032 (Alternative 3B). In addition this alternative assumes that approximately 1.2 million gallons per day of flow from the Pump Station 13 service area will be diverted to Pump Station 1. The flow diversion project will postpone the need for firm capacity improvements at Pump Station 13 beyond the year 2060. Firm capacity at Pump Station 14 is expected to be adequate until the year 2045 with the addition of a fourth pump, as in Alternative 2. A summary of the key aspects of the alternatives for Pump Station 13 and Pump Station 14 are summarized in Table 2 and Table 3, respectively.
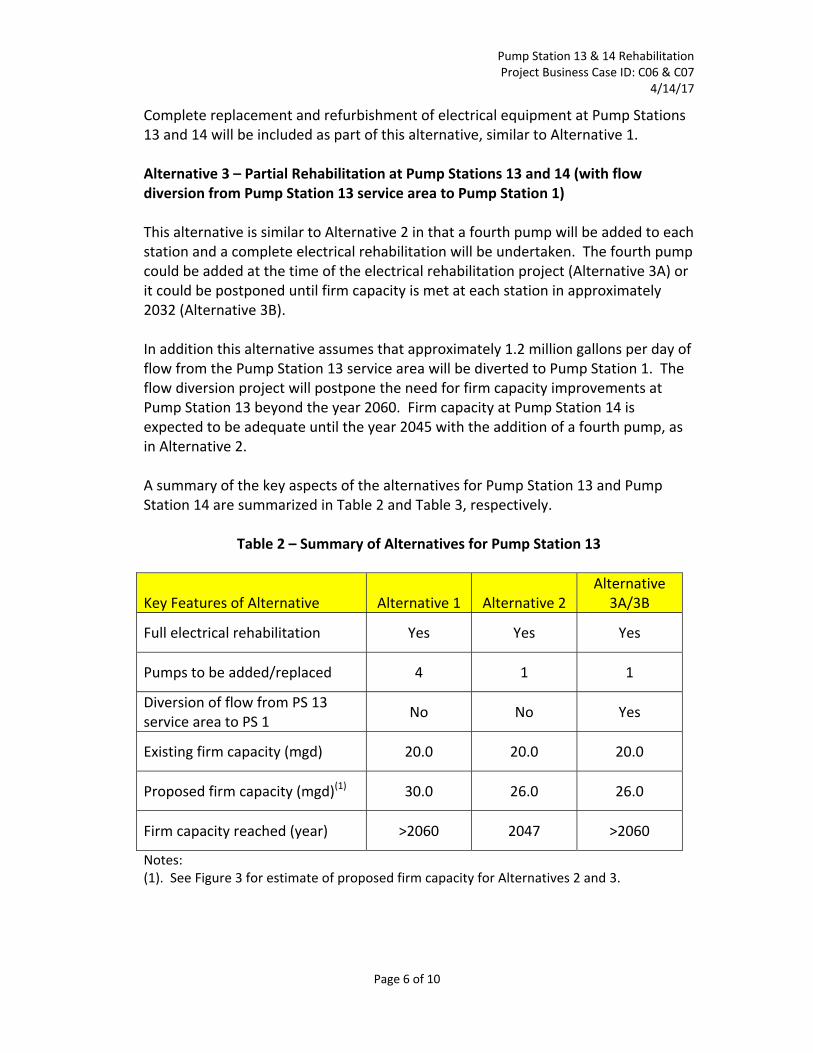
Table 2 – Summary of Alternatives for Pump Station 13
Key Features of Alternative Alternative 1 Alternative 2
Alternative 3A/3B
Full electrical rehabilitation Yes Yes Yes
Pumps to be added/replaced 4 1 1
Diversion of flow from PS 13 service area to PS 1
No No Yes
Existing firm capacity (mgd) 20.0 20.0 20.0
Proposed firm capacity (mgd)(1) 30.0 26.0 26.0
Firm capacity reached (year) >2060 2047 >2060
Notes: (1). See Figure 3 for estimate of proposed firm capacity for Alternatives 2 and 3.

Pump Station 13 & 14 Rehabilitation Project Business Case ID: C06 & C07
4/14/17
Page 7 of 10
Table 3 – Summary of Alternatives for Pump Station 14
Key Features of Alternative Alternative 1 Alternative 2
Alternatives 3A/3B
Full electrical rehabilitation Yes Yes Yes
Pumps to be added/replaced 4 1 1
Existing firm capacity (mgd) 15.0 15.0 15.0
Proposed firm capacity (mgd)(1) 20.0 17.3 17.3
Firm capacity reached (year) >2060 2045 2045
Notes: (1). See Figure 4 for estimate of proposed firm capacity.
c. Key Risks and Issues
Alternative 1. This alternative poses the least amount of risk. The District’s desired level of service will be more easily achieved by providing adequate firm capacity, enhancing power system redundancy, and installing new electrical equipment that is robust and reliable. Providing four new pumping units will allow for capacity needs to be met for at least the next 50 years. Social and environmental impacts due to the rehabilitation are expected to be very minor. Pump Station 13 is located in a non‐residential area between the Dane County Regional Airport and U.S. Highway 51. Pump Station 14 is located in a public conservancy area with no homes or businesses in the immediate vicinity. The majority of the construction work will occur within the pump stations. Noise and dust generated due to the construction will be largely undetectable by the general public. The most noticeable impacts of the construction will be the storage of materials on the sites and the possible construction of minor additions to the existing building infrastructure. These additions should not involve any adverse impacts to the general public or the environment with regards to noise, dust, soil erosion, or transportation. This alternative does not maximize the life expectancy of the existing pumping equipment, however. The A pumps at each station were installed in 2008 and the B pumps at each station were rehabilitated that same year. Each of these pumps can be expected to provide a service life of 40‐50 years. They would only have 12 years

Pump Station 13 & 14 Rehabilitation Project Business Case ID: C06 & C07
4/14/17
Page 8 of 10
of service if they were removed in 2020 as part of a major mechanical rehabilitation. Similarly, the C pumps at each station get relatively little use and are not in need of replacement at this time due to condition. Alternative 2. This alternative carries more risk than Alternative 1. Since only one new pump will be provided at each station, firm capacity will not be increased to the same magnitude as allowed for under Alternative 1. It is possible that accelerated development or increasing problems with inflow and infiltration will create a need for additional capacity improvements prior to 2047 for Pump Station 13 and 2045 for Pump Station 14. Alternative 3. While similar to Alternative 2, this alternative carries additional risk associated with the Pump Station 13 Diversion Sewer project. There are many unknowns regarding the feasibility of this diversion project, including route selection for a new sewer on Packers Road near Oscar Mayer and the City of Madison’s level of interest and cooperation in the project. While it is believed that these issues can be resolved and that the diversion can be successfully completed, any delay to the diversion project could result in Pump Station 13 having less than the desired amount of firm capacity for a short period of time.
d. Economic Analysis
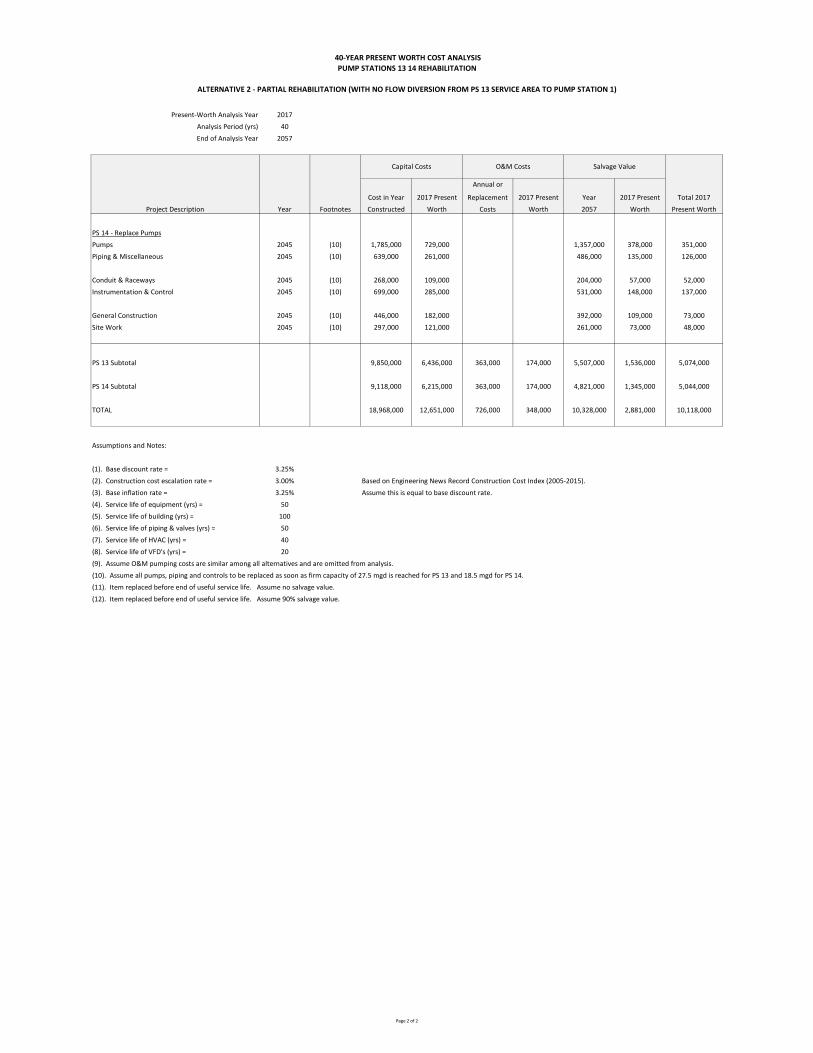
Please see the attached 40‐year present worth analysis. A summary of present worth costs is provided in Table 4.
Table 4 – Summary of Present Worth Analysis for Pump Stations 13 & 14
Alternative Identifier
Capital Cost
Present Worth of Construction
Costs ($)
Present Worth of O&M Costs
($)
Salvage Value
Present Worth of Salvage Value
($)
2017 Total Present Worth
($)
1 $11,247,000 $348,000 $1,255,000 $10,340,000
2 $12,651,000 $348,000 $2,881,000 $10,118,000
3A $13,368,000 $374,000 $2,196,000 $11,546,000
1‐ $13,331,000 $374,000 $2,321,000 $11,384,000
Recommended Option Staff recommends Alternative 2 as the preferred option. The rehabilitation of these stations was identified as the fourth and sixth highest priorities among the District’s 17

Pump Station 13 & 14 Rehabilitation Project Business Case ID: C06 & C07
4/14/17
Page 9 of 10
pumping stations in the District’s Collection System Facilities Plan Update (2011). This alternative will adequately address the need for replacement of aging electrical equipment and also provide the required firm capacity for the next 25‐30 years. It is recommended that all rehabilitation work be performed as part of one project. This allows for a coordinated design that is more efficient and better meets the long‐term needs of the system. Funding requirements may dictate, however, that these projects be separated into different timeframes and/or years. The project schedule shown below shows one coordinated project at this time. Alternative 1 is a more conservative design that allows for a higher firm capacity but has a higher life cycle cost than Alternative 2. Alternatives 3A and 3B provide for greater flexibility and redundancy in the collection system but carry a high level of risk due to their reliance on the timely and successful completion of the Pump Station 13 Service Area Diversion Sewer on the Kraft/Oscar Mayer property. Project Schedule:
Start Date Completion Date
Planning June 2013 December 2018
Design January 2019 December 2019
Bid Date January 2020 February 2020
Construction April 2020 December 2021
Financial Summary (2017 dollars):
Total Project Cost
PS 13 PS 14
District Staff $350,000 $350,000
Consultant $575,000 $565,000
Contractor $3,715,000 $3,650,000
Total $4,640,000 $4,565,000
Fiscal Year Allocation (2017 dollars): Pump Station 13
2019 2020 2021
District Staff $130,000 $110,000 $110,000
Consultant $465,000 $55,000 $55,000
Construction $0 $1,855,000 $1,860,000
Total $595,000 $2,020,000 $2,025,000

Pump Station 13 & 14 Rehabilitation Project Business Case ID: C06 & C07
4/14/17
Page 10 of 10
Pump Station 14
2019 2020 2021
District Staff $130,000 $110,000 $110,000
Consultant $455,000 $55,000 $55,000
Construction $0 $1,825,000 $1,825,000
Total $585,000 $1,990,000 $1,990,000 Note: Numbers will be modified by an inflation factor to bring them to the proper year’s cash allocation within the Capital Budget.

32
39
25
37
44 4438 38
3126
45
3540
46
10
15
20
25
30
35
2000 2005 2010 2015 2020 2025 2030 2035 2040 2045 2050 2055 20
Flow (mgd)
Figure 1: Pump Station 13Existing and Projected Peak Hourly Flowrates
Annual Precipitation Existing Firm Capacity
Firm Capacity with Fourth Pump Added Projected Peak Flow ‐ No Diversion (Normal Growth)
Projected Peak Flow ‐ No Diversion (High Growth) Projected Peak Flow ‐ With Diversion (Normal Growth)
Note: Actual peak flows estimated using measured flows and standard peaking factor from Madison Design Curve

32
39
25
37
44 4438 38
3126
45
3540
46
0
50
100
150
200
250
300
8
10
12
14
16
18
20
22
2000 2005 2010 2015 2020 2025 2030 2035 2040 2045 2050 2055 2060
Annual Precipiation (in/yr)
Flow (mgd)
Figure 2: Pump Station 14 Existing and Projected Average Daily Flowrates
Annual Precipitation Existing Firm Capacity Firm Capacity with Fourth Pump Added
Actual Peak Flow (Estimated) Projected Peak Flow (Normal Growth) Projected Peak Flow (High Growth)
Note: Actual peak flows estimated using measured flows and standard peaking factor from Madison Design Curve
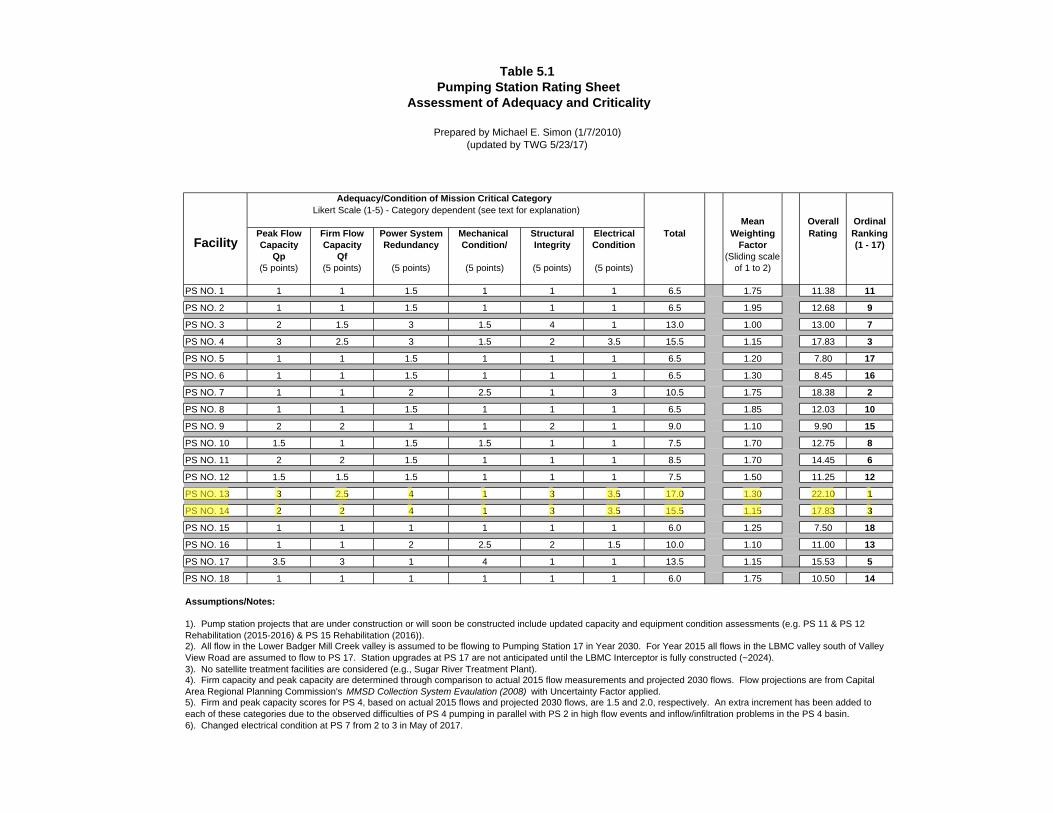
Table 5.1Pumping Station Rating Sheet
Assessment of Adequacy and Criticality
Prepared by Michael E. Simon (1/7/2010)(updated by TWG 5/23/17)
Mean Overall OrdinalPeak Flow Firm Flow Power System Mechanical Structural Electrical Total Weighting Rating RankingCapacity Capacity Redundancy Condition/ Integrity Condition Factor (1 - 17)
Qp Qf (Sliding scale(5 points) (5 points) (5 points) (5 points) (5 points) (5 points) of 1 to 2)
PS NO. 1 1 1 1.5 1 1 1 6.5 1.75 11.38 11
PS NO. 2 1 1 1.5 1 1 1 6.5 1.95 12.68 9
PS NO. 3 2 1.5 3 1.5 4 1 13.0 1.00 13.00 7
PS NO. 4 3 2.5 3 1.5 2 3.5 15.5 1.15 17.83 3
PS NO. 5 1 1 1.5 1 1 1 6.5 1.20 7.80 17
PS NO. 6 1 1 1.5 1 1 1 6.5 1.30 8.45 16
PS NO. 7 1 1 2 2.5 1 3 10.5 1.75 18.38 2
PS NO. 8 1 1 1.5 1 1 1 6.5 1.85 12.03 10
PS NO. 9 2 2 1 1 2 1 9.0 1.10 9.90 15
PS NO. 10 1.5 1 1.5 1.5 1 1 7.5 1.70 12.75 8
PS NO. 11 2 2 1.5 1 1 1 8.5 1.70 14.45 6
PS NO. 12 1.5 1.5 1.5 1 1 1 7.5 1.50 11.25 12
PS NO. 13 3 2.5 4 1 3 3.5 17.0 1.30 22.10 1
PS NO. 14 2 2 4 1 3 3.5 15.5 1.15 17.83 3
PS NO. 15 1 1 1 1 1 1 6.0 1.25 7.50 18
PS NO. 16 1 1 2 2.5 2 1.5 10.0 1.10 11.00 13
PS NO. 17 3.5 3 1 4 1 1 13.5 1.15 15.53 5
PS NO. 18 1 1 1 1 1 1 6.0 1.75 10.50 14
Assumptions/Notes:
3). No satellite treatment facilities are considered (e.g., Sugar River Treatment Plant).
6). Changed electrical condition at PS 7 from 2 to 3 in May of 2017.
5). Firm and peak capacity scores for PS 4, based on actual 2015 flows and projected 2030 flows, are 1.5 and 2.0, respectively. An extra increment has been added to each of these categories due to the observed difficulties of PS 4 pumping in parallel with PS 2 in high flow events and inflow/infiltration problems in the PS 4 basin.
Facility
Adequacy/Condition of Mission Critical Category
1). Pump station projects that are under construction or will soon be constructed include updated capacity and equipment condition assessments (e.g. PS 11 & PS 12 Rehabilitation (2015-2016) & PS 15 Rehabilitation (2016)).2). All flow in the Lower Badger Mill Creek valley is assumed to be flowing to Pumping Station 17 in Year 2030. For Year 2015 all flows in the LBMC valley south of Valley View Road are assumed to flow to PS 17. Station upgrades at PS 17 are not anticipated until the LBMC Interceptor is fully constructed (~2024).
4). Firm capacity and peak capacity are determined through comparison to actual 2015 flow measurements and projected 2030 flows. Flow projections are from Capital Area Regional Planning Commission's MMSD Collection System Evaulation (2008) with Uncertainty Factor applied.
Likert Scale (1-5) - Category dependent (see text for explanation)

0
5
10
15
20
25
30
35
40
45
0 5,000 10,000 15,000 20,000 25,000
TD
H, ft
Flow, gpm
Figure 3: Pump Station 13Existing and Future Pump Capacity
Modified System Curve at LWL Modified System Curve at HWL Pump C Factory CurveModified Pump C Curve Pump A Factory Curve Modified Pump A CurveModified Pump A+C Curves Modified A+B+C Curves
19,300 gpm(27.80 mgd)

0
10
20
30
40
50
60
0 2,000 4,000 6,000 8,000 10,000 12,000 14,000 16,000 18,000
TD
H, ft
Flow, gpm
Figure 4: Pump Station 14Existing and Future Pump Capacity
Modified System Curve at LWL Modified System Curve at HWL Pump A Factory Curve
Modified Pump A Curve Pump C Factory Curve (Existing) Pump C Modified Curve
Modified A+C Curve Modifiied A+B+C Curve
12,900 gpm18.6 mgd

Madison MetropolitanSewerage District
Prepared by: TWG
Date: 8/3/2015
STH 30
USH 51
USH 151
STH 113
Dane CountyRegional Airport
WarnerPark
Pac
kers
Av e
Inte
rnat
ional
Lane
LakeMendota
Nort
h Ba
sin
Int
NortheastInterceptor (NEI)
MH10-145
MH10-426
OscarMayer
Figure 2 - Pump Station 13Service Area Diversion Sewer
PS 1 Service Area
PS 13 Service Area
Diverted PS 13 Basins
Proposed Packers ReliefSewer
NEI-Truax Extension
Ex City of MadisonInterceptor
Ex Pump Station
Ex Force Main
Ex Interceptor

40‐YEAR PRESENT WORTH COST ANALYSIS
PUMP STATIONS 13 14 REHABILITATION
ALTERNATIVE 1 ‐ FULL REHABILITATION
Present‐Worth Analysis Year 2017
Analysis Period (yrs) 40
End of Analysis Year 2057
Annual or
Cost in Year 2017 Replacement 2017 Year 2017 Present Total 2017
Project Description Year Footnotes Constructed Worth Costs Worth 2057 Worth Present Worth
PS 13 ‐ Full Rehabilitation
Pumps 2020 1,100,000 999,000 286,000 80,000 919,000
Gates & Valves 2020 888,000 807,000 231,000 64,000 743,000
Piping & Miscellaneous 2020 385,000 350,000 100,000 28,000 322,000
HVAC & Plumbing 2020 314,000 285,000 24,000 7,000 278,000
Flow Meter 2020 173,000 157,000 45,000 13,000 144,000
Conduit & Raceways 2020 157,000 143,000 41,000 11,000 132,000
Switchgear 2020 683,000 621,000 178,000 50,000 571,000
Instrumentation & Control 2020 377,000 343,000 98,000 27,000 316,000
VFD's 2020 275,000 250,000 0 0 250,000
Miscellaneous Electrical (i.e. wiring, lighting) 2020 204,000 185,000 53,000 15,000 170,000
Electrical Service 2020 471,000 428,000 297,000 83,000 345,000
General Construction 2020 770,000 700,000 485,000 135,000 565,000
Site Work 2020 770,000 700,000 485,000 135,000 565,000
Replace VFD's 2040 363,000 174,000 54,000 15,000 159,000
PS 14 ‐ Full Rehabilitation
Pumps 2020 913,000 829,000 237,000 66,000 763,000
Gates & Valves 2020 733,000 666,000 191,000 53,000 613,000
Piping & Miscellaneous 2020 324,000 294,000 84,000 23,000 271,000
HVAC & Plumbing 2020 288,000 262,000 22,000 6,000 256,000
Flow Meter 2020 158,000 144,000 41,000 11,000 133,000
Conduit & Raceways 2020 144,000 131,000 37,000 10,000 121,000
Switchgear 2020 626,000 569,000 163,000 45,000 524,000
Instrumentation & Control 2020 345,000 313,000 90,000 25,000 288,000
VFD's 2020 252,000 229,000 0 0 229,000
Miscellaneous Electrical (i.e. wiring, lighting) 2020 187,000 170,000 49,000 14,000 156,000
Electrical Service 2020 431,000 392,000 272,000 76,000 316,000
General Construction 2020 705,000 640,000 444,000 124,000 516,000
Site Work 2020 705,000 640,000 444,000 124,000 516,000
Replace VFD's 2040 363,000 174,000 54,000 15,000 159,000
PS 13 Subtotal 6,567,000 5,968,000 363,000 174,000 2,377,000 663,000 5,479,000
PS 14 Subtotal 5,811,000 5,279,000 363,000 174,000 2,128,000 592,000 4,861,000
TOTAL 12,378,000 11,247,000 726,000 348,000 4,505,000 1,255,000 10,340,000
Assumptions and Notes:
(1). Base discount rate = 3.25%
(2). Construction cost escalation rate = 3.00% Based on Engineering News Record Construction Cost Index (2005‐2015).
(3). Base inflation rate = 3.25% Assume this is equal to base discount rate.
(4). Service life of equipment (yrs) = 50
(5). Service life of building (yrs) = 100
(6). Service life of piping & valves (yrs) = 50
(7). Service life of HVAC (yrs) = 40
(8). Service life of VFD's (yrs) = 20
(9). Assume O&M pumping costs are similar among all alternatives and are omitted from analysis.
Capital Costs Salvage ValueO&M Costs
Page 1 of 1

40‐YEAR PRESENT WORTH COST ANALYSIS
PUMP STATIONS 13 14 REHABILITATION
ALTERNATIVE 2 ‐ PARTIAL REHABILITATION (WITH NO FLOW DIVERSION FROM PS 13 SERVICE AREA TO PUMP STATION 1)
Present‐Worth Analysis Year 2017
Analysis Period (yrs) 40
End of Analysis Year 2057
Annual or
Cost in Year 2017 Present Replacement 2017 Present Year 2017 Present Total 2017
Project Description Year Footnotes Constructed Worth Costs Worth 2057 Worth Present Worth
PS 13 ‐ Partial Rehabilitation
Pumps 2020 (11) 275,000 250,000 0 0 250,000
Gates & Valves 2020 802,000 729,000 209,000 58,000 671,000
Piping & Miscellaneous 2020 (11) 94,000 85,000 0 0 85,000
HVAC & Plumbing 2020 314,000 285,000 24,000 7,000 278,000
Flow Meter 2020 173,000 157,000 45,000 13,000 144,000
Conduit & Raceways 2020 (11) 157,000 143,000 0 0 143,000
Switchgear 2020 684,000 621,000 178,000 50,000 571,000
Instrumentation & Control 2020 (11) 377,000 343,000 0 0 343,000
VFD's 2020 (11) 275,000 250,000 0 0 250,000
Miscellaneous Electrical (i.e. wiring, lighting) 2020 204,000 185,000 53,000 15,000 170,000
Electrical Service 2020 472,000 429,000 297,000 83,000 346,000
General Construction 2020 (12) 621,000 564,000 352,000 98,000 466,000
Site Work 2020 621,000 564,000 391,000 109,000 455,000
Replace VFD's 2040 363,000 174,000 54,000 15,000 159,000
PS 13 ‐ Replace Pumps
Pumps 2047 (10) 2,146,000 822,000 1,717,000 478,000 344,000
Piping & Miscellaneous 2047 (10) 789,000 302,000 631,000 176,000 126,000
Conduit & Raceways 2047 (10) 300,000 115,000 240,000 67,000 48,000
Instrumentation & Control 2047 (10) 757,000 290,000 606,000 169,000 121,000
General Construction 2047 (10) 473,000 181,000 426,000 119,000 62,000
Site Work 2047 (10) 316,000 121,000 284,000 79,000 42,000
PS 14 ‐ Partial Rehabilitation
Pumps 2020 (11) 251,000 228,000 0 0 228,000
Gates & Valves 2020 753,000 684,000 196,000 55,000 629,000
Piping & Miscellaneous 2020 (11) 86,000 78,000 0 0 78,000
HVAC & Plumbing 2020 314,000 285,000 24,000 7,000 278,000
Flow Meter 2020 173,000 157,000 45,000 13,000 144,000
Conduit & Raceways 2020 (11) 157,000 143,000 0 0 143,000
Switchgear 2020 683,000 621,000 178,000 50,000 571,000
Instrumentation & Control 2020 (11) 377,000 343,000 0 0 343,000
VFD's 2020 275,000 250,000 0 0 250,000
Miscellaneous Electrical (i.e. wiring, lighting) 2020 204,000 185,000 53,000 15,000 170,000
Electrical Service 2020 471,000 428,000 297,000 83,000 345,000
General Construction 2020 (12) 620,000 563,000 352,000 98,000 465,000
Site Work 2020 620,000 563,000 391,000 109,000 454,000
Replace VFD's 2040 363,000 174,000 54,000 15,000 159,000
Capital Costs O&M Costs Salvage Value
Page 1 of 2
40‐YEAR PRESENT WORTH COST ANALYSIS
PUMP STATIONS 13 14 REHABILITATION
ALTERNATIVE 2 ‐ PARTIAL REHABILITATION (WITH NO FLOW DIVERSION FROM PS 13 SERVICE AREA TO PUMP STATION 1)
Present‐Worth Analysis Year 2017
Analysis Period (yrs) 40
End of Analysis Year 2057
Annual or
Cost in Year 2017 Present Replacement 2017 Present Year 2017 Present Total 2017
Project Description Year Footnotes Constructed Worth Costs Worth 2057 Worth Present Worth
Capital Costs O&M Costs Salvage Value
PS 14 ‐ Replace Pumps
Pumps 2045 (10) 1,785,000 729,000 1,357,000 378,000 351,000
Piping & Miscellaneous 2045 (10) 639,000 261,000 486,000 135,000 126,000
Conduit & Raceways 2045 (10) 268,000 109,000 204,000 57,000 52,000
Instrumentation & Control 2045 (10) 699,000 285,000 531,000 148,000 137,000
General Construction 2045 (10) 446,000 182,000 392,000 109,000 73,000
Site Work 2045 (10) 297,000 121,000 261,000 73,000 48,000
PS 13 Subtotal 9,850,000 6,436,000 363,000 174,000 5,507,000 1,536,000 5,074,000
PS 14 Subtotal 9,118,000 6,215,000 363,000 174,000 4,821,000 1,345,000 5,044,000
TOTAL 18,968,000 12,651,000 726,000 348,000 10,328,000 2,881,000 10,118,000
Assumptions and Notes:
(1). Base discount rate = 3.25%
(2). Construction cost escalation rate = 3.00% Based on Engineering News Record Construction Cost Index (2005‐2015).
(3). Base inflation rate = 3.25% Assume this is equal to base discount rate.
(4). Service life of equipment (yrs) = 50
(5). Service life of building (yrs) = 100
(6). Service life of piping & valves (yrs) = 50
(7). Service life of HVAC (yrs) = 40
(8). Service life of VFD's (yrs) = 20
(9). Assume O&M pumping costs are similar among all alternatives and are omitted from analysis.
(10). Assume all pumps, piping and controls to be replaced as soon as firm capacity of 27.5 mgd is reached for PS 13 and 18.5 mgd for PS 14.
(11). Item replaced before end of useful service life. Assume no salvage value.
(12). Item replaced before end of useful service life. Assume 90% salvage value.
Page 2 of 2

40‐YEAR PRESENT WORTH COST ANALYSIS
PUMP STATIONS 13 14 REHABILITATION
ALTERNATIVE 3A ‐ PARTIAL REHABILITATION (WITH DIVERSION OF FLOW FROM PUMP STATION 13 SERVICE AREA TO PUMP STATION 1)
Present‐Worth Analysis Year 2017
Analysis Period (yrs) 40
End of Analysis Year 2057
Annual or
Cost in Year 2017 Present Replacement 2017 Present Year 2017 Present Total 2017
Project Description Year Footnotes Constructed Worth Costs Worth 2057 Worth Present Worth
PS 13 ‐ Partial Rehabilitation
Pumps 2020 (13) 275,000 250,000 72,000 20,000 230,000
Gates & Valves 2020 802,000 729,000 209,000 58,000 671,000
Piping & Miscellaneous 2020 94,000 85,000 24,000 7,000 78,000
HVAC & Plumbing 2020 314,000 285,000 24,000 7,000 278,000
Flow Meter 2020 173,000 157,000 45,000 13,000 144,000
Conduit & Raceways 2020 157,000 143,000 41,000 11,000 132,000
Switchgear 2020 684,000 621,000 178,000 50,000 571,000
Instrumentation & Control 2020 377,000 343,000 98,000 27,000 316,000
VFD's 2020 275,000 250,000 0 0 250,000
Miscellaneous Electrical (i.e. wiring, lighting) 2020 204,000 185,000 53,000 15,000 170,000
Electrical Service 2020 472,000 429,000 297,000 83,000 346,000
General Construction 2020 621,000 564,000 391,000 109,000 455,000
Site Work 2020 621,000 564,000 391,000 109,000 455,000
Replace VFD's 2040 363,000 174,000 54,000 15,000 159,000
PS 13 ‐ Replace Pumps
Pumps >2060 ‐ ‐ ‐ ‐ ‐
Gates & Valves >2060 ‐ ‐ ‐ ‐ ‐
Piping & Miscellaneous >2060 ‐ ‐ ‐ ‐ ‐
‐ ‐ ‐ ‐ ‐
Instrumentation & Control >2060 ‐ ‐ ‐ ‐ ‐
VFD's >2060 ‐ ‐ ‐ ‐ ‐
Miscellaneous Electrical (i.e. wiring, lighting) >2060 ‐ ‐ ‐ ‐ ‐
‐ ‐ ‐ ‐ ‐
General Construction >2060 ‐ ‐ ‐ ‐ ‐
Site Work >2060 ‐ ‐ ‐ ‐ ‐
PS 14 ‐ Partial Rehabilitation
Pumps 2020 (13) 251,000 228,000 0 0 228,000
Gates & Valves 2020 753,000 684,000 196,000 55,000 629,000
Piping & Miscellaneous 2020 86,000 78,000 0 0 78,000
HVAC & Plumbing 2020 314,000 285,000 24,000 7,000 278,000
Flow Meter 2020 173,000 157,000 45,000 13,000 144,000
Conduit & Raceways 2020 157,000 143,000 0 0 143,000
Switchgear 2020 683,000 621,000 178,000 50,000 571,000
Instrumentation & Control 2020 377,000 343,000 0 0 343,000
VFD's 2020 275,000 250,000 0 0 250,000
Miscellaneous Electrical (i.e. wiring, lighting) 2020 204,000 185,000 53,000 15,000 170,000
Electrical Service 2020 471,000 428,000 297,000 83,000 345,000
General Construction 2020 620,000 563,000 352,000 98,000 465,000
Site Work 2020 620,000 563,000 391,000 109,000 454,000
Replace VFD's 2040 363,000 174,000 54,000 15,000 159,000
Capital Costs O&M Costs Salvage Value
Page 1 of 2

40‐YEAR PRESENT WORTH COST ANALYSIS
PUMP STATIONS 13 14 REHABILITATION
ALTERNATIVE 3A ‐ PARTIAL REHABILITATION (WITH DIVERSION OF FLOW FROM PUMP STATION 13 SERVICE AREA TO PUMP STATION 1)
Present‐Worth Analysis Year 2017
Analysis Period (yrs) 40
End of Analysis Year 2057
Annual or
Cost in Year 2017 Present Replacement 2017 Present Year 2017 Present Total 2017
Project Description Year Footnotes Constructed Worth Costs Worth 2057 Worth Present Worth
Capital Costs O&M Costs Salvage Value
PS 14 ‐ Replace Pumps
Pumps 2045 1,785,000 729,000 1,357,000 378,000 351,000
Piping & Miscellaneous 2045 639,000 261,000 486,000 135,000 126,000
Conduit & Raceways 2045 268,000 109,000 204,000 57,000 52,000
Instrumentation & Control 2045 699,000 285,000 531,000 148,000 137,000
General Construction 2045 446,000 182,000 392,000 109,000 73,000
Site Work 2045 297,000 121,000 261,000 73,000 48,000
PS 13 Service Area Diversion Sewer
30" Sewer Interceptor (PVC) 2019 1,376,000 1,291,000 675 26,000 679,000 189,000 1,128,000
Junction Structure (south of Aberg Avenue) 2019 127,000 119,000 63,000 18,000 101,000
Junction Structure (at Pennsylvania Avenue) 2019 170,000 159,000 84,000 23,000 136,000
6' Diameter Manhole 2019 255,000 239,000 126,000 35,000 204,000
Diversion Stucture at Packers/International 2019 212,000 199,000 105,000 29,000 170,000
18" Sewer Rehabilitation (cured‐in‐place liner) 2019 491,000 461,000 City sewer 118,000 33,000 428,000
Easements 2019 85,000 80,000 City sewer 0 0 80,000
PS 13 Subtotal 5,069,000 4,605,000 363,000 174,000 1,877,000 524,000 4,255,000
PS 14 Subtotal 9,118,000 6,215,000 363,000 174,000 4,821,000 1,345,000 5,044,000
PS 13 Service Area Diversion Sewer 2,631,000 2,468,000 675 26,000 1,175,000 327,000 2,167,000
TOTAL 16,903,000 13,368,000 726,675 374,000 7,873,000 2,196,000 11,546,000
Assumptions and Notes:
(1). Base discount rate = 3.25%
(2). Construction cost escalation rate = 3.00% Based on Engineering News Record Construction Cost Index (2005‐2015).
(3). Base inflation rate = 3.25% Assume this is equal to base discount rate.
(4). Service life of equipment (yrs) = 50
(5). Service life of building (yrs) = 100
(6). Service life of piping & valves (yrs) = 50
(7). Service life of HVAC (yrs) = 40
(8). Service life of VFD's (yrs) = 20
(9). Service life of interceptor (yrs) = 75
(10). Service life of liner (yrs) = 50
(11). Unit cost of annual sewer maintenance ($/ft) = $0.25
(12). Assume O&M pumping costs are similar among all alternatives and are omitted from analysis.
(13). Assume Pump D and associated piping and controls are added in 2019 in conjunction with electrical rehabilitation.
Page 2 of 2

40‐YEAR PRESENT WORTH COST ANALYSIS
PUMP STATIONS 13 14 REHABILITATION
ALTERNATIVE 3B ‐ PARTIAL REHABILITATION (WITH DIVERSION OF FLOW FROM PUMP STATION 13 SERVICE AREA TO PUMP STATION 1)
Present‐Worth Analysis Year 2017
Analysis Period (yrs) 40
End of Analysis Year 2057
Annual or
Cost in Year 2017 Present Replacement 2017 Present Year 2017 Present Total 2017
Project Description Year Footnotes Constructed Worth Costs Worth 2057 Worth Present Worth
PS 13 ‐ Partial Rehabilitation
New Pump D 2032 (10) 392,000 243,000 196,000 55,000 188,000
Gates & Valves 2020 (11) 641,000 582,000 167,000 46,000 536,000
Gates & Valves (Pump D) 2032 (11) 229,000 142,000 115,000 32,000 110,000
Piping & Miscellaneous 2032 134,000 83,000 67,000 19,000 64,000
HVAC & Plumbing 2020 314,000 285,000 24,000 7,000 278,000
Flow Meter 2020 173,000 157,000 45,000 13,000 144,000
Conduit & Raceways 2020 157,000 143,000 41,000 11,000 132,000
Switchgear 2020 684,000 621,000 178,000 50,000 571,000
Instrumentation & Control 2020 (11) 302,000 274,000 79,000 22,000 252,000
Instrumentation & Control (Pump D) 2032 (11) 108,000 67,000 54,000 15,000 52,000
VFD's 2020 275,000 250,000 0 0 250,000
Miscellaneous Electrical (i.e. wiring, lighting) 2020 204,000 185,000 53,000 15,000 170,000
Electrical Service 2020 472,000 429,000 297,000 83,000 346,000
General Construction 2020 (12) 559,000 508,000 352,000 98,000 410,000
General Construction (Pump D) 2032 (12) 89,000 55,000 67,000 19,000 36,000
Site Work 2020 (12) 559,000 508,000 352,000 98,000 410,000
Site Work (Pump D) 2032 (12) 89,000 55,000 67,000 19,000 36,000
Replace VFD's 2040 363,000 174,000 54,000 15,000 159,000
PS 13 ‐ Replace Pumps
Pumps >2060 ‐ ‐ ‐ ‐ ‐
Gates & Valves >2060 ‐ ‐ ‐ ‐ ‐
Piping & Miscellaneous >2060 ‐ ‐ ‐ ‐ ‐
‐ ‐ ‐ ‐ ‐
Conduit & Raceways >2060 ‐ ‐ ‐ ‐ ‐
Instrumentation & Control >2060 ‐ ‐ ‐ ‐ ‐
VFD's >2060 ‐ ‐ ‐ ‐ ‐
‐ ‐ ‐ ‐ ‐
General Construction >2060 ‐ ‐ ‐ ‐ ‐
Site Work >2060 ‐ ‐ ‐ ‐ ‐
PS 14 ‐ Partial Rehabilitation
New Pump D 2032 (10) 358,000 222,000 0 0 222,000
Gates & Valves 2020 (11) 603,000 548,000 157,000 44,000 504,000
Gates & Valves (Pump D) 2032 (11) 215,000 133,000 108,000 30,000 103,000
Piping & Miscellaneous 2032 123,000 76,000 0 0 76,000
HVAC & Plumbing 2020 314,000 285,000 24,000 7,000 278,000
Flow Meter 2020 173,000 157,000 45,000 13,000 144,000
Conduit & Raceways 2020 157,000 143,000 0 0 143,000
Switchgear 2020 683,000 621,000 178,000 50,000 571,000
Instrumentation & Control 2020 (11) 301,000 273,000 0 0 273,000
Instrumentation & Control (Pump D) 2032 (11) 107,000 66,000 0 0 66,000
VFD's 2020 275,000 250,000 0 0 250,000
Miscellaneous Electrical (i.e. wiring, lighting) 2020 204,000 185,000 53,000 15,000 170,000
Electrical Service 2020 471,000 428,000 297,000 83,000 345,000
General Construction 2020 (12) 558,000 507,000 316,000 88,000 419,000
General Construction (Pump D) 2032 (12) 88,000 54,000 59,000 16,000 38,000
Site Work 2020 (12) 558,000 507,000 352,000 98,000 409,000
Site Work (Pump D) 2032 (12) 88,000 54,000 66,000 18,000 36,000
Replace VFD's 2040 363,000 174,000 54,000 15,000 159,000
Capital Costs O&M Costs Salvage Value
Page 1 of 2

40‐YEAR PRESENT WORTH COST ANALYSIS
PUMP STATIONS 13 14 REHABILITATION
ALTERNATIVE 3B ‐ PARTIAL REHABILITATION (WITH DIVERSION OF FLOW FROM PUMP STATION 13 SERVICE AREA TO PUMP STATION 1)
Present‐Worth Analysis Year 2017
Analysis Period (yrs) 40
End of Analysis Year 2057
Annual or
Cost in Year 2017 Present Replacement 2017 Present Year 2017 Present Total 2017
Project Description Year Footnotes Constructed Worth Costs Worth 2057 Worth Present Worth
Capital Costs O&M Costs Salvage Value
PS 14 ‐ Replace Pumps
Pumps 2045 1,785,000 729,000 1,357,000 378,000 351,000
Piping & Miscellaneous 2045 639,000 261,000 486,000 135,000 126,000
Conduit & Raceways 2045 268,000 109,000 204,000 57,000 52,000
Instrumentation & Control 2045 699,000 285,000 531,000 148,000 137,000
General Construction 2045 446,000 182,000 392,000 109,000 73,000
Site Work 2045 297,000 121,000 261,000 73,000 48,000
PS 13 Service Area Diversion Sewer
30" Sewer Interceptor (PVC) 2019 1,376,000 1,291,000 675 26,000 679,000 189,000 1,128,000
Junction Structure (south of Aberg Avenue) 2019 127,000 119,000 63,000 18,000 101,000
Junction Structure (at Pennsylvania Avenue) 2019 170,000 159,000 84,000 23,000 136,000
6' Diameter Manhole 2019 255,000 239,000 126,000 35,000 204,000
Diversion Stucture at Packers/International 2019 212,000 199,000 105,000 29,000 170,000
18" Sewer Rehabilitation (cured‐in‐place liner) 2019 491,000 461,000 City sewer 118,000 33,000 428,000
Easements 2019 85,000 80,000 0 0 80,000
PS 13 Subtotal 5,381,000 4,587,000 363,000 174,000 2,208,000 617,000 4,144,000
PS 14 Subtotal 9,410,000 6,196,000 363,000 174,000 4,940,000 1,377,000 4,993,000
PS 13 Service Area Diversion Sewer 2,631,000 2,468,000 675 26,000 1,175,000 327,000 2,167,000
TOTAL 17,507,000 13,331,000 726,675 374,000 8,323,000 2,321,000 11,384,000
Assumptions and Notes:
(1). Base discount rate = 3.25%
(2). Construction cost escalation rate = 3.00% Based on Engineering News Record Construction Cost Index (2005‐2015).
(3). Base inflation rate = 3.25% Assume this is equal to base discount rate.
(4). Service life of equipment (yrs) = 50
(5). Service life of building (yrs) = 100
(6). Service life of piping & valves (yrs) = 50
(7). Service life of HVAC (yrs) = 40
(8). Service life of VFD's (yrs) = 20
(9). Assume O&M pumping costs are similar among all alternatives and are omitted from analysis.
(10). Assume future Pump D and associated piping and controls are added in roughly Year 2035 as separate project when additional capacity is needed.
(11). Assume 80% of costs incurred with electrical rehabilitation project and 20% with addition of future Pump D.
(12). Assume 90% of costs incurred with electrical rehabilitation project and 10% with addition of future Pump D.
Page 2 of 2

COST ESTIMATE FOR PUMP STATION 13 AND PUMP STATION 14 REHABILITATION
2014 2014 2017
Estimated Full Unit Unit Total
Description Quantity Units Cost Cost Cost
PS 13 Mechanical Pumps (2) 1 EACH $160,000 100% $160,000 $175,000
Gates & Valves (2), (3) 1 L.S. $515,000 90% $465,000 $510,000
Piping & Miscellaneous (2), (4) 1 L.S. $225,000 25% $55,000 $60,000
HVAC & Plumbing (2) 1 L.S. $185,000 100% $185,000 $200,000
Flow Meter (2) 1 L.S. $100,000 100% $100,000 $110,000
Electrical Conduit & Raceways (2) 1 L.S. $90,000 100% $90,000 $100,000
Switchgear (2) 1 L.S. $400,000 100% $400,000 $435,000
Instrumentation & Control (2) 1 L.S. $220,000 100% $220,000 $240,000
VFD's (2) 2 EACH $80,000 100% $80,000 $175,000
Miscellaneous Electrical (i.e. wiring, lighting) (2) 1 L.S. $120,000 100% $120,000 $130,000
Electrical Service (2) 1 L.S. $275,000 100% $275,000 $300,000
General General Construction (2) 1 L.S. $450,000 80% $360,000 $395,000
Site Work (2) 1 L.S. $450,000 80% $360,000 $395,000
Subtotal PS 13 $3,225,000
G.C./Contingencies 15% $484,000
Construction Cost $3,709,000
Engineering 25% $927,000
Total PS 13 Project Cost $4,640,000
PS 14 Mechanical Pumps (2) 1 EACH 144,000 100% $145,000 $160,000
Gates & Valves (2) 1 L.S. 463,500 95% $440,000 $480,000
Piping & Miscellaneous (2), (4) 1 L.S. 202,500 25% $50,000 $55,000
HVAC & Plumbing (2) 1 L.S. 185,000 100% $185,000 $200,000
Flow Meter (2) 1 L.S. 100,000 100% $100,000 $110,000
Electrical Conduit & Raceways (2) 1 L.S. 90,000 100% $90,000 $100,000
Switchgear (2) 1 L.S. 400,000 100% $400,000 $435,000
Instrumentation & Control (2) 1 L.S. 220,000 100% $220,000 $240,000
VFD's (2) 2 EACH 80,000 100% $80,000 $175,000
Miscellaneous Electrical (i.e. wiring, lighting) (2) 1 L.S. 120,000 100% $120,000 $130,000
Electrical Service (2) 1 L.S. 275,000 100% $275,000 $300,000
General General Construction (2) 1 L.S. 450,000 80% $360,000 $395,000
Site Work (2) 1 L.S. 450,000 80% $360,000 $395,000
Subtotal PS 14 $3,175,000
G.C./Contingencies 15% $476,000
Construction Cost $3,651,000
Engineering 25% $913,000
Total PS 14 Project Cost $4,560,000
Total Construction Cost $7,350,000
Total engineering $1,850,000
Total Cost $9,200,000
Notes:
(1). All unit costs in 2014 dollars.
(2). Unit costs for pump station rehabilitation taken from Year 2014 bids for 'Pump Station 11 & 12 Rehabilitation' project.
(3). Discount full cost to reflect new check valve for Pump A in 2008 and recent replacements of check valve and suction gate valve for Pump B.
(4). Costs reflect installation of one new pump and associated piping. Assume three existing pumps remain in place.
Capital Costs for Pump Stations 13 & 14 ‐ Partial Rehabilitation
Fraction of
Quantity (%)Footnotes

COST ESTIMATE FOR PUMP STATION 13 PUMP STATION 14 REHABILITATION
2014 2014 2017
Estimated Full Unit Unit Total
Description Quantity Units Cost Cost Cost
PS 13 Mechanical Pumps (2) 4 EACH $160,000 100% $160,000 $700,000
Gates & Valves (2) 1 L.S. $515,000 100% $515,000 $565,000
Piping & Miscellaneous (2) 1 L.S. $225,000 100% $225,000 $245,000
HVAC & Plumbing (2) 1 L.S. $185,000 100% $185,000 $200,000
Flow Meter (2) 1 L.S. $100,000 100% $100,000 $110,000
Electrical Conduit & Raceways (2) 1 L.S. $90,000 100% $90,000 $100,000
Switchgear (2) 1 L.S. $400,000 100% $400,000 $435,000
Instrumentation & Control (2) 1 L.S. $220,000 100% $220,000 $240,000
VFD's (2) 2 EACH $80,000 100% $80,000 $175,000
Miscellaneous Electrical (i.e. wiring, lighting) (2) 1 L.S. $120,000 100% $120,000 $130,000
Electrical Service (2) 1 L.S. $275,000 100% $275,000 $300,000
General General Construction (2) 1 L.S. $450,000 100% $450,000 $490,000
Site Work (2) 1 L.S. $450,000 100% $450,000 $490,000
Subtotal PS 13 $4,180,000
G.C./Contingencies 15% $627,000
Construction Cost $4,807,000
Engineering 25% $1,202,000
Total PS 13 Project Cost $6,010,000
PS 14 Mechanical Pumps (2) 4 EACH 144,000 100% $145,000 $635,000
Gates & Valves (2) 1 L.S. 463,500 100% $465,000 $510,000
Piping & Miscellaneous (2) 1 L.S. 202,500 100% $205,000 $225,000
HVAC & Plumbing (2) 1 L.S. 185,000 100% $185,000 $200,000
Flow Meter (2) 1 L.S. 100,000 100% $100,000 $110,000
Electrical Conduit & Raceways (2) 1 L.S. 90,000 100% $90,000 $100,000
Switchgear (2) 1 L.S. 400,000 100% $400,000 $435,000
Instrumentation & Control (2) 1 L.S. 220,000 100% $220,000 $240,000
VFD's (2) 2 EACH 80,000 100% $80,000 $175,000
Miscellaneous Electrical (i.e. wiring, lighting) (2) 1 L.S. 120,000 100% $120,000 $130,000
Electrical Service (2) 1 L.S. 275,000 100% $275,000 $300,000
General General Construction (2) 1 L.S. 450,000 100% $450,000 $490,000
Site Work (2) 1 L.S. 450,000 100% $450,000 $490,000
Subtotal PS 14 $4,040,000
G.C./Contingencies 15% $606,000
Construction Cost $4,646,000
Engineering 25% $1,162,000
Total PS 14 Project Cost $5,810,000
Total Construction Cost $9,450,000
Total Engineering $2,350,000
Total Cost $11,820,000
Notes:
(1). All costs in 2016 dollars.
(2). Unit costs for pump station rehabilitation taken from Year 2014 bids for 'Pump Station 11 & 12 Rehabilitation' project.
Capital Costs for Pump StationS 13 & 14 ‐ Full Rehabilitation
Footnotes
Fraction of
Quantity (%)
COST ESTIMATE FOR PUMP STATION 13 SERVICE AREA DIVERSION SEWER
2016 2016
Estimated Unit Total
No. Description Quantity Units Cost Cost
1 30" Sewer Interceptor (PVC) 2,700 L.F. $300 $810,000
2 Junction Structure (south of Aberg Avenue) 1 L.S. $75,000 $75,000
3 Junction Structure (at Pennsylvania Avenue) 1 L.S. $100,000 $100,000
4 6' Diameter Manhole 6 EACH $25,000 $150,000
5 Diversion Structure at Packers Drive & International Lane 1 L.S. $125,000 $125,000
6 18" Sewer Rehabilitation (cured‐in‐place liner) (2) 3,400 L.F. $85 $289,000
7 Easements 1 L.S. $50,000 $50,000
Subtotal $1,600,000
Contingencies(3) 35% $560,000
Construction Total $2,160,000
Engineering 15% $325,000
2016 Total Project Cost $2,485,000
2017 Total Project Cost $2,560,000
Project Cost per L.F. $920
Notes:
(1). All unit costs in 2016 dollars.
(2). Allowance for rehabilitation of 18" City interceptor on Packers Avenue (i.e. Sanitorium sewer).
(3). Higher than normal continengcy to allow for risks associated with route selection and other unknown conditions.
Capital Costs for Pump Station 13 Diversion Sewer
Footnotes