pwm quarterly market update - robert w. baird &...
TRANSCRIPT
1
WEALTH SOLUTIONS GROUP
Market Update Q1 2018 Review and Outlook
Domestic equity markets posted their first quarterly de-cline in several years as volatility spiked. Developed inter-national markets also retreated on trade war rhetoric, while Emerging Markets fared better. The broad US bond market also declined as yields rose to multi-year highs.
The Markets at a Glance
Performance returns are as of 3/31/18
Q1 Recap
Volatility returned to equity markets in Q1 stemming from potential tighter-than-anticipated monetary policy, trade war angst, weakness in mega cap Tech, and broad structural dynamics due to the preponderance of passive investments. While not unchartered territory, it is a marked shift in market dynamics. Ultimately the S&P 500 declined –0.8% in Q1, marking its first quarterly decline in several years.
International markets were largely mixed for the quarter. Softening economic data in Europe and the heightened risk of trade wars drove developed markets, as measured by the MSCI EAFE Index, lower (-1.5%). Emerging markets fared better, increasing 1.4% during the quarter.
The broad US bond market’s performance suffered this past quarter as yields across the US Treas-ury curve rose to multi-year highs. The Bloomberg Barclays US Aggregate Bond Index returned –1.5% this past quarter, the 14th worst quarter since the index’s inception. The story of the year thus far centers around the rise of short-term funding costs
Asset Manager Research
(414) 298-7359
April 13, 2018
IN THIS ISSUE PAGE 2: VOLATILITY Potential Causes
QE Wind Down Trade War Woes Cracks in FAANG Passive Dynamics
Active + Diversification PAGE 3: US EQUITY Quarterly Loss Tech Leads but Falters Small Cap Outperforms PAGE 4: INT’L EQUITY Returns Mixed Developed Challenged EM Outpaces Politics Spur Brazil PAGE 5: FIXED INCOME Rising Yields = Volatility International Leads Corp. Spreads Intact Securitized Resiliency Muni Technicals
Asset Class Representative Benchmark Q1
Return 1-Year Return
U.S. Large Cap S&P 500 -0.8% 14.0%
U.S. Small Cap Russell 2000® -0.1% 11.8%
International MSCI EAFE -1.5% 14.9%
Commodities Bloomberg Commodity -0.4% 3.7%
Municipal Bonds BBgBarc. Municipal -1.1% 2.7%
Taxable Bonds BBgBarc. Aggregate -1.5% 1.2%
Cash Citi 3-mo T-Bills 0.4% 1.1%
2
Keep Calm & Carry On: Volatility Returns with a Vengeance
Although the weather doesn’t point to a seasonal change just yet, volatility re-turned from its hibernation with a vengeance in Q1 2018 though its resur-gence was isolated to the equity mar-kets. The S&P 500 saw 12 daily moves of +/-2% this past quarter compared to zero in 2017 and an average of 12 annu-ally in 2012-2016. While not unchar-tered territory, it is a marked shift in market dynamics. Catalysts for this re-vival include central banks retreating from easy monetary policy, potential trade war angst and the preponderance of ever-popular passive ETFs. Market complacency dissipated as investors now react hastily to the topic du jour.
Potential Causes of Market Volatility:
1. All Good Things Must Come to an End
English poet, Geoffrey Chaucer coined that phrase and it accurately describes market dynamics as quantitative easing recedes. Fed stimulus enacted to re-store the economy following the finan-cial crisis supported equity prices and their nine-year rally. Concerns over ris-ing rates put a damper on equity prices as rate increases and more importantly wage pressures could negatively impact the bottom line for US corporations.
2. Trade War Woes
The Trump administration hasn’t strayed too far from its campaign prom-ise to address trade issues. Trade ten-sions between the US and its largest trade partner, China, have escalated in recent weeks as a slew of stiff tariffs and aggressive rhetoric drove height-ened market volatility. Although any disruption to the standing trade rela-tion with China is cause for concern, the actions implemented thus far are fairly limited and directed at specific industries. More concern would be warranted if either party decides to implement broader trade actions or
worse if China retaliates with currency devaluation or selling US Treasuries. Markets will be watching very closely to assess if President Trump’s bark is worse than his bite.
3. Cracks in FAANG
The dominance of FAANG has permeated headlines in recent years as investors pile in to avoid major FOMO (fear of missing out). Big Tech faltered late in Q1 as Face-book experienced increased regulatory scrutiny following news that 87 million users’ personal information was harvest-ed by a political data firm to produce tar-geted ads. The stock sold off 18% in sub-sequent days and ended the quarter down 9%. The other FAANG stocks sold off in sympathy, most notably Google. For perspective though, the median TTM re-turn for the five stocks is >20% (12-100% range). Trump’s personal sparring with Amazon also adds fuel to the fire. The old adage that the best stocks fall last sent shivers through the market.
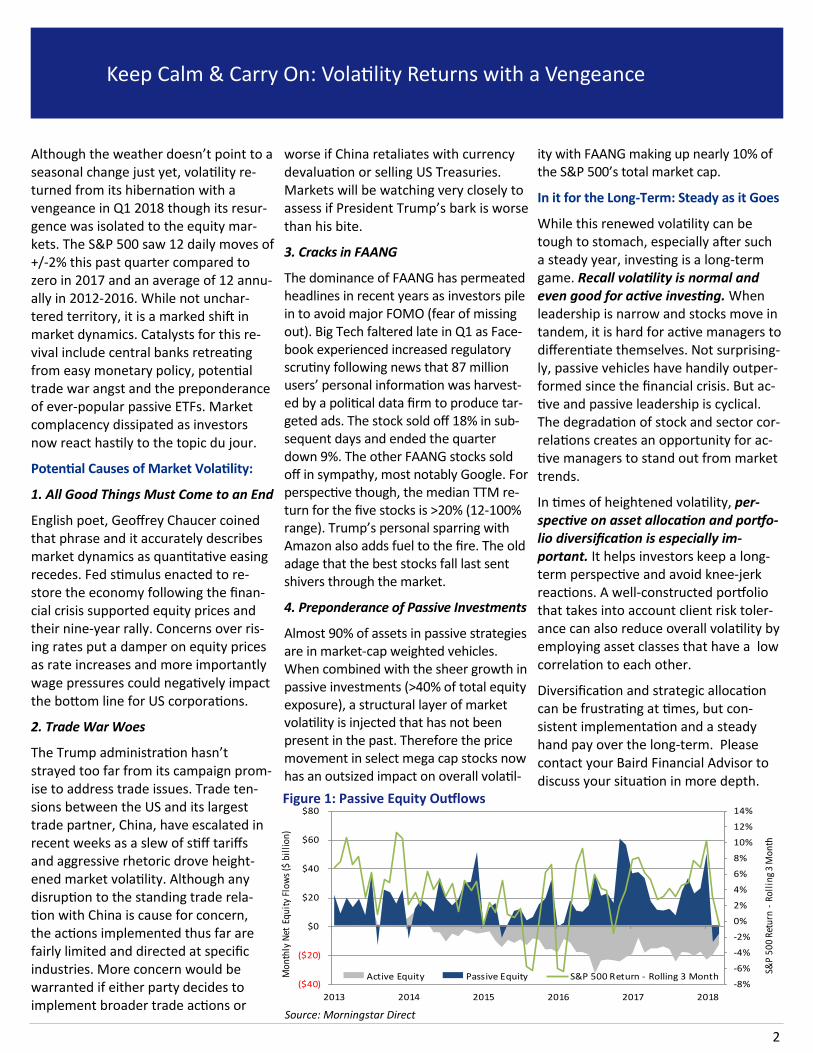
4. Preponderance of Passive Investments
Almost 90% of assets in passive strategies are in market-cap weighted vehicles. When combined with the sheer growth in passive investments (>40% of total equity exposure), a structural layer of market volatility is injected that has not been present in the past. Therefore the price movement in select mega cap stocks now has an outsized impact on overall volatil-
ity with FAANG making up nearly 10% of the S&P 500’s total market cap.
In it for the Long-Term: Steady as it Goes
While this renewed volatility can be tough to stomach, especially after such a steady year, investing is a long-term game. Recall volatility is normal and even good for active investing. When leadership is narrow and stocks move in tandem, it is hard for active managers to differentiate themselves. Not surprising-ly, passive vehicles have handily outper-formed since the financial crisis. But ac-tive and passive leadership is cyclical. The degradation of stock and sector cor-relations creates an opportunity for ac-tive managers to stand out from market trends.
In times of heightened volatility, per-spective on asset allocation and portfo-lio diversification is especially im-portant. It helps investors keep a long-term perspective and avoid knee-jerk reactions. A well-constructed portfolio that takes into account client risk toler-ance can also reduce overall volatility by employing asset classes that have a low correlation to each other.
Diversification and strategic allocation can be frustrating at times, but con-sistent implementation and a steady hand pay over the long-term. Please contact your Baird Financial Advisor to discuss your situation in more depth.
-8%
-6%
-4%
-2%
0%
2%
4%
6%
8%
10%
12%
14%
($40)
($20)
$0
$20
$40
$60
$80
2013 2014 2015 2016 2017 2018
S&P
500
Retu
rn -
Roll
ing
3 M
onth
Mon
thly
Net
Equ
ity
Flow
s ($
bil
lion)
Active Equity Passive Equity S&P 500 Return - Rolling 3 Month
Figure 1: Passive Equity Outflows
Source: Morningstar Direct
3
U.S. Equity
U.S. Equity Market Benchmarks
Performance returns as of 3/31/2018
Equities Notch Quarterly Loss
After a tranquil 2017 and impressive win streak (eight consecutive quarters of posi-tive performance), domestic equity mar-kets faltered in Q1. Broad equity markets fell modestly in the quarter with the S&P 500 declining 0.8%. Investors became more worried about the pace of rising interest rates, the threat of trade wars, and weakness in mega cap Tech.
While many of these risks are still evolv-ing, the headlines spooked a skittish mar-ket that investors fear is long in the tooth. This drove a spike in trading volatility, which is worth noting given its sheer ab-sence in recent years. The current volatili-ty is palpable but not unprecedented.
That said, economic and corporate funda-mentals, key drivers of long-term returns, remain solid as investors gear up for earnings season. Q1 S&P 500 earnings growth is estimated to be +18% (including a mid-single digit tax cut bene-fit), which would be the highest growth rate in over five years. More broadly speaking, the labor market is strong, the economy is growing steadily, inflation remains in check, and the Fed is progress-ing its measured approach to unwinding QE. While still expansionary, investors are monitoring a downtick in regional PMIs as a potential sign of deceleration.
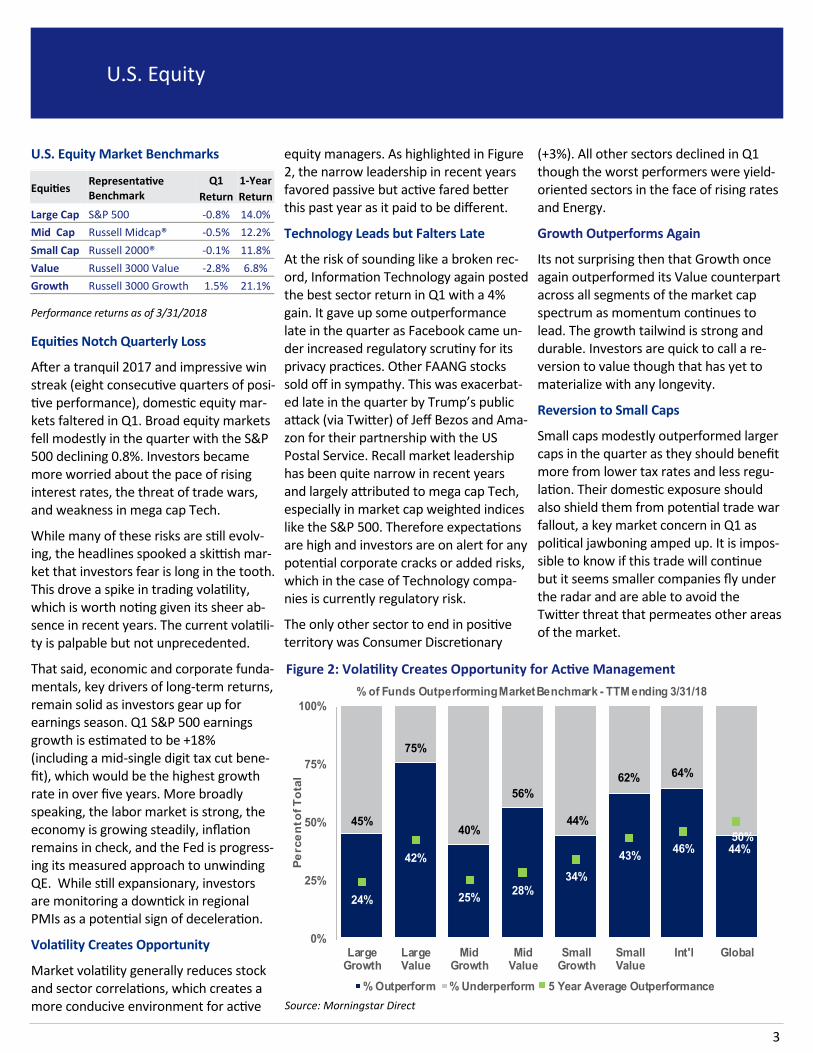
Volatility Creates Opportunity
Market volatility generally reduces stock and sector correlations, which creates a more conducive environment for active
equity managers. As highlighted in Figure 2, the narrow leadership in recent years favored passive but active fared better this past year as it paid to be different.
Technology Leads but Falters Late
At the risk of sounding like a broken rec-ord, Information Technology again posted the best sector return in Q1 with a 4% gain. It gave up some outperformance late in the quarter as Facebook came un-der increased regulatory scrutiny for its privacy practices. Other FAANG stocks sold off in sympathy. This was exacerbat-ed late in the quarter by Trump’s public attack (via Twitter) of Jeff Bezos and Ama-zon for their partnership with the US Postal Service. Recall market leadership has been quite narrow in recent years and largely attributed to mega cap Tech, especially in market cap weighted indices like the S&P 500. Therefore expectations are high and investors are on alert for any potential corporate cracks or added risks, which in the case of Technology compa-nies is currently regulatory risk.
The only other sector to end in positive territory was Consumer Discretionary
(+3%). All other sectors declined in Q1 though the worst performers were yield-oriented sectors in the face of rising rates and Energy.
Growth Outperforms Again
Its not surprising then that Growth once again outperformed its Value counterpart across all segments of the market cap spectrum as momentum continues to lead. The growth tailwind is strong and durable. Investors are quick to call a re-version to value though that has yet to materialize with any longevity.
Reversion to Small Caps
Small caps modestly outperformed larger caps in the quarter as they should benefit more from lower tax rates and less regu-lation. Their domestic exposure should also shield them from potential trade war fallout, a key market concern in Q1 as political jawboning amped up. It is impos-sible to know if this trade will continue but it seems smaller companies fly under the radar and are able to avoid the Twitter threat that permeates other areas of the market.
Equities Representative Benchmark
Q1 1-Year
Return Return
Large Cap S&P 500 -0.8% 14.0%
Mid Cap Russell Midcap® -0.5% 12.2%
Small Cap Russell 2000® -0.1% 11.8%
Value Russell 3000 Value -2.8% 6.8%
Growth Russell 3000 Growth 1.5% 21.1%
45%
75%
40%
56%
44%
62% 64%
44%
24%
42%
25%28%
34%
43%46%
50%
0%
25%
50%
75%
100%
LargeGrowth
LargeValue
MidGrowth
MidValue
SmallGrowth
SmallValue
Int'l Global
Pe
rce
nt o
f T
ota
l
% of Funds Outperforming Market Benchmark - TTM ending 3/31/18
% Outperform % Underperform 5 Year Average Outperformance
Source: Morningstar Direct
Figure 2: Volatility Creates Opportunity for Active Management
4
International Equity
International Market Benchmarks
Performance returns as of 3/31/2018
International Returns Mixed
International markets were largely mixed for the quarter. Softening economic data in Europe and the heightened risk of trade wars drove developed markets, as measured by the MSCI EAFE Index, lower (-1.5%). Emerging markets fared better, increasing 1.4% during the quarter.
Like the US, the best performing sector in international markets continued to be Information Technology, returning 1.8%. Utilities also managed to increase 1.2% during the period. All other sectors fell, with Telecom (-4.1%), Materials (-2.9%), and Consumer Staples (-2.8%) dropping the most.
Developed Markets Face Challenges
European equities fell 1.9%, with several key European markets, including Germany, the United Kingdom, and Switzerland, declining more than 3% in Q1. The Euro Area in particular faces uncertainty ahead: the ECB’s bond purchasing program is winding down at a time when economic growth—although still in expansionary territory—is starting to slow. Additionally, Europe became more divided politically. Anti-establishment parties gained ground in the recent Italian elections, resulting in a hung parliament. Despite the political uncertainty, consumer confidence in Italy actually rose to a two-year high and markets increased 5.4%, bucking the trend of its European peers.
In Japan, stocks modestly rose 1% in the quarter, outperforming other developed countries. Markets climbed even as Prime Minister Abe, famed for his pro-growth “Abenomics” policies, faced an alleged cover-up, which resulted in a sharp fall in approval ratings. Despite some increased risks in the developed world, economies are growing, corporate profits are increasing, and price-to-earnings ratios have fallen to more attractive levels: 15x for developed international versus 22x for the US.
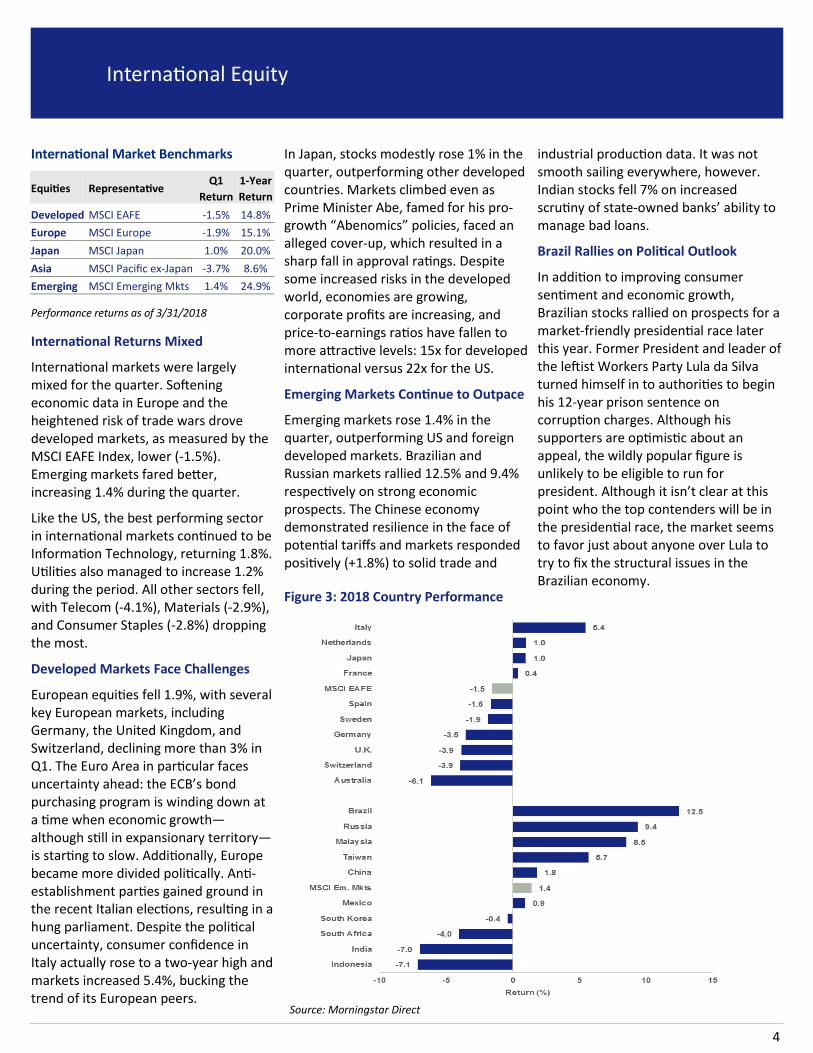
Emerging Markets Continue to Outpace
Emerging markets rose 1.4% in the quarter, outperforming US and foreign developed markets. Brazilian and Russian markets rallied 12.5% and 9.4% respectively on strong economic prospects. The Chinese economy demonstrated resilience in the face of potential tariffs and markets responded positively (+1.8%) to solid trade and
Figure 3: 2018 Country Performance
industrial production data. It was not smooth sailing everywhere, however. Indian stocks fell 7% on increased scrutiny of state-owned banks’ ability to manage bad loans.
Brazil Rallies on Political Outlook
In addition to improving consumer sentiment and economic growth, Brazilian stocks rallied on prospects for a market-friendly presidential race later this year. Former President and leader of the leftist Workers Party Lula da Silva turned himself in to authorities to begin his 12-year prison sentence on corruption charges. Although his supporters are optimistic about an appeal, the wildly popular figure is unlikely to be eligible to run for president. Although it isn’t clear at this point who the top contenders will be in the presidential race, the market seems to favor just about anyone over Lula to try to fix the structural issues in the Brazilian economy.
Source: Morningstar Direct
Equities Representative Q1 1-Year
Return Return
Developed MSCI EAFE -1.5% 14.8%
Europe MSCI Europe -1.9% 15.1%
Japan MSCI Japan 1.0% 20.0%
Asia MSCI Pacific ex-Japan -3.7% 8.6%
Emerging MSCI Emerging Mkts 1.4% 24.9%
5
Fixed Income
©2018 Robert W. Baird & Co., Incorporated. Member SIPC. MC-76300W.
Robert W. Baird & Co., Incorporated. 777 East Wisconsin Avenue, Milwaukee, Wisconsin 53202. 1-800-RW-BAIRD. www.rwbaird.com
First Use: 07/2016.
U.S. Fixed Income Benchmarks
Performance returns as of 03/31/2018
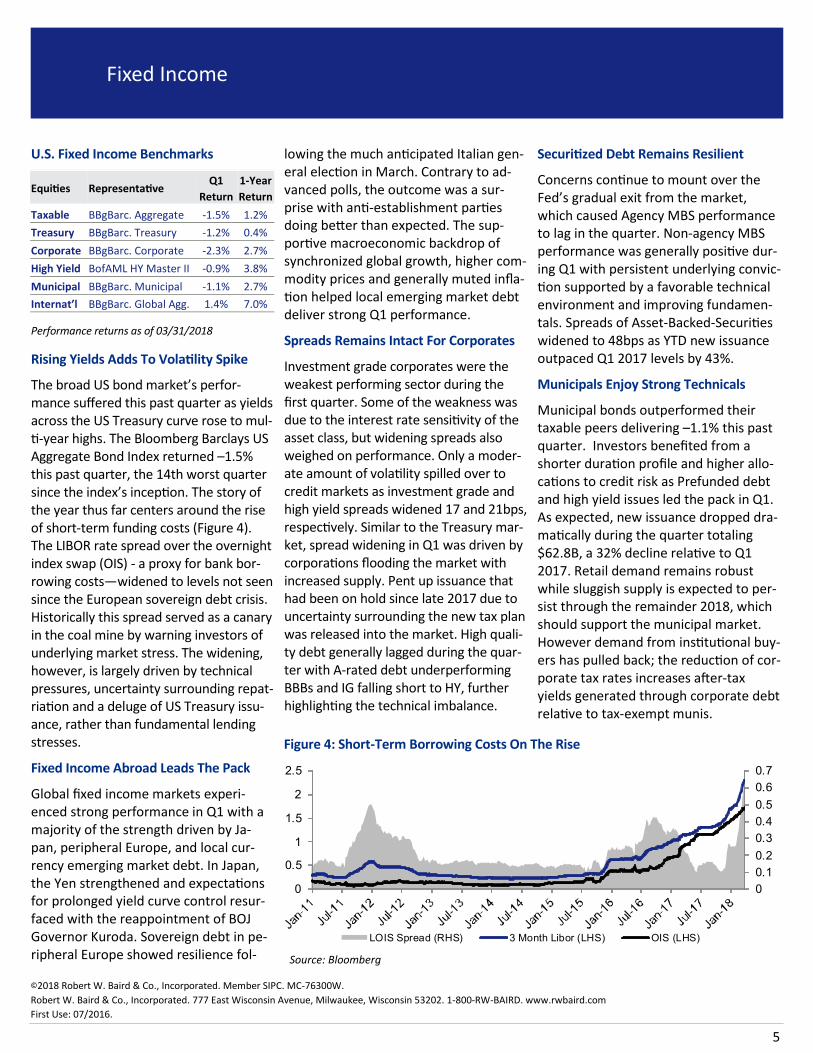
Rising Yields Adds To Volatility Spike
The broad US bond market’s perfor-mance suffered this past quarter as yields across the US Treasury curve rose to mul-ti-year highs. The Bloomberg Barclays US Aggregate Bond Index returned –1.5% this past quarter, the 14th worst quarter since the index’s inception. The story of the year thus far centers around the rise of short-term funding costs (Figure 4). The LIBOR rate spread over the overnight index swap (OIS) - a proxy for bank bor-rowing costs—widened to levels not seen since the European sovereign debt crisis. Historically this spread served as a canary in the coal mine by warning investors of underlying market stress. The widening, however, is largely driven by technical pressures, uncertainty surrounding repat-riation and a deluge of US Treasury issu-ance, rather than fundamental lending stresses.
Fixed Income Abroad Leads The Pack
Global fixed income markets experi-enced strong performance in Q1 with a majority of the strength driven by Ja-pan, peripheral Europe, and local cur-rency emerging market debt. In Japan, the Yen strengthened and expectations for prolonged yield curve control resur-faced with the reappointment of BOJ Governor Kuroda. Sovereign debt in pe-ripheral Europe showed resilience fol-
lowing the much anticipated Italian gen-eral election in March. Contrary to ad-vanced polls, the outcome was a sur-prise with anti-establishment parties doing better than expected. The sup-portive macroeconomic backdrop of synchronized global growth, higher com-modity prices and generally muted infla-tion helped local emerging market debt deliver strong Q1 performance.
Spreads Remains Intact For Corporates
Investment grade corporates were the weakest performing sector during the first quarter. Some of the weakness was due to the interest rate sensitivity of the asset class, but widening spreads also weighed on performance. Only a moder-ate amount of volatility spilled over to credit markets as investment grade and high yield spreads widened 17 and 21bps, respectively. Similar to the Treasury mar-ket, spread widening in Q1 was driven by corporations flooding the market with increased supply. Pent up issuance that had been on hold since late 2017 due to uncertainty surrounding the new tax plan was released into the market. High quali-ty debt generally lagged during the quar-ter with A-rated debt underperforming BBBs and IG falling short to HY, further highlighting the technical imbalance.
Securitized Debt Remains Resilient
Concerns continue to mount over the Fed’s gradual exit from the market, which caused Agency MBS performance to lag in the quarter. Non-agency MBS performance was generally positive dur-ing Q1 with persistent underlying convic-tion supported by a favorable technical environment and improving fundamen-tals. Spreads of Asset-Backed-Securities widened to 48bps as YTD new issuance outpaced Q1 2017 levels by 43%.
Municipals Enjoy Strong Technicals
Municipal bonds outperformed their taxable peers delivering –1.1% this past quarter. Investors benefited from a shorter duration profile and higher allo-cations to credit risk as Prefunded debt and high yield issues led the pack in Q1. As expected, new issuance dropped dra-matically during the quarter totaling $62.8B, a 32% decline relative to Q1 2017. Retail demand remains robust while sluggish supply is expected to per-sist through the remainder 2018, which should support the municipal market. However demand from institutional buy-ers has pulled back; the reduction of cor-porate tax rates increases after-tax yields generated through corporate debt relative to tax-exempt munis.
Equities Representative Q1 1-Year
Return Return
Taxable BBgBarc. Aggregate -1.5% 1.2%
Treasury BBgBarc. Treasury -1.2% 0.4%
Corporate BBgBarc. Corporate -2.3% 2.7%
High Yield BofAML HY Master II -0.9% 3.8%
Municipal BBgBarc. Municipal -1.1% 2.7%
Internat’l BBgBarc. Global Agg. 1.4% 7.0%
0
0.1
0.2
0.3
0.4
0.5
0.6
0.7
0
0.5
1
1.5
2
2.5
LOIS Spread (RHS) 3 Month Libor (LHS) OIS (LHS)
Figure 4: Short-Term Borrowing Costs On The Rise
Source: Bloomberg