pyramid analytics training - pepperdine community backstage is considered the common interface...
TRANSCRIPT

Blackboard Inc. Confidential – All Rights Reserved Page | 1
Analytics Training

Blackboard Inc. Confidential – All Rights Reserved Page | 2
• Basic Navigation: Backstage 3 o Home 3 o Contents Management Areas 4
• Basic Navigation: Dashboard Workspace 7 o Overview of Dashboard 7 o Open a Dashboard 8 o Dashboard Navigation 8
Drill: Drill down, Drill Up, Drill to Level 8 Action List/Cell Action List (Drill to Detail) 10 Dice 11 Expand Down/Collapse 12 Member Selections: Focus, Eliminate 13 Sorting and Filtering - Quick Sort/Filter 14
16 o Printing Report 17
Table of Contents
Conditional Formatting
Blackboard Inc. Confidential – All Rights Reserved
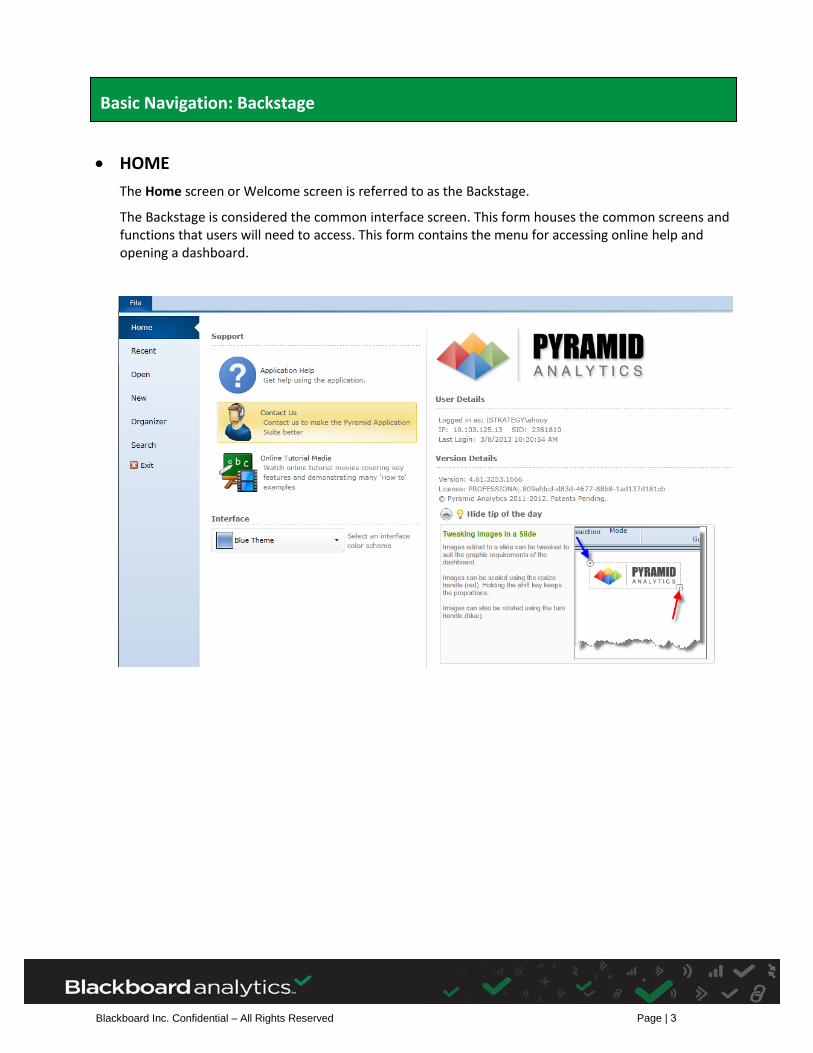
• HOMEThe Home screen or Welcome screen is referred to as the Backstage.
The Backstage is considered the common interface screen. This form houses the common screens andfunctions that users will need to access. This form contains the menu for accessing online help andopening a dashboard.
Basic Navigation: Backstage
Page | 3

Blackboard Inc. Confidential – All Rights Reserved
• CONTENT MANAGEMENTA. Recent – The Recent Content will list the books and dashboards that you have recently accessed. Once you place your cursor on a book or dashboard, the Items area will be populated.
Page | 4

Blackboard Inc. Confidential – All Rights Reserved
B. Open – To open a report or dashboard.
Public Content area provides a hierarchical tree listing that is READ access only. The listingof contents is segmented into Personal, group, and public. Based upon security, you maynot have access to all folders.
o Personal Content is content that you have created and saved. This is your ownpersonal workspace. Others do not have access to your Personal Contents.
o Group Content is available to super users and represents a workspace appropriatefor super users.
o Public Content is available to all users. However only the Office of BusinessIntelligence can publish content to this domain.
Page | 5

Blackboard Inc. Confidential – All Rights Reserved
C. Distribute – To Print, export, and share content.
Print Content – This feature places the selected report into a PDF format which can thenbe printed.
Export Content – This feature will export the report/dashboard to MS Excel or MSPowerPoint.
Send Email Link – This feature enables you to send an email that will have a hyperlink tothe report or dashboard. (Note: the email recipient must have the appropriate security toview the report).
D. Search – Provides a search interface for finding content based on keywords or other criteria.
Page | 6

Blackboard Inc. Confidential – All Rights Reserved Page | 7
• Overview of Dashboard
1.
2.
3. More Info – Links to additional documentation about each report and dashboard is available byclicking the More Info button.
Basic Navigation: Dashboard Workspace
4. Steering Wheel – A radial menu for end users to accessfunctions in the dashboard during runtime.
a. Help: (purple) This function launches the onlinehelp menu.
b. Reset All Panels: (yellow) This resets all panels on theslide to their original settings.
c. Re-run All Queries: (green) This re-runs all queries onthe current slide based on their current settings.
d. Export/Print: (red) This function provides a dialog forend users to print or export the current dashboard.See distribution for more.
e. Return to home: (blue) This function is present whenthe current dashboard was launched from either thedesigner interface or the backstage.
Slicers – Slicers, in effect, provide a mechanism for end users to FILTER their report.
Slides – Every dashboard consists of at least one slide. To view all of the information on each slide click on the appropriate tab.

Blackboard Inc. Confidential – All Rights Reserved Page | 8
• Open a DashboardA. From the Backstage area, click on ‘Open’.
B. Click on the Domain of the report location. (Personal, Group, Public)
C. Click to open the appropriate folder and book.
D. Double click on the dashboard you wish to view.
• Dashboard NavigationA. Drill – The Drill features allow you the ability to see specific details of the data for further data analysis.
(Starting report sample)
1. Drill Down – Drills down the current element to its child elements. If no childelements, this feature is disabled.
i. Left click on the element within the report or right click on the element andthe Context Menu will appear.
ii. Click on the “Drill Down” option from the Context Menu.
iii. Results:
(Results of Drill Down (Click) on ‘Canceled’ element)

Blackboard Inc. Confidential – All Rights Reserved Page | 9
2. Drill Up – Drills up to the parent level.
i. Right click on the element within the report and click on the “Drill Up” option fromthe Context Menu.
ii. Results:
3. Drill to Level – Drills down to the descendants of a selected member at the level chosenfrom the sub menu.
i. Right click on the element and click on the “Drill to Level” option from the ContextMenu.
ii. Results:
(Results of Drill to Level on ‘Program Action’ )

Blackboard Inc. Confidential – All Rights Reserved Page | 10
4. Actions (Drill to Detail) – Exposes cube defined 'actions' on the rows, columns or cells.Action Lists represent DRILLTHROUGH, URL/ Reporting Service and Row-set actionsrespectively in the Actions sub-menu. The Action List may not be available for all elements.
i. Right click on the row or column header. The Context Menu will appear, click on“Action List” (a.). If you right click on a specific cell/value, the submenu appear (b.),then select the drill.
a. b.
ii. Results:

Blackboard Inc. Confidential – All Rights Reserved Page | 11
B. Dice – Takes current element and filters/sub-sets by that element; while putting the selected hierarchy in its place.
1. Right click on the element and select ‘Dice’ from the Context Menu. A list of dimensionswill appear. Click on a selected dimension. The hierarchies for the dimension nowappear. Click on a hierarchy level you wish to use.
2. Results:
(Results of Dice on Academic Level -> Academic Level Type )
Blackboard Inc. Confidential – All Rights Reserved Page | 12
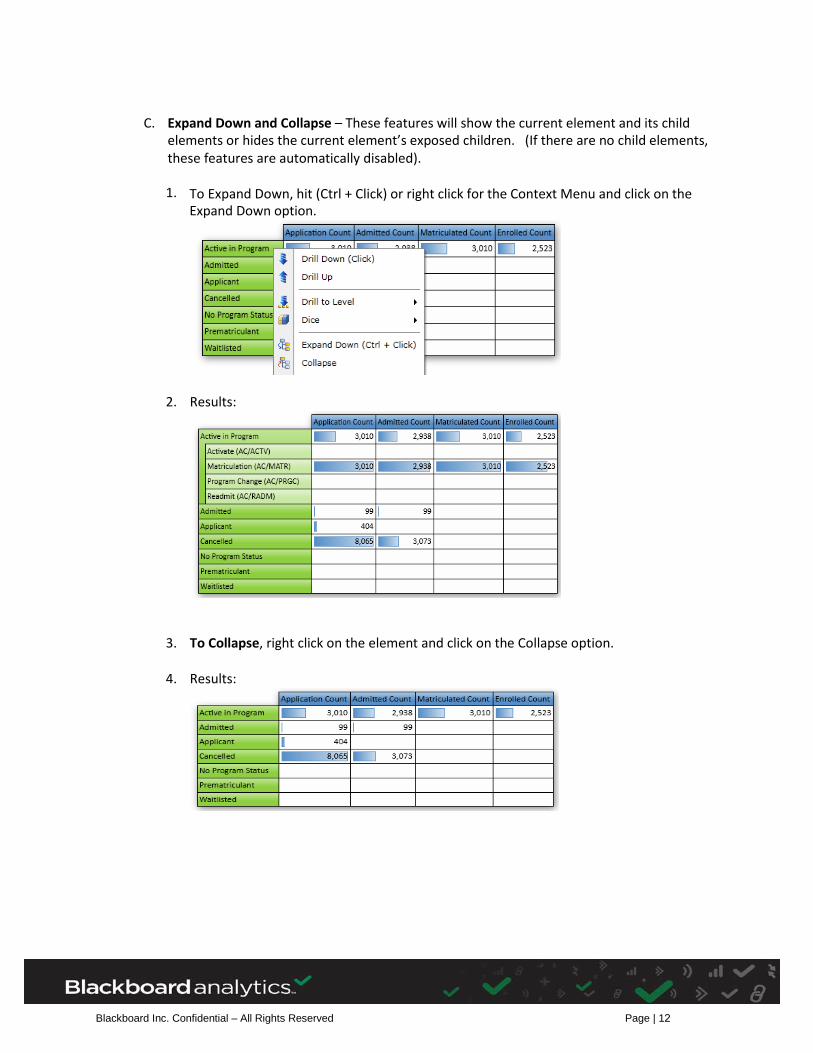
C. Expand Down and Collapse – These features will show the current element and its child elements or hides the current element’s exposed children. (If there are no child elements, these features are automatically disabled).
1. To Expand Down, hit (Ctrl + Click) or right click for the Context Menu and click on theExpand Down option.
2. Results:
3. To Collapse, right click on the element and click on the Collapse option.
4. Results:

Blackboard Inc. Confidential – All Rights Reserved Page | 13
D. Member Selections – The Member Selections feature allow you to Focus or Eliminate specific elements within the report. The Focus options will allow you to focus on one or more elements whereas the Eliminate option will eliminate one or more specific elements from the report.
1. Focus on a specific element or row:i. Right click on the element and the Context Menu will appear. Click on the
Member Selection option and then click on Focus or Focus on Entire Row.
ii. Results:
2. Focus & Ascendants – Keeps the selected element and returns all its parent elements upto the top of the hierarchy tree.
i. Right click on the element and the Context Menu will appear. Click on theMember Selection option and then click on Focus & Ascendants.
ii. Results:
3. Focus & Descendants – Keeps the selected element and returns the entire tree ofdescendants at ALL levels below this element.
i. Right click on the element and the Context Menu will appear. Click on theMember Selection option and then click on Focus & Descendants.
ii. Results:

Blackboard Inc. Confidential – All Rights Reserved Page | 14
4. Eliminate – Eliminates the selected element, leaving all others in the hierarchy.
i. Right click on the element and the Context Menu will appear. Click on theMember Selection option and then click on Eliminate.
ii. Results:
(Eliminated Prematriculated)
E. Sorting and Filtering – You can sort and/or filter the data easily by using the Quick Sort and Quick Filter options. There are additional sorting and filtering options for the rows and columns within the Query Ribbon.
1. Quick Sort – Provides a context sensitive sorting of the rows or columns based on the values or on the labels of the element as the sort criteria.
i. Right click on the column or row you are sorting. The Context Menu willappear. Click on the Quick Sort option and click on the option to sort by theValues or by the Labels. Click on either Sort Ascending or Sort Descending.

Blackboard Inc. Confidential – All Rights Reserved Page | 15
ii. Results:
(Sort done on column ‘Application Count’, Sort Values, Sort Descending)
2. Quick Filter – Provides a context sensitive filtering of the rows or columns based on the selected elements as the filter criteria. Filters are TopCount / BottomCount or TopPercent / BottomPercent.
i. Right click on the column or row you are filtering. The Context Menu will appear. Click on the Quick Filter option and click on the option to filter by Show Top or Show Bottom values.
ii. Results:
(Quick Filter done on column ‘Application Count’, Show Top 5)
Blackboard Inc. Confidential – All Rights Reserved Page | 16
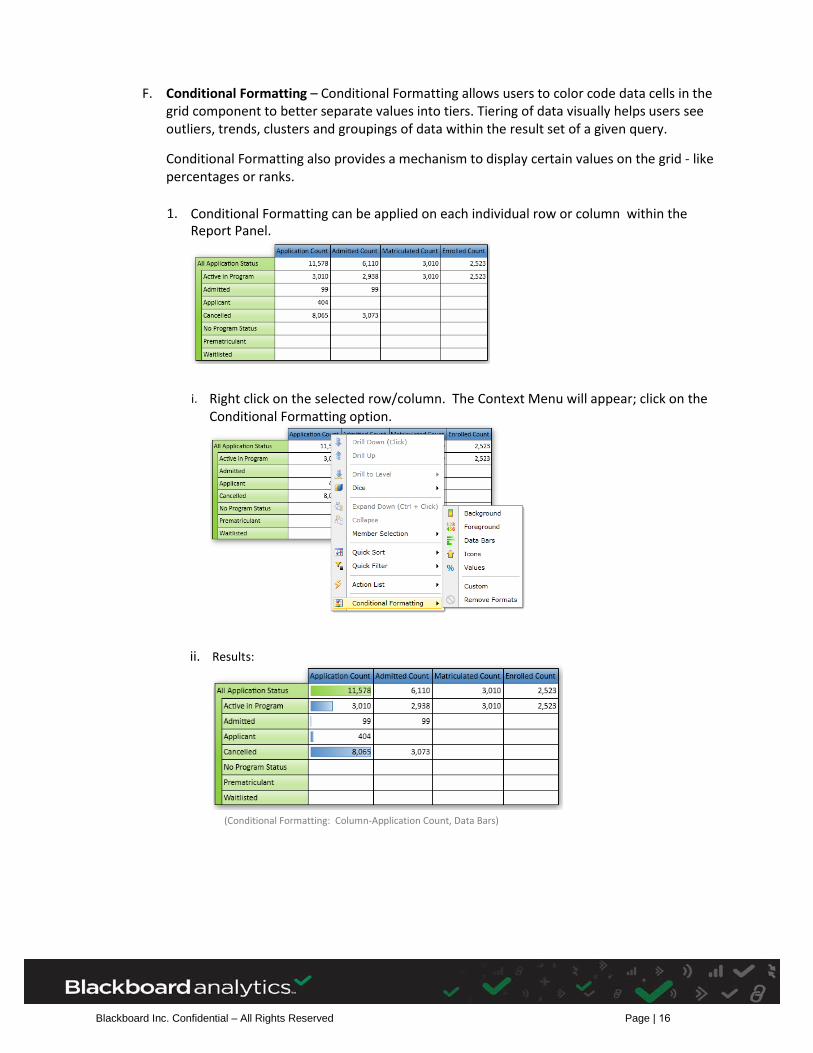
F. Conditional Formatting – Conditional Formatting allows users to color code data cells in the grid component to better separate values into tiers. Tiering of data visually helps users see outliers, trends, clusters and groupings of data within the result set of a given query.
Conditional Formatting also provides a mechanism to display certain values on the grid - like percentages or ranks.
1. Conditional Formatting can be applied on each individual row or column within theReport Panel.
i. Right click on the selected row/column. The Context Menu will appear; click on theConditional Formatting option.
ii. Results:
(Conditional Formatting: Column-Application Count, Data Bars)

Blackboard Inc. Confidential – All Rights Reserved Page | 17
• Printing a ReportA. To print a report, open the report.
B. Click on the ‘File’ tab of the Ribbon Panel. This will take you to the Backstage area.
C. Click on ‘Distribute’ within the Backstage area.
D. Click on the Print button. Once completed you will be prompted to save the print file to your local or network drive. Enter a name for the print file.
E. To print a hard copy, open the saved print file (PDF or XPS) and print.