q1 2015 te connectivity ltd. earnings conference call
TRANSCRIPT

Q1 2015 Earnings and Broadband Networks DivestitureJanuary, 2015

Forward-Looking StatementsThis presentation contains certain “forward-looking statements” within the meaning of the U.S. Private Securities Litigation Reform Act of 1995. These statements are based on management’s current expectations and are subject to risks, uncertainty and changes in circumstances, which may cause actual results, performance, financial condition or achievements to differ materially from anticipated results, performance, financial condition or achievements. All statements contained herein that are not clearly historical in nature are forward-looking and the words “anticipate,” “believe,” “expect,” “estimate,” “plan,” and similar expressions are generally intended to identify forward-looking statements. We have no intention and are under no obligation to update or alter (and expressly disclaim any such intention or obligation to do so) our forward-looking statements whether as a result of new information, future events or otherwise, except to the extent required by law. The forward-looking statements in this presentation include statements addressing our future financial condition and operating results and our planned sale of the Broadband Network Solutions business. Examples of factors that could cause actual results to differ materially from those described in the forward-looking statements include, among others, business, economic, competitive and regulatory risks, such as conditions affecting demand for products, particularly in the automotive industry and the telecommunications networks and consumer devices industries; competition and pricing pressure; fluctuations in foreign currency exchange rates and commodity prices; natural disasters and political, economic and military instability in countries in which we operate; developments in the credit markets; future goodwill impairment; compliance with current and future environmental and other laws and regulations; the possible effects on us of changes in tax laws, tax treaties and other legislation; the risk that the operations of Measurement Specialties will not be successfully integrated into ours; the risk that revenue opportunities, cost savings and other anticipated synergies from the Measurement Specialties acquisition may not be fully realized or may take longer to realize than expected; and the risk that the sale of the Broadband Network Solutions business may not be consummated, or if consummated, we do not realize the anticipated benefits from such transaction. More detailed information about these and other factors is set forth in TE Connectivity Ltd.’s Annual Report on Form 10-K for the fiscal year ended Sept. 26, 2014 as well as in our Quarterly Reports on Form 10-Q, Current Reports on Form 8-K, and other reports filed by us with the U.S. Securities and Exchange Commission.
Non-GAAP MeasuresWhere we have used non-GAAP financial measures, reconciliations to the most comparable GAAP measure are provided, along with a disclosure on the usefulness of the non-GAAP measure, in this presentation.
Forward-Looking Statementsand Non-GAAP Measures
2

BNS Divestiture Overview
3

• Continues our focus on expanding leadership in connectors and sensors
• $165B market, where TE has the broadest portfolio of products & solutions
• Results in approximately 90% of TE's portfolio providing leading connectivity and sensor solutions
• Increases focus on harsh environment applications
• Highly engineered solutions growing to 80% of company total revenues vs. 70% today and 50% several years ago
• Intend to use the majority of the sale proceeds for share repurchase
• Reinforces strong growth and profitability profile for TE going forward
Strategic Rationale for the Sale of BNS
4
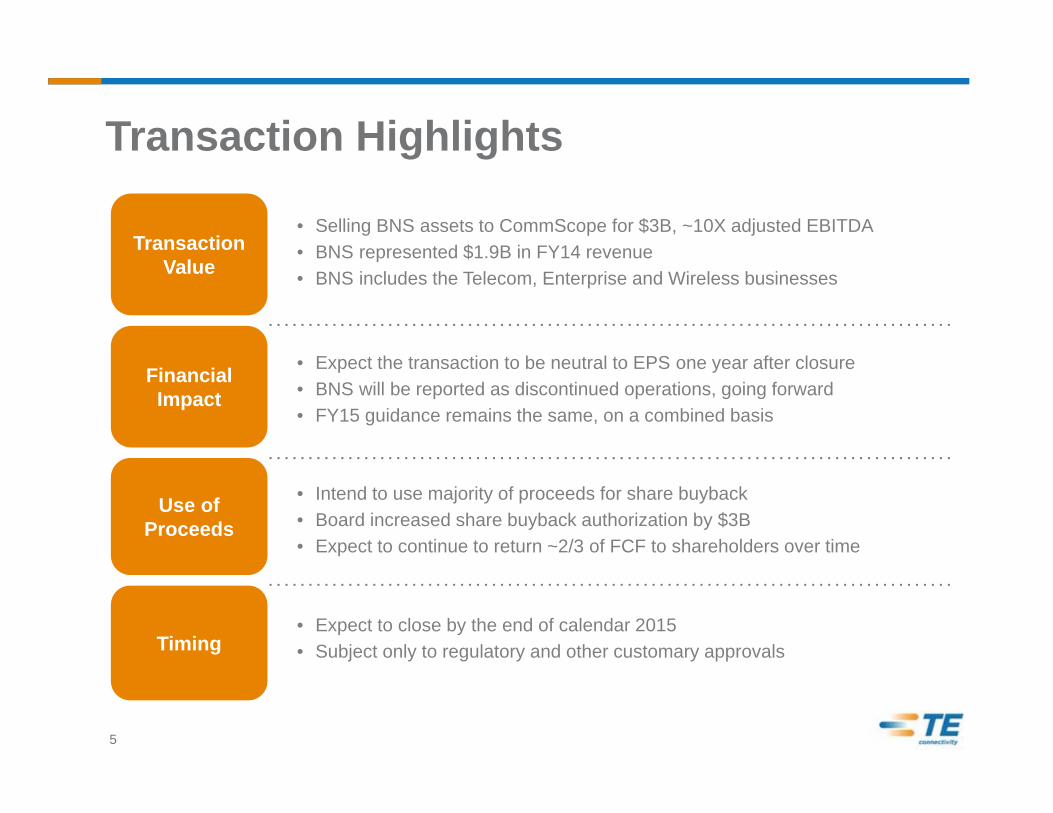
• Selling BNS assets to CommScope for $3B, ~10X adjusted EBITDA• BNS represented $1.9B in FY14 revenue• BNS includes the Telecom, Enterprise and Wireless businesses
• Expect the transaction to be neutral to EPS one year after closure• BNS will be reported as discontinued operations, going forward• FY15 guidance remains the same, on a combined basis
• Intend to use majority of proceeds for share buyback• Board increased share buyback authorization by $3B• Expect to continue to return ~2/3 of FCF to shareholders over time
• Expect to close by the end of calendar 2015• Subject only to regulatory and other customary approvals
Transaction Value
Financial Impact
Use of Proceeds
Timing
Transaction Highlights
5

Q1 2015 Results & Guidance
6

Strong Q1 Results• Sales $3.47B, up 4% Y/Y; Adjusted EPS up 20% to $0.98 Y/Y, a record for Q1• Free Cash Flow $162M; Returned $259M to shareholders
Harsh Environment Focus Driving Growth• Harsh environment revenue up 10% versus prior year
TEOA Delivering Strong Margins• 34.6% adjusted gross margin, up 100 basis points vs prior year• Adjusted Operating Margin 16.0%, Up 140 bps vs prior year
Established TE as a Leader in Sensors• Acquisitions performing ahead of plan
Reiterating Full Year EPS Outlook Despite FX Headwinds• Maintaining adjusted EPS range of $4.05 - $4.35, up 11% vs prior year• Raising FY15 organic revenue guidance by $150M, up 6% vs prior year• FY15 FX headwinds now total $900M in revenue and $0.35 in EPS
Adjusted EPS, Adjusted Operating Margin, Adjusted Gross Margin, and Free Cash Flow are non-GAAP measures; see Appendix for description and reconciliation.
Harsh Driving Growth, TEOA Driving Profitability
Q1 2015 Summary
7

Y/Y Growth Rates Actual Organic
Automotive $1,227 3% 8%
CommercialTransportation $206 3% 7%
Sensors $179 273% 7%*
Transportation Solutions $1,612 12% 8%
$ in Millions
Revenue
• Revenue up 8% organically on 0.5% auto production growth, driven by continued content growth and share gains
• Growth in Automotive and Commercial Trans. driven by strength in US and China
• Sensor growth ahead of expectations with new wins across multiple market segments
• TEOA driving margin improvement
Business Performance
20.6% 21.4%
Q1 2014 Q1 2015
Actual
Up 12%Organic
Up 8%Actual Organic
Orders $1,668 14% 9%
Adjusted Operating MarginAdjusted Operating Income
$345M,Up 16%
1,440 1,612
Q1 2014 Q1 2015
*Sensors organic sales growth represents TE’s organic sensors business, excluding the impact of the Measurement Specialties and AST acquisitions and changes in foreign currency exchange rates
Organic Sales Growth, Adjusted Operating Income, and Adjusted Operating Margin are non-GAAP measures;see Appendix for description and reconciliation.
Transportation Solutions
8
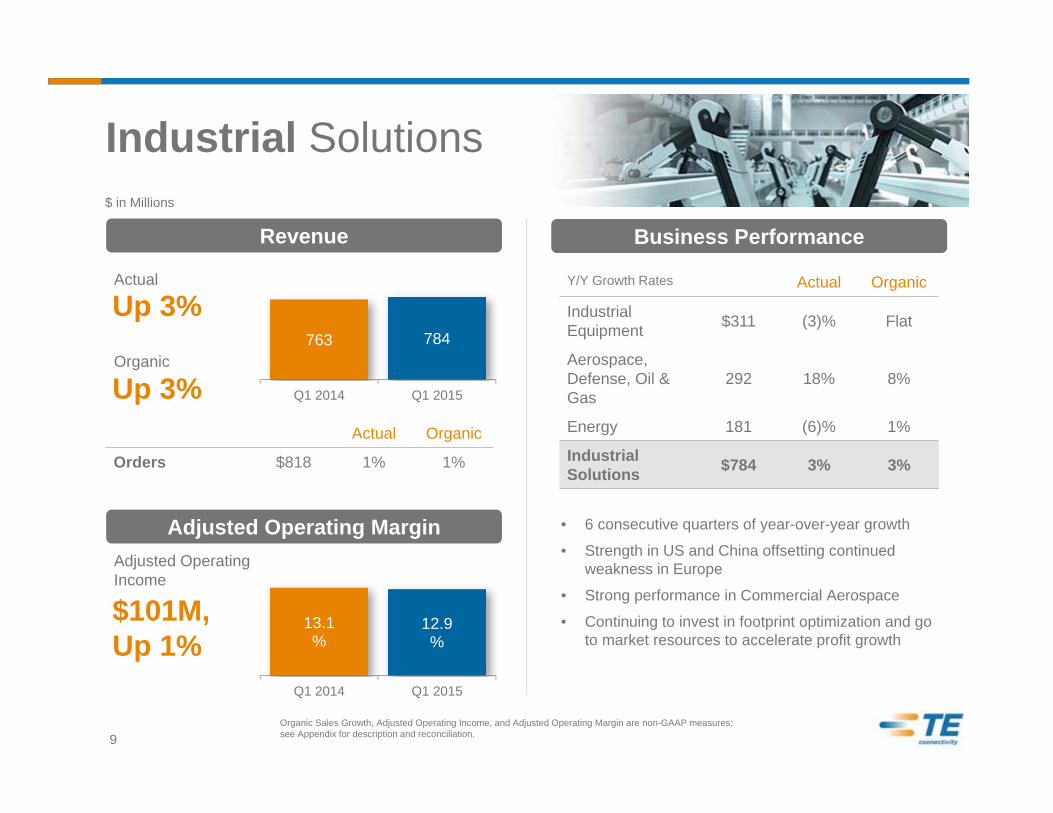
13.1%
12.9%
Q1 2014 Q1 2015
763 784
Q1 2014 Q1 2015
Y/Y Growth Rates Actual Organic
Industrial Equipment $311 (3)% Flat
Aerospace, Defense, Oil & Gas
292 18% 8%
Energy 181 (6)% 1%
Industrial Solutions $784 3% 3%
$ in Millions
Revenue
• 6 consecutive quarters of year-over-year growth
• Strength in US and China offsetting continued weakness in Europe
• Strong performance in Commercial Aerospace
• Continuing to invest in footprint optimization and go to market resources to accelerate profit growth
Business Performance
Actual
Up 3%Organic
Up 3%Actual Organic
Orders $818 1% 1%
Adjusted Operating MarginAdjusted Operating Income
$101M,Up 1%
Organic Sales Growth, Adjusted Operating Income, and Adjusted Operating Margin are non-GAAP measures;see Appendix for description and reconciliation.
Industrial Solutions
9

7.2% 8.8%
Q1 2014 Q1 2015
713 704
Q1 2014 Q1 2015
Y/Y Growth Rates Actual Organic
BroadbandNetworks(Telecom & Enterprise)
$417 (10)% (6)%
Data Communications 153 (7)% (4)%
Subsea Communications 134 57% 57%
Network Solutions $704 (1)% 2%
$ in Millions
Revenue
• SubCom business building momentum
• Broadband Networks strength in North America offset by project delays in Europe & South America
• Data Communications continues to be impacted by market weakness
• 160 bps adjusted operating margin expansion on productivity gains
Business Performance
Actual
Down 1%Organic
Up 2%Actual Organic
Orders $863 19% 23%
Adjusted Operating MarginAdjusted Operating Income
$62M,Up 22%
Organic Sales Growth, Adjusted Operating Income, and Adjusted Operating Margin are non-GAAP measures;see Appendix for description and reconciliation.
Network Solutions
10

9.3%12.8%
Q1 2014 Q1 2015
410 366
Q1 2014 Q1 2015
Y/Y Growth Rates Actual Organic
ConsumerDevices $208 (20)% (17)%
Appliances 158 4% 7%
Consumer Solutions $366 (11)% (9)%
$ in Millions
Revenue
• Continued strong performance in our market-leading Appliances business
• Being selective on new programs in Consumer Devices; exiting lower margin businesses
• 350 bps adjusted operating margin expansion driven by Appliances strength, productivity, and product rationalization in Consumer Devices
Business Performance
Actual
Down 11%Organic
Down 9%Actual Organic
Orders $363 (12)% (10)%
Adjusted Operating MarginAdjusted Operating Income
$47M,Up 24%
Organic Sales Growth, Adjusted Operating Income, and Adjusted Operating Margin are non-GAAP measures;see Appendix for description and reconciliation.
Consumer Solutions
11

Adjusted Operating Income, Adjusted Operating Margin and Adjusted EPS are non-GAAP measures;see Appendix for description.
($ in Millions, except per share amounts) Q1 FY14 Q1 FY15
Net Sales $ 3,326 $ 3,466
Operating Income $ 479 $ 477
Acquisition Related Charges - 51
Restructuring & Other Charges, net 7 27
Adjusted Operating Income $ 486 $ 555
Operating Margin 14.4% 13.8%
Adjusted Operating Margin 14.6% 16.0%
GAAP Earnings Per Share $ 0.85 $ 1.14
Acquisition Related Charges - 0.09
Restructuring & Other Charges, net 0.01 0.06
Tax Items (0.04) (0.31)
Adjusted EPS $ 0.82 $ 0.98
20% Adjusted EPS Growth with 16% Adjusted Operating Margins
Q1 Financial Summary
12

$ in Millions
Adjusted Gross Margin Percentage
• Adjusted Gross Margin increases 100bps with productivity gains from TEOA initiatives and leverage on additional volume
• Adjusted Operating margin expansion driven by productivity and operating expense leverage
• FCF impacted by timing of tax payments and SubCom project activity
Adjusted Operating Margin
Free Cash Flow
Adjusted Gross Margin Percentage, Free Cash Flow, and Adjusted Operating Margin are non-GAAP measures; See Appendix for description and reconciliation.
33.6%
34.6%
Q1 2014 Q1 2015
266162
Q1 2014 Q1 2015
14.6%
20.0%
Q1 2014 Q1 2015
16.0%
TE Operating Advantage (TEOA)
13

Revenue Guidance
Revenue up 6% organically, with 5% adjusted EPS growth versus prior year
Transportation Solutions
IndustrialSolutions
NetworkSolutions
ConsumerSolutions
TE Connectivity
Highlights
Revenue $3.55B to $3.65BAdjusted EPS $.98 to $1.02
• Revenue up 5% Actual and 6% Organic• Acquisition Revenue more than offset by $250M FX impact• Adjusted EPS up 3-7%, includes ~$0.10 FX headwind
• Continued strong performance in Transportation, with growth well in excess of 1% auto production growth
• Expect continued strength in Commercial Aerospace and improved Industrial Equipment demand to offset slight weakness in Oil & Gas
• SubCom momentum continues with sales of ~$175M in Q2
• Another quarter of solid growth expected in Appliances
• Continue to be selective with opportunities in Consumer Devices
Up Mid Single DigitsUp Mid Single Digits Organic
Up Mid TeensUp High Teens Organic
Down High Single DigitsDown Mid Single Digits Organic
Up Low Single DigitsUp Mid Single Digits Organic
* Assumes foreign exchange rates and commodity prices that are consistent with current levels** Organic Sales Growth and Adjusted EPS are non-GAAP measures; see Appendix for description and reconciliation.
Q2 Outlook* (Includes BNS)
14

Organic Revenue up 6% with 11% Adjusted EPS growth versus prior year
Revenue of $14.45 - $14.85BAdjusted EPS of $4.05 - $4.35
• Revenue up 5% at midpoint, up 6% organic• FX impacting revenue by ~$900M at current rates• Adjusted EPS up 11% at midpoint, with ~$0.35 FX
headwind
• Expect harsh revenue growth as strong momentum continues in Automotive, Commercial Transportation, Aerospace, Industrial Equipment, and Appliances
• Transportation growth expected to be well ahead of Global auto production growth of 2-3% Y/Y
• Expect Sensor business to exit year at ~$1B annual run rate
• SubCom revenues now expected to be ~$650M
• Benefit of lower commodity prices impacts financials later in the year
• Strong organic growth more than offsetting $.35 FX headwind
Up High Single DigitsUp Mid Single Digits Organic
Up High Single DigitsUp Mid Teens Organic
Down High Single DigitsDown Low Single Digits Organic
Up Low Single DigitsUp Mid Single Digits Organic
* Assumes foreign exchange rates and commodity prices that are consistent with current levels ** Organic Sales Growth and Adjusted EPS are non-GAAP measures; see Appendix for description and reconciliation.
FY15 Outlook* (Includes BNS)Revenue Guidance
Transportation Solutions
IndustrialSolutions
NetworkSolutions
ConsumerSolutions
TE Connectivity
Highlights
15

TE Connectivity, Going Forward
16

Unmatched Connectivity and Sensor Portfolio
Increased focus on Harsh environment applications
Central to IoT and increasingly connected world
Delivering extraordinary customer experiences
Strongly positioned in growth markets
Today’s products are SAFER, GREENER, SMARTER AND MORE CONNECTED. These megatrends are driving the demand for electronics and more TE products.
$165 BILLION Connectivity and Sensor Market
17
World Leader Enabling Connectivity

Automotive – Megatrends of safe, green, and connected driving 4-6% TE content growth/year
Sensors – Adds $80 billion to addressable market• Automotive content opportunity doubles from an
average of $200 to $400 per vehicle with sensors
Aerospace – New aircraft platforms increasing TE content per design by more than 2X in new models vs. prior generations
Industrial Equipment – Smart factories, robotics, and manufacturing automation are driving more TE connectors and sensors
18
Examples of TE’s Content Growth

80%
LEADER IN HARSH ENVIRONMENTSHigh pressure VibrationHigh-voltageMoistureHigh/Low Temperature
• TE products withstand harsh environments where failure is not an option
• Strong margins and revenue growth of 10% YOY
• Leadership position in harsh businesses – Transportation, Industrial, Oil & Gas, Appliances
REVENUE UP TO:
19
Increasing Revenue from Harsh
Demands excellence in engineering & manufacturing

Commercial Transportation
Consumer Devices
Industrial Equipment
SubCom
Aerospace & Defense
Automotive
Appliances
Medical
Data Communications
Energy
Oil & Gas
The World Leader in Connectivity & Sensors
If Data, Power, or Signal Moves Through ItTE Connects AND Senses It20

Appendix
21

Liquidity Summary($ in Millions) Q1 2015 Q1 2014
Beginning Cash Balance $2,457 $1,403
Free Cash Flow 162 266
Dividends (118) (103)
Share repurchases (155) (210)
Acquisitions, net of cash required (1,511) -
Proceeds from exercise of share options 16 57
Proceeds from issuance of debt and CP, net 270 298
Repayment of long-term debt (223) (303)
Other (30) (11)
Ending Cash Balance $868 $1,397
Total Debt $4,223 $2,998
($ in Millions) Q1 2015 Q1 2014
Cash from Continuing Operations $295 $387Capital expenditures, netPre separation US tax payments
(137)4
(121)
Free Cash Flow $162 $266
A/R - $ $2,349 $2,284Days Sales Outstanding 61* 62
Inventory (Excl. CIP) - $ $1,919 $1,809Days on Hand 76* 74
Accounts Payable - $ $1,382 $1,361Days Outstanding 54* 56
Free Cash Flow is a non-GAAP measure, see Appendix for description
* Adjusted to exclude the impact of the Measurement Specialties acquisition
Free Cash Flow and Working Capital Liquidity, Cash & Debt
Q1 Balance Sheet & Cash Flow Summary
22

Non-GAAP Measures“Organic Sales Growth,” “Adjusted Gross Margin,” “Adjusted Gross Margin Percentage,”, “Adjusted EBITDA,” “Adjusted Operating Income,” “Adjusted Operating Margin,” “Adjusted Other Income, Net,” “Adjusted Income Tax Expense,” “Adjusted Effective Tax Rate,” ”Adjusted Income from Continuing Operations,” “Adjusted Earnings Per Share,” and “Free Cash Flow” (FCF) are non-GAAP measures and should not be considered replacements for GAAP* results.
“Organic Sales Growth” is a useful measure used by us to measure the underlying results and trends in the business. The difference between reported net sales growth (the most comparable GAAP measure) and Organic Sales Growth (the non-GAAP measure) consists of the impact from foreign currency exchange rates and acquisitions and divestitures, if any. Organic Sales Growth is a useful measure of our performance because it excludes items that: i) are not completely under management’s control, such as the impact of changes in foreign currency exchange rates; or ii) do not reflect the underlying growth of the company, such as acquisition and divestiture activity. The limitation of this measure is that it excludes items that have an impact on our sales. This limitation is best addressed by using organic sales growth in combination with the GAAP results.
We present gross margin and gross margin percentage before special items including charges or income related to restructuring and other charges and acquisition related charges, if any ("Adjusted Gross Margin“ and “Adjusted Gross Margin Percentage”). We present Adjusted Gross Margin and Adjusted Gross Margin Percentage before special items to give investors a perspective on the underlying business results. These measures should be considered in conjunction with gross margin calculated using our GAAP results in order to understand the amounts, character and impact of adjustments to gross margin.
The adjusted EBITDA amount for the Broadband Network Solutions business that is set forth in this presentation is a non-GAAP measure and should not be considered a replacement for GAAP results. Adjusted EBITDA represents net income before interest expense, interest income, income taxes, depreciation and amortization, as adjusted for restructuring related expenses. Adjusted EBITDA is not intended to represent results of operations in accordance with GAAP and should not be considered a substitute for net income or any other operating measure prepared in accordance with GAAP.
We present operating income before special items including charges or income related to restructuring and other charges, acquisition related charges, impairment charges, and other income or charges, if any (“Adjusted Operating Income”). We utilize Adjusted Operating Income to assess segment level core operating performance and to provide insight to management in evaluating segment operating plan execution and underlying market conditions. It also is a significant component in our incentive compensation plans. Adjusted Operating Income is a useful measure for investors because it provides insight into our underlying operating results, trends, and the comparability of these results between periods. The difference between Adjusted Operating Income and operating income (the most comparable GAAP measure) consists of the impact of special items that may mask the underlying operating results and/or business trends. The limitation of this measure is that it excludes the financial impact of items that would otherwise either increase or decrease our reported operating income. This limitation is best addressed by using Adjusted Operating Income in combination with operating income (the most comparable GAAP measure) in order to better understand the amounts, character and impact of any increase or decrease on reported results.
We present operating margin before special items including charges or income related to restructuring and other charges, acquisition related charges, impairment charges, and other income or charges, if any (“Adjusted Operating Margin”). We present Adjusted Operating Margin before special items to give investors a perspective on the underlying business results. This measure should be considered in conjunction with operating margin calculated using our GAAP results in order to understand the amounts, character and impact of adjustments to operating margin.
We present other income, net before special items including tax sharing income related to certain proposed adjustments to prior period tax returns and other tax items, if any (“Adjusted Other Income, Net”). We present Adjusted Other Income, Net as we believe that it is appropriate for investors to consider results excluding these items in addition to results in accordance with GAAP. The difference between Adjusted Other Income, Net and other income, net (the most comparable GAAP measure) consists of tax sharing income related to certain proposed adjustments to prior period tax returns and other tax items, if any. The limitation of this measure is that it excludes the financial impact of items that would otherwise either increase or decrease other income, net. This limitation is best addressed by using Adjusted Other Income, Net in combination with other income, net (the most comparable GAAP measure) in order to better understand the amounts, character and impact of any increase or decrease in reported amounts.
We present income tax expense after adjusting for the tax effect of special items including charges related to restructuring and other charges, acquisition related charges, impairment charges, other income or charges, and certain significant special tax items, if any (“Adjusted Income Tax Expense”). We present Adjusted Income Tax Expense to provide investors further information regarding the tax effects of adjustments used in determining the non-GAAP financial measure Adjusted Income from Continuing Operations (as defined below). The difference between Adjusted Income Tax Expense and income tax expense (the most comparable GAAP measure) is the tax effect of adjusting items and certain significant special tax items, if any. The limitation of this measure is that it excludes the financial impact of items that would otherwise either increase or decrease income tax expense. This limitation is best addressed by using Adjusted Income Tax Expense in combination with income tax expense (the most comparable GAAP measure) in order to better understand the amounts, character and impact of any increase or decrease in reported amounts.
* U.S. Generally Accepted Accounting Principles23

We present effective income tax rate after adjusting for the tax effect of special items including charges related to restructuring and other charges, acquisition related charges, impairment charges, other income or charges, and certain significant special tax items, if any (“Adjusted Effective Tax Rate”). We present Adjusted Effective Tax Rate to provide investors further information regarding the tax rate effects of adjustments used in determining the non-GAAP financial measure Adjusted Income from Continuing Operations (as defined below). The difference between Adjusted Effective Tax Rate and effective income tax rate (the most comparable GAAP measure) is the tax rate effect of the adjusting items and certain significant special tax items, if any. The limitation of this measure is that it excludes the financial impact of items that would otherwise either increase or decrease the effective income tax rate. This limitation is best addressed by using Adjusted Effective Tax Rate in combination with effective income tax rate (the most comparable GAAP measure) in order to better understand the amounts, character and impact of any increase or decrease in reported amounts.
We present income from continuing operations attributable to TE Connectivity Ltd. before special items including charges or income related to restructuring and other charges, acquisition related charges, impairment charges, tax sharing income related to certain proposed adjustments to prior period tax returns and other tax items, certain significant special tax items, other income or charges, if any, and, if applicable, related tax effects (“Adjusted Income from Continuing Operations”). We present Adjusted Income from Continuing Operations as we believe that it is appropriate for investors to consider results excluding these items in addition to results in accordance with GAAP. Adjusted Income from Continuing Operations provides additional information regarding our underlying operating results, trends and the comparability of these results between periods. The difference between Adjusted Income from Continuing Operations and income from continuing operations attributable to TE Connectivity Ltd. (the most comparable GAAP measure) consists of the impact of special items and, if applicable, related tax effects. The limitation of this measure is that it excludes the financial impact of items that would otherwise either increase or decrease our reported results. This limitation is best addressed by using Adjusted Income from Continuing Operations in combination with income from continuing operations attributable to TE Connectivity Ltd. (the most comparable GAAP measure) in order to better understand the amounts, character and impact of any increase or decrease in reported amounts.
We present diluted earnings per share from continuing operations attributable to TE Connectivity Ltd. before special items, including charges or income related to restructuring and other charges, acquisition related charges, impairment charges, tax sharing income related to certain proposed adjustments to prior period tax returns and other tax items, certain significant special tax items, other income or charges, if any, and, if applicable, related tax effects (“Adjusted Earnings Per Share”). We present Adjusted Earnings Per Share because we believe that it is appropriate for investors to consider results excluding these items in addition to results in accordance with GAAP. We believe such a measure provides a picture of our results that is more comparable among periods since it excludes the impact of special items, which may recur, but tend to be irregular as to timing, thereby making comparisons between periods more difficult. It also is a significant component in our incentive compensation plans. The limitation of this measure is that it excludes the financial impact of items that would otherwise either increase or decrease our reported results. This limitation is best addressed by using Adjusted Earnings Per Share in combination with diluted earnings per share from continuing operations attributable to TE Connectivity Ltd. (the most comparable GAAP measure) in order to better understand the amounts, character and impact of any increase or decrease on reported results.
“Free Cash Flow” (FCF) is a useful measure of our ability to generate cash. It also is a significant component in our incentive compensation plans. The difference between net cash provided by continuing operating activities (the most comparable GAAP measure) and FCF (the non-GAAP measure) consists mainly of significant cash outflows and inflows that we believe are useful to identify. We believe free cash flow provides useful information to investors as it provides insight into the primary cash flow metric used by management to monitor and evaluate cash flows generated from our operations.
FCF is defined as net cash provided by continuing operating activities excluding voluntary pension contributions and the cash impact of special items, if any, minus net capital expenditures. Net capital expenditures consist of capital expenditures less proceeds from the sale of property, plant, and equipment. These items are subtracted because they represent long-term commitments. Voluntary pension contributions are excluded from the GAAP measure because this activity is driven by economic financing decisions rather than operating activity. Certain special items, including net payments related to pre-separation tax matters, also are considered by management in evaluating free cash flow. We believe investors should also consider these items in evaluating our free cash flow.
FCF as presented herein may not be comparable to similarly-titled measures reported by other companies. The primary limitation of this measure is that it excludes items that have an impact on our GAAP cash flow. Also, it subtracts certain cash items that are ultimately within management’s and the Board of Directors’ discretion to direct and may imply that there is less or more cash available for our programs than the most comparable GAAP measure indicates. This limitation is best addressed by using FCF in combination with the GAAP cash flow results. It should not be inferred that the entire free cash flow amount is available for future discretionary expenditures, as our definition of free cash flow does not consider certain non-discretionary expenditures, such as debt payments. In addition, we may have other discretionary expenditures, such as discretionary dividends, share repurchases, and business acquisitions, that are not considered in the calculation of free cash flow.
Non-GAAP Measures (cont.)
24

Segment Summary
Q1 FY2015
($ in millions) AdjustedActual O rganic O perating
Segment Q 1 FY15 Q 1 FY14 Growth Growth (1) Margin (1)
Transportation Solutions 1,612$ 1,440$ 11.9 % 7.9 % 21.4 %Industrial Solutions 784 763 2.8 2.7 12.9 Network Solutions 704 713 (1.3) 1.9 8.8 Consumer Solutions 366 410 (10.7) (8.5) 12.8 Total 3,466$ 3,326$ 4.2 % 3.4 % 16.0 %
(1) See description and reconciliation of non-GAAP measures contained in this appendix.
Net Sales
25

Reconciliation of Net Sales Growth– Q1 15 vs. Q1 14
Translation (2) Acquisitions
Transportation Solutions (3):Automotive 95$ 8.0 % (61)$ -$ 34$ 2.8 % 76 %Commercial Transportation 15 7.4 (8) - 7 3.5 13 Sensors 4 7.4 (4) 131 131 272.9 11
Total 114 7.9 (73) 131 172 11.9 100 %Industrial Solutions (3):
Industrial Equipment 1 0.3 (13) 1 (11) (3.4) 40 Aerospace, Defense, Oil, and Gas 18 7.5 (8) 34 44 17.7 37 Energy 1 0.8 (13) - (12) (6.2) 23
Total 20 2.7 (34) 35 21 2.8 100 %Network Solutions (3):
Broadband Network Solutions (BNS):Telecom Networks (29) (9.4) (12) - (41) (13.1) 39 Enterprise Networks 1 0.5 (7) - (6) (4.0) 21
BNS Total (28) (6.2) (19) - (47) (10.1) 60 Data Communications (7) (4.1) (4) - (11) (6.7) 21 Subsea Communications 49 57.4 - - 49 57.4 19
Total 14 1.9 (23) - (9) (1.3) 100 %Consumer Solutions (3):
Consumer Devices (45) (17.4) (5) - (50) (19.4) 57 Appliances 10 6.7 (4) - 6 3.9 43
Total (35) (8.5) (9) - (44) (10.7) 100 % Total 113$ 3.4 % (139)$ 166$ 140$ 4.2 %
Percentage ofSegment's Total
(1) Represents the change in net sales resulting from volume and price changes, before consideration of acquisitions, divestitures, and the impact of changes in foreign currency exchange rates. Organic net sales growth is a non-GAAP measure. See description of non-GAAP measures contained in this appendix.
(3) Industry end market information about net sales is presented consistently with our internal management reporting and may be periodically revised as management deems necessary.
Q uarter EndedChange in Net Sales for the Q uarter Ended December 26, 2014 Net Sales for the
(2) Represents the change in net sales resulting from changes in foreign currency exchange rates.
versus Net Sales for the Q uarter Ended December 27, 2013
O rganic (1) Total December 26, 2014($ in mill ions)
26

Reconciliation of Net Sales Growth by Segment and Geography –Q1 15 vs. Q1 14
Translation (2) Acquisitions
Transportation Solutions:EMEA 30$ 5.1 % (47)$ 59$ 42$ 7.2 %Asia-Pacific 88 16.9 (19) 19 88 16.9 Americas (4) (1.3) (7) 53 42 12.6
Total 114 7.9 (73) 131 172 11.9 Industrial Solutions:
EMEA (4) (1.2) (26) 9 (21) (6.6) Asia-Pacific 6 4.9 (5) 1 2 1.4 Americas 18 6.0 (3) 25 40 13.5
Total 20 2.7 (34) 35 21 2.8 Network Solutions:
EMEA (13) (6.6) (12) - (25) (13.0) Asia-Pacific (5) (3.1) (6) - (11) (6.4) Americas 32 9.1 (5) - 27 7.8
Total 14 1.9 (23) - (9) (1.3) Consumer Solutions:
EMEA (2) (4.2) (4) - (6) (11.1) Asia-Pacific (36) (12.3) (5) - (41) (14.1) Americas 3 5.0 - - 3 5.0
Total (35) (8.5) (9) - (44) (10.7) Total:
EMEA 11 1.0 (89) 68 (10) (0.9) Asia-Pacific 53 4.8 (35) 20 38 3.3 Americas 49 4.7 (15) 78 112 10.7
Total 113$ 3.4 % (139)$ 166$ 140$ 4.2 %
(1) Represents the change in net sales resulting from volume and price changes, before consideration of acquisitions, divestitures, and the impact of changes in foreign currency exchange rates. Organic net sales growth is a non-GAAP measure. See description of non-GAAP measures contained in this appendix.(2) Represents the change in net sales resulting from changes in foreign currency exchange rates.
versus Net Sales for the Q uarter Ended December 27, 2013Change in Net Sales for the Q uarter Ended December 26, 2014
O rganic (1) Total($ in millions)
27

Reconciliation of Non-GAAP Financial Measures to GAAP Financial Measures for the Quarter Ended December 26, 2014
Acquisition RestructuringRelated and O ther Tax Adjusted
U.S. GAAP Charges (1) Charges, Net Items (2) (Non-GAAP) (3)
Operating Income:Transportation Solutions 303$ 41$ 1$ -$ 345$ Industrial Solutions 89 10 2 - 101 Network Solutions 61 - 1 - 62 Consumer Solutions 24 - 23 - 47 Total 477$ 51$ 27$ -$ 555$
Operating Margin 13.8% 16.0%
Other Income (Expense), Net (70)$ -$ -$ 83$ 13$
Income Tax (Expense) Benefit 95$ (14)$ (2)$ (211)$ (132)$
Effective Tax Rate NM (4) 24.5%
Income from Continuing Operations Attributable to TE Connectivity Ltd. 472$ 37$ 25$ (128)$ 406$
Diluted Earnings per Share from Continuing Operations Attributable to TE Connectivity Ltd. 1.14$ 0.09$ 0.06$ (0.31)$ 0.98$
(3) See description of non-GAAP measures contained in this appendix.(4) Not meaningful.
Adjustments
($ in millions, except per share data)
(1) Includes $24 million of acquisition and integration costs and $27 million of non-cash amortization associated with fair value adjustments related to acquired inventories and customer order backlog recorded in cost of sales.(2) Includes $189 million of income tax benefits associated with the settlement of audits of prior year income tax returns as well as the related impact of $83 million to other expense pursuant to the tax sharing agreement with Tyco International and Covidien. Also includes income tax benefits related to the impacts of certain non-U.S. tax law changes and the associated reduction in the valuation allowance for tax loss carryforwards.
28

Reconciliation of Non-GAAP Financial Measures to GAAP Financial Measures for the Quarter Ended December 27, 2013
Restructuringand O ther Tax Adjusted
U.S. GAAP Charges, Net Items (1) (Non-GAAP) (2)
Operating Income:Transportation Solutions 296$ 1$ -$ 297$ Industrial Solutions 99 1 - 100 Network Solutions 46 5 - 51 Consumer Solutions 38 - - 38 Total 479$ 7$ -$ 486$
Operating Margin 14.4% 14.6%
Other Income, Net 32$ -$ (25)$ 7$
Income Tax Expense (127)$ (1)$ 7$ (121)$
Effective Tax Rate 26.3% 26.1%
Income from Continuing Operations Attributable to TE Connectivity Ltd. 355$ 6$ (18)$ 343$
Diluted Earnings per Share from Continuing Operations Attributable to TE Connectivity Ltd. 0.85$ 0.01$ (0.04)$ 0.82$
(1) Includes income tax expense related to adjustments to prior year income tax returns. In addition, other income includes amounts related to reimbursements by Tyco International and Covidien in connection with pre-separation tax matters, including $18 million related to our share of a settlement agreement entered into by Tyco International with a former subsidiary.(2) See description of non-GAAP measures contained in this appendix.
Adjustments
($ in millions, except per share data)
29

Reconciliation of Non-GAAP Financial Measures to GAAP Financial Measures for the Quarter Ended March 28, 2014
Acquisition RestructuringRelated and O ther Tax Adjusted
U.S. GAAP Charges Charges, Net Items (1) (Non-GAAP) (2)
Operating Income:Transportation Solutions 347$ -$ (1)$ -$ 346$ Industrial Solutions 106 1 5 - 112 Network Solutions 23 - 16 - 39 Consumer Solutions 34 - 1 - 35 Total 510$ 1$ 21$ -$ 532$
Operating Margin 14.9% 15.5%
Other Income, Net 16$ -$ -$ (14)$ 2$
Income Tax Expense (136)$ -$ (10)$ 36$ (110)$
Effective Tax Rate 27.2% 21.7%
Income from Continuing Operations Attributable to TE Connectivity Ltd. 364$ 1$ 11$ 22$ 398$
Diluted Earnings per Share from Continuing Operations Attributable to TE Connectivity Ltd. 0.87$ -$ 0.03$ 0.05$ 0.95$
(1) Includes income tax expense related to adjustments to prior year income tax returns. In addition, other income includes amounts related to reimbursements by Tyco International and Covidien in connection with pre-separation tax matters.(2) See description of non-GAAP measures contained in this appendix.
Adjustments
($ in mill ions, except per share data)
30

Reconciliation of Non-GAAP Financial Measures to GAAP Financial Measures for the Year Ended September 26, 2014
Acquisition RestructuringRelated and O ther Tax Adjusted
U.S. GAAP Charges (1) Charges, Net Items (2) (Non-GAAP) (3)
Operating Income:Transportation Solutions 1,283$ 4$ 4$ -$ 1,291$ Industrial Solutions 446 31 7 - 484 Network Solutions 163 - 35 - 198 Consumer Solutions 153 - 13 - 166 Total 2,045$ 35$ 59$ -$ 2,139$
Operating Margin 14.7% 15.4%
Other Income, Net 63$ -$ -$ (39)$ 24$
Income Tax Expense (207)$ (1)$ (22)$ (239)$ (469)$
Effective Tax Rate 10.4% 22.9%
Income from Continuing Operations Attributable to TE Connectivity Ltd. 1,789$ 34$ 37$ (278)$ 1,582$
Diluted Earnings per Share from Continuing Operations Attributable to TE Connectivity Ltd. 4.29$ 0.08$ 0.09$ (0.67)$ 3.79$
(2) Includes income tax benefits of $282 million recognized in connection with a reduction in the valuation allowance associated with certain tax loss carryforwards and income tax expense related to adjustments to prior year income tax returns. In addition, other income includes amounts related to reimbursements by Tyco International and Covidien in connection with pre-separation tax matters, including $18 million related to our share of a settlement agreement entered into by Tyco International with a former subsidiary.(3) See description of non-GAAP measures contained in this appendix.
($ in millions, except per share data)
(1) Includes $31 million of acquisition and integration charges and $4 million of non-cash amortization associated with fair value adjustments primarily related to acquired inventories and customer order backlog recorded in cost of sales.
Adjustments
31

Reconciliation of Gross Margin & Gross Margin Percentage
December 27, December 26,2013 2014
Net Sales 3,326$ 3,466$ Cost of Sales 2,209 2,295 Gross Margin 1,117 1,171
Gross Margin Percentage 33.6% 33.8%
Acquisition Related Charges - 27
Adjusted Gross Margin (1) 1,117$ 1,198$
Adjusted Gross Margin Percentage (1) 33.6% 34.6%
(1) See description of non-GAAP measures contained in this appendix.
($ in millions)
For the Q uarters Ended
32

Reconciliation of Forward-Looking Non-GAAP Financial Measures to Forward-Looking GAAP Financial Measures
O utlook forQ uarter Ending
March 27, O utlook for2015 Fiscal 2015
Diliuted earnings per share from continuing operations attributable to TE Connectivity Ltd. (GAAP) $0.89 - 0.93 $4.04 - 4.34Restructuring and other charges, net 0.04 0.10 Acquisition related charges 0.05 0.22 Tax items - (0.31)
Adjusted diluted earnings per share from continuing operations attributable to TE Connectivity Ltd. (non-GAAP) (1)$0.98 - 1.02 $4.05 - 4.35
Net sales growth (GAAP) 3 - 6% 4 - 7%Translation 7 6 (Acquisitions) divestitures (5) (5)
Organic net sales growth (non-GAAP) (1)5 - 8% 5 - 8%
(1) See description of non-GAAP measures contained in this appendix.
33