qatar busbar market forecast 2021 - brochure
TRANSCRIPT
M a r k e t I n t e l l i g e n c e . C o n s u l t i n g
Qatar Busbar Market By Type, By End User, Competit ion Forecast & Opportunities ,
2011 – 2021
T a b l e o f C o n t e n t s
2
© TechSci Research
S No. Contents
1. Product Overview
2. Research Methodology
3. Analyst View
4. Global Busbar Market Overview
5. Industry Structures & Stakeholders
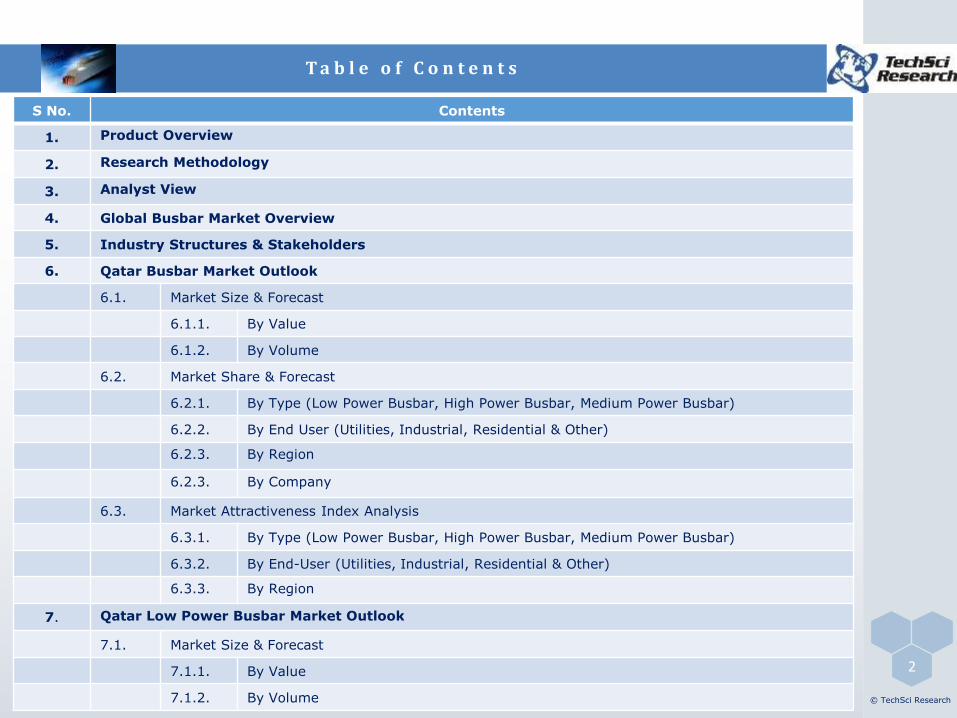
6. Qatar Busbar Market Outlook
6.1. Market Size & Forecast
6.1.1. By Value
6.1.2. By Volume
6.2. Market Share & Forecast
6.2.1. By Type (Low Power Busbar, High Power Busbar, Medium Power Busbar)
6.2.2. By End User (Utilities, Industrial, Residential & Other)
6.2.3. By Region
6.2.3. By Company
6.3. Market Attractiveness Index Analysis
6.3.1. By Type (Low Power Busbar, High Power Busbar, Medium Power Busbar)
6.3.2. By End-User (Utilities, Industrial, Residential & Other)
6.3.3. By Region
7. Qatar Low Power Busbar Market Outlook
7.1. Market Size & Forecast
7.1.1. By Value
7.1.2. By Volume

T a b l e o f C o n t e n t s
3
© TechSci Research
S No. Contents
7.2. Market Share & Forecast
7.2.1. By End User
7.2.2. By Region
7.3. Market Attractiveness Index Analysis
7.3.1. By End User (Utilities, Residential, Industrial & Others)
7.3.2. By Region
8. Qatar Medium Power Busbar Market Outlook
8.1. Market Size & Forecast
8.1.1. By Value
8.1.2. By Volume
8.2. Market Share & Forecast
8.2.1. By End-User(Utilities, Residential, Industrial & Others)
8.2.2. By Region
8.3. Market Attractiveness Index Analysis
8.3.1. By End-User(Utilities, Residential, Industrial & Others)
8.3.2. By Region
9. Qatar High Power Busbar Market Outlook
9.1. Market Size & Forecast
9.1.1. By Value
9.1.2. By Volume
9.2. Market Share & Forecast
9.2.1. By End-User
9.2.2. By Region

T a b l e o f C o n t e n t s
4
© TechSci Research
S No. Contents
9.3. Market Attractiveness Index Analysis
9.3.1. By End-User (Utilities, Residential, Industrial & Others)
9.3.2. By Region
10. Market Dynamics
10.1. Drivers
10.2. Challenges
11. Market Trends & Developments
11.1. Increasing Per Capita Electricity Consumption
11.2. Construction of Substations and its integration with GCC Power Grid
11.3. Increasing Trend of Renewable Energy
11.4. Water Desalination
11.5. Qatar National Vision 2030
12. Channel Partner Analysis
13. Policy & Regulatory Landscape
14. Qatar Economic Profile
15. Competitive Landscape
15.1. Competition Matrix
15.2. Company Profile
15.2.1. Schneider Electric Gulf
15.2.2. General Electric Company
15.2.3. ABB LLC
15.2.4. Eaton Corporation
15.2.5. Oriental Copper Ltd
T a b l e o f C o n t e n t s
5
© TechSci Research
S No. Contents
15.2.6. Siemens LLC.
15.2.7. Power Bar Gulf LLC.
15.2.8. Larsen & Tourbo Ltd
15.2.9. Rittal Middle East FZE
15.2.10. Al Farraj Trading & Manufacturing Company
16. Strategic Recommendation
17. About Us & Disclaimer

6
© TechSci Research
A busbar is a bar or metallic strip of copper, aluminum, cast iron or brass that conducts electricity within
switchgear, substation and distribution board. Maximum current that can be safely carried out by busbar
depends up on it cross-sectional size and material composition.
On the basis of application and total current that can safely carried, busbar can be flat, solid or tubular in size.
Main application of busbar is to connect transformers and transmission lines at an electrical substation. In a
power plant, main transformers and generators are interconnected through busbar. While, in metallurgy
industry, busbar are used for conducting electric current for electrolytic process.
On the basis of amount of current it can carry, busbar is classified into three categories, namely, low power
busbar, medium power busbar and high power busbar.
P r o d u c t O v e r v i e w
Types of BusbarBased on
Current Flow
Low Power Busbar(Up to 125 A)
Medium Power Busbar(Between 126 A
to 800 A)
High Power Busbar(Above 801 A)

R e s e a r c h M e t h o d o l o g y
7
© TechSci Research
Companies Interviewed
AL Farraj Trading & Manufacturing Company Larsen & Tourbo
Alphatech Qatar Q-Tec Switchgear W.L.L
ABB LLC Oriental Copper Ltd
Eaton Corporation Qatar General Electricity & Water Corporation
Electric House W.L.L Schneider Electric SA
TechSci Research has scrutinized various published documents from following key sources in order to fill the
data gaps and verify information being collected through primary research surveys.
Secondary Sources
Companies website Construction Week
MEED Projects Qatar National Development Strategy 2011-16
Doha News Oil and Gas Journal
UN Comtrade Qatar Monthly Statistics
Qatar Economic Outlook, 2014 Electrical Engineering Portal
Qatar National Vision 2030 Gulf Petrochemical and Chemicals Association
OBJECTIVE: The primary objective of the study was to understand and gain insights about low, medium and
high power busbar, and forecast its market in Qatar.
APPROACH & SOURCES: In order to forecast the market of busbar in the Qatar, both top down and bottom up
approach have been used. Moreover, multiple respondents from the companies and distributors operating in
busbar segment have been interviewed through telephonic calls to extract and verify the information being
collected at the source.
R e s e a r c h M e t h o d o l o g y
8
© TechSci Research
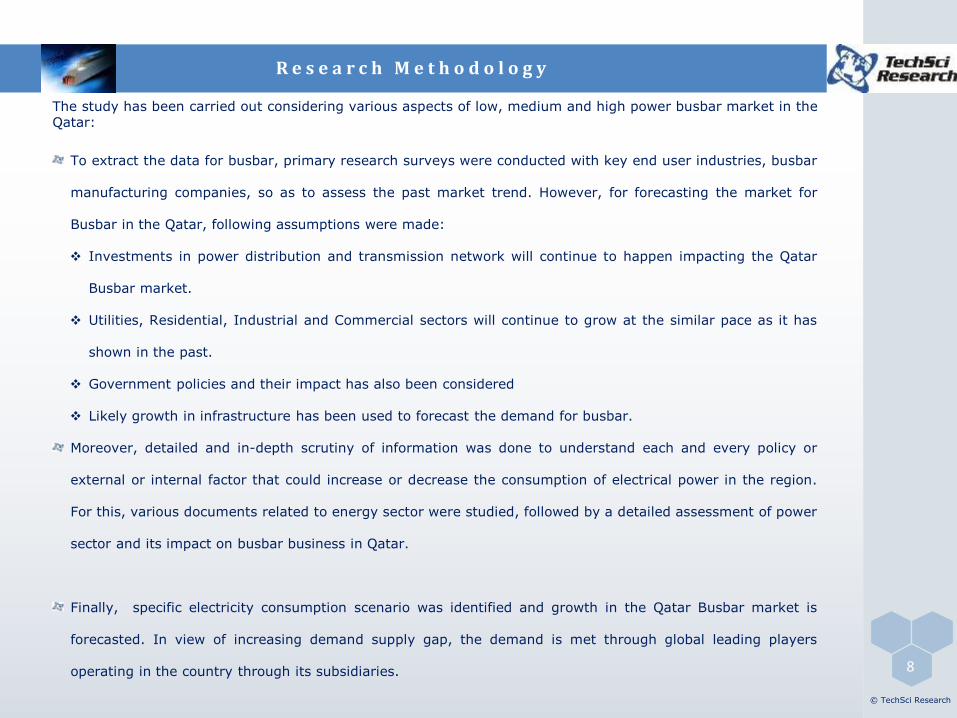
To extract the data for busbar, primary research surveys were conducted with key end user industries, busbar
manufacturing companies, so as to assess the past market trend. However, for forecasting the market for
Busbar in the Qatar, following assumptions were made:
Investments in power distribution and transmission network will continue to happen impacting the Qatar
Busbar market.
Utilities, Residential, Industrial and Commercial sectors will continue to grow at the similar pace as it has
shown in the past.
Government policies and their impact has also been considered
Likely growth in infrastructure has been used to forecast the demand for busbar.
Moreover, detailed and in-depth scrutiny of information was done to understand each and every policy or
external or internal factor that could increase or decrease the consumption of electrical power in the region.
For this, various documents related to energy sector were studied, followed by a detailed assessment of power
sector and its impact on busbar business in Qatar.
Finally, specific electricity consumption scenario was identified and growth in the Qatar Busbar market is
forecasted. In view of increasing demand supply gap, the demand is met through global leading players
operating in the country through its subsidiaries.
The study has been carried out considering various aspects of low, medium and high power busbar market in theQatar:

R e s e a r c h M e t h o d o l o g y
9
© TechSci Research
Considering these assumptions, our dedicated team of industry experts has comprehensively monitored and
analyzed various aspects of busbar market in Qatar. The team has analyzed various industry segments and
speculated a positive future for busbar market in the region. Taking into consideration the developments, capital
investments, government support, etc., our team of analysts has provided a prudent analysis of the industry’s
performance in the future.
The market value for busbar, were estimated & validated using both Bottom Up and Top Down approach. The
value for each of the sub-segments (by rating, by end use industry, by company and by region) was also arrived
at using a similar approach.

I n d u s t r y B r i e f
10
Qatar Busbar Market to Witness CAGR 12% till 2021
According to a recently published TechSci Research report “Qatar Busbar Market By Type, By End User,Competition Forecast & Opportunities, 2011 – 2021”, busbar market in the country is anticipated to grow at aCAGR of 12% during 2016 - 2021. Rising population in the country is driving demand for air conditioners,refrigerators and other electric appliances, which is consequently boosting electricity consumption, and therebydriving busbar market in Qatar. Anticipated growth in per capita electricity consumption coupled with strengtheningof power distribution and transmission system in the country are expected to continue boosting Qatar busbarmarket during the forecast period. With the rollout of National Vision 2030, Qatar has planned to make hugeinvestments in building infrastructure pertaining to utilities as well as residential and industrial sectors in the comingyears. Further, demand for busbars would also be stimulated over the next five years with various construction andinfrastructure projects being undertaken for hosting FIFA World Cup 2022 in the country.
Low power busbar (up to 125 A) accounted for the largest share in Qatar busbar market in 2015, followed by Highand Medium power busbar segments. Qatar Electricity & Water Company is planning to invest US$ 22 billion instrengthening and expanding the country’s power and water infrastructure by 2019. Moreover, total electricityproduction in Qatar is likely to surpass 11,000 MW by the mid of 2018, thereby boost demand for busbars in thecountry in the coming years. Accounting for a value share of more than 40% in 2015, Doha province dominates thebusbar market in Qatar, and the region is forecast to continue its dominance during the forecast period.
Qatar is developing its refinery and petrochemical processing infrastructure in order to promulgate industrialdiversification, which calls for the development of electrical infrastructure, including building new power plants andtransmission and distribution network, consequently boosting demand for busbars in the country. “Owing tocontinuing growth in residential, industrial and commercial segments, coupled with initiation of smart powerdistribution and transmission systems and integration of renewable energy to the country’s grid infrastructure,demand for busbars in Qatar is expected to grow in the coming years.” said Mr. Karan Chechi, Research Director withTechSci Research, a research based global management consulting firm.

© TechSci Research
11
S a m p l e D a t a - S n a p s h o t
Qatar Busbar Market Size, By Value (USD Million), By
Volume (Thousand Units), 2011-2021F
10 20 30 40 50 60 70 80 90 100 110
1530
4560
7590
105120
135 150 165
2011 2012 2013 2014 2015 2016E2017F2018F2019F2020F2021F
By Value (USD Million) By Volume (Thousand Units)
Qatar Busbar Market Share, By Type, By Value, 2015 & 2021F
Low Power
Busbar, 33.00%
High Power
Busbar, 33.00%
Medium Power
Busbar, 34.00% 2015
Low Power
Busbar, 33.00%
High Power
Busbar, 33.00%
Medium Power
Busbar, 34.00% 2021F
Qatar Busbar Market Share, By Region, By Value, 2015 & 2021F
Doha, 14.00%
Al Raayan, 14.00%
Al Khor, 14.00%Al
Wakrah,
14.00%
Al Daayen
, 14.00%
Umm Salal,
14.00%
Madinat ash … Doha, 14.00%
Al Raayan, 14.00%
Al Khor, 14.00%
Al Wakrah
, 14.00%
Al Daayen, 14.00%
Umm Salal,
14.00%
Madinat ash
Shamal, 16.00%
2021F2015
-2.00%
0.00%
2.00%
4.00%
6.00%
8.00%
10.00%
12.00%
14.00%
16.00%
18.00%
-1.00 0.00 1.00 2.00 3.00 4.00 5.00
Al Daayen
Umm Salal
Doha
Qatar Busbar Market Attractiveness Index, By
Region, By Value, 2015-2021F
Al Rayyan
Al Wakrah
Al Khor
Madinat ash Shamal
Qatar High Power Busbar Market Size, By Value (USD
Million), By Volume (Thousand Units), 2011-2021F
10 20 30 40 50 60 70 80 90 100 110
15 30 45 60 75 90 105 120 135 150 165
By Value (USD Million) By Volume (Thousand Units)
10.20%
10.40%
10.60%
10.80%
11.00%
11.20%
11.40%
11.60%
11.80%
12.00%
12.20%
12.40%
0.00 0.50 1.00 1.50 2.00 2.50
Residential
Industrial
Utilities
Qatar Low Power Busbar Market Attractiveness Index,
By End-User, By Value, 2015-2021F
Others

R e p o r t O r d e r i n g
To View Sample OR Purchase Report
Report Price
Report Name: Qatar Busbar Market By Type, By End User, Competition
Forecast & Opportunities, 2011 – 2021
License Type Price
Electronic Access - Single User License $2500
CD-ROM Mail Delivery $3000
Hard Copy Mail Delivery $3500
Electronic Access - Multi-User License $5000
12

A b o u t U s & D i s c l a i m e r
© TechSci Research
TechSci Research – North America
708 Third Avenue, Manhattan,
New York, United States
Tel: +1- 646- 360- 1656
Email: [email protected]
www.techsciresearch.com
About Us :
TechSci Research is a global market research and consulting company with offices in the US, the UK and India. TechSci Research
provides market research reports in a number of areas to organizations. The company uses innovative business models that focus on
improving productivity, while ensuring creation of high-quality reports. The proprietary forecasting models use various analyses of
both industry-specific and macroeconomic variables on a state-by-state basis to produce a unique ‘bottom-up’ model of a country,
regional and global industry prospects. Combined with the detailed analysis of company activity and industry trends, the result is a
uniquely rich evaluation of the opportunities available in the market. TechSci Research currently tracks power industry in more than 35
countries.
Related Reports
Saudi Arabia Diesel Gensets Market Forecast and Opportunities, 2020
GCC Switchgear Market Forecast & Opportunities, 2021
Indonesia Electric Motors Market Forecast and Opportunities, 2020
Partial List of Clients
Disclaimer :
The contents of this report are based on information generally available to the public from sources believed to be reliable. No representation is made
that it is timely, accurate or complete. TechSci Research has taken due care and caution in compilation of data as this has been obtained from various
sources including which it considers reliable and first hand. However, TechSci Research does not guarantee the accuracy, adequacy or completeness of
any information and it is not responsible for any errors or omissions or for the results obtained from the use of such information and especially states
that it has no financial liability whatsoever to the subscribers / users of this report. The information herein, together with all estimates and forecasts,
can change without notice. All the figures provided in this document are indicative of relative market size and are strictly for client’s internal
consumption. Usage of the same for purpose other than internal will require prior approval of TechSci Research.
TechSci Research – Europe
54, Oldbrook, Bretton,
Peterborough,
United Kingdom
Email: [email protected]
www.techsciresearch.com
TechSci Research – Asia-Pacific
B – 44, Sector -57, Noida, National
Capital Region, U.P. - India
Tel: +91-120-4243434
Email: [email protected]
www.techsciresearch.com
13