qorivva mpc5xxx/spc5xx debugger and nexus trace · qorivva mpc5xxx/spc5xx debugger and nexus trace...
TRANSCRIPT

Qorivva MPC5xxx/SPC5xx Debugger and NEXUS Trace
TRACE32 Online Help
TRACE32 Directory
TRACE32 Index
TRACE32 Documents ......................................................................................................................
ICD In-Circuit Debugger ................................................................................................................
Processor Architecture Manuals ..............................................................................................
Qorivva MPC5xxx/SPC5xx ......................................................................................................
Qorivva MPC5xxx/SPC5xx Debugger and NEXUS Trace ................................................. 1
History ................................................................................................................................ 7
Introduction ....................................................................................................................... 8
Available Tools 8
JTAG/OnCE Debugger 8
On-chip Trace 9
High-Speed Serial Off-chip Trace (Aurora NEXUS) 9
Parallel Off-chip Trace (parallel NEXUS) 9
Co-Processor Debugging (eTPU/GTM/SPT) 9
Multicore Debugging 10
Software-only Debugging (HostMCI) via XCP 10
Software Installation 10
Hardware Installation 11
JTAG Debugger 11
Parallel Nexus Debugger and Trace 12
Aurora Nexus Debugger and Trace 13
ESD Protection Considerations 14
Demo and Start-up Scripts 14
Debug Cable / Nexus Adapter Versions and Detection 15
Brief Overview of Documents for New Users ................................................................. 16
Target Design Requirement/Recommendations ............................................................ 17
General (ICD Debugger) 17
Quick Start ......................................................................................................................... 18
Run Program from On-chip SRAM 18
Run Program from FLASH 20
Connect to Running Program (hot plug-in) 21
FAQ ..................................................................................................................................... 22
FAQ (ICD Debugger) 22
Qorivva MPC5xxx/SPC5xx Debugger and NEXUS Trace 1 ©1989-2018 Lauterbach GmbH
FAQ (NEXUS Debugger) 26
Debugging .......................................................................................................................... 35
Breakpoints 35
Software Breakpoints 35
On-chip Breakpoints 35
Breakpoints on Program Addresses 36
Breakpoints on Data Addresses 37
Breakpoints on Data Access at Program Address 38
Breakpoints on Data Value 38
Counting Debug Events with Core Performance Monitor 39
Memory Access 40
Access Classes 40
Access Classes to Memory and Memory Mapped Resources 40
Access Classes to Other Addressable Core and Peripheral Resources 41
Cache Debugging Support 43
Memory Coherency 43
Memory Coherency During run-time Memory Access 43
Viewing Cache Contents 44
MESI States and Cache Status Flags 45
Using Cache Lines as SRAM Extension 45
Support for Peripheral Modules 46
Displaying Peripheral Module Registers 46
Peripheral Registers Modified by TRACE32 47
Debugging and Tracing Through Reset 48
Multicore Debugging 49
SMP Debugging 50
AMP Debugging 52
Watchdog Timer Support 53
e200 Core Watchdog (TCR/TSR) 53
On-chip Watchdog (SWT) 53
Chip External Watchdog 53
Censorship Unlock 55
Troubleshooting Debug 57
Tracing ............................................................................................................................... 59
e200 PCFIFO On-chip Trace 59
MPC57XX/SPC57X/SPC58X NEXUS On-chip Trace (trace-to-memory) 59
External Trace Ports (Parallel NEXUS/Aurora NEXUS) 60
Basic Setup for Parallel Nexus 61
Basic Setup for Aurora Nexus 61
Tracing the Program Flow 62
Tracing of Data (read/write) Transactions 63
Example: Data Trace with Address Range 63
Trace Filtering and Triggering with Debug Events 63
Qorivva MPC5xxx/SPC5xx Debugger and NEXUS Trace 2 ©1989-2018 Lauterbach GmbH
Overview 63
Example: Selective Program Tracing 64
Example: Event Controlled Program/Data Trace Start and End 65
Example: Event Controlled Trace Recording 66
Example: Event Controlled Trigger Signals 67
Example: Event Counter 67
Tracing Peripheral Modules / Bus Masters 67
Example: Filter by Address Range 67
Example: Event Controlled Trace Start and End 68
Trace Filtering and Triggering Features Provided by TRACE32 68
Troubleshooting Trace 69
Tracing VLE or Mixed FLE/VLE Applications 69
FLASH Programming Support ......................................................................................... 70
FLASH Programming Scripts 70
Requirements due to FLASH ECC Protection 72
Programming the RCHW or Boot Header 73
Programming the Shadow Row 73
Programming Serial Boot Password and Censorship Word 75
TEST / UTEST / OTP FLASH Programming 76
Programming an OTP Sector 76
Programming an UTEST Sector which is not set to OTP 77
Brownout Depletion Recovery 78
Troubleshooting FLASH 78
Command Reference: SYStem Commands .................................................................... 80
SYStem.BdmClock Set BDM clock frequency 80
SYStem.CONFIG.state Display target configuration 81
SYStem.CONFIG Configure debugger according to target topology 82
SYStem.CONFIG.DEBUGPORTTYPE Set debug cable interface mode 86
Hardware Requirements for cJTAG Operation 86
SYStem.CONFIG.EXTWDTDIS Disable external watchdog 87
SYStem.CONFIG PortSHaRing Control sharing of debug port with other tool 87
SYStem.CPU Select the target processor 88
SYStem.CpuAccess Run-time CPU access (intrusive) 89
SYStem.LOCK Lock and tristate the debug port 89
SYStem.MemAccess Run-time memory access (non-intrusive) 90
SYStem.Mode Select operation mode 91
Command Reference: SYStem.Option Commands ....................................................... 92
SYStem.Option CoreStandBy On-the-fly breakpoint and trace setup 92
SYStem.Option DCFREEZE Data cache state frozen while core halted 92
SYStem.Option DCREAD Read from data cache 93
SYStem.Option DISableResetEscalation Control reset escalation disabling 93
SYStem.Option DISableShortSequence Short reset sequence handling 93
Qorivva MPC5xxx/SPC5xx Debugger and NEXUS Trace 3 ©1989-2018 Lauterbach GmbH
SYStem.Option DisMode Disassembler operation mode 94
SYStem.Option DUALPORT Implicitly use run-time memory access 95
SYStem.Option FREEZE Freeze system timers on debug events 95
SYStem.Option HoldReset Set reset hold time 96
SYStem.Option HOOK Compare PC to hook address 96
SYStem.Option ICFLUSH Invalidate instruction cache before go and step 96
SYStem.Option ICREAD Read from instruction cache 97
SYStem.Option IMASKASM Disable interrupts while single stepping 97
SYStem.Option IMASKHLL Disable interrupts while HLL single stepping 97
SYStem.Option KEYCODE Inhibit censorship protection 98
SYStem.Option LPMDebug Enable low power mode debug handshake 99
SYStem.Option MMUSPACES Enable space IDs 100
SYStem.Option NexusMemoryCoherency Coherent NEXUS mem-access 101
SYStem.Option.NoDebugStop Disable JTAG stop on debug events 102
SYStem.Option.NoJtagRdy Do not evaluate JTAG_RDY signal 102
SYStem.Option NOTRAP Use brkpt instruction for software breakpoints 103
SYStem.Option OVERLAY Enable overlay support 104
SYStem.Option PC Set fetch address debug actions 104
SYStem.Option RESetBehavior Set behavior when target reset detected 105
SYStem.Option ResBreak Halt the core while reset asserted 105
SYStem.Option ResetDetection Configure reset detection method 106
SYStem.Option ResetMode Select reset mode for SYStem.Up 107
SYStem.Option SLOWRESET Relaxed reset timing 108
SYStem.Option STEPSOFT Use alternative method for ASM single step 108
SYStem.Option TDOSELect Select TDO source of lock step core pair 108
SYStem.Option VECTORS Specify interrupt vector table address 108
SYStem.Option WaitReset Set reset wait time 110
SYStem.Option WATCHDOG Debug with software watchdog timer 111
Command Reference: MMU Commands ......................................................................... 113
MMU.DUMP Page wise display of MMU translation table 113
MMU.List Compact display of MMU translation table 114
MMU.SCAN Load MMU table from CPU 115
MMU.Set Set an MMU TLB entry 116
Command Reference: BenchMarkCounter ..................................................................... 117
BMC.<counter>.ATOB Enable event triggered counter start and stop 117
BMC.<counter>.FREEZE Freeze counter in certain core states 120
BMC.FREEZE Freeze counters while core halted 121
BMC.SnoopSet Assign event counter to TRACE32 ‘SnooperTrace’ 121
Command Reference: TrOnchip ...................................................................................... 124
TrOnchip.CONVert Adjust range breakpoint in on-chip resource 124
TrOnchip.EDBRAC0 Assign debug events to target software 125
TrOnchip.EVTEN Enable EVTI and EVTO pins 126
Qorivva MPC5xxx/SPC5xx Debugger and NEXUS Trace 4 ©1989-2018 Lauterbach GmbH
TrOnchip.RESet Reset on-chip trigger settings 127
TrOnchip.Set Enable special on-chip breakpoints 127
TrOnchip.VarCONVert Set single address breakpoint for scalar 128
TrOnchip.state View on-chip trigger setup window 129
Command Reference: Onchip .......................................................................................... 130
Onchip.TBARange Set on-chip trace buffer address range 130
Command Reference: NEXUS .......................................................................................... 131
NEXUS.BTM Enable program trace messaging 131
NEXUS.CLIENT<x>.BUSSEL Set NXMC target RAM 131
NEXUS.CLIENT<x>.MODE Set data trace mode of nexus client 131
NEXUS.CLIENT<x>.SELECT Select a nexus client for data tracing 132
NEXUS.CLIENT3.SPTACQMASTER Trace individual SPT masters 132
NEXUS.CoreENable Enable core tracing for dedicated cores in SMP 132
NEXUS.DDR Enable NEXUS double data rate mode 133
NEXUS.DMADTM Enable DMA data trace messaging 133
NEXUS.DTM Enable data trace messaging 134
NEXUS.DTMARK Data trace mark 134
NEXUS.DQM Enable data acquisition messaging 135
NEXUS.FRAYDTM Enable FlexRay data trace messaging 135
NEXUS.HTM Enable branch history messaging 135
NEXUS.OFF Switch the NEXUS trace port off 136
NEXUS.ON Switch the NEXUS trace port on 136
NEXUS.OTM Enable ownership trace messaging 137
NEXUS.PCRCONFIG Configure NEXUS PCR for tracing 137
NEXUS.PINCR Define DCI PINCR register value 138
NEXUS.PortMode Set NEXUS trace port frequency 138
NEXUS.PortSize Set trace port width 139
NEXUS.POTD Periodic ownership trace disable 139
NEXUS.PTCM Enable program trace correlation messages 140
NEXUS.PTMARK Program trace mark 140
NEXUS.RefClock Enable Aurora reference clock 141
NEXUS.Register Display NEXUS trace control registers 141
NEXUS.RESet Reset NEXUS trace port settings 141
NEXUS.SmartTrace Enable smart trace analysis 141
NEXUS.Spen<messagetype> Enable message suppression 142
NEXUS.STALL Stall the program execution when FIFO full 142
NEXUS.state Display NEXUS port configuration window 142
NEXUS.SupprTHReshold Set fill level for message suppression 143
NEXUS.TimeStamps Enable on-chip timestamp generation 143
NEXUS.WTM Enable watchpoint messaging 144
Nexus specific TrOnchip Commands .............................................................................. 145
TrOnchip.Alpha Set special breakpoint function 145
Qorivva MPC5xxx/SPC5xx Debugger and NEXUS Trace 5 ©1989-2018 Lauterbach GmbH
TrOnchip.Beta Set special breakpoint function 145
TrOnchip.Charly Set special breakpoint function 146
TrOnchip.Delta Set special breakpoint function 146
TrOnchip.DISable Disable NEXUS trace register control 146
TrOnchip.Echo Set special breakpoint function 146
TrOnchip.ENable Enable NEXUS trace register control 147
TrOnchip.EVTI Allow the EVTI signal to stop the program execution 147
TrOnchip.EVTO Use EVTO signal for runtime measurement 147
TrOnchip.EXTernal Enable trace trigger input of NEXUS adapter 148
TrOnchip.Out0 Select OUT0 pin signal source 148
TrOnchip.Out1 Select OUT1 pin signal source 149
TrOnchip.TOOLIO2 Select TOOLIO2 pin signal source 150
TrOnchip.TRaceControl Trace control with special debug events 151
Debug and Trace Connectors .......................................................................................... 152
14-pin JTAG/OnCE Connector (JTAG) 152
AUTO26 Connector (JTAG) 152
10-pin ECU14 Connector (with converter LA-3843) 153
38-pin Mictor Connector (NEXUS parallel) 153
50-pin SAMTEC ERF8 Connector (NEXUS parallel) 154
51-pin GlenAir / ROBUST Connector (NEXUS parallel) 155
34-pin SAMTEC ERF8 Connector (Aurora NEXUS) 156
Mechanical Dimensions .................................................................................................... 157
Technical Data ................................................................................................................... 166
Operation Voltage 166
Operation Frequency 166
Support ............................................................................................................................... 167
Available Tools 167
Compilers 171
Target Operating Systems 173
3rd-Party Tool Integrations 174
Products ............................................................................................................................. 175
Product Information 175
Order Information 181
Qorivva MPC5xxx/SPC5xx Debugger and NEXUS Trace 6 ©1989-2018 Lauterbach GmbH

Qorivva MPC5xxx/SPC5xx Debugger and NEXUS Trace
Version 22-Mar-2018
History
29-Aug-17 Updated the description of SYStem.Option MMUSPACES and SYStem.Option CoreStandBy.
18-Jul-17 New chapter about censorship unlock and workarounds.
18-Jul-17 New command SYStem.Option RESetBehavior.
Qorivva MPC5xxx/SPC5xx Debugger and NEXUS Trace 7 ©1989-2018 Lauterbach GmbH

Introduction
This documentation describes the processor specific settings and features for TRACE32-ICD for the following CPU families:
• NXP/Freescale Qorivva MPC55XX, MPC56XX and MPC57XX series
• STMicroelectronics SPC56X, SPC57X and SPC58X series
Available Tools
This chapter gives an overview over available Lauterbach TRACE32 tools for MPC5XXX/SPC5XX processors.
JTAG/OnCE Debugger
Debugging MPC5XXX/SPC5XX requires a Lauterbach Debug Cable together with a Lauterbach PowerDebug Module. The following debug cables are available:
• LA-3736: JTAG Debugger for MPC5xxx Automotive
• LA-7753: JTAG Debugger MPC5xxx/SPC5xx
The following debug modules are supported:
• LA-3500: POWER DEBUG INTERFACE / USB 3
• LA-3505: POWER DEBUG PRO
• LA-7699: POWER DEBUG II Ethernet
• LA-7708: POWER DEBUG INTERFACE / USB 2
• LA-7707/LA-7690: POWER TRACE / ETHERNET 256 / 512MB
• LA-7705: POWER DEBUG Ethernet
LA-7753 is additionally supported by:
• LA-7702: POWER DEBUG INTERFACE
• LA-7704: POWER DEBUG INTERFACE / USB
The DEBUG INTERFACE (LA-7701) does not support this processor series.
For a comparison of the Debug Cables see:http://www.lauterbach.com/differences_between_standard_and_automotive_debug_cables.pdf
Qorivva MPC5xxx/SPC5xx Debugger and NEXUS Trace 8 ©1989-2018 Lauterbach GmbH

On-chip Trace
On-chip tracing requires no extra Lauterbach hardware, it can be configured and read out with a regular JTAG/OnCE Debugger. Depending on the on-chip trace module implemented in the processor, a trace license might or might not ne required. See e200 PCFIFO on-chip trace and MPC57XX/SPC57X NEXUS on-chip trace for details.
High-Speed Serial Off-chip Trace (Aurora NEXUS)
Lauterbach offers an off-chip trace solution for processors with Aurora NEXUS trace port. Aurora is a high-speed serial interface defined by Xilinx.
Tracing requires the Aurora NEXUS Preprocessor for Qorivva MPC57xx/SPC57X (LA-3911) and a POWER TRACE II module. A POWERTRACE / ETHERNET module can be used with reduced speed and limited functionality.
See Basic Setup for Aurora Nexus for more information.
Parallel Off-chip Trace (parallel NEXUS)
The parallel NEXUS trace port can be used with a PowerTrace/Ethernet or PowerTrace II module and one of the following NEXUS adapters:
• LA-7630: NEXUS AutoFocus adapter (up to 16 MDOs, 1..5V, SDR/DDR support)
• LA-7610: NEXUS Adapter MPC55XX (up to 12 MDOs, 3.3V only, SDR only)
• LA-7612: NEXUS Adapter MPC5510 (up to 8 MDOs, 5V only, SDR only)
See Basic Setup for Parallel Nexus for more information.
Co-Processor Debugging (eTPU/GTM/SPT)
Debugging the MPC5XXX coprocessors eTPU/eTPU2, GTM and SPT is included free of charge, i.e. there is no additional license required.
For details about coprocessor debugging, see the specific Processor Architecture Manuals:
• “eTPU Debugger and Trace” (debugger_etpu.pdf)
• “GTM Debugger and Trace” (debugger_gtm.pdf)
Qorivva MPC5xxx/SPC5xx Debugger and NEXUS Trace 9 ©1989-2018 Lauterbach GmbH

Multicore Debugging
Lauterbach offers multicore debugging and tracing solutions, which can be done in two different setups: Symmetric Multiprocessing (SMP) and Asymmetric Multiprocessing (AMP). For details see chapter Multicore Debugging.
Concurrent debugging of multiple e200 cores requires a License for Multicore Debugging (MULTICORE).
Software-only Debugging (HostMCI) via XCP
TRACE32 PowerView also supports debugging and tracing without using TRACE32 PowerTools hardware. The debug accesses are done via a 3rd party XCP slave. The following licenses are required to unlock this feature:
• LA-8892L: 1 User Floating License PPC Front-End
• LA-9012L: 1 User Floating License XCP MPC5xxx Debug Back-End
• LA-8902L: 1 User Floating License Multicore Debugging (optional)
• LA-9013L: 1 User Floating License XCP MPC5xxx Trace License (optional)
For more information see below documents:
• “XCP Debug Back-End” (backend_xcp.pdf)
• “Software-only Debugging (Host MCI)” (app_t32start.pdf)
Software Installation
Please follow chapter “Software Installation” (icd_quick_installation.pdf) on how to install the TRACE32 software:
• An installer is available for a complete TRACE32 installation under Windows. See “MS Windows” in ICD Quick Installation, page 24 (icd_quick_installation.pdf).
• For a complete installation of TRACE32 under Linux, see “PC_LINUX” in ICD Quick Installation, page 27 (icd_quick_installation.pdf).
Qorivva MPC5xxx/SPC5xx Debugger and NEXUS Trace 10 ©1989-2018 Lauterbach GmbH

Hardware Installation
JTAG Debugger
Target
DE
BU
G C
AB
LE
LA
UT
ER
BA
CH
Debug Cable
POWER DEBUG INTERFACE / USB 3
AC/DC Adapter
PC
USBCable
LAUTERBACHPOWER
SELECT
EMULATE
PODBUS OUT
US
B
PODBUS IN
DE
BU
G C
AB
LE
POWER7-9V
TRIG
POWER DEBUG USB INTERFACE / USB 3
Deb
ugC
onn
ecto
r
Windows / Linux / Mac OS
Qorivva MPC5xxx/SPC5xx Debugger and NEXUS Trace 11 ©1989-2018 Lauterbach GmbH

Parallel Nexus Debugger and Trace
Target
Nex
usC
onn
ecto
r
POWER7-9 V
POWER
SELECT
RECORD
RUNNING
PODBUS EXPRESS INPOWER TRACE IILAUTERBACH
C B A
PR
EP
RO
CE
SS
OR
/ N
EX
US
LOG
IC A
NA
LYZ
ER
PR
OB
E
PODBUS EXPRESS OUTPODBUS OUT
POWER DEBUG PRO ETHERNETPOWER TRACE II
AC/DC Adapter
EthernetCable
LAUTERBACH
POWER
SELECT
RUNNING
PODBUS OUT
ET
HE
RN
ET
US
B
PODBUS SYNC
DE
BU
G C
AB
LE
PODBUS EXPRESS OUT
POWER7-9V
TRIGGER
POWER DEBUG PRO
HUB PC orWorkstation
1 Gbit Ethernet
NEXUS Adapter
LA
UT
ER
BA
CH
NE
XU
S A
DA
PTE
R
LA
UT
ER
BA
CH
CABLE
C B A
Qorivva MPC5xxx/SPC5xx Debugger and NEXUS Trace 12 ©1989-2018 Lauterbach GmbH

Aurora Nexus Debugger and Trace
Target
JTA
GC
onn
ecto
r(o
ptio
nal)
Sam
tec
34
Aur
ora
& J
TA
G
POWER TRACE II
POWER
SELECT
RECORD
RUNNING
POWER7-9V
LAUTERBACH
PODBUS OUT
POWER DEBUG IIPODBUS SYNC
TRIG
POWER7-9 V
US
B
LAUTERBACHPODBUS OUTD
EB
UG
CA
BLE
POWER DEBUG IIPOWER TRACE II
Ether
Adapter
ExtensionCableSamtec 34
netCable
POWER
SELECT
RUNNING
LINK
ACTIVITY
ET
HE
RN
ET
HUB
1 GBit Ethernet
Debug CableD
EB
UG
CA
BLE
LA
UTE
RB
AC
H
LO
GIC
AN
ALY
ZE
R P
RO
BE
C B A
Preprocessor
PODBUS EXPRESS OUT
PODBUS EXPRESS IN
PODBUS EXPRESS OUT
PR
EP
RO
CE
SS
OR
/ N
EX
US
PC orWorkstation
AC/DC Adapter
LA
UTE
RB
AC
H
LA
UTE
RB
AC
HN
EX
US
AD
AP
TE
R
Qorivva MPC5xxx/SPC5xx Debugger and NEXUS Trace 13 ©1989-2018 Lauterbach GmbH

ESD Protection Considerations
Demo and Start-up Scripts
In your TRACE32 installation directory, there is a subdirectory ~~/demo/powerpc/ where you will find example scripts and demo software.
For getting started there is a start-up script for every available PowerPC processor.
1. In TRACE32, choose File menu > Run Script.
2. Navigate to ~~/demo/powerpc/hardware/ and select your board and CPU. The demo scripts can be started through the menu MPC5XXX > Tools > Start Demo:
NOTE: To prevent debugger and target from damage it is recommended to connect or disconnect the debug cable only while the target power is OFF.
Recommendation for the software start:
1. Disconnect the debug cable from the target while the target power is off.
2. Connect the host system, the TRACE32 hardware and the debug cable.
3. Power ON the TRACE32 hardware.
4. Start the TRACE32 software to load the debugger firmware.
5. Connect the debug cable to the target.
6. Switch the target power ON.
7. Configure your debugger e.g. via a start-up script.
Power down:
1. Switch off the target power.
2. Disconnect the debug cable from the target.
3. Close the TRACE32 software.
4. Power OFF the TRACE32 hardware.
Qorivva MPC5xxx/SPC5xx Debugger and NEXUS Trace 14 ©1989-2018 Lauterbach GmbH

The directory ~~/demo/powerpc/ includes the following subdirectories:
Debug Cable / Nexus Adapter Versions and Detection
The following table shows how to detect which JTAG debug cable or NEXUS adapter is connected:
hardware/ Ready-to-run debugging and flash programming demos. The demos are compiles to run in internal SRAM and therefore can be used on any evaluation board and custom hardware.
flash/ Flash setup scripts and flash programming algorithm binaries for on-chip and external flash. See chapter FLASH programming for more information.
etc/ Examples for various PowerPC related debugger features.
kernel/ Example scripts for RTOS support.
compiler/ Compiler examples.
Debug cable and/or Nexus adapter version
Condition in PRACTICE script language
LA-3736(AUTO26 debug cable)
PRINT ID.CABLE()==0x4155
LA-7753 rev. 1(OnCE debug cable,JTAG only,no reset detection)
PRINT (ID.CABLE()&0xEFFF)==0x604F
LA-7753 rev. 2(OnCE debug cable,JTAG and cJTAG,supports reset detection)
PRINT ID.CABLE()==0x3535
LA-7630(Nexus Adapter,max 16 MDO / 2 MSEO,1-5V, SDR and DDR)
PRINT POWERNEXUS()&&(ID.CABLE()==0x0002)
LA-7610(Nexus Adapter,max 12 MDO / 2 MSEO3.3V, SDR only)
PRINT POWERNEXUS()&&(ID.CABLE()==0x0000)
Qorivva MPC5xxx/SPC5xx Debugger and NEXUS Trace 15 ©1989-2018 Lauterbach GmbH
Brief Overview of Documents for New Users
Architecture-independent information:
• “Debugger Basics - Training” (training_debugger.pdf): Get familiar with the basic features of a TRACE32 debugger.
• “T32Start” (app_t32start.pdf): T32Start assists you in starting TRACE32 PowerView instances for different configurations of the debugger. T32Start is only available for Windows.
• “General Commands” (general_ref_<x>.pdf): Alphabetic list of debug commands.
Architecture-specific information:
• “Processor Architecture Manuals”: These manuals describe commands that are specific for the processor architecture supported by your debug cable. To access the manual for your processor architecture, proceed as follows:
- Choose Help menu > Processor Architecture Manual.
• “RTOS Debuggers” (rtos_<x>.pdf): TRACE32 PowerView can be extended for operating system-aware debugging. The appropriate RTOS manual informs you how to enable the OS-aware debugging.
Further information:
• “Nexus Training” (training_nexus.pdf): Training for the NEXUS trace
• “Onchip/NOR FLASH Programming User’s Guide” (norflash.pdf): Onchip FLASH and off-chip NOR FLASH programming.
• “Debugger Basics - SMP Training” (training_debugger_smp.pdf): SMP debugging.
• “eTPU Debugger and Trace” (debugger_etpu.pdf): Debugging and tracing the eTPU/eTPU2.
• “GTM Debugger and Trace” (debugger_gtm.pdf): Debugging and tracing the Generic Timer Module (GTM).
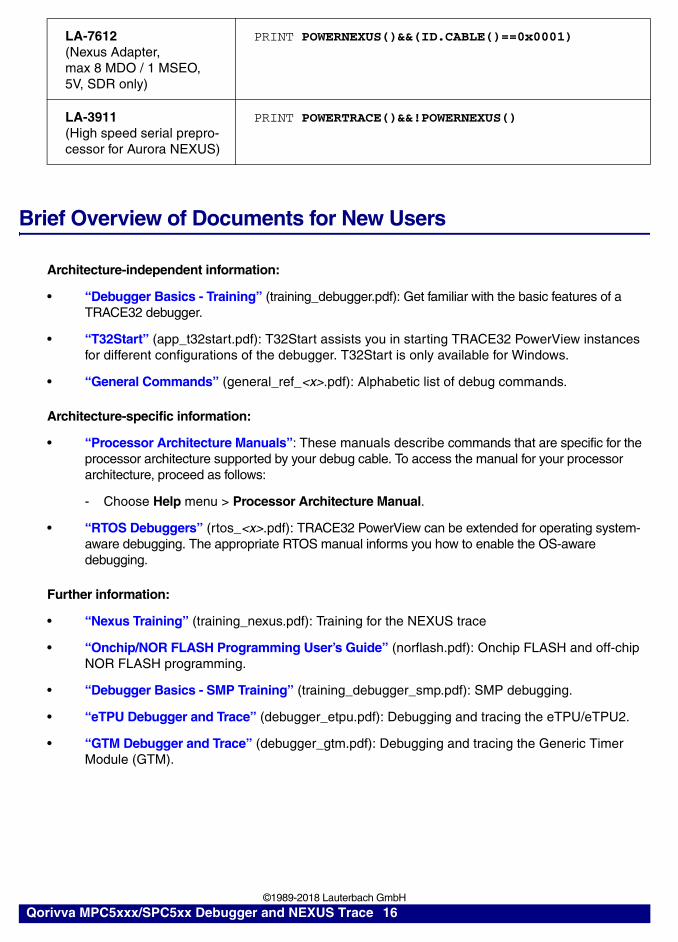
LA-7612(Nexus Adapter,max 8 MDO / 1 MSEO,5V, SDR only)
PRINT POWERNEXUS()&&(ID.CABLE()==0x0001)
LA-3911(High speed serial prepro-cessor for Aurora NEXUS)
PRINT POWERTRACE()&&!POWERNEXUS()
Qorivva MPC5xxx/SPC5xx Debugger and NEXUS Trace 16 ©1989-2018 Lauterbach GmbH
Target Design Requirement/Recommendations
General (ICD Debugger)
• Locate the JTAG/OnCE or Trace connector as close as possible to the processor to minimize the capacitive influence of the trace length and cross coupling of noise onto the JTAG signals. Don’t put any capacitors (or RC combinations) on the JTAG lines.
• Connect TDI, TDO, TMS and TCK directly to the CPU. Buffers on the JTAG lines will add delays and will reduce the maximum possible JTAG frequency. If you need to use buffers, select ones with little delay. Most CPUs will support JTAG above 30 MHz, and you might want to use high frequencies for optimized download performance.
• Ensure that JTAG RESET is connected directly to the RESET of the processor. This will provide the ability for the debugger to drive and sense the status of RESET. The target design should only drive RESET with open collector/open drain.
• For optimal operation, the debugger should be able to reset the target board completely (processor external peripherals, e.g. memory controllers) with RESET.
• In order to start debugging right from reset, the debugger must be able to control CPU RESET and CPU TRST (JCOMP) independently. There are board design recommendations to tie CPU TRST (JCOMP) to CPU RESET, but this recommendation is not suitable for JTAG debuggers.
.
Debug cable with blue ribbon cable
The T32 internal buffer/level shifter will be supplied via the VCCS pin. Therefore it is necessary to reduce the VCCS pull-up on the target board to a value smaller 10 .
Qorivva MPC5xxx/SPC5xx Debugger and NEXUS Trace 17 ©1989-2018 Lauterbach GmbH

Quick Start
Run Program from On-chip SRAM
Follow these steps to run a program from the on-chip SRAM:
1. Select the target processor, or use automatic CPU detection.
2. Multi-core processors: Select the core that starts running directly form reset
3. Start debug session. Debugger resets processor and halts the core at the reset address.
4. Cores with MMU: After SYStem.Up, the core’s MMU holds only a single TLB that maps the reset address. In order to run an application from SRAM, set up the required TLBs manually.
5. Cores with MMU: In order to run an application from SRAM, set up the required TLBs manually. For run-time memory access, the debugger requires a static translation table. As the core is halted and MMU set up, we can take the translation form the TLBs:
SYStem.CPU MPC5554; orSYStem.DETECT CPU
;MPC55XX/56XX: select core_0SYStem.CONFIG.CORE 1. 1.
;MPC5746M: select core_2SYStem.CONFIG.CORE 3. 1.
SYStem.Up
;initialize MPC55XX MMU (same as BAM)MMU.Set TLB1 0. 0x00000000 0x00000000 0x00000000MMU.Set TLB1 1. 0xC0000500 0xFFF0000A 0xFFF0003FMMU.Set TLB1 2. 0xC0000700 0x20000000 0x2000003FMMU.Set TLB1 3. 0xC0000400 0x40000000 0x4000003FMMU.Set TLB1 4. 0xC0000500 0xC3F00008 0xC3F0003FMMU.Set TLB1 5. 0xC0000700 0x00000000 0x0000003F
;copy core TLBs to debugger translation tableMMU.SCAN TLB1
;enable debugger based address translationTRANSlation.ON
Qorivva MPC5xxx/SPC5xx Debugger and NEXUS Trace 18 ©1989-2018 Lauterbach GmbH

6. MPC5XXX on-chip SRAM must be initialized (ECC) before usage.
7. Load the program.
8. Run program, e.g. until function main.
9. Display ASM/HLL core at current instruction pointer
Data.Set EA:0x40000000--0x4000FFFF%Quad 0x1122334455667788
Data.LOAD.Elf demo.elf ; ELF specifies the format,; demo.elf is the file name
Go main
List
Qorivva MPC5xxx/SPC5xx Debugger and NEXUS Trace 19 ©1989-2018 Lauterbach GmbH

Run Program from FLASH
Follow these steps to program an application to flash and run it:
1. Prepare FLASH programming. mpc5xxx.cmm detects the target processor and calls the appropriate flash script
2. Program application to FLASH. The command FLASH.ReProgram only erases and programs when required. The option /NoClear of the second Data.LOAD command keeps already loaded debug symbols.
3. The FLASH memory is now up-to-date. Reset the processor, so that the processor can load the RCHW form FLASH.
4. Cores with MMU: For run-time memory access, the debugger requires a static translation table. As the core’s MMU is not set up right now, copying the translation from the core is not possible. As projects usually use 1:1 translation, a manual declaration can be performed.
5. Run program, e.g. until function main.
6. Display ASM/HLL core at current instruction pointer
DO ~~/demo/powerpc/flash/mpc5xxx.cmm PREPAREONLY
;activate flash programming (unused sectors are erased) FLASH.ReProgram ALL /Erase
;load file(s) Data.LOAD.Elf project.x Data.LOAD.S3 data.s3 /NoClear
;commit data to flash FLASH.ReProgram off
SYStem.Up
;set up 1:1 address translation and enableTRANSlation.Create 0x00000000--0xFFFFFFFF 0x00000000TRANSlation.ON
Go main
List
Qorivva MPC5xxx/SPC5xx Debugger and NEXUS Trace 20 ©1989-2018 Lauterbach GmbH
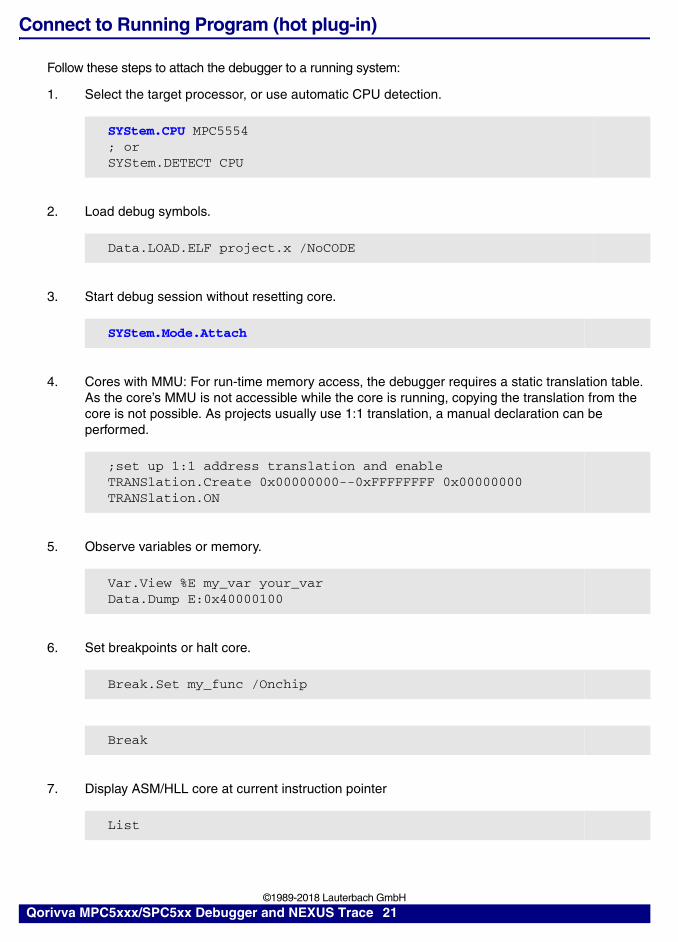
Connect to Running Program (hot plug-in)
Follow these steps to attach the debugger to a running system:
1. Select the target processor, or use automatic CPU detection.
2. Load debug symbols.
3. Start debug session without resetting core.
4. Cores with MMU: For run-time memory access, the debugger requires a static translation table. As the core’s MMU is not accessible while the core is running, copying the translation from the core is not possible. As projects usually use 1:1 translation, a manual declaration can be performed.
5. Observe variables or memory.
6. Set breakpoints or halt core.
7. Display ASM/HLL core at current instruction pointer
SYStem.CPU MPC5554; orSYStem.DETECT CPU
Data.LOAD.ELF project.x /NoCODE
SYStem.Mode.Attach
;set up 1:1 address translation and enableTRANSlation.Create 0x00000000--0xFFFFFFFF 0x00000000TRANSlation.ON
Var.View %E my_var your_varData.Dump E:0x40000100
Break.Set my_func /Onchip
Break
List
Qorivva MPC5xxx/SPC5xx Debugger and NEXUS Trace 21 ©1989-2018 Lauterbach GmbH
FAQ
FAQ (ICD Debugger)
Debugging via VPN
Ref: 0307
The debugger is accessed via Internet/VPN and the performance is very slow. What can be done to improve debug performance?
The main cause for bad debug performance via Internet or VPN are low data throughput and high latency. The ways to improve performance by the debugger are limited:
In PRACTICE scripts, use "SCREEN.OFF" at the beginning of the scriptand "SCREEN.ON" at the end. "SCREEN.OFF" will turn off screenupdates. Please note that if your program stops (e.g. on error) without exe-cuting "SCREEN.OFF", some windows will not be updated.
"SYStem.POLLING SLOW" will set a lower frequency for target statechecks (e.g. power, reset, jtag state). It will take longer for the debugger torecognize that the core stopped on a breakpoint.
"SETUP.URATE 1.s" will set the default update frequency ofData.List/Data.dump/Variable windows to 1 second (the slowest possiblesetting).
prevent unneeded memory accesses using "MAP.UPDATEONCE[address-range]" for RAM and "MAP.CONST [address--range]" forROM/FLASH. Address ranged with "MAP.UPDATEONCE" will read thespecified address range only once after the core stopped at a breakpoint ormanual break. "MAP.CONST" will read the specified address range onlyonce per SYStem.Mode command (e.g. SYStem.Up).
Qorivva MPC5xxx/SPC5xx Debugger and NEXUS Trace 22 ©1989-2018 Lauterbach GmbH

Setting a Software Breakpoint fails
Ref: 0276
What can be the reasons why setting a software breakpoint fails?
Setting a software breakpoint can fail when the target HW is not able to implement the wanted breakpoint. Possible reasons:
The wanted breakpoint needs special features that are only possible torealize by the trigger unit inside the controller.
Example: Read, write and access (Read/Write) breakpoints ("type" in Break.Set window). Breakpoints with checking in real-time for data-values ("Data"). Breakpoints with special features ("action") like TriggerTrace, TraceEnable, TraceOn/TraceOFF.
TRACE32 can not change the memory.Example: ROM and Flash when no preparation with FLASH.Create, FLASH.TARGET and FLASH.AUTO was made. All type of memory if the memory device is missing the necessary control signals like WriteEnable or settings of registers and SpecialFunctionRegisters (SFR).
Contrary settings in TRACE32.Like: MAP.BOnchip for this memory range. Break.SELect.<breakpoint-type> Onchip (HARD is only available for ICE and FIRE).
RTOS and MMU:If the memory can be changed by Data.Set but the breakpoint doesn't work it might be a problem of using an MMU on target when setting the breakpoint to a symbolic address that is different than the writable and intended memory location.
MPC55XX
Device censored
Ref: 0313
There is no debugger access due to a censored device. What can I do ?
The MPC5XXX processors implement a censorship feature. When enabled, the JTAG debugger is locked out and debugging or tracing is impossible. The debug implementation on the MPC5XXX does not allow to detect if a processor is censored or not. The indication of active censorship is that reading the JTAGID works, but any further accesses fail. The debugger will report a Emulation Debug Port Fail error and the additional error description in the message AREA will look like follows: JTAGID=0x______1D Error: received invalid OSR (0x000) is the device censored? If the processor was censored on intention, it is possible to regain access using this command sequence: SYStem.DETECT CPU SYStem.Option.KEYCODE 0xFEEDFACECAFEBEEF SYStem.Up Note:
If the password (keycode) is unknown or illegal (e.g. after accidentally eras-ing the shadow row), the processor is locked forever and can not be recov-ered, unless the application in flash provides a feature to unlock theprocessor (e.g. via CAN).
Some processors require the upper and lower 32-bit parts to be exchangedfor SYStem.Option.KEYCODE (e.g. 0xCAFEBEEFFEEDFACE instead of0xFEEDFACECAFEBEEF)
Qorivva MPC5xxx/SPC5xx Debugger and NEXUS Trace 23 ©1989-2018 Lauterbach GmbH

MPC55XX
EBI problems on MPC5510
Ref: 0325
The external bus interface (EBI) fails when the debugger (JTAG or NEXUS) is connected.
The cause of this problem is that there are two signals which are multiplexed between debugger and EBI usage: EVTI and EVTO. For the MPC5510 series, the function of these signals is controlled by the EVT_EN bit in the NPC_PCR register, which again is controlled by the debugger. The debugger will per default set the pin function to EVTI/EVTO. In order to use the signals for EBI (R/!W and !TA), use the EVTEN setting in the TrOnchip window: TrOnchip.EVTEN ON ; signals have EVTI/EVTO function. EBI functions disabled (default) TrOnchip.EVTEN OFF ; signals free for use by EBI or GPIO IMPORTANT NOTES:
If the NEXUS adapter LA-7610 is used, EVTI must be physically discon-nected from the debug/trace connector, because the LA-7610 will perma-nently drive EVTI.
If the NEXUS adapter LA-7630 is used, the EVTI pin will be tristated ifTrOnchip.EVTEN is set to OFF. It is recommended to disconnectEVTI/EVTO from the debug connector anyway (see below).
If the signals are used for EBI, it is strongly recommended to disconnectEVTI/EVTO from the debug connector. Unterminated signals can causeEBI problems, especially if the debugger is not connected.
MPC55XX
Error Message: "emulation pod configuration error"
Ref: 0105
Error message "emulation pod configuration error" after starting the T32 ICD software
This error can have three sources:
The CPU selection in the SYStem window does not match the CPU on thetarget. Check if the selection matches the processor on the target. Try touse auto detection (PPC..XX selection) if available.
The CPU detection failed. Check the JTAG connection to the target.
The CPU on the target is not supported by the used debugger softwarerelease. In most cases there is additional information given in the AREAwindow.
Qorivva MPC5xxx/SPC5xx Debugger and NEXUS Trace 24 ©1989-2018 Lauterbach GmbH

MPC55XX
Problems with displaying and/or tracing VLE code
Ref: 0285
The disassembly shows invalid code with many undef/align "instructions". Trace list shows FLOWERRORS. How can I fix this?
Please see section "Tracing VLE or mixed FLE/VLE applications" in debugger_mpc5500.pdf
MPC55XX/56XX
Run-Time Memory Access Restrictions
Ref: 0346
Some variables show wrong values or can not be modified during run-time. What causes this problem and how can it be solved?
See chapter "Memory Coherency During run-time Memory Access" in debugger_mpc5500.pdf
MPC56XX
XPC56XX EVB motherboard issues
Ref: 0361
What problems can cause that the debugger fails to connect to an XPC56XX EVB motherboard?
When working with the XPC56XX EVB motherboard + a processor minimodule, the debug and trace signals have more than one end point: The JTAG connector, the trace connector and the pin array on the motherboard. The end points are unterminated and can cause signal reflections which disturb debugging. Especially the branch line of TCK to the EVB motherboard can cause problems. If the debugger fails to connect (configuration error or debug port fail), we recommend to disconnect the signal path to the motherboard, or at least terminate TCK at the XPC56XX EVB motherboard's pin array with a 220~470 Ohm resistor to GND.
MPC5XXX
Bus Errors in Internal SRAM
Ref: 0144
Why does the debugger display bus errors (question marks) for the internal SRAM or local memories?
The SRAM and local memories have an ECC protection. After power-on, SRAM and the corresponding ECC bits hold random values. Therefore, depending on the combination of values, an ECC block (usually 64 or 32 bits) might or micht not be displayed as a bus error. When an application is programmed to FLASH, it is the responsibility of the boot code to initialize the SRAM. Only if it is intended to run an application from SRAM (e.g. as early test or for flash programming), the SRAM must be initialized through the debugger using the command: Data.Set EA:0x40000000--0x4000BFFF %Quad 0x0000000000000000
Qorivva MPC5xxx/SPC5xx Debugger and NEXUS Trace 25 ©1989-2018 Lauterbach GmbH

FAQ (NEXUS Debugger)
Connect a Nexus Probe to a PowerTrace Unit
Ref: 0197
How do I correctly connect a Nexus Probe to a PowerTrace unit?
A Nexus probe has one, two or three ribbon cables for the connection to the PowerTrace unit. The PowerTrace has three connectors which are marked with A, B and C. (C is close to the black heatsink) Nexus probe connectors of newer probes are also marked with A, B and C. Place the appropriate cable into the corresponding connector. For older probes note the following: • Probes with a single cable: connect the ribbon cable to connector C. • Probes with two cables: connect the upper cable to connecter C, the second cable underneath to B. • Probes with three cables: connect the upper cable to connecter C, the second cable underneath to B and the third cable below to connector A. One does not require an additional JTAG dongle!
Incorrect Nexus-POD CPLD Revision
Ref: 0179
What is the reason for "Incorrect Nexus-POD CPLD revision" message?
There are several reasons for the following message: Incorrect Nexus-POD CPLD revision - Please call technical support (refer to AREA) • A wrong T32xxx.EXE has been executed (e.g. Super10.exe for a Copperhead probe) Just use the right SW. • The current SW contains a new image for the CPLD on the probe. This reason is very seldom, but it may happen. One have to consider, that it is just a warning and normally one can continue using the debugger. However only for the case, the Area window shows a similar "expected CPLD revision number". It is recommended to contact your next support office. One will get a SW-Tool and some instructions how to fix it. • The probe is defective. This reason can be recognized if the expected CPLD revision number is totally different from the current CPLD revision number, or even 0x00000 or 0xFFFFF. It is a serious reason and requires to send the probe back for repair. Also contact your local support office first.
Qorivva MPC5xxx/SPC5xx Debugger and NEXUS Trace 26 ©1989-2018 Lauterbach GmbH

Missing Address Information on Top of the Trace
Ref: 0263
Is there any reason why symbol addresses and names are not displayed from the beginning of the trace?
The Nexus protocol defines that a full address is transferred only occasionally, just in a Branch-Trace-Sync-Message and Data-Trace-Sync-Message. Most of the time only the significant portion of the current address is generated in the device and transferred in a Nexus message. Therefore the address can only be reconstructed and displayed after occurrence of a Sync-Message in the trace memory. A Sync messages is generated automatically after 255 messages latest. A single Nexus message without knowing what had happened before is useless! Look at the T.L /NEXUS , then one will see the location of the DTSM . After that location the address information is visible. A Sync message could be missing on top of the trace in the following cases:
Any time Program is running before trace is in ARM state! Normally if ana-lyzer is armed manually!
In FIFO mode if trace memory overflows.
Selective trace using Watchpoints
Selective trace using CTU
Some other cases.
Nexus Connector Pinout on Target
Ref: 0311
I don't know exactly which signals from MCU must be connected to which
signal on the AUX-port connector.
Must certain signals be crossed ?
Not at all. The pin out one can find in the manual and at our home page, fits the description of Nexus standard from the target point of view. With other words, you have to connect the signals from the device to the appropriate signals with the same name on the connector. You must not take care about signal crossing.
Qorivva MPC5xxx/SPC5xx Debugger and NEXUS Trace 27 ©1989-2018 Lauterbach GmbH

Target Aux Port Connector Location and Extension Cables
Ref: 0162
Can I use a longer extension cable?
Often customer ignore the warnings regarding the locaction of the aux port connector and regarding additional extension cables between the debugger and the target. This can cause a lot of trouble, especially for high speed applications. We strongly recommend to place the aux port connector as close as possible nearby the CPU. As closer as better. Take care about the signal trace length. Do not connect aux port signals to other connectors than the aux port connector and prevent signal stubs. Connect a proper termination to the signals coming from the probe, close to the CPU. Signals from the CPU to the probe should not be terminated. One can add 0 Ohm resistors in line of each Nexus signal close to the CPU. If necessary 0 Ohm can be replaced by a better value. The debugger does normally not need any pull-up or pull-down, except for reset. Care must just be taken just for non-Nexus signals. Bear in mind that the target needs possibly a pull-up or pull-down for certain signals if the debugger is not connected. Pay attention about the recommendations of the device manufacturer regarding the circuitry around the Nexus Aux port. We also recommend to use no other extension cables than the cables which come with the debugger. If possible do not use additional cables at all. Longer cables may work, but must not. It is the customers risk to use longer once as recommended. We can not guarantee proper operation.
MPC55XX
Device censored
Ref: 0313
There is no debugger access due to a censored device. What can I do ?
The MPC5XXX processors implement a censorship feature. When enabled, the JTAG debugger is locked out and debugging or tracing is impossible. The debug implementation on the MPC5XXX does not allow to detect if a processor is censored or not. The indication of active censorship is that reading the JTAGID works, but any further accesses fail. The debugger will report a Emulation Debug Port Fail error and the additional error description in the message AREA will look like follows: JTAGID=0x______1D Error: received invalid OSR (0x000) is the device censored? If the processor was censored on intention, it is possible to regain access using this command sequence: SYStem.DETECT CPU SYStem.Option.KEYCODE 0xFEEDFACECAFEBEEF SYStem.Up Note:
If the password (keycode) is unknown or illegal (e.g. after accidentally eras-ing the shadow row), the processor is locked forever and can not be recov-ered, unless the application in flash provides a feature to unlock theprocessor (e.g. via CAN).
Some processors require the upper and lower 32-bit parts to be exchangedfor SYStem.Option.KEYCODE (e.g. 0xCAFEBEEFFEEDFACE instead of0xFEEDFACECAFEBEEF)
Qorivva MPC5xxx/SPC5xx Debugger and NEXUS Trace 28 ©1989-2018 Lauterbach GmbH

MPC55XX
EBI problems on MPC5510
Ref: 0325
The external bus interface (EBI) fails when the debugger (JTAG or NEXUS) is connected.
The cause of this problem is that there are two signals which are multiplexed between debugger and EBI usage: EVTI and EVTO. For the MPC5510 series, the function of these signals is controlled by the EVT_EN bit in the NPC_PCR register, which again is controlled by the debugger. The debugger will per default set the pin function to EVTI/EVTO. In order to use the signals for EBI (R/!W and !TA), use the EVTEN setting in the TrOnchip window: TrOnchip.EVTEN ON ; signals have EVTI/EVTO function. EBI functions disabled (default) TrOnchip.EVTEN OFF ; signals free for use by EBI or GPIO IMPORTANT NOTES:
If the NEXUS adapter LA-7610 is used, EVTI must be physically discon-nected from the debug/trace connector, because the LA-7610 will perma-nently drive EVTI.
If the NEXUS adapter LA-7630 is used, the EVTI pin will be tristated ifTrOnchip.EVTEN is set to OFF. It is recommended to disconnectEVTI/EVTO from the debug connector anyway (see below).
If the signals are used for EBI, it is strongly recommended to disconnectEVTI/EVTO from the debug connector. Unterminated signals can causeEBI problems, especially if the debugger is not connected.
MPC55XX
Error Message: "emulation pod configuration error"
Ref: 0105
Error message "emulation pod configuration error" after starting the T32 ICD software
This error can have three sources:
The CPU selection in the SYStem window does not match the CPU on thetarget. Check if the selection matches the processor on the target. Try touse auto detection (PPC..XX selection) if available.
The CPU detection failed. Check the JTAG connection to the target.
The CPU on the target is not supported by the used debugger softwarerelease. In most cases there is additional information given in the AREAwindow.
Qorivva MPC5xxx/SPC5xx Debugger and NEXUS Trace 29 ©1989-2018 Lauterbach GmbH

MPC55XX
Problems with displaying and/or tracing VLE code
Ref: 0285
The disassembly shows invalid code with many undef/align "instructions". Trace list shows FLOWERRORS. How can I fix this?
Please see section "Tracing VLE or mixed FLE/VLE applications" in debugger_mpc5500.pdf
MPC55XX/56XX
Run-Time Memory Access Restrictions
Ref: 0346
Some variables show wrong values or can not be modified during run-time. What causes this problem and how can it be solved?
See chapter "Memory Coherency During run-time Memory Access" in debugger_mpc5500.pdf
MPC56XX
MDO12 mode works, but MDO16 mode fails
Ref: 0322
16 BIT NEXUS trace does not work, earlier Nexus probe however work. What could be the reason ?
A reason can be that the adapter from mictor38/Glenair51 to Mictor76 is not yet prepared for 16 bit MDO. Refer to FAQ "16 Bit AUX-Port Width "
MPC56XX
XPC56XX EVB motherboard issues
Ref: 0361
What problems can cause that the debugger fails to connect to an XPC56XX EVB motherboard?
When working with the XPC56XX EVB motherboard + a processor minimodule, the debug and trace signals have more than one end point: The JTAG connector, the trace connector and the pin array on the motherboard. The end points are unterminated and can cause signal reflections which disturb debugging. Especially the branch line of TCK to the EVB motherboard can cause problems. If the debugger fails to connect (configuration error or debug port fail), we recommend to disconnect the signal path to the motherboard, or at least terminate TCK at the XPC56XX EVB motherboard's pin array with a 220~470 Ohm resistor to GND.
Qorivva MPC5xxx/SPC5xx Debugger and NEXUS Trace 30 ©1989-2018 Lauterbach GmbH

MPC5XXX
Bus Errors in Internal SRAM
Ref: 0144
Why does the debugger display bus errors (question marks) for the internal SRAM or local memories?
The SRAM and local memories have an ECC protection. After power-on, SRAM and the corresponding ECC bits hold random values. Therefore, depending on the combination of values, an ECC block (usually 64 or 32 bits) might or micht not be displayed as a bus error. When an application is programmed to FLASH, it is the responsibility of the boot code to initialize the SRAM. Only if it is intended to run an application from SRAM (e.g. as early test or for flash programming), the SRAM must be initialized through the debugger using the command: Data.Set EA:0x40000000--0x4000BFFF %Quad 0x0000000000000000
NEXUS-MPC5500
Debugger Impacts
Ref: 0150
Is there any impact on processing power when using Nexus trace and JTAG debugger?
Using the default settings of the debugger, there is no impact on the target system performance. Under certain conditions using the debugger can have an impact on the perfoemance of the target system:
Enabling SYStem.Option.STALL will cause the core to stop if the NEXUSmessage FIFO on the processor is full.
If run-time memory access is enabled, the debugger can genreate memorytransactions while the processor is running. The debugger's memory trans-cations can occur concurrently to the processor's transactions and causelittle delay.
NEXUS-MPC5500
Energy measurement impacts
Ref: 0357
What are the impacts of the Nexus probe during energy measurement ?
Some recommendation for Energy measurements using the Nexus probe: In case of Nexus AutoFocus probe LA-7630 , it is recommended to turn the active termination off. There is not much difference between disable Nexus trace probe hardware (Analyzer.disable) and turn off the Nexus cell (NEXUS.OFF).
Qorivva MPC5xxx/SPC5xx Debugger and NEXUS Trace 31 ©1989-2018 Lauterbach GmbH
NEXUS-MPC5500
Lost Messages
Ref: 0145
Why are sometimes certain messages not visible in the trace?
The collision priority management of the MPC5500 family causes, that lower priority messages are canceled by higher priority messages if they occur at the same time. Refer to Freescale's documentation. All messages have the following priorit: WPM - OTM - BTM - DTM. A BTM message which attempts to enter the queue at the same time as a watchpoint message or ownership trace message will be lost. An error message will be sent indicating the BTM was lost. The following direct/indirect branch will queue a direct/indirect branch w/ sync. message. The count value within this message will reflect the number of sequential instructions executed after the last successful BTM Message was generated. This count will include the branch which did not generate a message due to the collision. A DTM message which attempts to enter the queue at the same time as a watchpoint message or ownership trace message or branch trace message will be lost. A subsequent read/write will queue a data trace read/write w/ sync. message.
NEXUS-MPC5500
MDO 16 Bit Operation
Ref: 0310
Does TRACE32 NEXUS MPC5XXX support 16 bit MDO operation?
TRACE32 PowerTools support MDO16 operation with the NEXUS adapter LA-7630 (NEXUS AutoFocus). LA-7610 and LA-7612 do not support MDO16.
Note for Mictor38 connection (LA-7631): The standardized Mictor38 con-nector for NEXUS only defines 12 MDO signals (MDO0..11). The signalsMDO12..15 were added later and assigned to reserved pins. To avoid anyrisc of damage, LA-7631 (converter LA-7630/Mictor76 to Mictor38) does esnot connect these signals by default. In order to enable MDO16 operation,J100..J103 on top of the LA-7631 have to be closed using 0 Ohm resistors.If the 0 Ohm resistors are mounted on the adapter, take care that no volt-age level more than 5V is connected on targets which do not supportMDO16.
The Glenair51 connector (Adapter LA-7632) does NOT support MDO16.
Qorivva MPC5xxx/SPC5xx Debugger and NEXUS Trace 32 ©1989-2018 Lauterbach GmbH
NEXUS-MPC5500
Nexus Autofocus Probe + PT-I restriction
Ref: 0327
I'm getting error messages during debugger startup using the Nexus Autofocus Probe (LA-7630) and Powertrace-I (LA-7705,LA-7707,LA-7690). What can be the reason ?
The error message Nexus Probe : Lost FPGA configuration during T32 startup , may be a hint about an issue with the PT-I. The Nexus Autofocus Probe (LA-7630) works with PowerTrace-I Units in any case, if the serial number is higher than E0312000xxxx. If the serial number is below , there is no chance to use the new MNZX probe. For all units with serial numbers between the mentioned numbers , it is recommenden to ask the local representative what is required to do to work with the MNZX probe. For serial numbers between E0201000xxxx and E03020003999 , a modification of the PT-I board is needed and we recommend to exchange the trace board (MESR_x) to the latest revision. For serial numbers between E03020004000 and E0312000xxxx , just a modification of the PT-I board is needed. For modification , the PT-I unit and the MNZX probe must be sent back to Lauterbach.
NEXUS-MPC5500
Nexus probe replaces JTAG dongle
Ref: 0386
Can the Nexus port totally be disabled ?
For the case the NEXUS port is not needed for any reason or if the Nexus probe is just used as a replacement for a JTAG dongle, the Nexus client can be disabled. Any NEXUS activity at the NEXUS related pins are then turned off. To establish that behavior NEXUS.OFF must be used. However, take care if this command is used after system startup. If one disables the Nexus client before the correct CPU is detected or setup (SYStem.Up), the NEXUS client will be re-enabled automatically after the particular CPU has been recognized. To avoid this behavior, use the command SYStem.DETECT.CPU as one of the first commands before any SYStem.Up instruction in your start-up script. If NEXUS.OFF is an unknown command, ask for a SW update.
NEXUS-MPC5500
Power fail reasons
Ref: 0323
Why do I get power fail messages, despite target power is correct at the reference pin ?
If one cannot execute SYStem.Up for the debugger and power fail is detected instead, it should be checked if two debugger (e.g. JTAG dongle and NEXUS probe) are connected at the same time. This is a not allowed configuration which causes that neither the JTAG dongle nor the NEXUS probe can be used for debugging.
Qorivva MPC5xxx/SPC5xx Debugger and NEXUS Trace 33 ©1989-2018 Lauterbach GmbH

NEXUS-MPC5500
Slow Reset
Ref: 0282
Why does Reset take longer if a Nexus Class 2/3+ debugger is used in respect to a class 1 Nexus debugger or if no debugger is attached?
The delay is caused by the debugger. During target reset, all breakpoints, watchpoints and other settings are cleared by the reset logic of the CPU. The NEXUS class 2/3+ debugger will detect a target reset on the signals RSTIN and (optional) RSTOUT. After reset, the debugger has to program the debug registers, breakpoints and watchpoints again. This causes an extra delay between asserting reset and start of program execution.
NEXUS-MPC5500
Watchdog timer, Tool detect
Ref: 0326
How to manage external watch dog timer (WDT) control ?
Please see section "Watchdog Timer Support" in debugger_mpc5500.pdf
NEXUS-MPC5500
Which Nexus probe for which PPC device
Ref: 0329
Is there a list about the different available Nexus probes, that informs about PPC devices which can be supported with?
Please refer to the last part of the document below.
http://www.lauterbach.com/faq/probediff-customer.pdf
NEXUS-PPC5500
Universal JTAG Adapter LA-7640
Ref: 0383
Where can I use the Universal JTAG-Adapter LA-7640?
Please refer to the document below.
http://www.lauterbach.com/faq/universal_jtag-adapter-la-7640.pdf
Qorivva MPC5xxx/SPC5xx Debugger and NEXUS Trace 34 ©1989-2018 Lauterbach GmbH
Debugging
Breakpoints
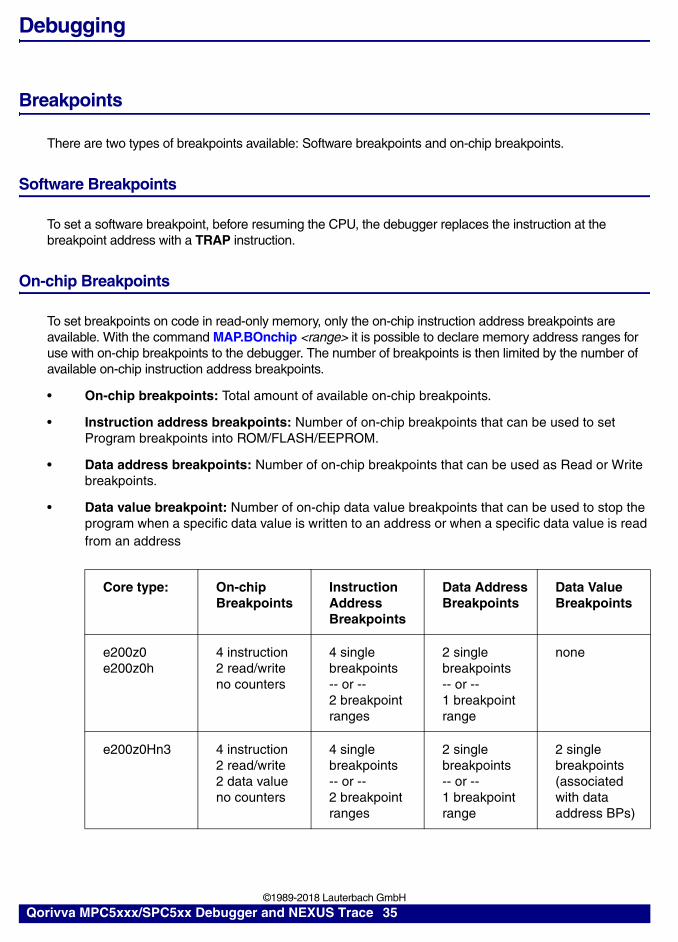
There are two types of breakpoints available: Software breakpoints and on-chip breakpoints.
Software Breakpoints
To set a software breakpoint, before resuming the CPU, the debugger replaces the instruction at the breakpoint address with a TRAP instruction.
On-chip Breakpoints
To set breakpoints on code in read-only memory, only the on-chip instruction address breakpoints are available. With the command MAP.BOnchip <range> it is possible to declare memory address ranges for use with on-chip breakpoints to the debugger. The number of breakpoints is then limited by the number of available on-chip instruction address breakpoints.
• On-chip breakpoints: Total amount of available on-chip breakpoints.
• Instruction address breakpoints: Number of on-chip breakpoints that can be used to set Program breakpoints into ROM/FLASH/EEPROM.
• Data address breakpoints: Number of on-chip breakpoints that can be used as Read or Write breakpoints.
• Data value breakpoint: Number of on-chip data value breakpoints that can be used to stop the program when a specific data value is written to an address or when a specific data value is read from an address
Core type: On-chipBreakpoints
InstructionAddressBreakpoints
Data AddressBreakpoints
Data ValueBreakpoints
e200z0e200z0h
4 instruction2 read/writeno counters
4 single breakpoints-- or --2 breakpoint ranges
2 single breakpoints -- or --1 breakpoint range
none
e200z0Hn3 4 instruction2 read/write2 data valueno counters
4 single breakpoints -- or --2 breakpoint ranges
2 single breakpoints-- or --1 breakpoint range
2 single breakpoints (associated with data address BPs)
Qorivva MPC5xxx/SPC5xx Debugger and NEXUS Trace 35 ©1989-2018 Lauterbach GmbH

You can see the currently set breakpoints with the command Break.List.
If no more on-chip breakpoints are available you will get an error message when trying to set a new on-chip breakpoint.
Breakpoints on Program Addresses
The debugger sets software and on-chip breakpoints to the effective address. If a breakpoint is set on a program address, the debugger will first try to set a software breakpoint. If writing the software breakpoint fails (translation error or bus error), then an on-chip breakpoint will be set instead. If a memory range must
e200z1e200z3e200z6e200z650e200z750
4 instruction2 read/write2 counters
4 single breakpoints-- or --2 breakpoint ranges
2 single breakpoints -- or --1 breakpoint range
none
e200z335 4 instruction2 read/write2 data value2 counters
4 single breakpoints -- or --2 breakpoint ranges
2 single breakpoints-- or --1 breakpoint range
2 single breakpoints (associated with data address BPs)
e200z446e200z4de200z760
8 instruction2 read/write2 data value2 counters
8 single breakpoints -- or --2 breakpoint ranges and 4 single breakpoints
2 single breakpoints-- or --1 breakpoint range
2 single breakpoints (associated with data address BPs)
e200z210e200z215e200z225e200z420e200z425e200z720e200z4201e200z4203e200z4204e200z4251e200z7260
8 instruction4 read/write2 data valueno counters
8 single breakpoints -- or --4 breakpoint ranges
4 single breakpoints-- or --2 breakpoint ranges
2 single breakpoints (associated with data address BPs)
Core type: On-chipBreakpoints
InstructionAddressBreakpoints
Data AddressBreakpoints
Data ValueBreakpoints
Qorivva MPC5xxx/SPC5xx Debugger and NEXUS Trace 36 ©1989-2018 Lauterbach GmbH
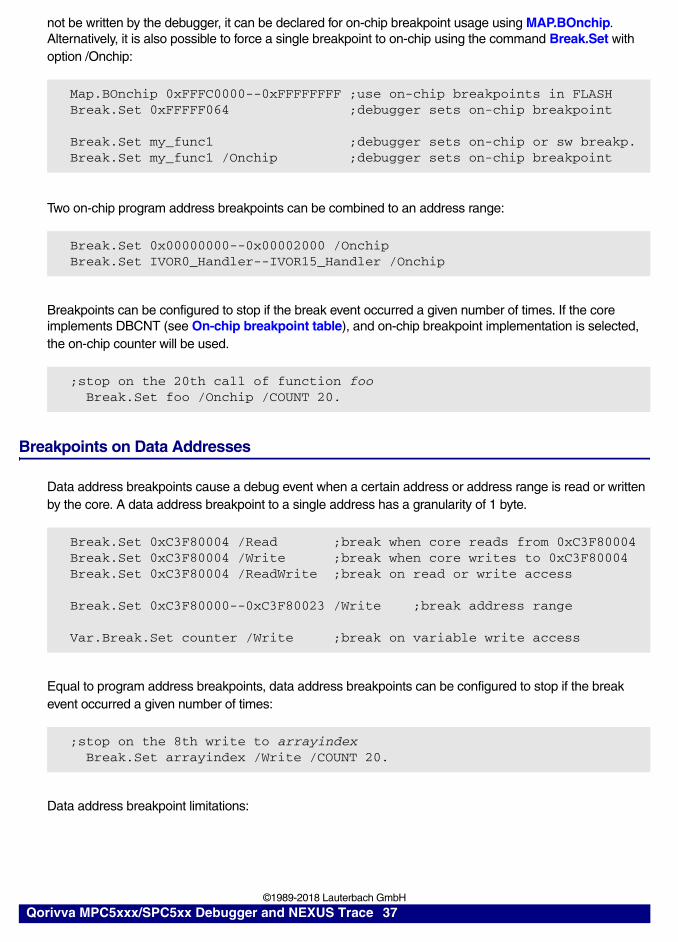
not be written by the debugger, it can be declared for on-chip breakpoint usage using MAP.BOnchip. Alternatively, it is also possible to force a single breakpoint to on-chip using the command Break.Set with option /Onchip:
Two on-chip program address breakpoints can be combined to an address range:
Breakpoints can be configured to stop if the break event occurred a given number of times. If the core implements DBCNT (see On-chip breakpoint table), and on-chip breakpoint implementation is selected, the on-chip counter will be used.
Breakpoints on Data Addresses
Data address breakpoints cause a debug event when a certain address or address range is read or written by the core. A data address breakpoint to a single address has a granularity of 1 byte.
Equal to program address breakpoints, data address breakpoints can be configured to stop if the break event occurred a given number of times:
Data address breakpoint limitations:
Map.BOnchip 0xFFFC0000--0xFFFFFFFF ;use on-chip breakpoints in FLASHBreak.Set 0xFFFFF064 ;debugger sets on-chip breakpoint
Break.Set my_func1 ;debugger sets on-chip or sw breakp.Break.Set my_func1 /Onchip ;debugger sets on-chip breakpoint
Break.Set 0x00000000--0x00002000 /OnchipBreak.Set IVOR0_Handler--IVOR15_Handler /Onchip
;stop on the 20th call of function foo Break.Set foo /Onchip /COUNT 20.
Break.Set 0xC3F80004 /Read ;break when core reads from 0xC3F80004Break.Set 0xC3F80004 /Write ;break when core writes to 0xC3F80004Break.Set 0xC3F80004 /ReadWrite ;break on read or write access
Break.Set 0xC3F80000--0xC3F80023 /Write ;break address range
Var.Break.Set counter /Write ;break on variable write access
;stop on the 8th write to arrayindex Break.Set arrayindex /Write /COUNT 20.
Qorivva MPC5xxx/SPC5xx Debugger and NEXUS Trace 37 ©1989-2018 Lauterbach GmbH

1. The source of the data access (read and/or write) must be the core, as the data address breakpoints are part of the core. Any other accesses from on-chip or off-chip peripherals (DMA etc.) will not be recognized by the data address breakpoints.
2. The data being targeted must be qualified by an address in memory. It is not possible to set a data address breakpoint to GPR, SPR etc.
Breakpoints on Data Access at Program Address
A normal data access breakpoint as described above hits on all data accesses to the memory address or address range, independent of the program address which caused the access. It is also possible to set a data address breakpoint which only hits if the access is performed from a specified program address. The specified program address must be a load or store instruction.
The program address can also be an address range or a range of debug symbols:
Breakpoints on Data Value
Most e200 cores (see On-chip breakpoint table) implement two on-chip breakpoints on data value
For e200 cores without on-chip data value breakpoints, TRACE32 supports them by software emulation. When a data value breakpoint is set, the debugger will use one of the data address breakpoints. When the core hits that breakpoint, the target application will stop and the debugger will evaluate if the data value matches. If the value matches, the debugger will stop execution, if it does not match, the debugger will restart the application. Using software emulated data value breakpoints will cause the target application to slow down.
In case of the NEXUS debugger and trace, breakpoints on data value can be realized using the complex trigger unit. See “Complex Trigger Unit for Nexus MPC5xxx” (app_ctu_mpc5xxx.pdf).
;Break if the instruction at address 0x40001148 reads from variable count Break.Set 0x40001148 /MemoryRead count
;Break if the instruction at address 0x40001148 writes to range Break.Set 0x40001148 /MemoryWrite 0xFFFFF000--0xFFFFFFFF
;Break on all accesses to count from code of the address range Break.Set 0x40000100--0x400001ff /MemoryReadWrite count
;Break if variable nMyIntVar is written by an interrupt handler;(debug symbols IVORxx_Handler loaded from debug symbols) Break.Set IVOR0_Handler--IVOR15_Handler /MemoryWrite nMyIntVar
;Break if variable nTestValue is written within function test_func Break.Set sYmbol.RANGE(test_func) /MemoryWrite nTestValue
;Break if variable nTestValue is written outside of test_func Break.Set sYmbol.RANGE(test_func) /EXclude /MemoryWrite nTestValue
Qorivva MPC5xxx/SPC5xx Debugger and NEXUS Trace 38 ©1989-2018 Lauterbach GmbH

Examples for setting data value breakpoints:
Counting Debug Events with Core Performance Monitor
The same debug events that are used for the above breakpoint examples can also be used as watchpoints, which can be used as input event to the core performance monitor. For more information about the core performance monitor, see BMC.
The example below shows how to count the number of times, a certain function has been called:
Counting data accesses is similar. The following example calculates the percentage of variable writes with a certain value (compared to all writes to this variable):
;Break when the value 0x1233 is written to the 16-bit word at 0x40000200 Break.Set 0x40000200 /Write /Data.Word 0x1233
;Break when a value not equal 0x98 is written to the 8-bit variable xval Break.Set xval /Write /Data.Byte !0x98
;Break when decimal 32-bit value 4000 is written ;to variable count within function foo Break.Set sYmbol.RANGE(foo) /MemoryWrite count /Data.Long 4000.
;Set Alpha..Echo breakpoints to functions of interest Break.Set my_func /Program /Onchip /Alpha Break.Set othr_func /Program /Onchip /Beta
;Configure BMC (only CNT2 and CNT3 can count debug events) BMC.state BMC.CNT2.EVENT ALPHA BMC.CNT3.EVENT BETA
;Set up debug events Var.Break.Set xval /Write /Onchip /Alpha Var.Break.Set xval /Write /Onchip /Data 0x98 /Beta
;Configure BMC (only CNT2 and CNT3 can count debug events) BMC.state BMC.CNT2.EVENT ALPHA BMC.CNT3.EVENT BETA
;Show ratio BMC.CNT3.RATIO X/CNT2
Qorivva MPC5xxx/SPC5xx Debugger and NEXUS Trace 39 ©1989-2018 Lauterbach GmbH

Memory Access
Access Classes
Access classes are used to specify how TRACE32 PowerView accesses memory, registers of peripheral modules, addressable core resources, coprocessor registers and the TRACE32 Virtual Memory.
Addresses in TRACE32 PowerView consist of:
• An access class, which consists of one or more letters/numbers followed by a colon (:)
• A number that determines the actual address
Here are some examples:
Access Classes to Memory and Memory Mapped Resources
The following memory access classes are available:
In addition to the access classes, there are access class attributes.
Command: Effect:
List P:0x1000 Opens a List window displaying program memory
Data.dump D:0xFF800000 /LONG Opens a DUMP window at data address 0xFF800000
Data.Set SPR:415. %Long 0x00003300 Write value 0x00003300 to the SPR IVOR15
PRINT Data.Long(ANC:0xFFF00100) Print data value at physical address 0xFFF00100
Access Class Description
P Program (memory as seen by core’s instruction fetch)
F Program, disassembly shows std. PowerPC instructions
V Program, disassembly shows VLE encoded instructions
D Data (memory as seen by core’s data access)
IC L1 Instruction Cache (or L1 Unified cache)
DC L1 Data Cache
L2 L2 Cache
NC No Cache (access with caching inhibited)
EEC Emulation memory in MPC57XX/SPC57X emulation devices
Qorivva MPC5xxx/SPC5xx Debugger and NEXUS Trace 40 ©1989-2018 Lauterbach GmbH

The following access class attributes are available:
Examples of usage:
If an access class attribute is specified without an access class, TRACE32 PowerView will automatically add the default access class of the used command. For example, Data.List U:0x100 is complemented to Data.List UP:0x100.
Access Classes to Other Addressable Core and Peripheral Resources
The following access classes are used to access registers which are not mapped into the processor’s memory address space.
SPR, PMR and DCR registers are addressed by specifying the register number after the access class.
Access Class Attributes Description
E Use real-time memory access.This attribute has no effect if SYStem.Option.MemAccess is set to Disabled).
A Given address is physical (bypass MMU)
U TS (translation space) == 1 (user memory)
S TS (translation space) == 0 (supervisor memory)
Command: Effect:
Data.List SP:0x1000 Opens a List window displaying supervisor program memory
Data.Set ED:0x3330 0x4F Write 0x4F to address 0x3330 using real-time memory access
Data.dump EEEC:0x0C000000
Opens dump window on emulation memory using real-time memory access
Access Class Description
SPR Special Purpose Register (SPR) access
PMR Performance Monitor Register (PMR) access
DCR Device Control Register (DCR) access
TLB Access to the core’s TLB entries
DBG NEXUS register and special debug register access
Qorivva MPC5xxx/SPC5xx Debugger and NEXUS Trace 41 ©1989-2018 Lauterbach GmbH

The access class TLB gives access to the TLB entries of the e200 core. The TLB contents are provided in the way they are represented in the MAS registers. The most significant byte is used to address the TLB table:
The TLB access class is supplementary and allows reading TLBs as well as bit field modification of TLB entries. For general MMU/MPU setup, it is recommended to use the command MMU.Set.
The access class DBG, which covers a wide variety of accesses, has a special encoding. The encoding as listed below is only valid for the MPC5XXX debugger.
NOTE: The registers mapped through the DBG access class are automatically configured by the debugger. Manual changes are likely to disturb debugger/trace functionality and in most cases will be overwritten by the debugger. Use the NEXUS commands to configure tracing instead of directly writing to the NEXUS registers.
TLB access mask Description
TLB:0x8100iiiM
legacy access:TLB:0x0000iiiM
Access to TLB1 table (MMU).iii: TLB indexM: Byte offset to TLB content as represented in MAS registers(0..3=MAS1, 4..7=MAS2, 8..11=MAS3, 12..15=unused)
TLB:0x8200iiiM Access to TLB2 table (MPU).iii: TLB indexM: Byte offset to TLB content as represented in MAS registers(0..3=MAS0, 4..7=MAS1, 8..11=MAS2, 12..15=MAS3)
DBG access mask Description
DBG:0x01ttN0RR Access to NEXUS registers of non-core NEXUS clients, e.g. NPC, NAR, NXDM, NXFR, NXSS, NXMC, SPU and GTMDI
tt: TAP access command (ACCESS_AUX_...)N: NEXUS_ENABLE command (usually zero)RR: NEXUS register ID
DBG:0x03ttN0RR Same as above, but for NEXUS clients on the Buddy Device
DBG:0x02tt0CRR Access to eTPU NEXUS registers
tt: TAP access command (ACCESS_AUX_...)C: eTPU client selectionRR: eTPU register ID
DBG:0x04tttttt Access to DWPU tag RAM (32-bit wise)tttttt: Tag RAM address (one tag RAM accesss increment = 256-byte PD memory block)
DBG:0x00000004...DBG:0x0000007E
e200 core NEXUS register access (address = register index * 2)
DBG:0x400 (CDACNTL)DBG:0x401 (CDADATA)
e200 core cache debug register access
Qorivva MPC5xxx/SPC5xx Debugger and NEXUS Trace 42 ©1989-2018 Lauterbach GmbH

Cache Debugging Support
Memory Coherency
If a core is halted in debug mode, the debugger maintains cache coherency when the default access classes are used. The default access classes are written in bold letters in the table below. The other access classes allow the intentional modification certain memory without maintaining coherency.
The following table describes which memory will be accessed depending on the used access class:.
(1): if SYStem.Option.DCREAD is ON (default: ON)(2): if SYStem.Option.ICREAD is ON (default: OFF)(3): only if SYStem.Option ICFLUSH is OFF (default: OFF)(4): reading from memory only if not found in cache
Memory Coherency During run-time Memory Access
Some e200 cores only support run-time access to uncached memory. The affected cores are e200 cores which implement data or unified cache and which support operating the cache in copy-back mode (e200z6, e200z650, e200z750, e200z760). For cores without data cache and cores that only support write-through (like most MPC57XX/SPC57X/SPC58X), there are no restrictions to run-time memory access.
Access Class Unified Cache Memory (uncached)
D: read(1)/updated read(4)/updated
P: / F: / V: read(2)/updated read(4)/updated
DC: read/updated read(4)/not updated
IC: read/updated read(4)/not updated
NC: no access read/updated
Access Class D-Cache I-Cache Memory (uncached)
D: read(1)/updated not updated read(4)/updated
P: / F: / V: not updated read(2)/updated(3) read(4)/updated
DC: updated no access read(4)/not updated
IC: no access updated read(4)/not updated
NC: no access no access updated
Qorivva MPC5xxx/SPC5xx Debugger and NEXUS Trace 43 ©1989-2018 Lauterbach GmbH
If one of the affected cores is in use, one of the following changes to the core configuration can be made to get either read-only of both read/write access.
• To gain read-only access to all memory, configure the cache mode to write-through. This is done via the WM or DCWM field of the L1CSR register.
• To gain read-only access to certain memory spaces, configure or create a TLB entry for this address range and set the W (write-through) bit.
• To gain read/write access to all memory, the data/unified cache has to be disabled. This is done via the L1CSR register (cache enable bit).
• To gain read/write access to certain memory spaces, configure or create a TLB entry for this address range and set the I (caching inhibited) bit.
Please note that these changes will impact the processor performance. Global configuration settings (like done via L1CSR) have more impact than settings for small address ranges. Therefore it is recommended to control the access via TLB settings and keep the page sizes for read and/or write accesses as small as possible. For example, keep the stack memory range caching enabled, as the stack does usually not need to be accessed via run-time memory access.
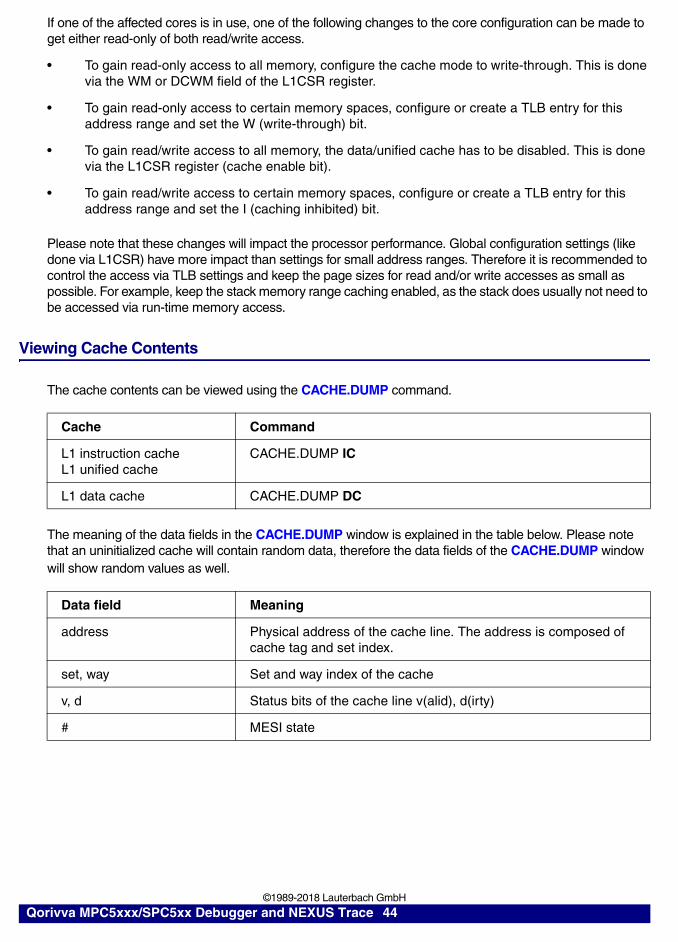
Viewing Cache Contents
The cache contents can be viewed using the CACHE.DUMP command.
The meaning of the data fields in the CACHE.DUMP window is explained in the table below. Please note that an uninitialized cache will contain random data, therefore the data fields of the CACHE.DUMP window will show random values as well.
Cache Command
L1 instruction cacheL1 unified cache
CACHE.DUMP IC
L1 data cache CACHE.DUMP DC
Data field Meaning
address Physical address of the cache line. The address is composed of cache tag and set index.
set, way Set and way index of the cache
v, d Status bits of the cache line v(alid), d(irty)
# MESI state
Qorivva MPC5xxx/SPC5xx Debugger and NEXUS Trace 44 ©1989-2018 Lauterbach GmbH

MESI States and Cache Status Flags
The data cache logic of Power Architecture cores is described as states of the MESI protocol. The debugger displays the cache state using the cache line status flags valid, dirty and shared. The debugger also displays additional status flags (e. g. locked) which can not be mapped to any of the MESI states.
State translation table:
Using Cache Lines as SRAM Extension
Some e200 cores (e200z6, e200z650, e200z750, e200z760) allow using locked cache lines as additional SRAM. The cache lines are enabled and locked to an unused address. In this case the debugger might fail to display the contents in cache (bus error) if the debugger is not configured / used as described below.
If the cache lines are used as data memory, ensure that SYStem.Option DCREAD is set to ON (default).
l or ll Way locked.MPC55XX with unified cache:--: not lockedI-: locked for instructions globally through L1CSR[WID]-D: locked for instructions globally through L1CSR[WID]ID: locked by lock bit in cache lineMPC5XXX with I/D-Cache (harvard):-: not lockedL: locked
sa ua Supervisor (sa)/user (ua) access protection:rw: read-writero: read-onlyna: no accessMPC57XX/SPC57X/58X only.
lo Lockout state.Cache lines with tag errors or data errors will have this lockout indicator set. MPC57XX/SPC57X/58X only.
u LRU information. Shows which cache way will be replaced next. MPC57XX/SPC57X/58X only.
00 04 08 ... Address offsets within cache line corresponding to the cached data
address (right field) Debug symbol assigned to address
MESI state Flag
M (modified) V(alid) && D(irty)
E (exclusive) V(alid) && NOT D(irty)
S (shared) V(alid) && S(hared)
I (invalid) NOT V(alid)
Qorivva MPC5xxx/SPC5xx Debugger and NEXUS Trace 45 ©1989-2018 Lauterbach GmbH

If the cache lines are used as program memory (only possible for e200z6, e200z650), set SYStem.Option ICREAD to on. Program code in a locked cache line can only be modified using access class IC.
Support for Peripheral Modules
TRACE32 supports access to the memory mapped registers of all peripheral modules. The peripheral register description files (*.per, so-called PER-files) for the on-chip peripherals are included in TRACE32. PER files for recent processors are usually not included in updates, but are available upon request.
For external peripherals and/or custom peripherals, it is possible to create additional PER files with custom content. See ”Peripheral Files Programming Commands” (per_prog.pdf) for details.
Displaying Peripheral Module Registers
Open the peripheral registers view either using the command PER.view, or open the window by menu: CPU -> Peripherals. In order to show a certain module directly, open it by menu using MPC5XXX -> On-chip peripherals.
Qorivva MPC5xxx/SPC5xx Debugger and NEXUS Trace 46 ©1989-2018 Lauterbach GmbH

If a configuration register is selected in the PER.view window, the following information is displayed in the Cursor field of the TRACE32 status bar:
• Access class - here A for physical address and NC for no cache.
• Address - here 0xfff48000.
• Bit position (TRACE32 bit index) - here 5.
• Bit position (Power Architecture bit numbering) - here 26.
• Full name - here Vector Table Entry Size.
Peripheral Registers Modified by TRACE32
Some memory mapped registers of the on-chip peripherals have to be modified to allow proper debug control of the processor:
Register Feature / Action Dependencies
SWT[CR] Watchdog. Must be disabled e.g. for FLASH programming.
SYStem.Option.WATCHDOG
Cursor field
Qorivva MPC5xxx/SPC5xx Debugger and NEXUS Trace 47 ©1989-2018 Lauterbach GmbH
Debugging and Tracing Through Reset
Overview
In order to debug of trace through a reset, the debug and trace register configuration must be preserved when a reset occurs.
Depending on the used processor or processor version, both debug and trace registers will be preserved natively, or debug and/or trace registers will be loaded with reset values when the reset occurs.
If the core(s) on the target reset debug and/or trace register values when a reset occurs, TRACE32 offers a workaround to re-configure debug and trace registers. The workaround is enabled with the command SYStem.Option.ResetDetection. The available reset detection mechanisms depend on the used debug cable or nexus adapter. See SYStem.Option.ResetDetection for details.
The debugger supports a number of different actions when a reset is detected, see SYStem.Option.RESetBehavior for details.
On some processors, the I/Os used for the NEXUS port are set to GPIO functionality be default. To enable trace-through-reset functionality, these processors also require SYStem.Option.ResetDetection, together with NEXUS.PCRCONFIG.
MPC563X, MPC564X, MPC567X, SPC563X, SPC564X and MPC57XX, SPC57XX
Most processors of the MPC56XX/SPC56XX and MPC57XX/SPC57XX series natively support debugging through reset, because the debug and trace registers are not cleared upon reset. Breakpoints and trace settings are not affected and are still in effect after a reset.
RGM[FRET]RGM[DRET]
Reset escalation. If the application causes processor resets, reset escalation will cause that the processor disables itself after some resets until the next power cycle.
SYStem.Option.DISableResetEscalation
RGM[FESS] Short reset sequence. If the processor is configured to perform the short sequence, peripherals and cores are not reset, which can cause a variety of debugging issues. E.g. FLASH programming can fail.
SYStem.Option.DISableShortSequence
SIU.PCR[]SIUL.PCR[]
Modify PCR registers so that their pin function is set to NEXUS signals (MDO, MSEO, MCKO)
NEXUS.PCRCONFIG
Qorivva MPC5xxx/SPC5xx Debugger and NEXUS Trace 48 ©1989-2018 Lauterbach GmbH

If the debugger is operated together with another tool using the same JTAG port (e.g. calibration tool), the other tool might disable the trace port when a reset occurs. Using SYStem.Option.ResetDetection here will work around this behavior and re-enable trace-through-reset functionality.
MPC555x, MPC553x, MPC556x, MPC560x, SPC560x
The cores of this processors will reset all on-chip debug and trace registers upon reset, so SYStem.Option.ResetDetection is required to debug / trace through resets.
When reset is detected, the debugger will then reconfigure all on-chip breakpoints, debug and trace registers before the CPU starts executing code from the reset address. Reconfiguring takes some time, so there will be a delay from releasing reset until commands are executed.
On-chip breakpoints can be used to stop the core after reset, e.g. at the start of the user program. If set to the reset address, the CPU can also be halted immediately after reset. Example:
Impact of SYStem.Option.ResetDetection on Reset Flags
If SYStem.Option.ResetDetection is used and the debugger detects a reset, the debugger will immediately assert reset in order to re-connect to the processor.
This the external reset will override or at least change one or more the reset flags.
The exact behavior also depends on the target. If the debugger's reset is connected to PORST (power-on reset/destructive reset pin), all original reset flags are cleared, while with ESR0 (or similar pin that only causes a functional reset), the bit for external reset is set in addition to original reset flags.
Multicore Debugging
One or more cores can be assigned to a TRACE32 PowerView instance. The cores are referred to by a core-index which is hard coded in the debugger software.
SYStem.Option.RD RSTINOUT ; listen for reset on RSTOUT
Break.Set 0xFFFFFFFC /Onchip ; set on-chip breakpoint to reset; address
core-index MPC55xxMPC563xMMPC564xAMPC5674FSPC563MSPC564A
MPC5510MPC5643LMPC5668GMPC567xKSPC56ELSPC56HLSPC56AP
MPC5676RMPC5746RMPC5777C
MPC5747CMPC5748CMPC5746GMPC5747GMPC5748G
MPC5744BMPC5745BMCP5746BMPC5744CMPC5745CMPC5746C
core_0 1 1 1 1 (z4_a) 1 (z4)
core_1 - 2 2 2 (z4_b) 2 (z2)
Qorivva MPC5xxx/SPC5xx Debugger and NEXUS Trace 49 ©1989-2018 Lauterbach GmbH

TRACE32 supports either controlling each core with a separate PowerView instance (AMP debugging) or controlling multiple cores with a single PowerView instance (SMP debugging). SMP debugging is only possible for cores of the same architecture (e.g. e200 core_0 and e200 core_1).
TRACE32 also supports mixed AMP/SMP operation. E.g. MPC5746M can be controlled with two PowerView instances, one for core_2 (IOP) and one controlling core_0 and core_1 in SMP mode.
SMP Debugging
In TRACE32 terminology, SMP debugging means to control more than one core in a single PowerView instance. Use this method for cores which run the same kernel / instance of the operating system. Cores controlled in a single PowerView instance share the following resources:
• Debug symbols
• RTOS awareness
• Run control (Go, Step, Break) and breakpoints
• Debug and trace settings
If it is desired to have control over any of the above resources separately for each core, AMP debugging must be used.
Follow these steps to set up the debugger for SMP debugging:
core_2 - - - 3 (z2) -
HSM - - - 4 3
eTPU A/B/C 2/3/4 - 3/4/5 - -
GTM - - - - -
SPT - - - - -
core-index MPC5746MMPC5777MSPC57xMSPC58EGSPC58NESPC58NN
MPC574xKSPC574K
MPC577xK
core_0 1 1 3 (z4)
core_1 2 - 1 (z7_a)
core_2 3 (IOP) 3 (IOP) 2 (z7_b)
HSM 4 4 -
eTPU A/B/C - - -
GTM 5 5 -
SPT - - 4
Qorivva MPC5xxx/SPC5xx Debugger and NEXUS Trace 50 ©1989-2018 Lauterbach GmbH

1. Select the target processor, or use automatic CPU detection.
2. Assign cores to this PowerView instance. Look up the core-index of each core in above list. The order of the cores must match to the core order used by the kernel.
3. Start debug session and continue as usual.
All core context dependent windows (Register, List, Data.dump, etc.) show the data as seen from the currently selected core. Select a core using the command CORE.select <logical_core_index>.
If any of the cores hits a breakpoint, PowerView automatically selects the core that hit the breakpoint. The currently selected core displayed in the status bar and can be changed by right-clicking on the core field.
It is also possible to show more than one core context at the same time, using the option /Core <logical_core_index>. All windows with core-dependent information support this option.
Example scripts for SMP debugging can be found in the demo folder, e.g.
• ~~/demo/powerpc/hardware/mpc56xx/mpc5643l-dualcore/smp_demo.cmm
• ~~/demo/powerpc/hardware/mpc56xx/mpc5676r-dualcore/smp_demo.cmm
• ~~/demo/powerpc/hardware/spc56xx/spc56ap/smp_demo.cmm
Further demo scripts available for download and upon request.
SYStem.DETECT CPU
;Kernel: logical_core_0 = core_0, logical_core_1 = core_1
;CORE.ASSIGN <logical_core_0> <logical_core_1> [...]CORE.ASSIGN 1 2
SYStem.Up | SYStem.Mode.Attach
Register
CORE 0 ;Register window shows registers of core_0CORE 1 ;Register window shows registers of core_1
Register /CORE 0Register /CORE 1
List /CORE 0List /CORE 1
Qorivva MPC5xxx/SPC5xx Debugger and NEXUS Trace 51 ©1989-2018 Lauterbach GmbH

AMP Debugging
In AMP debugging mode, a separate PowerView instance is started for each core. The individual instances are completely independent of each other, but it is possible to synchronize run-control and system mode changes (see command SYnch).
An easy way to start multiple PowerView instances is to use T32Start. It is also possible to start further instances from a PRACTICE script.
The following steps demonstrate the setup for AMP debugging, assuming that the application is already programmed to FLASH:
1. Select the target processor, or use automatic CPU detection.
2. Assign target cores to the individual instances. Look up the core-index of each core in above list. Use either SYStem.CONFIG.CORE <core_index> <chip_index> or CORE.ASSIGN <core_index>. The parameter <chip_index> must be the same for all cores on the same chip.
3. SYStem.CONFIG.SLAVE must be OFF for the core that starts running right form reset. Set to ON for all other cores (that are released later by the first core).
4. Load debug symbols on both instances.
5. Start debug session: SYStem.Up for the core that runs right from reset. SYStem.Mode.Attach for all cores that are started later.
6. Core_0 is halted at the reset address and core_1 remains in reset, In order to halt core_1 as soon as it is released from reset, issue the Break command.
;core_0 setup script: ;core_1 setup script:
SYStem.CPU MPC5517 SYStem.CPU MPC5517
SYStem.CONFIG.CORE 1. 1. SYStem.CONFIG.CORE 2. 1.
SYStem.CONFIG.SLAVE OFF SYStem.CONFIG.SLAVE ON
Data.LOAD appl.x /NoCODE Data.LOAD appl.x /NoCODE
SYStem.Up SYStem.Mode.Attach
Break
Qorivva MPC5xxx/SPC5xx Debugger and NEXUS Trace 52 ©1989-2018 Lauterbach GmbH
7. Start core_0. Core_1 will halt at it’s reset address after being released by core_0.
Example scripts for SMP debugging can be found in the demo folder, e.g.
• ~~/demo/powerpc/hardware/mpc56xx/mpc564xc-dualcore/
• ~~/demo/powerpc/hardware/spc56xx/spc56el-dualcore/
Further demo scripts are available for download and upon request.
Watchdog Timer Support
e200 Core Watchdog (TCR/TSR)
The e200 core watchdog is configured and controlled through the TCR and TSR special purpose registers. There is no dedicated command to control this watchdog, but it is indirectly controlled with SYStem.Option.FREEZE, which halts the time base (TBU/TBL/DEC) while the core is halted in debug mode.
On-chip Watchdog (SWT)
The on-chip SWT modules can be controlled via SYStem.Option.WATCHDOG. By default setting, TRACE32 will disable the SWT every time the core halts in debug mode. Each TRACE32 PowerView instance will control only the SWT module(s) that is/are assigned to the core(s) it controls.
If it is intended to debug with SWT enabled, please ensure that the application sets the SWT_CR[FRZ] bit when it sets up the SWT. The FRZ bit configures the SWT to automatically halt when the core halts for the debugger.
On MPC57XX, SPC57X and SPC58X multicore processors, the SOC implementation’s behavior is to that SWT_CR[FRZ] function only works if all cores under debug start and halt at the same time. We recommend to either keep the SWT permanently disabled. If this is not possible, set SETUP.StepAllCores to ON to ensure that the SWT can be halted under any circumstances. This behavior is not specific to the SWT, but affects all on-chip peripheral modules that implement such a Freeze function (e.g. PIT, STM).
Chip External Watchdog
TRACE32 also includes features to control on-board/chip external watchdog timers. There are several possibilities.
1. If the watchdog can be disabled by e.g. GPIO or serial communication, the debugger can write the required sequences automatically at the begin of a debug session using Data.STARTUP or Data.STANDBY.
Go WAIT !RUN() ; wait until cpu stops
Qorivva MPC5xxx/SPC5xx Debugger and NEXUS Trace 53 ©1989-2018 Lauterbach GmbH
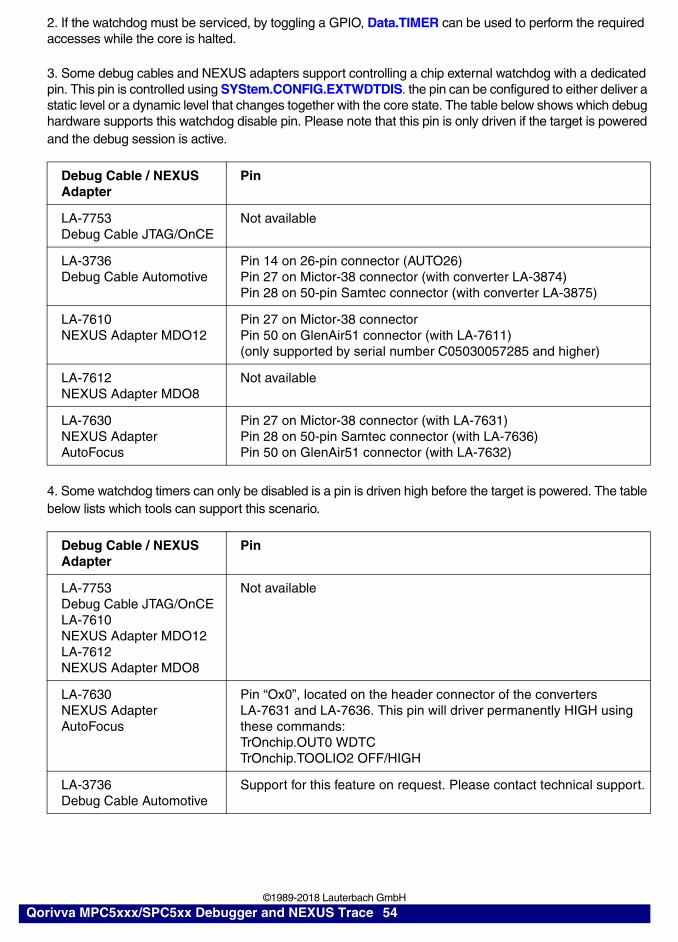
2. If the watchdog must be serviced, by toggling a GPIO, Data.TIMER can be used to perform the required accesses while the core is halted.
3. Some debug cables and NEXUS adapters support controlling a chip external watchdog with a dedicated pin. This pin is controlled using SYStem.CONFIG.EXTWDTDIS. the pin can be configured to either deliver a static level or a dynamic level that changes together with the core state. The table below shows which debug hardware supports this watchdog disable pin. Please note that this pin is only driven if the target is powered and the debug session is active.
4. Some watchdog timers can only be disabled is a pin is driven high before the target is powered. The table below lists which tools can support this scenario.
Debug Cable / NEXUS Adapter
Pin
LA-7753Debug Cable JTAG/OnCE
Not available
LA-3736Debug Cable Automotive
Pin 14 on 26-pin connector (AUTO26)Pin 27 on Mictor-38 connector (with converter LA-3874)Pin 28 on 50-pin Samtec connector (with converter LA-3875)
LA-7610NEXUS Adapter MDO12
Pin 27 on Mictor-38 connectorPin 50 on GlenAir51 connector (with LA-7611)(only supported by serial number C05030057285 and higher)
LA-7612NEXUS Adapter MDO8
Not available
LA-7630NEXUS Adapter AutoFocus
Pin 27 on Mictor-38 connector (with LA-7631)Pin 28 on 50-pin Samtec connector (with LA-7636)Pin 50 on GlenAir51 connector (with LA-7632)
Debug Cable / NEXUS Adapter
Pin
LA-7753Debug Cable JTAG/OnCELA-7610NEXUS Adapter MDO12LA-7612NEXUS Adapter MDO8
Not available
LA-7630NEXUS Adapter AutoFocus
Pin “Ox0”, located on the header connector of the convertersLA-7631 and LA-7636. This pin will driver permanently HIGH using these commands:TrOnchip.OUT0 WDTCTrOnchip.TOOLIO2 OFF/HIGH
LA-3736Debug Cable Automotive
Support for this feature on request. Please contact technical support.
Qorivva MPC5xxx/SPC5xx Debugger and NEXUS Trace 54 ©1989-2018 Lauterbach GmbH

Censorship Unlock
TRACE32 supports censorship unlock via JTAG commands, if the processor supports those commands. The unlock is supported by all processors but MPC55XX.
In order to unlock the processor when starting the debug session, provide the censorship password to the debugger using the command SYStem.Option KEYCODE. Size and format of the password depends on the processor in use.
MPC56XX/SPC56X and MPC5777C only support unlocking during SYStem.Up. Attaching to a censored processor without resetting it is not possible.
On other MPC57XX/SPC57X and SPC58X processors, the censorship unlock is possible without asserting reset and also if functional reset is asserted. For the unlock during SYStem.Up, the ability to successfully unlock the processor depends on which reset pin is connected to the debugger’s reset output.
If the debugger’s reset output is connected to ESR0, SYStem.Up will perform a functional reset and the unlock will succeed. If the debugger’s reset output is connected to PORST, the processor will perform a destructive reset and the unlock during SYStem.Up will fail. Also note that a destructive will lock a previously unlocked processor.
In the case the debugger’s reset output is connected to PORST, several workarounds are available to gain access to the processor:
1. Perform SYStem.Up using a functional reset via JTAG instead of asserting the reset output. This method can not be used together with SYStem.Mode.StandBy. It is not possible to halt the core directly at power-on reset.
2. Use workaround to unlock and halt the core after reset is released with fixed delay. The delay time set with SYStem.Option WaitReset is critical. It must be longer than the BIST run time to succeed. As the core is halted after reset is released, the core will execute some instructions before being halted. The longer the delay, the more instructions get executed. Usually it is possible to halt the core within <100 instructions, i.e. before it leaves the BAF code. This method supports debugging/tracing through power cycles.
SYStem.CPU <cpu>CORE.ASSIGN <cores>SYStem.Option.KEYCODE <password>SYStem.Option.ResetMode FUNCtionalSYStem.Up
SYStem.CPU <cpu>CORE.ASSIGN <cores>SYStem.Option.KEYCODE <password>SYStem.Option.ResBreak OFFSYStem.Option.WaitReset <delay>SYStem.Option.ResetMode PINSYStem.Up
Qorivva MPC5xxx/SPC5xx Debugger and NEXUS Trace 55 ©1989-2018 Lauterbach GmbH

3. Use workaround to unlock and halt the core after reset is released (using ESR0/RSTOUT feedback). It is required to connect the processor’s ESR0 to the debug cable’s RSTOUT input. Only supported for the Automotive Debug Cable and the Parallel Nexus Adapters. Usually it is possible to halt the core within a few 100 instructions, i.e. before it leaves the BAF code. This method supports debugging/tracing through power cycles.
Both methods 2 and 3 can not halt the core at the reset address. It debugging should start directly from the reset address, it is possible to perform a functional reset following the first reset. Please note that this may have side effects, because some core already has been executed. Also there is no real advantage, as the BAF code is usually not of interest.
SYStem.CPU <cpu>CORE.ASSIGN <cores>SYStem.Option.KEYCODE <password>SYStem.Option.ResBreak OFFSYStem.Option.WaitReset 0s RSTOUTSYStem.Option.ResetMode PINSYStem.Up
;destructive reset with delay and unlockSYStem.CPU <cpu>CORE.ASSIGN <cores>SYStem.Option.KEYCODE <password>SYStem.Option.ResBreak OFFSYStem.Otion.WaitReset <parameters>SYStem.Option.ResetMode PINSYStem.Up
; follow-up functional resetSYStem.Option.ResBreak ONSYStem.Option.ResetMode FUNCtionalSYStem.Up
Qorivva MPC5xxx/SPC5xx Debugger and NEXUS Trace 56 ©1989-2018 Lauterbach GmbH
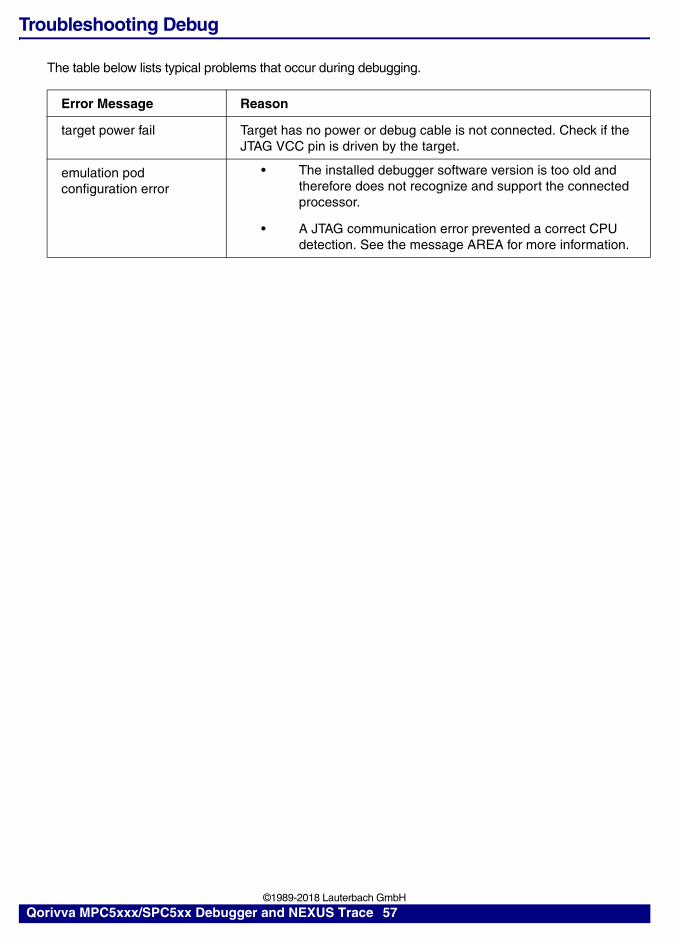
Troubleshooting Debug
The table below lists typical problems that occur during debugging.
Error Message Reason
target power fail Target has no power or debug cable is not connected. Check if the JTAG VCC pin is driven by the target.
emulation pod configuration error
• The installed debugger software version is too old and therefore does not recognize and support the connected processor.
• A JTAG communication error prevented a correct CPU detection. See the message AREA for more information.
Qorivva MPC5xxx/SPC5xx Debugger and NEXUS Trace 57 ©1989-2018 Lauterbach GmbH
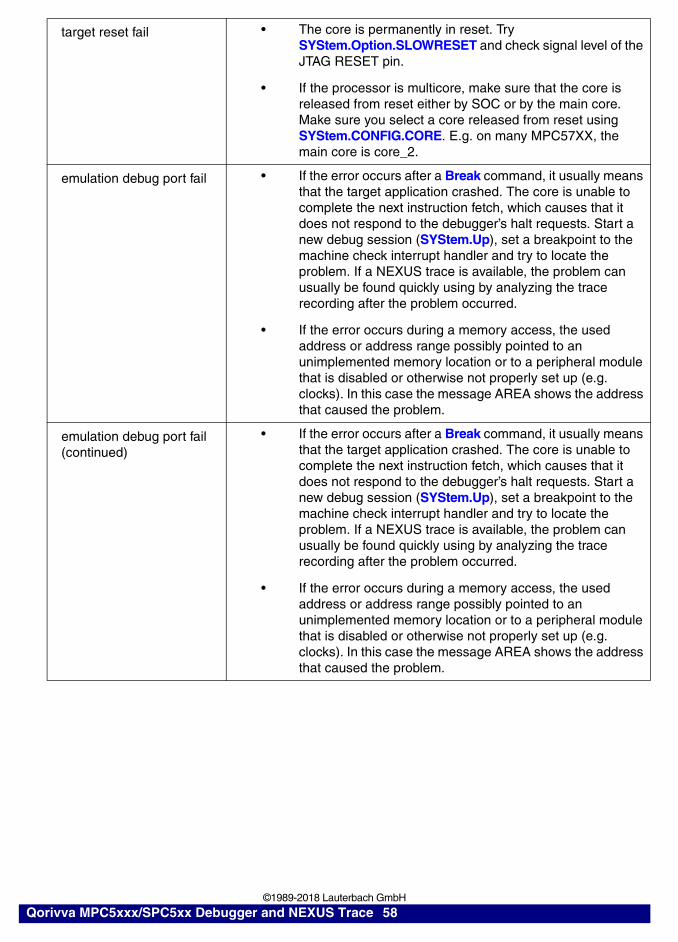
target reset fail • The core is permanently in reset. Try SYStem.Option.SLOWRESET and check signal level of the JTAG RESET pin.
• If the processor is multicore, make sure that the core is released from reset either by SOC or by the main core. Make sure you select a core released from reset using SYStem.CONFIG.CORE. E.g. on many MPC57XX, the main core is core_2.
emulation debug port fail • If the error occurs after a Break command, it usually means that the target application crashed. The core is unable to complete the next instruction fetch, which causes that it does not respond to the debugger’s halt requests. Start a new debug session (SYStem.Up), set a breakpoint to the machine check interrupt handler and try to locate the problem. If a NEXUS trace is available, the problem can usually be found quickly using by analyzing the trace recording after the problem occurred.
• If the error occurs during a memory access, the used address or address range possibly pointed to an unimplemented memory location or to a peripheral module that is disabled or otherwise not properly set up (e.g. clocks). In this case the message AREA shows the address that caused the problem.
emulation debug port fail(continued)
• If the error occurs after a Break command, it usually means that the target application crashed. The core is unable to complete the next instruction fetch, which causes that it does not respond to the debugger’s halt requests. Start a new debug session (SYStem.Up), set a breakpoint to the machine check interrupt handler and try to locate the problem. If a NEXUS trace is available, the problem can usually be found quickly using by analyzing the trace recording after the problem occurred.
• If the error occurs during a memory access, the used address or address range possibly pointed to an unimplemented memory location or to a peripheral module that is disabled or otherwise not properly set up (e.g. clocks). In this case the message AREA shows the address that caused the problem.
Qorivva MPC5xxx/SPC5xx Debugger and NEXUS Trace 58 ©1989-2018 Lauterbach GmbH
Tracing
Processors of the MPC5XXX/SPC5XX series implement a variety of trace modules. Depending on the module, the trace information is either stored on the processor or sent out through an external trace port. This section lists all available trace modules, their configuration options and examples.
e200 PCFIFO On-chip Trace
The PCFIFO is a FIFO which stores the last eight branch target addresses. It is implemented in e200 cores of the MPC55XX, MPC56XX and SPC56X processors, excluding e200z0 and e200z1 cores.
TRACE32 supports the PCFIFO for all processors and regardless of the used debug solution (JTAG and NEXUS). Using the PCFIFO does not require a trace license. It is also possible to use PCFIFO and NEXUS trace in parallel.
The PCFIFO has no configurable options. It is always enabled. None of the trace related command groups (SYStem, NEXUS, TrOnchip, Onchip) has an effect on the PCFIFO operation.
Usage: This command opens a window that shows the program flow. The program flow is reconstructed based on the PCFIFO data.
Statistic analysis, RTOS tracing and run-time measurements are not possible with the PCFIFO.
MPC57XX/SPC57X/SPC58X NEXUS On-chip Trace (trace-to-memory)
Many processors of the MPC57XX/SPC57X series implement a feature to store the nexus messages of cores and peripheral trace clients into an on-chip trace memory, the so-called trace-to-memory feature.
Using the on-chip trace with a JTAG-only debug cable (LA-7753 or LA-3736) requires the on-chip trace license LA-7968X. The on-chip trace license is not required if a NEXUS adapter (LA-7630 or LA-7610) is in use. The on-chip trace license is also not required when the Aurora NEXUS preprocessor (LA-3911) is connected.
Onchip.List
Qorivva MPC5xxx/SPC5xx Debugger and NEXUS Trace 59 ©1989-2018 Lauterbach GmbH
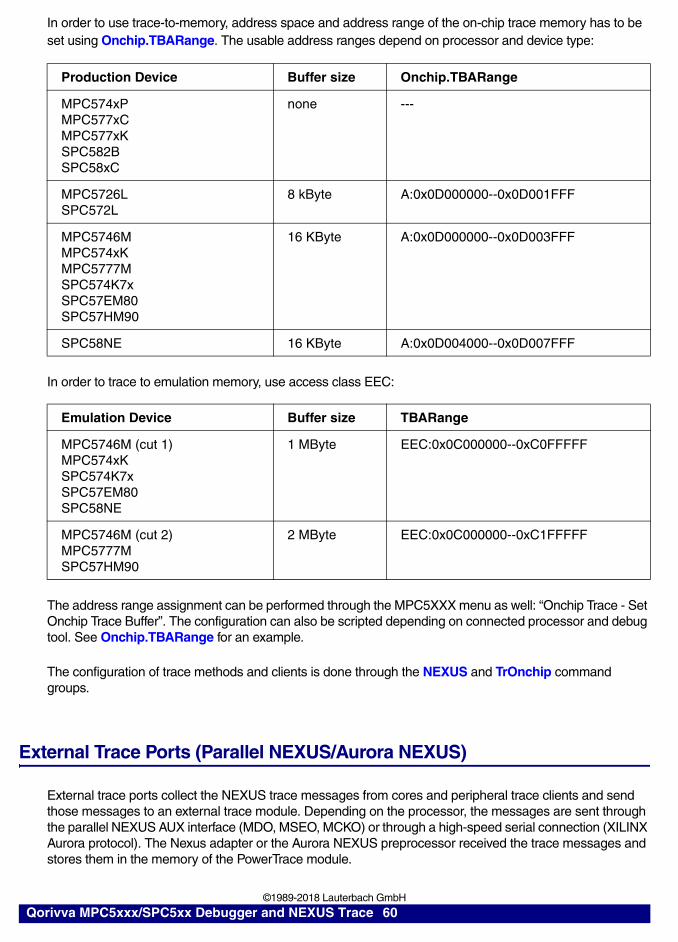
In order to use trace-to-memory, address space and address range of the on-chip trace memory has to be set using Onchip.TBARange. The usable address ranges depend on processor and device type:
In order to trace to emulation memory, use access class EEC:
The address range assignment can be performed through the MPC5XXX menu as well: “Onchip Trace - Set Onchip Trace Buffer”. The configuration can also be scripted depending on connected processor and debug tool. See Onchip.TBARange for an example.
The configuration of trace methods and clients is done through the NEXUS and TrOnchip command groups.
External Trace Ports (Parallel NEXUS/Aurora NEXUS)
External trace ports collect the NEXUS trace messages from cores and peripheral trace clients and send those messages to an external trace module. Depending on the processor, the messages are sent through the parallel NEXUS AUX interface (MDO, MSEO, MCKO) or through a high-speed serial connection (XILINX Aurora protocol). The Nexus adapter or the Aurora NEXUS preprocessor received the trace messages and stores them in the memory of the PowerTrace module.
Production Device Buffer size Onchip.TBARange
MPC574xPMPC577xCMPC577xKSPC582BSPC58xC
none ---
MPC5726LSPC572L
8 kByte A:0x0D000000--0x0D001FFF
MPC5746MMPC574xKMPC5777MSPC574K7xSPC57EM80SPC57HM90
16 KByte A:0x0D000000--0x0D003FFF
SPC58NE 16 KByte A:0x0D004000--0x0D007FFF
Emulation Device Buffer size TBARange
MPC5746M (cut 1)MPC574xKSPC574K7xSPC57EM80SPC58NE
1 MByte EEC:0x0C000000--0xC0FFFFF
MPC5746M (cut 2)MPC5777MSPC57HM90
2 MByte EEC:0x0C000000--0xC1FFFFF
Qorivva MPC5xxx/SPC5xx Debugger and NEXUS Trace 60 ©1989-2018 Lauterbach GmbH

Basic Setup for Parallel Nexus
The trace port settings must be done before start of the debug session. Most processors support two trace port widths, full port mode and reduced port mode. In some cases, full port mode is only supported in certain packages. Some small packages do not provide a trace port at all. Some processors only provide a trace port in special development packages. Set the desired port mode using NEXUS.PortSize.
The trace port frequency divider must be selected, so that the resulting trace port frequency does not exceed the maximum specified frequency in the processor’s data sheet. Many processors support trace port frequencies up to 88 MHz, but for some processors the limit is significantly lower. The MCKO divider is configured using NEXUS.PortMode.
Example for MPC5676R: System frequency max. 180 MHz. MCKO frequency according to data sheet max. 82 MHz. Therefore the MCKO divider must be set to 1/3. The resulting trace port frequency is 60MHz.
Basic Setup for Aurora Nexus
The processors of the MPC5XXX/SPC5XX series require an external clock source for the Aurora NEXUS block. The Aurora NEXUS preprocessor can provide this clock for frequencies up to 3125 MHz. It is enabled using the command NEXUS.RefClock.
The number of lanes is set using NEXUS.PortSize, the bit rate per lane is set using NEXUS.PortMode. The default settings of the debugger are usually valid for the selected processor and do not need to be changed.
Example for MPC5777M
All trace port settings must not be changed during an active debug session. Usually the processor must be reset (e.g. SYStem.Up) to bring up the trace port with new settings.
SYStem.CPU MPC5676R
NEXUS.PortSize MDO16NEXUS.PortMode 1/3
SYStem.Up
SYStem.CPU MPC5777M
NEXUS.PortSize 4LaneNEXUS.PortMode 1250MbpsNEXUS.RefClock ON
SYStem.Up
Qorivva MPC5xxx/SPC5xx Debugger and NEXUS Trace 61 ©1989-2018 Lauterbach GmbH

Tracing the Program Flow
Tracing of the program flow is enabled by default. The e200 cores support several kinds of program tracing: branch trace messaging and history trace messaging.
Branch Trace Messaging (BTM)
This is the default method set in TRACE32. The processor is configured to send a trace message for every executed branch instruction. As the debugger stores a timestamp with every received message, this method has the highest accuracy for timing measurements. The drawback is the high trace port bandwidth and trace memory consumption (i.e. short recording time). The high amount of messages can cause overflows of the on-chip message FIFO, i.e. loss of trace data.
Setup of for branch trace messaging:
History Trace Messaging (HTM)
In history tracing mode, the e200 core only sends trace messages for indirect branches. Information about direct branches and amount of executed instructions is sent in occasional resource full messages. This method significantly reduces the amount of generated trace messages. Message FIFO overflows can be prevented and the recording time is increased. The program flow information is complete in HTM, so even in this mode, TRACE32 can reconstruct the full program flow without loss. The drawback of this mode is the reduced runtime measurement accuracy.
Setup of branch history tracing:
In order to remedy the loss of runtime measurement accuracy, many newer processors can additionally generate messages for function calls. With this method, the accuracy of function-level runtime measurements is identical to classical branch trace.
Setup of branch history tracing + function call tracing:
NEXUS.BTM ONNEXUS.HTM OFF
NEXUS.BTM ONNEXUS.HTM ON
NEXUS.BTM ONNEXUS.HTM ONNEXUS.PTCM.BL_HTM ON
Qorivva MPC5xxx/SPC5xx Debugger and NEXUS Trace 62 ©1989-2018 Lauterbach GmbH

Tracing of Data (read/write) Transactions
General data tracing is enabled using the command NEXUS.DTM. This command enables the data trace for the full address space. The amount of generated trace messages is usually too high to be sent through the trace port and the on-chip message FIFO will overflow.
The amount of generated trace messages can be reduced by defining address ranges for which data trace is generated. Up to four address ranges are possible.
Example: Data Trace with Address Range
Use TraceData to limit the data trace to an address range. Depending on the core, 2 or 4 address ranges are possible. TraceData has no impact on program trace messaging setting.
Another method of reducing trace data is event-triggered trace filtering.
Trace Filtering and Triggering with Debug Events
Overview
Any debug event available on e200 cores can be either used to halt the core, or act as watchpoint. A watchpoint hit event again can be configured to either trigger a watchpoint hit message, or to act as input event for selective tracing. TRACE32 offers a variety of features based on watchpoints.
Watchpoints are set using the command Break.Set, similar to breakpoints that halt the core, but additionally include an option to define the desired behavior:
;Enable data trace for read/write accesses to all peripherals Break.Set 0xC0000000--0xFFFFFFFF /ReadWrite /TraceData
;In addition to full program trace, enable data trace for read accesses;to the array flags NEXUS.BTM ON Var.Break.Set flags /Read /TraceData
Break.Set <address>|<range> /<action> Define trace filter or trigger
Qorivva MPC5xxx/SPC5xx Debugger and NEXUS Trace 63 ©1989-2018 Lauterbach GmbH
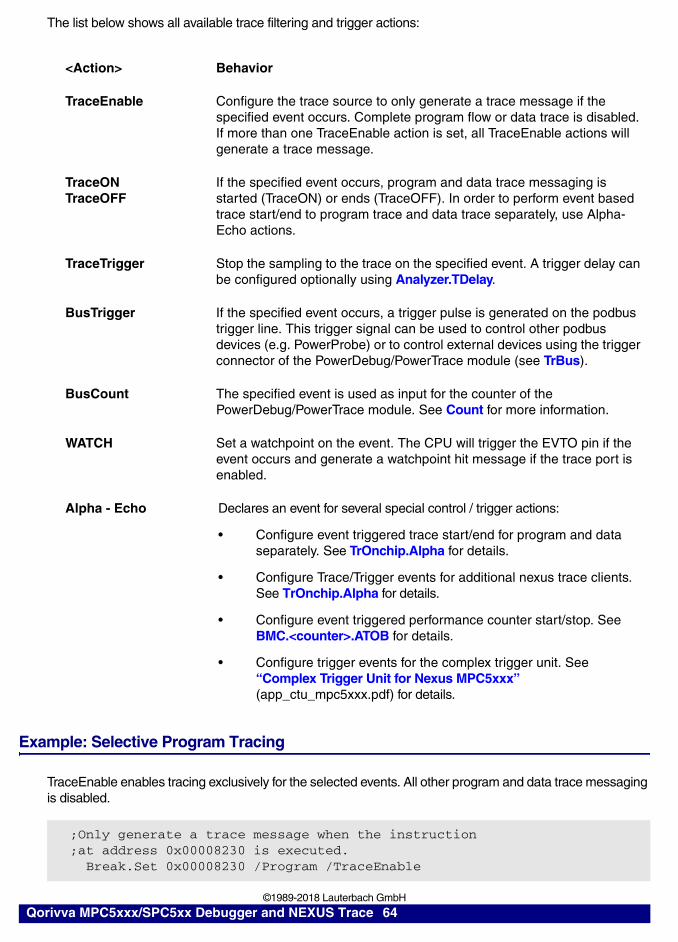
The list below shows all available trace filtering and trigger actions:
Example: Selective Program Tracing
TraceEnable enables tracing exclusively for the selected events. All other program and data trace messaging is disabled.
<Action> Behavior
TraceEnable Configure the trace source to only generate a trace message if the specified event occurs. Complete program flow or data trace is disabled. If more than one TraceEnable action is set, all TraceEnable actions will generate a trace message.
TraceONTraceOFF
If the specified event occurs, program and data trace messaging is started (TraceON) or ends (TraceOFF). In order to perform event based trace start/end to program trace and data trace separately, use Alpha-Echo actions.
TraceTrigger Stop the sampling to the trace on the specified event. A trigger delay can be configured optionally using Analyzer.TDelay.
BusTrigger If the specified event occurs, a trigger pulse is generated on the podbus trigger line. This trigger signal can be used to control other podbus devices (e.g. PowerProbe) or to control external devices using the trigger connector of the PowerDebug/PowerTrace module (see TrBus).
BusCount The specified event is used as input for the counter of the PowerDebug/PowerTrace module. See Count for more information.
WATCH Set a watchpoint on the event. The CPU will trigger the EVTO pin if the event occurs and generate a watchpoint hit message if the trace port is enabled.
Alpha - Echo Declares an event for several special control / trigger actions:
• Configure event triggered trace start/end for program and data separately. See TrOnchip.Alpha for details.
• Configure Trace/Trigger events for additional nexus trace clients. See TrOnchip.Alpha for details.
• Configure event triggered performance counter start/stop. See BMC.<counter>.ATOB for details.
• Configure trigger events for the complex trigger unit. See “Complex Trigger Unit for Nexus MPC5xxx” (app_ctu_mpc5xxx.pdf) for details.
;Only generate a trace message when the instruction;at address 0x00008230 is executed. Break.Set 0x00008230 /Program /TraceEnable
Qorivva MPC5xxx/SPC5xx Debugger and NEXUS Trace 64 ©1989-2018 Lauterbach GmbH

TraceEnable can also be applied on data trace:
TraceEnable can be used for high precision time-distance measurements:
Example: Event Controlled Program/Data Trace Start and End
Program and data trace can be enabled and disabled based on debug events. TraceON and TraceOFF control both program and data trace depending on NEXUS.BTM/DTM setting. TraceON and TraceOFF control the message source, i.e. the core’s NEXUS module:
;Only generate a trace message when the core writes to variable flags[3]. Var.Break.Set flags[3] /Write /TraceEnable
;Get start and end address of function to be measured &a1=sYmbol.BEGIN(func_to_measure) &a2=sYmbol.EXIT(func_to_measure)
;Only generate trace messages on the addresses used for measurement Break.Set &a1 /Program /TraceEnable Break.Set &a2 /Program /TraceEnable
;run application Trace.Init Go WAIT 5.s Break
;statistic analysis Trace.STATistic.AddressDURation &a1 &a2
;plot time distance over time (can take some time for analysis) Trace.PROFILECHART.DURATION /FILTERA ADDRess &a1 /FILTERB ADDRess &a2
NOTE: The analysis commands can also be used without TraceEnable breakpoints, but the measurement will be less precise.
;Enable program/data trace when func2 is entered;Disable program/data trace when last instruction of func2 is executed. Break.Set sYmbol.BEGIN(func2) /Program /TraceON Break.Set sYmbol.EXIT(func2) /Program /TraceOFF
Qorivva MPC5xxx/SPC5xx Debugger and NEXUS Trace 65 ©1989-2018 Lauterbach GmbH

It is also possible to enable/disable program and data trace messaging separately:
Example: Event Controlled Trace Recording
Debug/trace events can also be used to trigger and stop the trace recording (i.e. message sink):
;Enable program/data trace when variable flags[3] is written Var.Break.Set flags[3] /Write /TraceON
;Disable program/data trace data when 16-bit value 0x1122 is;written to address 0x40000230 Break.Set 0x40000230 /Write /Data.Word 0x1122 /TraceOFF
;Enable program/data trace only when a specific task is active;NOTE: RTOS support must be set up correctly &magic=TASK.MAGIC("my_task") ;get magic value for the task of interest Break.Set task.config(magic) /Write /Data &magic /TraceON Break.Set task.config(magic) /Write /Data !&magic /TraceOFF
;Enable/disable only program trace based on events,;full data trace messaging NEXUS.DTM ReadWrite Break.Set func2 /Program /Onchip /Alpha TrOnchip.Alpha ProgramTraceON Var.Break.Set flags[8] /Read /Onchip /Beta TrOnchip.Beta ProgramTraceOFF
;In addition to full program trace, enable/disable data trace messaging;only for func2 NEXUS.BTM ON Break.Set sYmbol.BEGIN(func2) /Program /Onchip /Alpha TrOnchip.Alpha DataTraceON Break.Set sYmbol.EXIT(func2) /Program /Onchip /Beta TrOnchip.Beta DataTraceOFF
;Generate a trigger for the trace recording module when ;the specified event occurs. Trace recording stops delayed after;another 10% of the trace buffer size was recorded.; Break.Set sieve /Program /TraceTrigger Trace.TDelay 10%
Qorivva MPC5xxx/SPC5xx Debugger and NEXUS Trace 66 ©1989-2018 Lauterbach GmbH

Example: Event Controlled Trigger Signals
TRACE32 can generate a trigger signal based on debug/trace events. The trigger signal can be used to control PowerProbe or PowerIntegrator, as well as with external tools (using the trigger connector)
Example: Event Counter
There is also a built-in event counter which can be used to count debug/trace events or to measure the event frequency:
Tracing Peripheral Modules / Bus Masters
Many processors support tracing of peripheral bus master trace clients, e.g. DMA or FlexRay controllers. The clients are controlled with the NEXUS.CLIENT<x> commands.
As for the core’s data trace, the amount of generated trace messages is usually too high to be sent through the trace port and the on-chip message FIFO will overflow. Therefore it is necessary to set filters to reduce the amount of trace messages. The MPC5xxx processor series’ peripheral bus master trace clients support two filtering methods, explained in below examples.
Example: Filter by Address Range
The MPC5xxx peripheral bus master trace clients support two freely configurable address ranges. The client will only generate trace messages, if the read or write address is inside one of those address ranges. The range only applies to the selected clients. Other clients and the cores can be configured independently.
;Generate PODBUS trigger signal on data write event with data value Var.Break.Set flags[9] /Write /Data.Byte 0x01 /BusTrigger
;forward signal to trigger connector TrBus.Connect Out TrBus.Mode High
;Measure the execution frequency of function sieve Break.Set sieve /Program /BusCount Count.Mode Frequency Count.Gate 1.s ;measure for 1 second Go ;run application Count.Go ;start measurement PRINT "sieve freq = "+FORMAT.DECIMAL(1.,Count.VALUE()/1000.)+"Hz" Count.state ;open event counter window
Qorivva MPC5xxx/SPC5xx Debugger and NEXUS Trace 67 ©1989-2018 Lauterbach GmbH
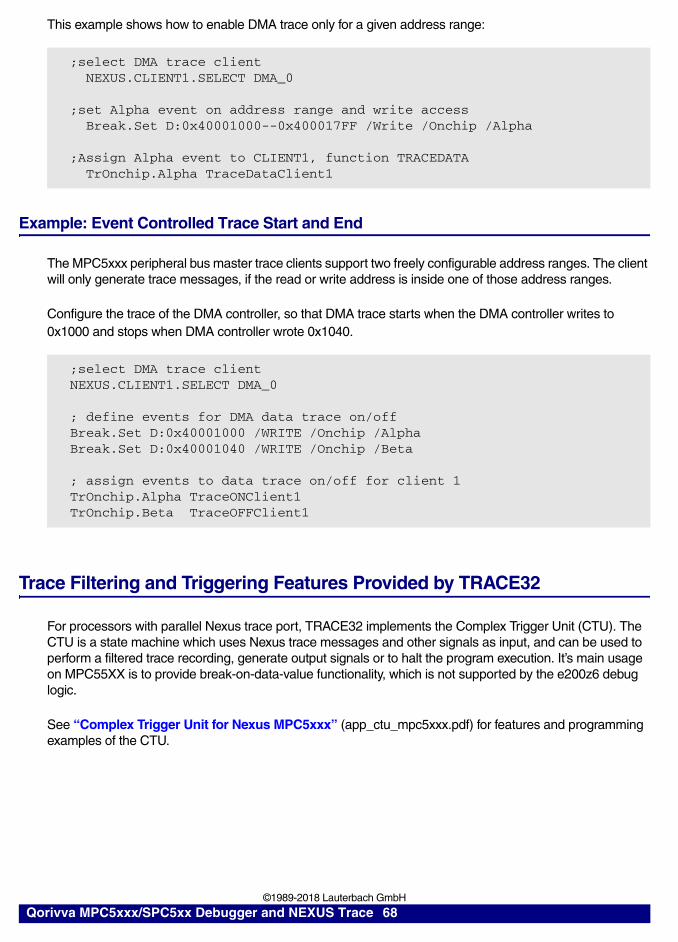
This example shows how to enable DMA trace only for a given address range:
Example: Event Controlled Trace Start and End
The MPC5xxx peripheral bus master trace clients support two freely configurable address ranges. The client will only generate trace messages, if the read or write address is inside one of those address ranges.
Configure the trace of the DMA controller, so that DMA trace starts when the DMA controller writes to 0x1000 and stops when DMA controller wrote 0x1040.
Trace Filtering and Triggering Features Provided by TRACE32
For processors with parallel Nexus trace port, TRACE32 implements the Complex Trigger Unit (CTU). The CTU is a state machine which uses Nexus trace messages and other signals as input, and can be used to perform a filtered trace recording, generate output signals or to halt the program execution. It’s main usage on MPC55XX is to provide break-on-data-value functionality, which is not supported by the e200z6 debug logic.
See “Complex Trigger Unit for Nexus MPC5xxx” (app_ctu_mpc5xxx.pdf) for features and programming examples of the CTU.
;select DMA trace client NEXUS.CLIENT1.SELECT DMA_0
;set Alpha event on address range and write access Break.Set D:0x40001000--0x400017FF /Write /Onchip /Alpha
;Assign Alpha event to CLIENT1, function TRACEDATA TrOnchip.Alpha TraceDataClient1
;select DMA trace clientNEXUS.CLIENT1.SELECT DMA_0
; define events for DMA data trace on/offBreak.Set D:0x40001000 /WRITE /Onchip /AlphaBreak.Set D:0x40001040 /WRITE /Onchip /Beta
; assign events to data trace on/off for client 1TrOnchip.Alpha TraceONClient1TrOnchip.Beta TraceOFFClient1
Qorivva MPC5xxx/SPC5xx Debugger and NEXUS Trace 68 ©1989-2018 Lauterbach GmbH

Troubleshooting Trace
Tracing VLE or Mixed FLE/VLE Applications
On processors with support for both VLE (variable length encoding) and FLE (std PowerPC instruction encoding), the debug symbols must provide information about which address ranges are compiled for which encoding. The debugger will show wrong information in the List window, and there will be flow errors in the Trace analysis, if one of below situations occur:
• If debug symbols have not been loaded, the disassembler is probably not configured to display the currently used instruction set. Use SYStem.Option.DisMode <VLE | FLE> to configure manually, or use SYStem.Option.DisMode AUTO (default) to display the instruction set according to the current state of the CPU. If is always possible to use SYStem.Option.DisMode <VLE | FLE> to manually force a specific decoding.
• If debug symbols have been loaded, the debugger will use the information from the debug symbols if SYStem.Option.DisMode AUTO is selected.
• If the debug symbols are loaded, but the disassembly is still wrong, the information about the used instruction set may be wrong. The command sYmbol.List.ATTRibute opens a window that displays all address ranges of the debug symbols and if the instructions are FLE or VLE. The information from MMU.DUMP.TLB1 can help to compare the current VLE setup in the MMU with the information from the debug symbols. If the information in sYmbol.List.ATTRibute is wrong, please check your linker configuration.
• If the debugger lists VLE/FLE instructions as expected for the address ranges shown in sYmbol.List.ATTRibute but there are still sporadic errors in the disassembly, then the used linker is not properly configured to link VLE code. In this case it was observed that all debug symbols were aligned to 4 byte boundaries, while the actual code was aligned at 2 byte boundaries. Check linker version and linker configuration.
• Early complier versions supporting VLE often had buggy VLE debug symbols. Check if a compiler update is available.
As a workaround, it is also possible to override the information loaded from the debug symbols using sYmbol.NEW.ATTRibute.
; Syntax:; sYmbol.NEW.ATTRibute <FLE|VLE> <start-address>; sYmbol.NEW.ATTRibute <FLE|VLE> <range>
; Example: overrideData.LOAD auto project.elfsYmbol.NEW.ATTRibute FLE 0x00000000--0x0003ffffsYmbol.NEW.ATTRibute VLE 0x00040000--0x00ffffff
;add new attribute FLE for BAM, which is not covered by debug symbolssYmbol.NEW.ATTRibute FLE 0xFFFFF000
Qorivva MPC5xxx/SPC5xx Debugger and NEXUS Trace 69 ©1989-2018 Lauterbach GmbH

FLASH Programming Support
FLASH Programming Scripts
Reference scripts for the programming of the on-chip FLASH of MPC5XXX/SPC5XXX devices can be found in the TRACE32 installation folder under ~~/demo/powerpc/flash/*.cmm. The FLASH programming binaries included with TRACE32 are generated from FLASH libraries provided by Freescale and/or ST. The script names follow the following convention:
For automatic selection of the right flash script, use the included selector script: mpc5xxx.cmm.
All scripts can be used without change in any project. For flexibility, the flash scripts support some parameters. All parameters are optional:
Manufacturer Filename
Freescale ~~/demo/powerpc/flash/mpc5*.cmm
STMicroelectronics ~~/demo/powerpc/flash/spc5*.cmm
Freescale/STM JDPJoint Development Program
~~/demo/powerpc/flash/jpc5*.cmm
Parameter Behavior
(no parameter) Set up processor and debugger for flash programming, then open a file select dialog. The file selected by the user will be programmed to flash.This function is also available through the menu:MPC5XXX -> Tools -> Program FLASH
PREPAREONLY Only set up processor and debugger for flash programming. No user interaction occurs.
SKIPCONFIG Set up processor and debugger for flash programming, but skip basic debugger / target setup for advanced configuration. No user interaction occurs.
PORTSHARING=ON Enable debug port sharing with other tools, e.g. ETAS ETK. If this parameter is passed to the flash script, the flash script calls SYStem.CONFIG PortSHaring ON
Qorivva MPC5xxx/SPC5xx Debugger and NEXUS Trace 70 ©1989-2018 Lauterbach GmbH

This example shows how to call a flash script from your own script. It is important to reset the processor (SYStem.Up) after flash programming, because the processor setup for flash programming can differ from the one needed for the application to run (e.g. VLE vs. FLE):
To improve the flash programming speed, set up PLL and JTAG clock after calling the flash script. The PLL setting and possible maximum JTAG frequency strongly depends on the target design and processor. Use carefully, because overclocking can damage the processor.
;prepare flash programming DO ~~/demo/powerpc/flash/mpc5xxx.cmm PREPAREONLY
;activate flash programming (erasing unused sectors) FLASH.ReProgram ALL /Erase
;load file(s) Data.LOAD.Elf project.x Data.LOAD.S3 data.s3
;commit data to flash FLASH.ReProgram off
;after flash programming: reset processor SYStem.Up
;prepare flash programming DO ~~/demo/powerpc/flash/mpc5676r.cmm PREPAREONLY
Data.Set ANC:0xC3F80000 %LONG 0x06000000 ;PLL for fast programming SYStem.BdmClock 20.MHz ;for faster download
;program FLASH FLASH.ReProgram ALL /Erase Data.LOAD.Elf project.x FLASH.ReProgram off
;after flash programming: reset processor SYStem.Up
Qorivva MPC5xxx/SPC5xx Debugger and NEXUS Trace 71 ©1989-2018 Lauterbach GmbH

This example shows how to perform advanced debugger/target configuration. The bold lines show some possible advanced settings (use only when appropriate!):
Requirements due to FLASH ECC Protection
The on-chip FLASH of MPC55XX/56XX implements an ECC error detection/protection. Therefore, the minimum program size is two consecutive 32-bit words, aligned on a 0-modulo-8 byte address. The resulting 64-bit units must not be programmed more than once after each erase cycle. If such a unit is programmed more than once, the unit can become inaccessible due to ECC detection.
Multiple programming of 64-bit units can occur, if
• a file is programmed (e.g. ELF, SRECORD), which contains memory blocks which are not aligned to 0-modulo-8 byte addresses,
• several files are programmed with overlapping address ranges.
It is recommended to use FLASH.ReProgram instead of FLASH.Program to program flash. FLASH.ReProgram will merge all data loaded by Data.LOAD or Data.Set before programming the device. This way TRACE32 will ensure that no 64-bit unit will be programmed more than once. The provided flash example scripts also use FLASH.ReProgram.
If the FLASH already contains ECC errors, please make sure to call FLASH.Erase once before calling FLASH.ReProgram. Starting with Build 20739, FLASH.ReProgram supports programming FLASH with ECC errors without prior call of FLASH.Erase.
The FLASH can contain ECC errors, if
• the FLASH memory is damaged (in this case FLASH.Erase might fail too)
• 64-bit units were programmed more than once
• problems during programming (e.g. power fail, software issues)
• it is a new device, which was never programmed/erased after factory tests
SYStem.RESet SYStem.CPU MPC5676R SYStem.Option.WATCHDOG OFF SYStem.CONFIG PortSHaring ON ;calibtration tool connected SYStem.CONFIG EXTWDTDIS HIGH ;disable external watchdog SYStem.Up
;prepare flash programming DO ~~/demo/powerpc/flash/mpc5676r.cmm PREPAREONLY SKIPCONFIG
;activate flash programming (erasing unused sectors) FLASH.ReProgram ALL /Erase
Qorivva MPC5xxx/SPC5xx Debugger and NEXUS Trace 72 ©1989-2018 Lauterbach GmbH

Programming the RCHW or Boot Header
The RCHW or boot header holds information about the start address for the core(s) amongst other configuration settings. Depending on the target processor, the RCHW/boot header is either read by the BAM or BAF code, or directly evaluated by the processor’s reset logic. If a SYStem.Up is performed, the processor sets the PC to the BAM/BAF start address in the BAM/BAF case, while in the reset logic case, the PC will be directly set to the start address in the RCHW or boot header.
The RCHW or boot header typically is (and should be) part of the flash image, but it can also be generated using the debugger, e.g. if the start address can be determined using debug symbols. The following example shows how to manually program the RCHW on a MPC55XX processor. Addresses and contents vary depending on the target processor in use.
Programming the Shadow Row
The flash programming example scripts included with TRACE32 declare the shadow row sector, but the sector is set to flash algorithm NOP instead of TARGET. This way the sector is protected against accidental erase or programming.
In order to enable programming or erasing the shadow row, the flash declaration has to be changed to algorithm TARGET. Example:
FLASH.ReProgram ALL /ERASEData.LOAD.ELF * E:0x00--(&flashsize-1)Data.Set 0x00 %Long 0x005A0000 ;boot identifierData.Set 0x04 %Long Var.ADDRESS("_start") ;start addressFLASH.ReProgram off
NOTE: Programming the boot identifier without (or with an invalid) start address can render the processor unusable and the debugger will fail to connect to the processor. In order to regain access, pull the FAB pin of the processor HIGH. This will configure the processor to boot from internal ROM instead of trying to fetch the illegal boot address from flash. Once the FAB pin is high, the debugger can connect and reprogram the FLASH.
;prepare flash programming DO ~~/demo/powerpc/flash/mpc5xxx.cmm PREPAREONLY
;enable shadow row programming (change type NOP to TARGET) FLASH.CHANGETYPE <shadow_row_base>++0x3FF TARGET
;program FLASH FLASH.ReProgram ALL ...
Qorivva MPC5xxx/SPC5xx Debugger and NEXUS Trace 73 ©1989-2018 Lauterbach GmbH

Once the shadow row sector is set to type TARGET, it can be erased and programmed. The censorship word is however still protected. Every time the shadow row is erased, the debugger will force restore the default censorship word.
The next chapter describes how to override this extra protection and change the censorship word in flash.
Qorivva MPC5xxx/SPC5xx Debugger and NEXUS Trace 74 ©1989-2018 Lauterbach GmbH

Programming Serial Boot Password and Censorship Word
After enabling shadow row programming as described above, the serial boot password can be programmed.
The censorship word has an extra protection. By default, the debugger will force that the censorship word gets programmed to 0x55AA55AAFFFFFFFF (for C90LC-Flash: 0x55AA55AA55AA55AA). In order to program the censorship word, use the following sequence:
The next sequence shows how to disable censorship:
Newer processors (MPC56XX, SPC56X and later) have a feature to inhibit censorship via JTAG (using the serial password). See SYStem.Option.KEYCODE for details.
;prepare flash programming and enable shadow row DO ~~/demo/powerpc/flash/mpc5xxx.cmm PREPAREONLY FLASH.CHANGETYPE <shadow_row_base>++<size> TARGET
;programming sequence to enable censored mode FLASH.AUTO <shadow_row_base>++<size> /CENSORSHIP Data.Set <censorship-addr> %QUAD 0x55AA1234FFFFFFFF ;for C90FL/H7F Data.Set <censorship-addr> %QUAD 0x55AA123455AA1234 ;for C90LC Data.Set <password-addr> %QUAD 0xFEEDFACECAFEBEEF ;set password FLASH.AUTO off
;prepare flash programming and enable shadow row DO ~~/demo/powerpc/flash/mpc5xxx.cmm PREPAREONLY FLASH.CHANGETYPE <shadow_row_base>++<size> TARGET
;programming sequence to uncensor device FLASH.AUTO <shadow_row_base>++<size> /CENSORSHIP Data.Set <censorship-addr> %QUAD 0x55AA55AAFFFFFFFF ;for C90FL/H7F Data.Set <censorship-addr> %QUAD 0x55AA55AA55AA55AA ;for C90LC Data.Set <password-addr> %QUAD 0xFEEDFACECAFEBEEF ;default password FLASH.AUTO off
NOTE: The censorship word must have at least one bit set to 0 and one set to 1, in each half word (16 bit block).A valid password must have at least one bit set to 0 and one set to 1, in each half word (16 bit block). The password restriction only applies to 64-bit passwords. Processors with 256-bit passwords do not have that restriction.
Qorivva MPC5xxx/SPC5xx Debugger and NEXUS Trace 75 ©1989-2018 Lauterbach GmbH

TEST / UTEST / OTP FLASH Programming
Many processors implement one or more test sectors. Those sectors can contain factory data and configuration (DCF) records, but can also hold user-specific data, like e.g. serial numbers. The TEST/UTEST sectors are usually OTP, either by factory default or by user configuration.
In order to protect these sectors from accidental programming/overwriting, they are marked with option /OTP in the flash scripts. Example for MPC5746M/SPC57EM (excerpt from jpc574xm.cmm):
Programming an OTP Sector
FLASH sectors declared with option /OTP remain disabled (all writes are ignored) during normal FLASH programming, to prevent accidental programming. Any FLASH command that makes use of the erase feature (i.e. FLASH.Erase, FLASH.AUTO, FLASH.ReProgram) will omit sectors declared as OTP.
OTP sectors must be programmed using FLASH.Program with option /OTP. It is highly recommended to program normal sectors and OTP separately:
FLASH.RESet...FLASH.Create 4. 0x01300000--0x0133FFFF TARGET Quad 0x030cFLASH.Create 4. 0x01340000--0x0137FFFF TARGET Quad 0x030d; UTEST address spaceFLASH.Create 6. 0x00400000--0x00403FFF TARGET Quad 0x0500 /OTP /INFO "UTEST"
;Step 0: Prepare flash programming DO ~~/demo/powerpc/flash/mpc5xxx.cmm PREPAREONLY
;Step 1: Program normal sectors (OTP sectors are ignored) FLASH.ReProgram ALL /Erase Data.LOAD.Elf project.x Data.LOAD.S3 data.s3 FLASH.ReProgram off
;Step 2: Program OTP FLASH.Program 0x00400000--0x00403FFF /OTP Data.LOAD.Binary <file> <start_address> ;and/or alternatively: Data.Set %Quad <address> %Quad <dcf-record1> [<dcf-record2> ...] FLASH.Program off
Qorivva MPC5xxx/SPC5xx Debugger and NEXUS Trace 76 ©1989-2018 Lauterbach GmbH
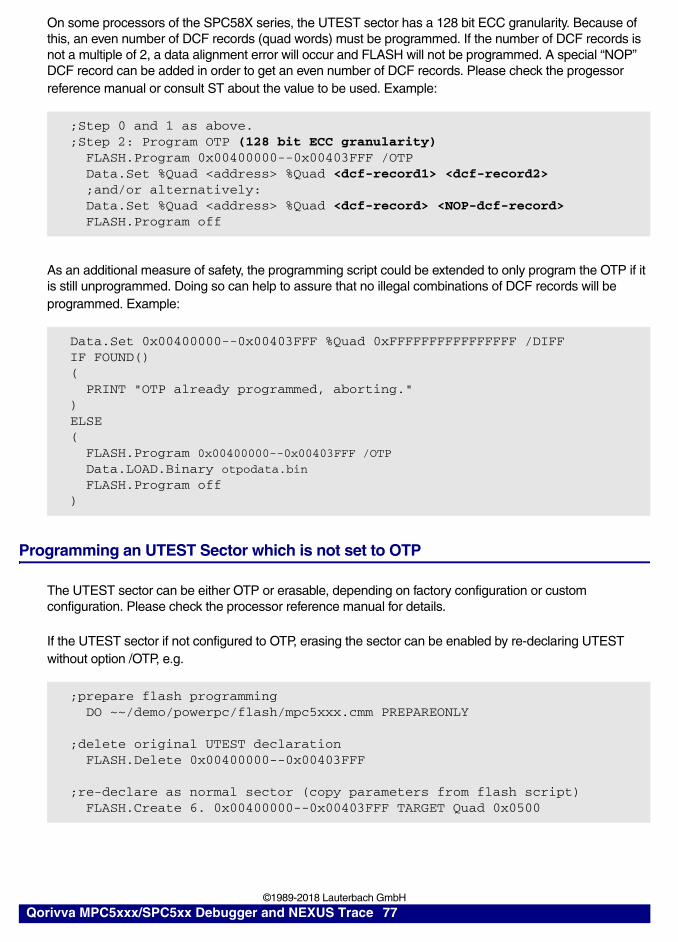
On some processors of the SPC58X series, the UTEST sector has a 128 bit ECC granularity. Because of this, an even number of DCF records (quad words) must be programmed. If the number of DCF records is not a multiple of 2, a data alignment error will occur and FLASH will not be programmed. A special “NOP” DCF record can be added in order to get an even number of DCF records. Please check the progessor reference manual or consult ST about the value to be used. Example:
As an additional measure of safety, the programming script could be extended to only program the OTP if it is still unprogrammed. Doing so can help to assure that no illegal combinations of DCF records will be programmed. Example:
Programming an UTEST Sector which is not set to OTP
The UTEST sector can be either OTP or erasable, depending on factory configuration or custom configuration. Please check the processor reference manual for details.
If the UTEST sector if not configured to OTP, erasing the sector can be enabled by re-declaring UTEST without option /OTP, e.g.
;Step 0 and 1 as above.;Step 2: Program OTP (128 bit ECC granularity) FLASH.Program 0x00400000--0x00403FFF /OTP Data.Set %Quad <address> %Quad <dcf-record1> <dcf-record2> ;and/or alternatively: Data.Set %Quad <address> %Quad <dcf-record> <NOP-dcf-record> FLASH.Program off
Data.Set 0x00400000--0x00403FFF %Quad 0xFFFFFFFFFFFFFFFF /DIFFIF FOUND()( PRINT "OTP already programmed, aborting.")ELSE( FLASH.Program 0x00400000--0x00403FFF /OTP Data.LOAD.Binary otpodata.bin FLASH.Program off)
;prepare flash programming DO ~~/demo/powerpc/flash/mpc5xxx.cmm PREPAREONLY
;delete original UTEST declaration FLASH.Delete 0x00400000--0x00403FFF
;re-declare as normal sector (copy parameters from flash script) FLASH.Create 6. 0x00400000--0x00403FFF TARGET Quad 0x0500
Qorivva MPC5xxx/SPC5xx Debugger and NEXUS Trace 77 ©1989-2018 Lauterbach GmbH

Brownout Depletion Recovery
If a brownout occurs during an erase operation on the C90FL flash, the flash blocks being erased can be left in an indeterminate state (invalid ECC values). A brownout is defined as an accidental power loss or supply voltage drop or unexpected reset. For more information see Freescale AN4521. Brownout depletion recovery is implemented for all affected devices. The recovery is performed automatically on-demand during flash operations (ReProgram, Erase or AUTO). No additional command or user action is required.
Troubleshooting FLASH
File Contains Addresses Outside the FLASH Sectors
A frequently occurring problem is that the file to be programmed to FLASH contains address ranges outside the addresses of the FLASH sectors (e.g. SRAM or unimplemented memory space). This can interrupt the flash algorithm or cause the processor to reset. In order to investigate such problems, use the following commands to find out which address ranges are contained in the loaded file.
If the sYmbol.List.Map window shows an address range outside of FLASH, the problem is usually a bug in the linker script and should be fixed there. In the case there is data linked to SRAM, there is often a chance that the application does not run reliably because of missing data initialization. If section linked to SRAM is not assumed to be an error, an alternative solution is to give the Data.LOAD command an address range.
NOTE: If an OTP sector is declared without option /OTP in the flash script, TRACE32 can not provide any protection against accidental programming or overwriting of OTP sector contents. In the worst case, accidental overwriting (of e.g. DCF records or factory configuration data) can permanently damage the processor.
; find out which addresses are contained in loaded fileData.LOAD.auto * /VMsYmbol.List.Map
; load only a part of the contained addresses (because we know it’s ok)FLASH.ReProgram ALLData.LOAD.auto * 0--0x0FFFFFFFFLASH.ReProgram off
Qorivva MPC5xxx/SPC5xx Debugger and NEXUS Trace 78 ©1989-2018 Lauterbach GmbH

ECC Errors in FLASH
The FLASH programming commands FLASH.ReProgram and FLASH.AUTO will read from FLASH sectors that are going to be modified. Although the debugger tries to recover automatically from ECC errors, sometimes it is required to use FLASH.Erase to recover from ECC errors. In order to maintain high flash programming/update speeds and to not unnecessarily increase programming cycles, it is recommended to use FLASH.Erase only as fallback instead of adding it to the start of every new Flash.ReProgram cycle.
Qorivva MPC5xxx/SPC5xx Debugger and NEXUS Trace 79 ©1989-2018 Lauterbach GmbH

Command Reference: SYStem Commands
SYStem.BdmClock Set BDM clock frequency
Selects the frequency for the debug interface. For multicore debugging, it is recommended to set the same JTAG frequency for all cores.
Format: SYStem.BdmClock <rate>
<rate>: 1kHz … 50MHz
NOTE: The recommended maximum JTAG frequency is 1/4th of the core frequency with default PLL configuration after reset. The JTAG frequency can be increased after configuring the PLL.Please make sure to decrease the JTAG frequency to 1/4th of the reset core frequency before a target reset (e.g. SYStem.Up).See processor data sheet for additional restrictions of the max. JTAG frequency.
Qorivva MPC5xxx/SPC5xx Debugger and NEXUS Trace 80 ©1989-2018 Lauterbach GmbH
SYStem.CONFIG.state Display target configuration
Opens the SYStem.CONFIG.state window, where you can view and modify most of the target configuration settings. The configuration settings tell the debugger how to communicate with the chip on the target board and how to access the on-chip debug and trace facilities in order to accomplish the debugger’s operations.
Alternatively, you can modify the target configuration settings via the TRACE32 command line with the SYStem.CONFIG commands. Note that the command line provides additional SYStem.CONFIG commands for settings that are not included in the SYStem.CONFIG.state window.
Format: SYStem.CONFIG.state [/<tab>]
<tab>: DebugPort | Jtag | XCP
<tab> Opens the SYStem.CONFIG.state window on the specified tab. For tab descriptions, refer to the list below.
DebugPort Lets you configure the electrical properties of the debug connection, such as the communication protocol or the used pinout.
Jtag Informs the debugger about the position of the Test Access Ports (TAP) in the JTAG chain which the debugger needs to talk to in order to access the debug and trace facilities on the chip.
XCP Lets you configure the XCP connection to your target.
For descriptions of the commands on the XCP tab, see “XCP Debug Back-End” (backend_xcp.pdf).
Qorivva MPC5xxx/SPC5xx Debugger and NEXUS Trace 81 ©1989-2018 Lauterbach GmbH
SYStem.CONFIG Configure debugger according to target topology
The four parameters IRPRE, IRPOST, DRPRE, DRPOST are required to inform the debugger about the TAP controller position in the JTAG chain, if there is more than one processor in the JTAG chain. The information is required before the debugger can be activated e.g. by a SYStem.Up. See example below.
TriState has to be used if (and only if) more than one debugger are connected to the common JTAG port at the same time. TAPState and TCKLevel define the TAP state and TCK level which is selected when the debugger switches to tristate mode.
Debug port parameters:
Format: SYStem.CONFIG <parameter> <number_or_address>SYStem.MultiCore <parameter> <number_or_address> (deprecated)
<parameter>(DebugPort):
CORE <coreindex> <chipindex>DEBUGPORT DebugCable0 | Analyzer0 | XCP0Slave ON | OFFTriState ON | OFF
<parameter>(JTAG):
DRPRE <bitcount>DRPOST <bitcount>IRPRE <bitcount>IRPOST <bitcount>
TAPState 7 | 12TCKLevel 0 | 1
NOTE: When using the TriState mode, nTRST/JCOMP must have a pull-up resistor on the target. In TriState mode, a pull-down is recommended for TCK, but targets with pull-up are also supported.
CORE The parameter <coreindex> defines which core the PowerView instance controls. Counting starts with 1, i.e. 1: core_0, 2: core_1, 3: core_2...The parameter <chipindex> is important for multi-chip targets. All PowerView instances which control cores on the same physical chip must use the same <chipindex> value. Although any value > 0 is allowed, it is recommended to use 1 for single-chip targets. See Multicore Debugging for details and examples.
DEBUGPORT Use this command to select the debug port to use for JTAG communication. On TRACE32 PowerTools hardware, the debug port can be either DebugCable0 or Analyzer0, if a Nexus adapter is connected. If TRACE32 is operated on software-only mode, DebugPort XCP0 allows debugging via a 3rd party XCP slave.
Qorivva MPC5xxx/SPC5xx Debugger and NEXUS Trace 82 ©1989-2018 Lauterbach GmbH

JTAG parameters (see daisy chain example below):
Slave (default: OFF) If more than one PowerView instance is using the same JTAG port, all except one must have this option active. Only one debugger - the “master” - is allowed to control the signals nTRST/JCOMP and (nRESET).
TriState (default: OFF) If more than one debugger share the same JTAG port, this option is required. The debugger switches to tristate mode after each JTAG access. Then other debuggers can access the port.
DRPRE (default: 0) <number> of TAPs in the JTAG chain between the core of interest and the TDO signal of the debugger. If each core in the system contributes only one TAP to the JTAG chain, DRPRE is the number of cores between the core of interest and the TDO signal of the debugger.
DRPOST (default: 0) <number> of TAPs in the JTAG chain between the TDI signal of the debugger and the core of interest. If each core in the system contributes only one TAP to the JTAG chain, DRPOST is the number of cores between the TDI signal of the debugger and the core of interest.
IRPRE (default: 0) <number> of instruction register bits in the JTAG chain between the core of interest and the TDO signal of the debugger. This is the sum of the instruction register length of all TAPs between the core of interest and the TDO signal of the debugger.
IRPOST (default: 0) <number> of instruction register bits in the JTAG chain between the TDI signal and the core of interest. This is the sum of the instruction register lengths of all TAPs between the TDI signal of the debugger and the core of interest.
TAPState (default: 7 = Select-DR-Scan) This is the state of the TAP controller when the debugger switches to tristate mode. All states of the JTAG TAP controller are selectable.
TCKLevel (default: 0) Level of TCK signal when all debuggers are tristated.
Qorivva MPC5xxx/SPC5xx Debugger and NEXUS Trace 83 ©1989-2018 Lauterbach GmbH
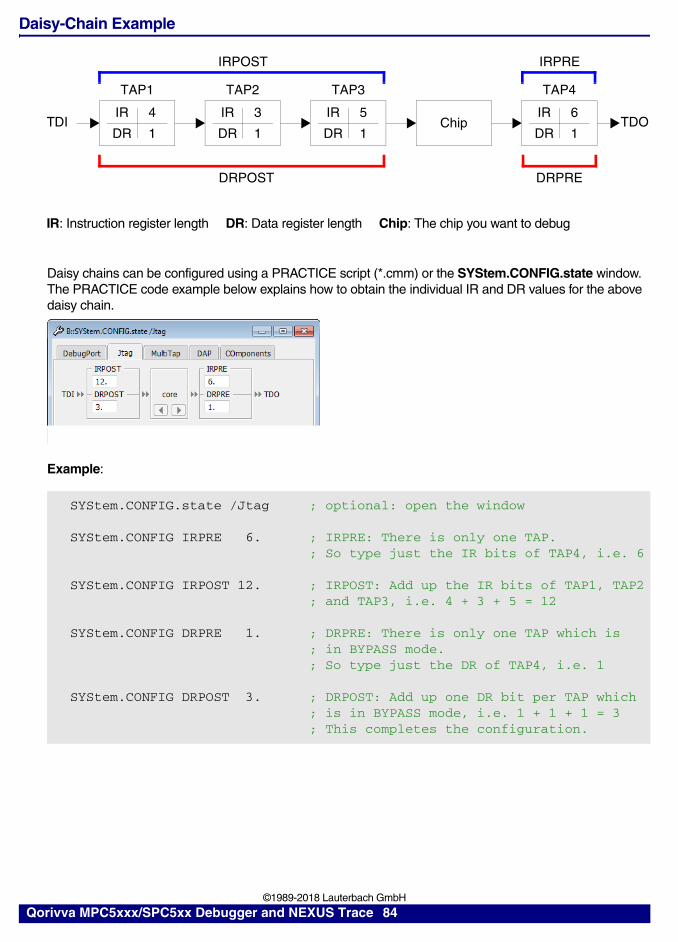
Daisy-Chain Example
Daisy chains can be configured using a PRACTICE script (*.cmm) or the SYStem.CONFIG.state window. The PRACTICE code example below explains how to obtain the individual IR and DR values for the above daisy chain.
Example:
SYStem.CONFIG.state /Jtag ; optional: open the window
SYStem.CONFIG IRPRE 6. ; IRPRE: There is only one TAP. ; So type just the IR bits of TAP4, i.e. 6
SYStem.CONFIG IRPOST 12. ; IRPOST: Add up the IR bits of TAP1, TAP2 ; and TAP3, i.e. 4 + 3 + 5 = 12
SYStem.CONFIG DRPRE 1. ; DRPRE: There is only one TAP which is ; in BYPASS mode. ; So type just the DR of TAP4, i.e. 1
SYStem.CONFIG DRPOST 3. ; DRPOST: Add up one DR bit per TAP which ; is in BYPASS mode, i.e. 1 + 1 + 1 = 3 ; This completes the configuration.
Chip
IRPOST IRPRE
4
1
TAP1
IR
DR
3
1
TAP2
IR
DR
5
1
TAP3
IR
DR
6
1
TAP4
IR
DRTDI TDO
DRPOST DRPRE
IR: Instruction register length DR: Data register length Chip: The chip you want to debug
Qorivva MPC5xxx/SPC5xx Debugger and NEXUS Trace 84 ©1989-2018 Lauterbach GmbH
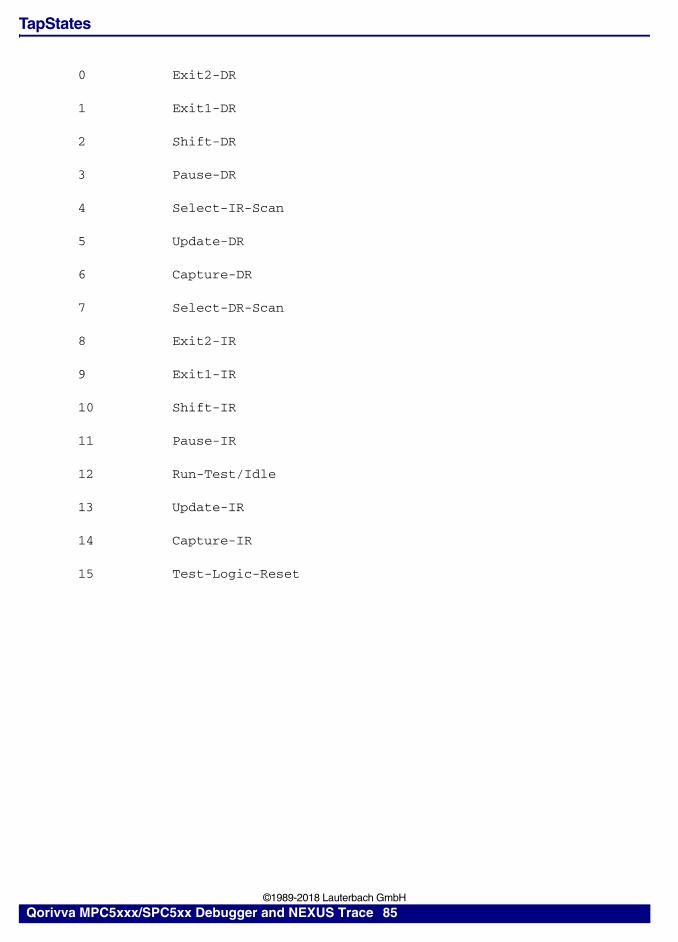
TapStates
0 Exit2-DR
1 Exit1-DR
2 Shift-DR
3 Pause-DR
4 Select-IR-Scan
5 Update-DR
6 Capture-DR
7 Select-DR-Scan
8 Exit2-IR
9 Exit1-IR
10 Shift-IR
11 Pause-IR
12 Run-Test/Idle
13 Update-IR
14 Capture-IR
15 Test-Logic-Reset
Qorivva MPC5xxx/SPC5xx Debugger and NEXUS Trace 85 ©1989-2018 Lauterbach GmbH
SYStem.CONFIG.DEBUGPORTTYPE Set debug cable interface mode
Default: JTAG.
This command is used to configure the debug port type used by the debugger.
Hardware Requirements for cJTAG Operation
Debug modules: These debug modules do not support cJTAG operation:
• LA-7702: PowerDebug module (without USB or Ethernet connection)
• LA-7704: PowerDebug USB1 module
If the debug cable or Nexus adapter supports cJTAG operation depends on the production date. The production date is encoded in the serial number (CYYMMxxxxxxx, YY=year, MM=month).
• LA-7753 (14-pin JTAG/OnCE header): Must be from 09/2009 or later
• LA-3736 (AUTO26 header): supported by all versions
• LA-7630 (Nexus AutoFocus adapter):
- 01/2013 and newer: full support
- 06/2009...12/2012: restricted support (TDI and TDO signal of Nexus adapter must be disconnected from any target signal when using cJTAG)
- 05/2009 and older: not supported
• LA-7610 (Nexus adapter 3.3V): not supported
• LA-7612 (Nexus adapter 5V): not supported
Format: SYStem.CONFIG.DEBUGPORTTYPE [JTAG | CJTAG]
Qorivva MPC5xxx/SPC5xx Debugger and NEXUS Trace 86 ©1989-2018 Lauterbach GmbH

SYStem.CONFIG.EXTWDTDIS Disable external watchdog
Controls the WDTDIS pin of the Automotive Debug Cable. This option is only available if an Automotive Debug Cable is connected to the PowerDebug module.
See also “Application Note Debug Cable TriCore” (tricore_app_ocds.pdf).
SYStem.CONFIG PortSHaRing Control sharing of debug port with other tool
Configures if the debug port is shared with another tool, e.g., an ETAS ETK.
Format: SYStem.CONFIG EXTWDTDIS <option>
<option>: HighLow
High The WDTDIS pin is permanently driven high (default).
Low The WDTDIS pin is permanently driven low.
Format: SYStem.CONFIG PortSHaRing [ON | OFF | Mode <mode>]SYStem.Option ETK [ON | OFF] (deprecated)SYStem.Option GSI [1 | 2 | OFF] (deprecated)
<mode>: ETK | GSI1 | GSI2
ON Request for access to the debug port and wait until the access is granted before communicating with the target.
OFF Communicate with the target without sending requests.
Mode Select protocol mode. Default: ETK (also supports XETK).Modes GSI1 and GSI2 used for DSPACE GSI with either one or two data address breakpoints reserved for other tool.
Qorivva MPC5xxx/SPC5xx Debugger and NEXUS Trace 87 ©1989-2018 Lauterbach GmbH

The current setting can be obtained by the PORTSHARING() function, immediate detection can be performed using SYStem.DETECT PortSHaRing.
SYStem.CPU Select the target processor
Selects the target processor or target core. If the target processor is not available in the CPU selection of the SYStem window, or if the command results in an error,
• Check if the licence of the debug cable includes the desired processor. You will find the information in the VERSION window.
• Check if the debugger software is sufficiently recent to support the target processor. The debugger software version can be looked up in the VERSION window. If the processor release occurred after the debugger software release, the processor is most likely not supported. Please check the Lauterbach download center (www.lauterbach.com) for updates. If the debugger software version from the download center also does not support the processor, please contact technical support and request a software update.
If you are unsure about the processor, try SYStem.DETECT CPU for automatic detection.
NOTE: • Supported by:LA-3736 (JTAG Debugger for MPC5xxx Automotive) LA-7630 (NEXUS Debug/Trace for Qorivva MPC5xxx/SPC5xxx)LA-7610 (NEXUS Debugger and Trace for MPC5500)
• Not supported by:LA-7753 (JTAG Debugger Qorivva MPC5xxx/SPC5xxx)
Format: SYStem.CPU <cpu_name>
<cpu_name>: MPC55XX | MPC5554 | …
Qorivva MPC5xxx/SPC5xx Debugger and NEXUS Trace 88 ©1989-2018 Lauterbach GmbH

SYStem.CpuAccess Run-time CPU access (intrusive)
This option declares if an intrusive memory access can take place while the CPU is executing code. To perform this access, the debugger stops the CPU shortly, performs the access and then restarts the CPU.
The run-time memory access has to be activated for each window by using the access class E: (e.g. Data.dump E:0x100) or by using the format option %E (e.g. Var.View %E var1).
SYStem.LOCK Lock and tristate the debug port
Default: OFF.
If the system is locked, no access to the debug port will be performed by the debugger. While locked, the debug connector of the debugger is tristated. The main intention of the lock command is to give debug access to another tool. The command has no effect for the simulator.
Format: SYStem.CpuAccess <mode>
<mode>: Enable | Denied | Nonstop
Enable In order to perform a memory read or write while the CPU is executing the program the debugger stops the program execution shortly.Each short stop takes 1 … 100 ms depending on the speed of the debug interface and on the size of the read/write accesses required.
Denied No intrusive memory read or write is possible while the CPU is executing the program.
Nonstop Nonstop ensures that the program execution can not be stopped and that the debugger doesn’t affect the real-time behavior of the CPU.Nonstop reduces the functionality of the debugger to:• run-time access to memory and variables• trace displayThe debugger inhibits the following:• to stop the program execution• all features of the debugger that are intrusive (e.g. spot break-
points, performance analysis via StopAndGo, conditional break-points etc.)
Format: SYStem.LOCK [ON | OFF]
Qorivva MPC5xxx/SPC5xx Debugger and NEXUS Trace 89 ©1989-2018 Lauterbach GmbH

SYStem.MemAccess Run-time memory access (non-intrusive)
This option declares if and how a non-intrusive memory access can take place while the CPU is executing code. Although the CPU is not halted, run-time memory access creates an additional load on the processor’s internal data bus. The run-time memory access has to be activated for each window by using the access class E: (e.g. Data.dump E:0x100) or by using the format option %E (e.g. Var.View %E var1). It is also possible to activate this non-intrusive memory access for all memory ranges displayed on the TRACE32 screen by setting SYStem.Option DUALPORT ON.
Format: SYStem.MemAccess <mode>
<mode>: Denied | NEXUS | XCP
Denied Memory access is disabled while the CPU is executing code.
NEXUS Memory access is done via the on-chip NEXUS block. This option is available for both the NEXUS and JTAG-only debugger solution. Memory accesses via the NEXUS block can not snoop caches. MPC55XX/56XX, SPC56X: While the core is running, data in cache can not be modified with this access. If the cache operates in copy-back mode, reading cached data is also not possible.MPC57XX/SPC57X/SPC58X: Data cache is write-through, so reading cached data is always possible, updating cached contents also is supported on most of these processors.MPC5777C: See SYStem.Option.NexusMemoryCoherency
XCP Only available for software-only debugging (HostMCI).Memory access is done via a built-in memory access feature of the 3rd party XCP slave. This memory access method is faster than performing the memory access by sending JTAG commands to the XCP slave, but the behavior (e.g. in terms of cache coherency) my differ depending on the XCP slave hardware, firmware or configuration.
NOTE: • These processors do not support run-time memory access via NEXUS: MPC5601D, MPC5602D, MPC5601P, MPC5602P
Qorivva MPC5xxx/SPC5xx Debugger and NEXUS Trace 90 ©1989-2018 Lauterbach GmbH

SYStem.Mode Select operation mode
Selects the target reset mode.
Format: SYStem.Mode <mode>
<mode>: Down | NoDebug | Go | Attach | StandBy | Up
Down Disables the debugger. The state of the CPU remains unchanged.
NoDebug Resets the target with debug mode disabled. In this mode no debugging is possible. The CPU state keeps in the state of NoDebug.
Go Resets the target with debug mode enabled and prepares the CPU for debug mode entry. Now, the processor can be stopped with the break command or any break condition.
Attach Connect to the processor without resetting target/processor. Use this command to connect to the processor without changing it’s current state.
StandBy Debugging/Tracing through power cycles.The debugger will wait until power-on is detected, then bring the CPU into debug mode, set all debug and trace registers and start the CPU. In order to halt the CPU at the first instruction, place a temporary on-chip breakpoint range (Break 0--0xFFFFFFFC /Onchip)
Up Resets the target/processor and sets the CPU to debug mode. After execution of this command the CPU is stopped and prepared for debugging.
Qorivva MPC5xxx/SPC5xx Debugger and NEXUS Trace 91 ©1989-2018 Lauterbach GmbH

Command Reference: SYStem.Option Commands
SYStem.Option CoreStandBy On-the-fly breakpoint and trace setup
On multi-core processors, only one of the cores starts to execute code right after reset. The other cores remain in reset or disabled state. In this state it is not possible to set breakpoints or configure the core for tracing. This option works around this limitation and makes breakpoints and tracing available on these cores.
SYStem.Option DCFREEZE Data cache state frozen while core halted
Default: ON. This command configures how the debugger will maintain cache coherence for the debugger’s memory accesses while the core is halted in debug mode. The setting has no impact on the run-time memory access.
If ON, the debugger will maintain cache coherency by reading or writing directly to the cache arrays and memory. This method guarantees that the cache tags and status bits (valid, dirty) of remain unaffected by the memory accesses of the debugger. The debugger will also maintain cache coherency if the memory access is done through the NEXUS block (access class “E:”, or SYStem.Option.DUALPORT ON) is used while the core is halted. This is the recommended setting.
If OFF, the debugger will maintain cache coherency by allowing the data/unified cache to be updated while reading or writing memory through debug commands. Cache coherency is not maintained if memory is accessed through the NEXUS block (access class “E:”, or SYStem.Option.DUALPORT ON).
Setting DCFREEZE to OFF is reserved for a specific use case which requires an optimal data throughput while maintaining cache coherency (while core is halted). Do not to set DCFREEZE to OFF unless advised by Lauterbach.
Format: SYStem.Option CoreStandBy [ON | OFF]
NOTE: This option is not required for MPC5676R when operated in SMP mode or when SYnch.MasterSystemMode and SYnch.SlaveSystemMode are set to ON in AMP debugging mode.
Format: SYStem.Option DCFREEZE [ON | OFF]
Qorivva MPC5xxx/SPC5xx Debugger and NEXUS Trace 92 ©1989-2018 Lauterbach GmbH

SYStem.Option DCREAD Read from data cache
Default: ON.
If enabled, Data.dump windows for access class D: (data) and variable windows display the memory values from the d-cache, if valid. If data is not available in cache, physical memory will be read.
SYStem.Option DISableResetEscalation Control reset escalation disabling
Default: ON.
A processor that implements the reset escalation feature disable itself after a certain number of resets. Once a processor is fully escalated, a power cycle is required to regain debug access to the cores. The debugger disables the reset escalation by default, to facilitate the debug and development process. In order to test the behavior of the reset escalation in the application, set this option to OFF.
Please note that debugger-generated resets (e.g. SYStem.Up) also contribute to the number of resets that trigger the reset escalation.
SYStem.Option DISableShortSequence Short reset sequence handling
Some processors support a feature called short reset sequence, which is enabled through the RGM_FESS register. When the short reset sequence is enabled, a part of the reset phases (e.g. the BIST) are skipped at reset (including reset asserted by the debugger, e.g. for SYStem.Up).
Having an incomplete reset can cause problems to the debugger, for example, flash programming can fail. Therefore, by default setting (ON), the debugger disable the short reset sequence for external and JTAG resets.
Some boot loaders can not cope with the debugger’s behavior, because they blindly assume that the short sequence is enabled without checking the actual setting of the RGM_FESS register. This can cause the application to crash (e.g. by accessing uninitialized SRAM).
Format: SYStem.Option DCREAD [ON | OFF]
Format: SYStem.Option DISableResetEscalation [ON | OFF]
Format: SYStem.Option DISableShortSequence [ON | OFF]
Qorivva MPC5xxx/SPC5xx Debugger and NEXUS Trace 93 ©1989-2018 Lauterbach GmbH

The ideal solution is to modify the boot loader so that it evaluates RGM_FESS when deciding if the short sequence is enabled or not.
Set this option to OFF for boot loaders which have problems when the debugger disables the short sequence. The target will require a power cycle in order to recover from the debugger’s intervention.
Another use case of this option is to debug the reset scenario with short sequence enabled.
SYStem.Option DisMode Disassembler operation mode
MPC5XXX/SPC5XX with VLE instruction set support only.
This command sets the operation mode for the disassembler.
NOTE: • The debugger will print a warning to the message area / status line when SYStem.Up is performed when this option is set to OFF and short sequence is enabled.
• If you should experience debugging / flash programming problems while this option is set to OFF, you have to turn it ON again and perform another SYStem.Up.
Format: SYStem.Option DisMode <mode>
<mode>: ACCESSAUTOFLEVLE
AUTO (default) The information provided by the compiler output file is used for the disassembler selection. If no information is available, it has the same behavior as the option ACCESS.
ACCESS The operation mode for the disassembler is based on the current mode of the CPU.
FLE Use standard PowerPC instruction set disassembler mode (fixed length encoding) only.
VLE Use VLE disassembler mode (variable length encoding) only.
Qorivva MPC5xxx/SPC5xx Debugger and NEXUS Trace 94 ©1989-2018 Lauterbach GmbH

SYStem.Option DUALPORT Implicitly use run-time memory access
Forces all list, dump and view windows to use the access class E: (e.g. Data.dump E:0x100) or to use the format option %E (e.g. Var.View %E var1) without being specified. Use this option if you want all windows to be updated while the processor is executing code. This setting has no effect if SYStem.Option.MemAccess is disabled.
Please note that while the CPU is running, MMU address translation can not be accesses by the debugger. Only physical addresses accesses are possible. Use the access class modifier “A:” to declare the access physical addressed, or declare the address translation in the debugger-based MMU manually using TRANS.Create.
SYStem.Option FREEZE Freeze system timers on debug events
Enabling this option will lead the debugger to set the FT bit in the DBCR0 register. This bit will lead the CPU to stop the system timers (TBU/TBL and DEC) upon all debug events, that can be defined in DBCR0. The system timers will not be frozen on events like EVTI or the brkpt instruction. The timers/clocks or watchdogs of the on-chip peripherals are not affected by this option, but often can be configured to stop in debug mode by a FREEZE bit. For details please see the processor reference manual.
Format: SYStem.Option DUALPORT [ON | OFF]
Format: SYStem.Option FREEZE [ON | OFF]
Qorivva MPC5xxx/SPC5xx Debugger and NEXUS Trace 95 ©1989-2018 Lauterbach GmbH

SYStem.Option HoldReset Set reset hold time
Set the time that the debugger will drive the reset pin LOW, e.g. at SYStem.Up. The time must be longer than the BIST takes to complete. If called without parameter, the default reset hold time is used. The default reset hold time is 100ms for processors that require a BIST delay, else 100us.
See also SYStem.Option.WaitReset and SYStem.Option.SLOWRESET.
SYStem.Option HOOK Compare PC to hook address
The command defines the hook address. After program break the hook address is compared against the program counter value.
If the values are equal, it is supposed that a hook function was executed. This information is used to determine the right break address by the debugger.
SYStem.Option ICFLUSH Invalidate instruction cache before go and step
Only for cores with dedicated instruction cache (not for unified cache of e200z6 cores).
Default: ON.
Format: SYStem.Option HoldReset [<time>]
<time>: 1us … 10s
Format: SYStem.Option HOOK <address> | <address_range>
Format: SYStem.Option ICFLUSH [ON | OFF]
RESET pin
hold time wait time
CPU State RESET/BIST RESET DEBUG_HALT
Qorivva MPC5xxx/SPC5xx Debugger and NEXUS Trace 96 ©1989-2018 Lauterbach GmbH
Invalidates the instruction cache before starting the target program (Step or Go). If this option is disabled, the debugger will update Memory and instruction cache for program memory downloads, modifications and breakpoints. Disabling this option might cause performance decrease on memory accesses.
SYStem.Option ICREAD Read from instruction cache
Default: OFF:
If enabled, Data.List window and Data.dump window for access class P: (program memory) display the memory values from the instruction/unified cache if valid. If the data is not available in cache, the physical memory will be displayed.
SYStem.Option IMASKASM Disable interrupts while single stepping
Default: OFF.
If enabled, the interrupt mask bits of the CPU will be set during assembler single-step operations. The interrupt routine is not executed during single-step operations. After single step the interrupt mask bits are restored to the value before the step.
SYStem.Option IMASKHLL Disable interrupts while HLL single stepping
Default: OFF. If enabled, the interrupt mask bits of the cpu will be set during HLL single-step operations. The interrupt routine is not executed during single-step operations. After single step the interrupt mask bits are restored to the value before the step.
Format: SYStem.Option ICREAD [ON | OFF]
Format: SYStem.Option IMASKASM [ON | OFF]
Format: SYStem.Option IMASKHLL [ON | OFF]
NOTE: Do not enable this option for code that disables MSR_EE. The debugger will disable MSR_EE while the CPU is running and restore it after the CPU stopped. If a part of the application is executed that disables MSE_EE, the debugger cannot detect this change and will restore MSE_EE.
Qorivva MPC5xxx/SPC5xx Debugger and NEXUS Trace 97 ©1989-2018 Lauterbach GmbH
SYStem.Option KEYCODE Inhibit censorship protection
Use this command to inhibit the censorship protection. The processor will then be unlocked during the next SYStem.Up.
Format: SYStem.Option KEYCODE [<password>]
<password>: <64_bit_serial_password> | <p0> <p1> <p2> <p3> <p4> <p5> <p6> <p7>
(no password) Calling SYStem.Option.KEYCODE without parameters disables the censorship inhibit feature.
<64_bit_serial_password>
For 64-bit password.
<p0> … <p7> MPC57XX/SPC57X/SPC58X: 8x32bit for 256-bit password.If the processor implements a 256-bit password, the password has to be provided in 8x 32-bit chunks. The first chunk is the most significant, i.e. it is the first chunk to be shifted into the inhibit register. The order of the 32-bit values matched the address order in FLASH.
NOTE: • This command only works for processors which implement the censor-ship inhibit via JTAG feature. Please check the reference manual if the processor implements the Censorship Inhibit Register. MPC55XX pro-cessors do not support censorship inhibit via JTAG.
• Devices with C90LC Flash require the upper and lower DWORD exchanged when specified as parameter of SYStem.Option KEYCODE.
• MPC577xK (RaceRunner) only:If no password is set, the debugger automatically unlocks the processor using the public password (0xDEADDEEDFADEBADE)
• Some devices do not support the censorship unlock while power-on reset is asserted. See Censorship Unlock for available workarounds.
Qorivva MPC5xxx/SPC5xx Debugger and NEXUS Trace 98 ©1989-2018 Lauterbach GmbH

SYStem.Option LPMDebug Enable low power mode debug handshake
Format: SYStem.Option LPMDebug <method>
<method>: OFF | HANDSHAKE | PASSIVE | ACTIVE
OFF Low power mode debugging not supported.
At LPM entry the error message “emulation debug port fail” is generated and the communication between the debugger and the processor is lost.
PASSIVE TRACE32 tries to detect low power mode entries and exits without using the LPM handshake provided by the processor.
At LPM entry the communication between the debugger and the processor is lost. The state of the debugger changes to “running(lpm-stop/lpm-sleep)”. At LPM exit the communication between the debugger and the processor is re-established (attach). The breakpoints and the NEXUS settings are lost.
ACTIVE TRACE32 tries to detect low power mode entries and exits without using the LPM handshake provided by the processor.
At LPM entry the communication between the debugger and the processor is lost. The state of the debugger changes to “running(lpm-stop/lpm-sleep)”. At LPM exit the communication between the debugger and the processor is re-established (attach) and the program execution is stopped. The breakpoints and the NEXUS settings are re-established.
HANDSHAKE TRACE32 uses LPM handshake for low power mode debugging. The processor signals LPM entries and exits to the debugger.At LPM exit breakpoints and NEXUS settings are re-established.
Qorivva MPC5xxx/SPC5xx Debugger and NEXUS Trace 99 ©1989-2018 Lauterbach GmbH
SYStem.Option MMUSPACES Enable space IDs
Default: OFF.
NOTE: • Enable this option if the target application makes use of low power modes and a debug port fail occurs when LPM is entered.
• If a handshaked LPM occurs, the debugger will display this state by print-ing “running (lpm-stop/lpm-sleep)” to the status line. If the debugger prints “running (sleep/stop/wait)”, the LPM handshake was not performed (either because not enabled or not initiated by processor).
• The LPM debug handshake is a request - acknowledge system - it has impact on the real-time behavior.
• Please check the processor’s reference manual about how the LPM debug handshake works for your specific device.
• If the processor tristates TDO during LPM, TDO must be pulled HIGH on the target. Recommended: 10k pull-up on TDO. (MPC5510: Use pull-down instead of pull-up)
• During a handshaked low-power mode, it is not possible to break (no JTAG communication possible during LPM)
• In some cases it is not possible to attach to a processor in LPM. The debugger has to assert reset in order to connect. In this case, the debug-ger will print a message to the message AREA window.
• Please check the processor’s device errata if there are any issues with LPM. On some devices, debug and trace settings are lost after LPM exit. On some devices, the LPM debug handshake only works if the NEXUS port is enabled. Some devices can hang at reset when LPM debug hand-shake is enabled.
• MPC5748G, MPC5746C (Calypso): PASS_LCSTAT[CNS] must be zero in order to use the LPM handshake.
Format: SYStem.Option MMUSPACES [ON | OFF]SYStem.Option MMUspaces [ON | OFF] (deprecated)SYStem.Option MMU [ON | OFF] (deprecated)
Qorivva MPC5xxx/SPC5xx Debugger and NEXUS Trace 100 ©1989-2018 Lauterbach GmbH

Enables the use of space IDs for logical addresses to support multiple address spaces.
Examples:
SYStem.Option NexusMemoryCoherency Coherent NEXUS mem-accessMPC5676R and MPC5777C only
If this option is set to ON, the debugger configures the NEXUS run-time memory access to assert the signal p_d_gbl for each access. This signal will cause the Cache Coherency Unit to perform a cache snoop for the run-time memory access, which allows the debugger to update SRAM while maintaining cache coherency.
It is essential to set this option to ON only if the data cache is configured to write-through mode (L1CSR0[DCWM]==1). If the cache is operated in copy-back mode, setting this option to ON can cause undefined behavior.
NOTE: SYStem.Option MMUSPACES should not be used if only one translation table is used on the target.
If a debug session requires space IDs, you must observe the following sequence of steps:
1. Activate SYStem.Option MMUSPACES.
2. Load the symbols with Data.LOAD.
Otherwise, the internal symbol database of TRACE32 may become inconsistent.
;Dump logical address 0xC00208A belonging to memory space with ;space ID 0x012A:Data.dump D:0x012A:0xC00208A
;Dump logical address 0xC00208A belonging to memory space with ;space ID 0x0203:Data.dump D:0x0203:0xC00208A
Format: SYStem.Option NexusMemoryCoherency [ON | OFF]
Qorivva MPC5xxx/SPC5xx Debugger and NEXUS Trace 101 ©1989-2018 Lauterbach GmbH

SYStem.Option.NoDebugStop Disable JTAG stop on debug events
Default: OFF.
On-chip debug events that cause a debug interrupt can be configured to cause one of two actions. If a JTAG debugger is used, the CPU is configured to stop for JTAG upon these debug events.
If this option is set to ON, the CPU will be configured to not stop for JTAG, but to enter the debug interrupt, like it does when no JTAG debugger is used.
Enable this option if the CPU should not stop for JTAG on debug events, in order to allow a target application to use the debug interrupt. Typical usages for this option are run-mode debugging (e.g. with t32server/gdbserver) or setting up the system for a branch trace via LOGGER (trace data in target RAM) or INTEGRATOR.
SYStem.Option.NoJtagRdy Do not evaluate JTAG_RDY signal
The JTAG_RDY pin is an output of the CPU to signal the debugger when memory accesses, done via the NEXUS block, are finished. Memory accesses via the NEXUS block are possible with the NEXUS debugger and trace, but also with the JTAG-only debugger. The existence of the JTAG_RDY signal depends on processor type and package size.
If this option is OFF (default), the debugger will use the JTAG_RDY signal for memory accesses via the NEXUS block. If the option is ON, the debugger will ignore JTAG_RDY signal.
If the used processor type does not provide JTAG_RDY in any package size (e.g. MPX551X), the debugger will automatically set this option. If availability of the signal depends on the package size, or if the signal is available but not connected, use this option to configure the debugger manually.
In Software since October 2007, the debugger will automatically probe the JTAG_RDY pin. On targets without JTAG_RDY signal, the JTAG_RDY pin of the debug connected should be connected to GND. If the JTAG_RDY pin is left unconnected, use SYStem.Option.NOJTAGRDY ON to prevent problems with probing this signal.
Format: SYStem.Option NoDebugStop [ON | OFF]
Format: SYStem.Option NoJtagRdy [ON | OFF]
Qorivva MPC5xxx/SPC5xx Debugger and NEXUS Trace 102 ©1989-2018 Lauterbach GmbH

SYStem.Option NOTRAP Use brkpt instruction for software breakpoints
This system option configures if the TRAP instruction is used for external (JTAG/NEXUS) debug events. By default (OFF) TRAP is enabled as debug event in the (E)DBCR0 register.
Format: SYStem.Option NOTRAP [ON | OFF]
e200z0e200z0He200z0Hn2Pe200z1e200z3e200z335e200z336e200z6e200z750
If ON, the BRKPT instruction is used instead of TRAP. In this case, the freeze timer option is ineffective.
all other cores If ON, TRAP instruction is not treated as debug event. The Debugger always uses the DNH instruction for software breakpoints regardless of this setting.
Qorivva MPC5xxx/SPC5xx Debugger and NEXUS Trace 103 ©1989-2018 Lauterbach GmbH
SYStem.Option OVERLAY Enable overlay support
Default: OFF.
SYStem.Option PC Set fetch address debug actions
The debugger has to set a fetch address while accessing core resources. Per default (parameter AUTO), the debugger places the fetch address into the BAM space. If the BAM is disabled or access protected by the SOC-MPU (core MMU and MPU have no effect), use this command to define an address which the core is allowed to fetch.
When setting a fetch address, make sure that the address does not cause an instruction storage exception, e.g. because of unimplemented memory or ECC errors (e.g. in FLASH or uninitialized SRAM).
Format: SYStem.Option OVERLAY [ON | OFF | WithOVS]
ON Activates the overlay extension and extends the address scheme of the debugger with a 16 bit virtual overlay ID. Addresses therefore have the format <overlay_id>:<address>. This enables the debugger to handle overlaid program memory.
OFF Disables support for code overlays.
WithOVS Like option ON, but also enables support for software breakpoints. This means that TRACE32 writes software breakpoint opcodes both to the execution area (for active overlays) and to the storage area. In this way, it is possible to set breakpoints into inactive overlays. Upon activation of the overlay, the target’s runtime mechanisms copies the breakpoint opcodes to the execution area. For using this option, the storage area must be readable and writable for the debugger.
SYStem.Option OVERLAY ON Data.List 0x2:0x11c4 ; Data.List <overlay_id>:<address>
Format: SYStem.Option PC <address> | AUTO
Qorivva MPC5xxx/SPC5xx Debugger and NEXUS Trace 104 ©1989-2018 Lauterbach GmbH

SYStem.Option RESetBehavior Set behavior when target reset detected
Defines the debugger’s action when a reset is detected. Default setting is ResetHalt. If and how a reset can be detected is set using SYStem.Option ResetDetection. This option is usually used for MPC55XX and some 56XX to restore breakpoints after a reset. Usually not required for MPC57XX/SPC57X and SPC58X.
SYStem.Option ResBreak Halt the core while reset asserted
Default: ON.
Format: SYStem.Option RESetBehavior <mode>
<mode>: DisabledAsyncHaltAsyncStartResetHaltResetStartRESYNC
Disabled No actions to the processor take place when a reset is detected. Information about the reset will be printed to the message AREA.
AsyncHalt Halt core as soon as possible after reset was detected. The core will halt shortly after the reset event.
AsyncStart Halt core as soon as possible after reset was detected. The debugger sets debug and trace configuration registers and afterwards starts the core(s) again.
ResetHalt When a reset is detected, the debugger keeps reset asserted and then halts the core at the reset address.
ResetStart When a reset is detected, the debugger keeps reset asserted and then halts the core at the reset address. The debugger sets debug and trace configuration registers and afterwards starts the core(s) again.
RESYNC When a reset is detected, the debugger waits until reset is released. Once the core is out of reset, the debugger sets debug and trace configuration registers on-the-fly.
Format: SYStem.Option ResBreak [ON | OFF]
Qorivva MPC5xxx/SPC5xx Debugger and NEXUS Trace 105 ©1989-2018 Lauterbach GmbH

If SYStem.Up is called using the default setting SYStem.Option.ResBreak ON, the debugger will assert reset and send a halt command to the core while reset is asserted. If the processor is censored and a password is supplied, the debugger will also unlock the processor while reset is asserted. This method ensures that the debugger can halt the core directly at the reset address.
Some processors of the MPC57XX/SPC57X/SPC58X series have a bug causing the censorship unlock to fail if it is done while reset is asserted. This bug collides with the debugger’s default SYStem.Up sequence. Processors known to have this bug are: MPC574xB/C/D/G (Calypso), MPC5777C (Cobra55), MPC5777M (Matterhorn), SPC58NE (Eiger).
In order to connect to above censored processors, set SYStem.Option.ResBreak to OFF. With this setting, the debugger will assert and release RESET. After a delay defined using SYStem.Option.WaitReset, the debugger will unlock the processor and halt the core. The longer the defined WaitReset time, the more program code is executed until the core can be halted. If the WaitReset time is too short, SYStem.Up will fail.
SYStem.Option ResetDetection Configure reset detection method
Default: OFF. This option configures if the debugger’s reset detection is enabled and if enabled, which signals are used to detect reset.
If reset detection is enabled and a reset is detected, the debugger will perform the action selected with SYStem.Option RESetBehavior.
This feature is important for processors of the MPC55XX/MPC560X/SPC560X series, which clear debug and trace registers upon reset. For newer processors, which don’t clear debug and trace register upon reset, this option can be set to off, unless any other tool connected to the target asserts JCOMP when it detects a target reset. See chapter Debugging and Tracing Through Reset for details.
Processors which require the PCRs to be configured by the debugger for tracing, reset detection has to be enabled in order to enable tracing through reset.
Format: SYStem.Option.ResetDetection <method>SYStem.Option RSTOUT [ON | OFF] (deprecated)
<method>: OFF | RESETPIN | RSTINOUT
<method> Function
OFF Reset detection is disabled.
Qorivva MPC5xxx/SPC5xx Debugger and NEXUS Trace 106 ©1989-2018 Lauterbach GmbH

SYStem.Option ResetMode Select reset mode for SYStem.Up
Default: PIN. Selects the method the debugger uses to reset the processor. Only available for MPC57XX/SPC57X processors with Debug and Calibration Interface (DCI)..
RESETPIN Debugger observes only RSTIN for reset detection.
RSTINOUT Debugger observes RSTIN and RSTOUT for reset detection.Use only:• if Processor has RSTOUT pin• if RSTOUT pin is configured to signal core resets• if RSTOUT pin is connected to debug/trace connector• with following debug/trace modules:
LA-3736 (JTAG Debugger for MPC5xxx Automotive) LA-7630 (NEXUS Debug/Trace for Qorivva MPC5xxx/SPC5xxx)LA-7610 (NEXUS Debugger and Trace for MPC5500)
Format: SYStem.Option.ResetMode <mode>
<mode>: PIN | DESTructive | FUNCtional
<mode> Effect at SYStem.Up
PIN The reset pin is asserted to reset the processor. This can result in either a functional or destructive reset, depending on which reset pin of the processor is connected to the debug / trace connector.This is the only method available for processors without DCI module.
DESTructive The debugger performs a destructive processor reset using the DCI module. The reset pin of the debug/trace connector is asserted as well.
FUNCtional The debugger performs a functional reset using the DCI module. The reset pin of the debug/trace connector is not asserted.
Qorivva MPC5xxx/SPC5xx Debugger and NEXUS Trace 107 ©1989-2018 Lauterbach GmbH
SYStem.Option SLOWRESET Relaxed reset timing
Default: OFF. Set to ON to use a relaxed reset timing for processors with BIST enabled, or when debugger is used with processor emulation systems. Deprecated, use SYStem.Option.HoldReset and SYStem.Option.WaitReset instead.
SYStem.Option STEPSOFT Use alternative method for ASM single step
This method uses software breakpoints to perform an assembler single step instead of the processor’s built-in single step feature. Works only for software in RAM. Do not turn ON unless advised by Lauterbach.
SYStem.Option TDOSELect Select TDO source of lock step core pair
If the processor consists of a lock-step core pair, this option defines, which core’s TDO signal is routed to the TDO pin of the processor. Can be useful for debugging lock-step related application issues. Not available for cores in delayed lock-step. This setting should only be changed before starting the debug session, or at least while the core is running.
SYStem.Option VECTORS Specify interrupt vector table address
Only required for MPC5553 and MPC5554. Not required for other processors.
On MPC5553/4, indirect branch messages do not indicate if the reason was an indirect branch or an interrupt. If the address range of the interrupt vectors are specified by this command, the TRACE32 NEXUS debugger marks all indirect branches to these addresses / the address range as interrupt. This information is needed for correct trace display and run-time statistic analysis.
Format: SYStem.Option SLOWRESET [ON | OFF] (deprecated)
Format: SYStem.Option STEPSOFT [ON | OFF]
Format: SYStem.Option TDOSELect [A | B]
Format: SYStem.Option VECTORS <range> [ | <range> …]
Qorivva MPC5xxx/SPC5xx Debugger and NEXUS Trace 108 ©1989-2018 Lauterbach GmbH

Valid parameters for this command are addresses, address ranges, debug symbols and also ranges of debug symbols. Examples:
single addresses SYStem.Option.VECTORS 0x40002000 0x40002100
address range(2 methods)
SYStem.Option.VECTORS 0x40002000--0x40002FFFSYStem.Option.VECTORS 0x40002000++0x00002FFF
use IVPR/IVOR registers
&startaddr=R(IVPR)&range=DATA.LONG(SPR:415.)SYStem.Option.VECTORS &startaddr++⦥IVPR/IVOR must already be initialized;&range = MAX(IVOR0..IVOR34)
use debug symbols SYStem.Option.VECTORS IVOR0_func IVOR1_func …
use debug symbol range
SYStem.Option.VECTORS IVOR0_fnc--(IVOR15_fnc+3)
Qorivva MPC5xxx/SPC5xx Debugger and NEXUS Trace 109 ©1989-2018 Lauterbach GmbH
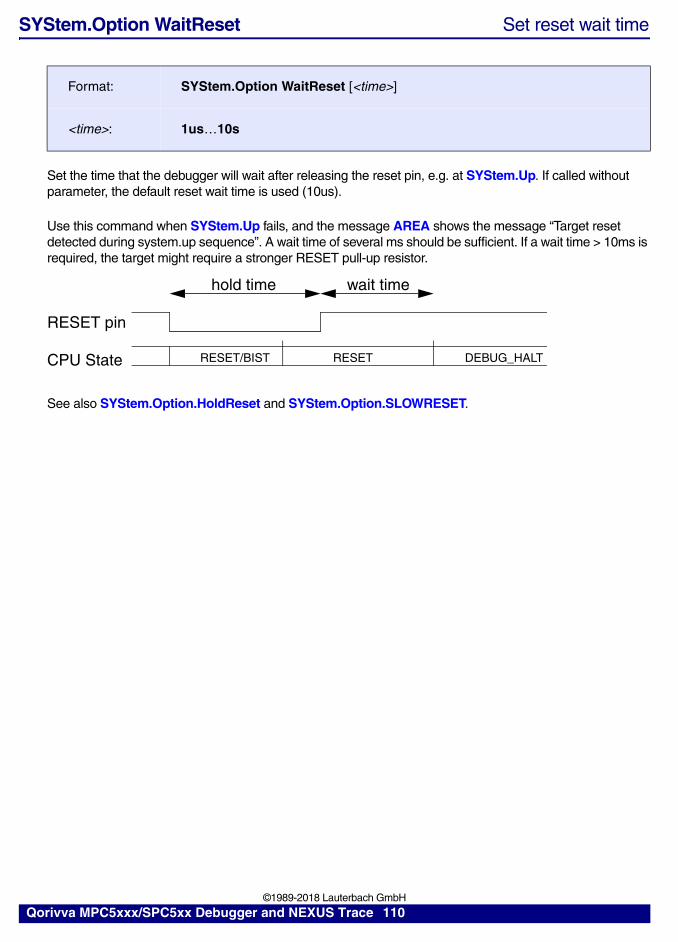
SYStem.Option WaitReset Set reset wait time
Set the time that the debugger will wait after releasing the reset pin, e.g. at SYStem.Up. If called without parameter, the default reset wait time is used (10us).
Use this command when SYStem.Up fails, and the message AREA shows the message “Target reset detected during system.up sequence”. A wait time of several ms should be sufficient. If a wait time > 10ms is required, the target might require a stronger RESET pull-up resistor.
See also SYStem.Option.HoldReset and SYStem.Option.SLOWRESET.
Format: SYStem.Option WaitReset [<time>]
<time>: 1us…10s
RESET pin
hold time wait time
CPU State RESET/BIST RESET DEBUG_HALT
Qorivva MPC5xxx/SPC5xx Debugger and NEXUS Trace 110 ©1989-2018 Lauterbach GmbH

SYStem.Option WATCHDOG Debug with software watchdog timer
Defined how the debugger is handling the on-chip software watchdog timer. Default: OFF.
The table below describes how the debugger is configuring the SWT when SYStem.Option.WATCHDOG ON is used. The configuration takes place any time the CPU stops for the debugger according to the tables below:
MPC56XX, SPC56X, MPC57XX, SPC57X:
Format: SYStem.Option WATCHDOG <method>
<method>: [ON | OFF | PASSIVE]
<method> Function
OFF Default setting. The watchdog timer of the processor will be disabled during SYStem.Up and SYStem.Mode.StandBy. For MPC551x, the debugger will also set the SWCTR_RO (read_only) bit in order to prevent that the watchdog timer is enabled later by the application. For MPC563X and SPC563, the debugger will only clear WEN.If the debugger is connected using SYStem.Mode.Go or SYStem.Mode.Attach, the debugger will try to disable and the watchdog timer as soon as the processor is stopped. If the watchdog is enabled and SWCTR_RO bit is set after SYStem.Mode.Go or SYStem.Mode.Attach, SYStem.Option WATCHDOG OFF cannot be used.
ON The state of the SWT (enabled or disabled) is not changed by the debugger. If possible the debugger will try to configure the SWT so that it does not time out while the processor is halted. See tables below for details.
PASSIVE The debugger does not access (read or write) the SWT registers. The target application must ensure that the SWT does not time out while the core is halted for debugging.
CR[WEN] CR[FRZ] CR[HLK]CR[SLK]
Debugger Action
off don’t care don’t care none
on on don’t care none
on off SLK onHLK off
set FRZ
on off HLK on service watchdog (see note)
Qorivva MPC5xxx/SPC5xx Debugger and NEXUS Trace 111 ©1989-2018 Lauterbach GmbH

MPC551X:
SWE SWRWH RO Debugger Action
off don’t care don’t care none
on off don’t care none
on on off disable SWRWH
on on on service watchdog (see note)
NOTE: All CPUs: servicing watchdogIf the debugger is servicing the watchdog, conditions might occur, where the watchdog times out before the debugger is able to service it. Unintended resets or interrupts can occur.Further, SWT window mode is not supported by the debugger.
MPC5516, revision 0If the system option is ON, the debugger will configure the watchdog to the longest timeout period on SYStem.Up and SYStem.Mode.StandBy. During debugging, the watchdog timer will be serviced if SWE is on.
Qorivva MPC5xxx/SPC5xx Debugger and NEXUS Trace 112 ©1989-2018 Lauterbach GmbH
Command Reference: MMU Commands
MMU.DUMP Page wise display of MMU translation table
Displays the contents of the CPU specific MMU translation table.
• If called without parameters, the complete table will be displayed.
• If the command is called with either an address range or an explicit address, table entries will only be displayed, if their logical address matches with the given parameter.
The optional <root> argument can be used to specify a page table base address deviating from the default page table base address. This allows to display a page table located anywhere in memory.
CPU specific tables:
Format: MMU.DUMP <table> [<range> | <addr> | <range> <root> | <addr> <root>]MMU.<table>.dump (deprecated)
<table>: PageTableKernelPageTableTaskPageTable <magic_number> | <task_id> | <task_name><cpu_specific_tables>
PageTable Display the current MMU translation table entries of the CPU. This command reads all tables the CPU currently uses for MMU translation and displays the table entries.
KernelPageTable Display the MMU translation table of the kernel.If specified with the MMU.FORMAT command, this command reads the MMU translation table of the kernel and displays its table entries.
TaskPageTable <magic_number> | <task_id> | <task_name>
Display the MMU translation table entries of the given process. In MMU based operating systems, each process uses its own MMU translation table. This command reads the table of the specified process, and displays its table entries.See also the appropriate OS awareness manuals: RTOS Debugger for <x>.For information about the parameters, see “What to know about Magic Numbers, Task IDs and Task Names” (general_ref_t.pdf).
TLB1 Displays the contents of TLB1.
TLB2 Displays the contents of TLB2 (MPU).
Qorivva MPC5xxx/SPC5xx Debugger and NEXUS Trace 113 ©1989-2018 Lauterbach GmbH

MMU.List Compact display of MMU translation table
Lists the address translation of the CPU-specific MMU table. If called without address or range parameters, the complete table will be displayed.
If called without a table specifier, this command shows the debugger-internal translation table. See TRANSlation.List.
If the command is called with either an address range or an explicit address, table entries will only be displayed, if their logical address matches with the given parameter.
Format: MMU.List <table> [<range> | <addr> | <range> <root> | <addr> <root>] MMU.<table>.List (deprecated)
<table>: PageTableKernelPageTableTaskPageTable <magic_number> | <task_id> | <task_name> | <space_id>:0x0
<root> The optional <root> argument can be used to specify a page table base address deviating from the default page table base address. This allows to display a page table located anywhere in memory.
PageTable List the current MMU translation of the CPU. This command reads all tables the CPU currently uses for MMU translation and lists the address translation.
KernelPageTable List the MMU translation table of the kernel.If specified with the MMU.FORMAT command, this command reads the MMU translation table of the kernel and lists its address translation.
TaskPageTable <magic_number> | <task_id> | <task_name>
List the MMU translation of the given process. In MMU-based operating systems, each process uses its own MMU translation table. This command reads the table of the specified process, and lists its address translation.See also the appropriate OS awareness manuals: RTOS Debugger for <x>.For information about the parameters, see “What to know about Magic Numbers, Task IDs and Task Names” (general_ref_t.pdf).
Qorivva MPC5xxx/SPC5xx Debugger and NEXUS Trace 114 ©1989-2018 Lauterbach GmbH

MMU.SCAN Load MMU table from CPU
Loads the CPU-specific MMU translation table from the CPU to the debugger-internal translation table. If called without parameters, the complete page table will be loaded. The loaded address translation can be viewed with TRANSlation.List.
If the command is called with either an address range or an explicit address, page table entries will only be loaded if their logical address matches with the given parameter.
Format: MMU.SCAN <table> [<range> <address>]MMU.<table>.SCAN (deprecated)
<table>: PageTableKernelPageTableTaskPageTable <magic_number> | <task_id> | <task_name>ALL<cpu_specific_tables>
PageTable Load the current MMU address translation of the CPU. This command reads all tables the CPU currently uses for MMU translation, and copies the address translation into the debugger-internal translation table.
KernelPageTable Load the MMU translation table of the kernel.If specified with the MMU.FORMAT command, this command reads the table of the kernel and copies its address translation into the debugger-internal translation table.
TaskPageTable <magic_number> | <task_id> | <task_name>
Load the MMU address translation of the given process. In MMU-based operating systems, each process uses its own MMU translation table. This command reads the table of the specified process, and copies its address translation into the debugger-internal translation table.See also the appropriate OS awareness manual: RTOS Debugger for <x>.For information about the parameters, see “What to know about Magic Numbers, Task IDs and Task Names” (general_ref_t.pdf).
ALL Load all known MMU address translations. This command reads the OS kernel MMU table and the MMU tables of all processes and copies the complete address translation into the debugger-internal translation table. See also the appropriate OS awareness manual: RTOS Debugger for <x>.
Qorivva MPC5xxx/SPC5xx Debugger and NEXUS Trace 115 ©1989-2018 Lauterbach GmbH

CPU specific tables:
Use this command to make the translation information available for the debugger even when the program execution is running and the debugger has no access to the TLBs. This is required for the real-time memory access (See also SYStem.MemAccess and SYStem.Option DUALPORT). Use the command TRANSlation.ON to enable the debugger internal MMU table.
MMU.Set Set an MMU TLB entry
Sets the specified MMU TLB table entry in the CPU. The parameter <tlb> is not available for CPUs with only one TLB table.
TLB1 Loads the TLB1 from the CPU to the debugger internal translation table.
TLB2 Loads the TLB2 (MPU) from the CPU to the debugger internal translation table. Usually not necessary.
Formats: MMU.Set TLB1 <index> <mas1> <mas2> <mas3>MMU.Set TLB2 <index> <mas0> <mas1> <mas2>MMU.<table>.SET (deprecated)
<index> TLB entry index. From 0 to (number of TLB entries)-1 of the specified TLB table
<mas0><mas1><mas2><mas3>
Values corresponding to the values that would be written to the MAS registers in order to set a TLB (or MPU) entry. See the processor’s reference manual for details on MAS registers.For processors with a core MPU (MPC57XX/SPC57X series), use TLB2 to generate an MPU entry).
Qorivva MPC5xxx/SPC5xx Debugger and NEXUS Trace 116 ©1989-2018 Lauterbach GmbH

Command Reference: BenchMarkCounter
The BenchMarkCounter features are based on the core’s performance monitor, accessed through the performance monitor registers (PMR).
TRACE32 displays the benchmark counter results in the BMC.state window:
For information about architecture-independent BMC commands, refer to “BMC” (general_ref_b.pdf).
For information about architecture-specific BMC commands, see command descriptions below.
BMC.<counter>.ATOB Enable event triggered counter start and stop
Enables event triggered counter start/stop. The events are defines using ALPHA and BETA breakpoints set with Break.Set. Every time the Alpha breakpoint condition triggers, the counter is started. The counter stops when the Beta breakpoint condition is triggered.
NOTE: • These cores do not implement PMRs: e200z0, e200z1, e200z3, e200z4, e200z6 and e200z750.
• These cores only provide PMR access while the core is halted: e200z759, e200z760.
• For a list and description of events that can be assigned to BMC.<coun-ter>.EVENT <event>, please see the Freescale e200z core reference man-uals.
• In addition to the core defined events, TRACE32 provides events ALPHA ... ECHO to count watchpoints set with Break.Set.
Format: BMC.<counter>.ATOB [ON | OFF]
Qorivva MPC5xxx/SPC5xx Debugger and NEXUS Trace 117 ©1989-2018 Lauterbach GmbH

Example 1: Measure average processor cycles it takes from function sieve entry to exit. This measurement includes all interrupts, sub-function calls etc.
;Measure average cycles to execute unction sieve BMC.RESet Break.Delete
;set up counter start / stop events Break.Set sYmbol.BEGIN(sieve) /Program /Onchip /Alpha Break.Set sYmbol.EXIT(sieve) /Program /Onchip /Beta
;set up CNT0 to count processor cycles (using start/stop event) BMC.CNT0.EVENT PROC-CYC BMC.CNT0.ATOB ON
;set up CNT2 to count function entries BMC.CNT2.EVENT ALPHA
;run measurement (for 10 seconds) BMC.Init Go Wait 10s Break
PRINT FORMAT.DECIMAL(1.,BMC.COUNTER(0)/BMC.COUNTER(2))+" cycles"
Qorivva MPC5xxx/SPC5xx Debugger and NEXUS Trace 118 ©1989-2018 Lauterbach GmbH
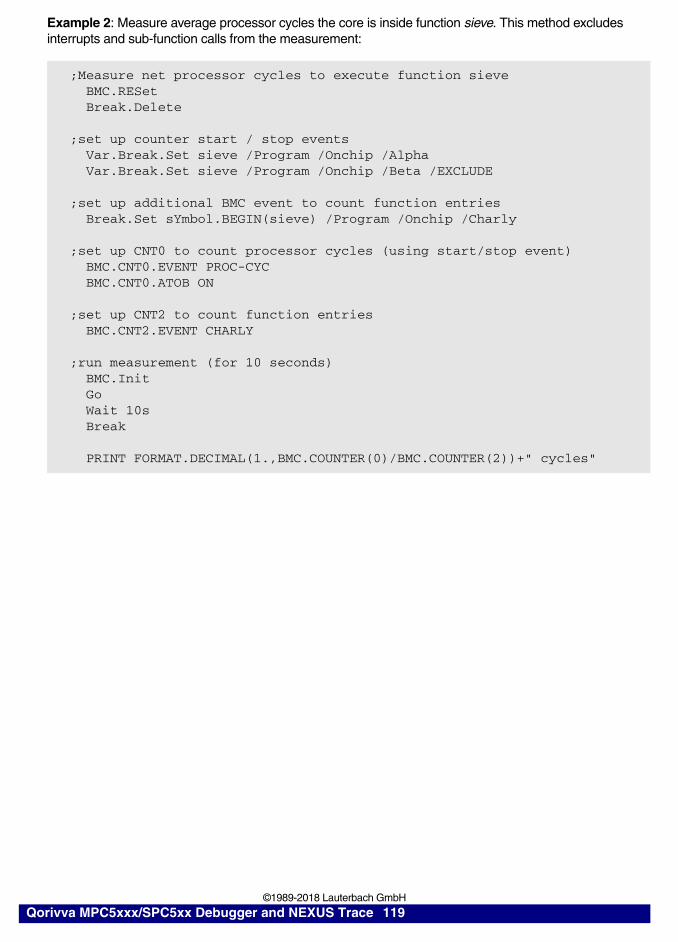
Example 2: Measure average processor cycles the core is inside function sieve. This method excludes interrupts and sub-function calls from the measurement:
;Measure net processor cycles to execute function sieve BMC.RESet Break.Delete
;set up counter start / stop events Var.Break.Set sieve /Program /Onchip /Alpha Var.Break.Set sieve /Program /Onchip /Beta /EXCLUDE
;set up additional BMC event to count function entries Break.Set sYmbol.BEGIN(sieve) /Program /Onchip /Charly
;set up CNT0 to count processor cycles (using start/stop event) BMC.CNT0.EVENT PROC-CYC BMC.CNT0.ATOB ON
;set up CNT2 to count function entries BMC.CNT2.EVENT CHARLY
;run measurement (for 10 seconds) BMC.Init Go Wait 10s Break
PRINT FORMAT.DECIMAL(1.,BMC.COUNTER(0)/BMC.COUNTER(2))+" cycles"
Qorivva MPC5xxx/SPC5xx Debugger and NEXUS Trace 119 ©1989-2018 Lauterbach GmbH

Example 3: Measure instructions per processor cycle for a specific task on an RTOS:
BMC.<counter>.FREEZE Freeze counter in certain core states
Halts the selected performance counter if one or more of the enabled states (i.e. states set to ON) match the current state of the core. If contradicting states are enabled (e.g. SUPERVISOR and USER), the counter will be permanently frozen. The table below explains the meaning of the individual states.
;Measure instructions per clock for task my_task BMC.RESet Break.Delete
;set up counter start / stop events &magic=TASK.MAGIC("my_task") ;get magic value for the task of interest Break.Set task.config(magic) /Write /Onchip /Data &magic /Alpha Break.Set task.config(magic) /Write /Onchip /Data !&magic /Beta
;set up CNT0 to count processor cycles (using start/stop event) BMC.CNT0.EVENT PROC-CYC BMC.CNT0.ATOB ON
;set up CNT1 to count instructions executed (using start/stop event) BMC.CNT1.EVENT INST-CMP BMC.CNT1.ATOB ON
;set up ratio for BMC.state window display BMC.CNT1.RATIO X/CNT0 BMC.state
;run measurement (for 10 second) BMC.Init Go Wait 10s Break
PRINT FORMAT.FLOAT(5.,2.,1.0*BMC.COUNTER(1)/BMC.COUNTER(0))+" IPC"
Format: BMC.<counter>.FREEZE <state> [ON | OFF]
<state>: USER | SUPERVISOR | MASKSET | MASKCLEAR
<state> Dependency in core
USER Counter frozen if MSR[PR]==1
SUPERVISOR Counter frozen if MSR[PR]==0
Qorivva MPC5xxx/SPC5xx Debugger and NEXUS Trace 120 ©1989-2018 Lauterbach GmbH

BMC.FREEZE Freeze counters while core halted
On MPC5XXX, the core performance counters automatically stop when a core enters debug mode. Therefore this command has no effect.
BMC.SnoopSet Assign event counter to TRACE32 ‘SnooperTrace’
The TRACE32 SNOOPer Trace can be used to record the event counters periodically, if the target system allows to read the event counters while the program execution is running.
TRACE32 provides various ways to analyze the recorded information.
Example for the pure JTAG debugger.
MASKSET Counter frozen if MSR[PMM]==1
MASKCLEAR Counter frozen if MSR[PMM]==0
Format: BMC.FREEZE [ON | OFF]
Format: BMC.SnoopSet [ON | OFF]
BMC.state ; display the BMC Configuration; window
BMC.<counter1> <event1> ; assign event of interest to ; the event counter
;BMC.<counter2> <event2>…
; several assignments possible
BMC.SnoopSet ON ; configure the TRACE32 SNOOPer; Trace for event counter recording
SNOOPer.state ; display the SNOOPer Trace; Configuration window to inspect ; the setup
Go ; start the program execution to ; fill the SNOOPer trace
Qorivva MPC5xxx/SPC5xx Debugger and NEXUS Trace 121 ©1989-2018 Lauterbach GmbH

Example on combining an event counter recording with an instruction flow trace recording.
Break ; stop the program execution
SNOOPer.List ; display a SNOOPer trace listing
; please pay attention to the ; ti.back time, it informs you on ; the SNOOPer sampling rate
SNOOPer.PROfileChart.COUNTER ; display a profile statistic
BMC.state ; display the BMC Configuration; window
BMC.<counter1> <event1> ; assign event of interest to ; event counter
; only one event counter possible
BMC.SnoopSet ON ; configure the TRACE32 SNOOPer; Trace for event counter recording
SNOOPer.state ; display the SNOOPer Trace; Configuration window to inspect ; the setup
Qorivva MPC5xxx/SPC5xx Debugger and NEXUS Trace 122 ©1989-2018 Lauterbach GmbH

SNOOPer.SIZE 500000. ; adjust the size of the SNOOPER; Trace
; the SNOOPer Trace and the Trace ; recording the instruction flow ; should get full nearly at the; same point in time
; initialize all units involved whenever the program execution is; started, this avoids invalid combinations
Trace.AutoInit ON ; initialize the Trace recording; the instruction flow
SNOOPer.AutoInit ON ; initialize the SNOOPER Trace
BMC.AutoInit ON ; initialize the event counter
Go ; start the program execution to ; fill the SNOOPer trace
Break ; stop the program execution
SNOOPer.List ; display a SNOOPer trace listing
; please pay attention to the ; ti.back time, it informs you on ; the SNOOPer sampling rate
BMC.SELect <counter1> ; select <counter1> for the; statistic evaluation
BMC.STATistic.sYmbol ; assign the recorded events to the; recorded functions/symbol ranges
Qorivva MPC5xxx/SPC5xx Debugger and NEXUS Trace 123 ©1989-2018 Lauterbach GmbH

Command Reference: TrOnchip
TrOnchip.CONVert Adjust range breakpoint in on-chip resource
There are 2 data address breakpoints. These breakpoints can be used to mark two single data addresses or one data address range.
Format: TrOnchip.CONVert [ON | OFF]
ON (default) After a data address breakpoint is set to an address range all on-chip breakpoints are spent. As soon as a new data address breakpoint is set the data address breakpoint to the address range is converted to a single data address breakpoint. Please be aware, that the breakpoint is still listed as a range breakpoint in the Break.List window. Use the Data.View command to verify the set data address breakpoints.
OFF An error message is displayed when the user wants to set a new data address breakpoint after all on-chip breakpoints are spent by a data address breakpoint to an address range.
TrOnchip.CONVert ONBreak.Set 0x6020++0x1fBreak.Set 0x7400++0x3fData.View 0x6020Data.View 0x7400
Qorivva MPC5xxx/SPC5xx Debugger and NEXUS Trace 124 ©1989-2018 Lauterbach GmbH

TrOnchip.EDBRAC0 Assign debug events to target software
Use this command to assign which debug resources are reserved for debugger use and which resources should be used by the by the target application. On MPC56XX/SPC56XX, the assignment is done using the DBERC0 register, but on MPC57XX/SPC57XX the functionality was moved to EDBRAC0.
See core reference manual for the EDBRAC0/DBERC0 bit definitions.
Format: TrOnchip.EDBRAC0 <value>TrOnchip.DBERC0 <value>
<value> Value written to EDBRAC0 or DBERC0 register. Default: 0x00000008
Qorivva MPC5xxx/SPC5xx Debugger and NEXUS Trace 125 ©1989-2018 Lauterbach GmbH

TrOnchip.EVTEN Enable EVTI and EVTO pins
When enabled, the processor is configured to enable the EVTI/EVTO pins. If disabled, that pins can be used for GPIO. (Default: ON)
Format: TrOnchip.EVTEN [ON | OFF]
NOTE: • This option sets the EVT_EN bit in the NPC_PCR register. It is not avail-able on all processor. Please check the processor reference manual for availability.
• On MPC551X, set this option to OFF when the EVTx pins are used for the EBI (External Bus Interface).
• If the EVTx pins are not used for EVTI/EVTO, they should be discon-nected from the debug/trace connector to avoid additional load, signal reflections etc.
• LA-7610 and LA-7612 only: If the EVTx pins are not used for EVTI/EVTO, they must not be connected to the debug/trace connector.
• LA-7630: EVTI pin is tristated when TrOnchip.EVTEN is OFF.
Qorivva MPC5xxx/SPC5xx Debugger and NEXUS Trace 126 ©1989-2018 Lauterbach GmbH

TrOnchip.RESet Reset on-chip trigger settings
Resets the on-chip trigger system to the default state.
TrOnchip.Set Enable special on-chip breakpoints
Enables the specified on-chip trigger facility to stop the core on below events. Default is OFF unless specified otherwise.
Format: TrOnchip.RESet
Format: TrOnchip.Set <event> [ON | OFF]
<event>: BRT | IRPT | RET | CIRPT | CRET | BKPT
<event> Break events, see below.
BRT Branch taken.
IRPTRET
Interrupt entry.Return from interrupt.
CIRPTCRET
Critical interrupt entry.Critical interrupt return.
BKPT(Default: ON)
Execution of the BKPT pseudo-opcode. Please note that this opcode represents the software breakpoint for e200z750, e200z6, e200z3, e200z1 and e200z0Hn2 cores when operated in VLE mode.
Qorivva MPC5xxx/SPC5xx Debugger and NEXUS Trace 127 ©1989-2018 Lauterbach GmbH

TrOnchip.VarCONVert Set single address breakpoint for scalar
Default: ON.
Format: TrOnchip.VarCONVert [ON | OFF]
OFF If a breakpoint is set to a scalar variable (int, float, double) breakpoints are set to all memory addresses that store the variable value.
+ The program execution stops also on any unintentional accesses to the variable’s address space.- Requires two onchip breakpoints since a range breakpoint is used.
ON If a breakpoint is set to a scalar variable (int, float, double) the breakpoint is set to the start address of the variable.+ Requires only one single address breakpoint.- Program will not stop on unintentional accesses to the variable’s address space.
TrOnchip.VarCONVert ONVar.Break.Set vint /WriteData.View vint
TrOnchip.VarCONVert OFFVar.Break.Set vint /WriteData.View vint
Qorivva MPC5xxx/SPC5xx Debugger and NEXUS Trace 128 ©1989-2018 Lauterbach GmbH

TrOnchip.state View on-chip trigger setup window
Displays the TrOnchip.state window for on-chip trigger setup.
Different commands are available in the TrOnchip.state window, depending on the Lauterbach hardware used:
Format: TrOnchip.state
Debugger cable LA-3736 (AUTO26 pinout) NEXUS adapter LA-7610/12/30
Debugger cable LA-7753 (JTAG/OnCE pinout)
Qorivva MPC5xxx/SPC5xx Debugger and NEXUS Trace 129 ©1989-2018 Lauterbach GmbH

Command Reference: Onchip
Onchip.TBARange Set on-chip trace buffer address range
Sets the address space and size of the on-chip NEXUS trace buffer. This setting depends on the target processor in use. See MPC57XX/SPC57X on-chip trace for details about possible address ranges.
Example for MPC5777M: automatic trace setup depending on connected debug tool and processor:
Format: Onchip.TBARange <access>:<range>
<access>: AEEC
A Default address space, e.g. production device.
EEC Address space of emulation device trace buffer.
<range> Address range of trace buffer, e.g. 0xD000000--0xD003FFF
SYStem.DEECT CPUIF CHIP.EmulationDevice()( IF POWERTRACE()&&!POWERNEXUS() ( ;use AURORA Nexus trace &all NEXUS.PortSize 4Lane &all NEXUS.PortMode 1250Mbps &all NEXUS.RefClock ON &all Trace.Method Analyzer ) ELSE ( ;use on-chip trace buffer of buddy die Onchip.TBARange EEC:0x0C000000--0x0C1FFFFF &all Trace.Method Onchip ))ELSE( ;use on-chip trace buffer of production device Onchip.TBARange A:0x0D000000--0x0D003FFF &all Trace.Method Onchip)
Qorivva MPC5xxx/SPC5xx Debugger and NEXUS Trace 130 ©1989-2018 Lauterbach GmbH

Command Reference: NEXUS
NEXUS.BTM Enable program trace messaging
Control for NEXUS program trace messaging.
NEXUS.CLIENT<x>.BUSSEL Set NXMC target RAM
MPC574xG only. Select the target RAM for which the NXMC should generate messages.
NEXUS.CLIENT<x>.MODE Set data trace mode of nexus client
Sets the data trace mode of the selected trace client. Select the trace client using NEXUS.CLIENT<x>.SELECT before setting the trace mode.
Format: NEXUS.BTM [ON | OFF] SYStem.Option BTM [ON | OFF] (deprecated)
ON (default) Program trace messaging enabled.
OFF Program trace messaging disabled.
Format: NEXUS.CLIENT1.BUSSEL [PRAM0 | PRAM1 | PRAM2]
Format: NEXUS.CLIENT1.MODE [Read | Write | ReadWrite | OFF]NEXUS.CLIENT2.MODE [Read | Write | ReadWrite | OFF]NEXUS.CLIENT3.MODE [Read | Write | ReadWrite | OFF]
Qorivva MPC5xxx/SPC5xx Debugger and NEXUS Trace 131 ©1989-2018 Lauterbach GmbH

NEXUS.CLIENT<x>.SELECT Select a nexus client for data tracing
Select the trace client for data tracing. For processors with dedicated trace clients (e.g. MPC5554), any trace client can be assigned to any CLIENT field.
For processors with SRAM port sniffers (e.g. MPC564xL), the port sniffers are fix assigned to CLIENT fields (NXSS0 -> CLIENT1, NXSS1 -> CLIENT2) and <client> configures the source selector of the SRAM port sniffer.
NEXUS.CLIENT3.SPTACQMASTER Trace individual SPT masters
MPC577xK only. If set to OFF (default), the processor sends messages if all SPT acquisition accesses. If set to a specific master ID, only the ID of this master is traced.
NEXUS.CoreENable Enable core tracing for dedicated cores in SMP
Core tracing is enabled for all core of an SMP system by default. The command NEXUS.CoreENable allows to enable core tracing for only the logical cores specified.
The Core pulldown of the TRACE32 state line shows you the list of logical cores that form the SMP system.
Format: NEXUS.CLIENT1.SELECT <client>NEXUS.CLIENT2.SELECT <client>NEXUS.CLIENT3.SELECT <client>
<client>: (dedicated trace clients, e.g. MPC5554, MPC5674F)DMA_0 | DMA_1 | FLEXRAY
(source selector for SRAM port sniffers, e.g. MPC564xL, MPC567xK)ALL | CORE | NEXCORE | DMA_0 | DMA_1
Format: NEXUS.CLIENT3.SPTACQMASTER OFF | <master_id>
Format: NEXUS.CoreENable {<logical_core>}
NEXUS.CoreENable 1. ; Enable core tracing only for; the logical core 1. of the SMP; system
Qorivva MPC5xxx/SPC5xx Debugger and NEXUS Trace 132 ©1989-2018 Lauterbach GmbH
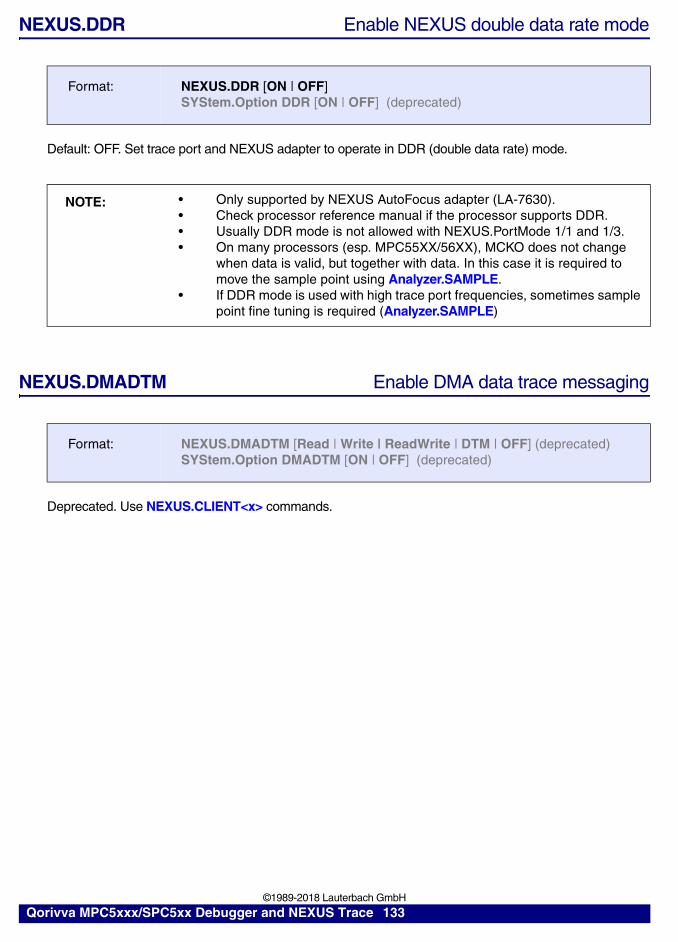
NEXUS.DDR Enable NEXUS double data rate mode
Default: OFF. Set trace port and NEXUS adapter to operate in DDR (double data rate) mode.
NEXUS.DMADTM Enable DMA data trace messaging
Deprecated. Use NEXUS.CLIENT<x> commands.
Format: NEXUS.DDR [ON | OFF] SYStem.Option DDR [ON | OFF] (deprecated)
NOTE: • Only supported by NEXUS AutoFocus adapter (LA-7630).• Check processor reference manual if the processor supports DDR.• Usually DDR mode is not allowed with NEXUS.PortMode 1/1 and 1/3.• On many processors (esp. MPC55XX/56XX), MCKO does not change
when data is valid, but together with data. In this case it is required to move the sample point using Analyzer.SAMPLE.
• If DDR mode is used with high trace port frequencies, sometimes sample point fine tuning is required (Analyzer.SAMPLE)
Format: NEXUS.DMADTM [Read | Write | ReadWrite | DTM | OFF] (deprecated)SYStem.Option DMADTM [ON | OFF] (deprecated)
Qorivva MPC5xxx/SPC5xx Debugger and NEXUS Trace 133 ©1989-2018 Lauterbach GmbH

NEXUS.DTM Enable data trace messaging
Controls the Data Trace Messaging method.
NEXUS.DTMARK Data trace mark
Controls the influence of MSR[PMM] in data trace messaging. Only available on processors which implement IEEE-ISTO 5001-2008 or later.
Format: NEXUS.DTM <mode>SYStem.Option DTM [Read | Write | ReadWrite | OFF] (deprecated)
<mode>: OFF | Read | Write | ReadWrite | IFETCHReadLimited | WriteLimited | ReadWriteLimited
OFF Data trace messaging disabled (default)
ReadWriteReadWrite
Data trace messages for read accesses (load instructions)Data trace messages for write accesses (store instructions)Data trace messages for read and write accesses (load and store instructions)
ReadLimitedWriteLimitedReadWriteLimited
Same as above, but excluding data accesses using GPR R1 in effective address computations.NOTE: Only supported by MPC57XX and newer processors.
IFETCH Data trace messages contain information about instruction fetches
Format: NEXUS.DTMARK [ON | OFF]
OFF Ignore MSR[PMM] for masking data trace messages (default)
ON Mask (disable) data trace messages when MSR[PMM] = 0, unmask (enable) data trace messages when MSR[PMM] = 1
Qorivva MPC5xxx/SPC5xx Debugger and NEXUS Trace 134 ©1989-2018 Lauterbach GmbH
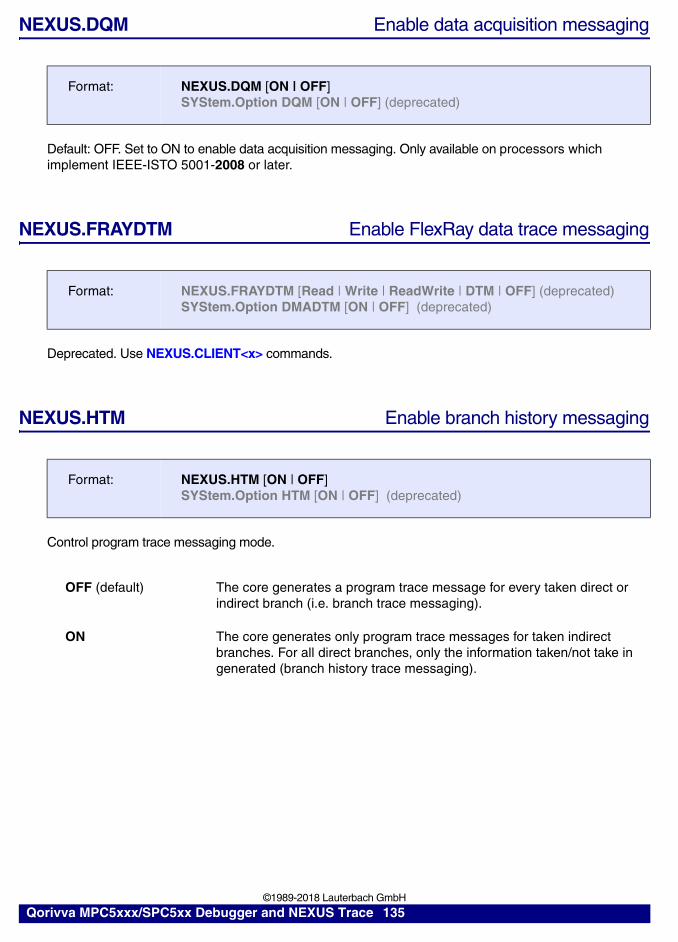
NEXUS.DQM Enable data acquisition messaging
Default: OFF. Set to ON to enable data acquisition messaging. Only available on processors which implement IEEE-ISTO 5001-2008 or later.
NEXUS.FRAYDTM Enable FlexRay data trace messaging
Deprecated. Use NEXUS.CLIENT<x> commands.
NEXUS.HTM Enable branch history messaging
Control program trace messaging mode.
Format: NEXUS.DQM [ON | OFF]SYStem.Option DQM [ON | OFF] (deprecated)
Format: NEXUS.FRAYDTM [Read | Write | ReadWrite | DTM | OFF] (deprecated)SYStem.Option DMADTM [ON | OFF] (deprecated)
Format: NEXUS.HTM [ON | OFF] SYStem.Option HTM [ON | OFF] (deprecated)
OFF (default) The core generates a program trace message for every taken direct or indirect branch (i.e. branch trace messaging).
ON The core generates only program trace messages for taken indirect branches. For all direct branches, only the information taken/not take in generated (branch history trace messaging).
Qorivva MPC5xxx/SPC5xx Debugger and NEXUS Trace 135 ©1989-2018 Lauterbach GmbH

HTM can reduce the amount of program trace messages to about 10% of the classical branch trace messaging. Use this option to increase trace recording time or to prevent overflows of the on-chip nexus message fifo.
NEXUS.OFF Switch the NEXUS trace port off
If the debugger is used stand-alone, the trace port is disabled by the debugger.
If the debugger is used together with a calibration tool (SYStem.Option.ETK / SYStem.Option.GSI), any writes to trace registers (by the debugger) are suppressed. Use this setting if the calibration tool makes use of the data trace (e.g. XETK-V2 in data trace configuration). The debugger will continue to record the trace as a slave (i.e. trace configuration is exclusively done by calibration tool).
NEXUS.ON Switch the NEXUS trace port on
The NEXUS trace port is switched on. All trace registers are configured by debugger. Do not use if calibration tool makes use of data trace (e.g. XETK-V2 in data trace configuration).
NOTE: The debugger can reconstruct the full program flow with BTM as well as when using HTM. The only drawback of HTM is that runtime statistic results will be less accurate because of the lower amount of messages (fewer messages and therefore fewer timestamps per instruction). To some degree, the longer recording time will compensate the loss of accuracy.When supported by the processor, enable program trace correlation messages at branch-and-link occurrence (NEXUS.PTCM.BL_HTM ON) together with HTM. Doing so will achieve the same accuracy as BTM for run-time measurements on function level.
Format: NEXUS.OFF
Format: NEXUS.ON
Qorivva MPC5xxx/SPC5xx Debugger and NEXUS Trace 136 ©1989-2018 Lauterbach GmbH

NEXUS.OTM Enable ownership trace messaging
Controls ownership trace messaging.
NEXUS.PCRCONFIG Configure NEXUS PCR for tracing
When enabled, the debugger configures the pads of MCKO, MDO and MSEO to NEXUS function. This command is only implemented for MPC560xS / SPC560S (Spectrum) and SPC56AP60.
Format: NEXUS.OTM [ON | PID0 | NPIDR | OFF] SYStem.Option OTM [ON | OFF] (deprecated)
OFF Ownership trace messaging disabled (default)
ONPID0
Enable ownership trace messaging. An OTM is generated if the application writes to the PID0 register.
NPIDR Enable ownership trace messaging. An OTM is generated if the application writes to the NPIDR register.
NOTE: • Enable ownership trace messaging in order to get trace information about task switches. Some operating systems use a set of OTMs to transfer task switch information to the trace tool. In this case periodic ownership trace must be disabled using NEXUS.POTD ON.
• If program trace messaging is enabled (NEXUS.BTM ON) and NEXUS.PTCM.PID_MSR is ON, the core sends program trace correlation massages instead of ownership trace messages. The ownership data source (PID0/NIPDR) is nevertheless determined by the NEXUS.OTM setting.
Format: NEXUS.PCRCONFIG [ON | OFF]
Qorivva MPC5xxx/SPC5xx Debugger and NEXUS Trace 137 ©1989-2018 Lauterbach GmbH

NEXUS.PINCR Define DCI PINCR register value
When this command is called with a value, the specified value is written to the DCI_PINCR register every time the debugger connects to the processor (SYStem.Up, Attach, Go, StandBy). The meaning of the individual bits, and the existence of this register in general, depends on the target processor.
Example for SPC570S:
NEXUS.PortMode Set NEXUS trace port frequency
Sets the NEXUS trace port frequency. For parallel NEXUS, the setting is the system clock divider. For Aurora NEXUS, the setting is a fixed bit clock which is independent of the system frequency.
Format: NEXUS.PINCRNEXUS.PINCR <value>
SYStem.CPU SC570S50 ; select CPU
NEXUS.PortSize MDO4NEXUS.PINCR 0x01492492
; set trace port size to 4 MDOs; map all trace pins to port "B"
SYStem.Up ; reset processor and halt core
Format: NEXUS.PortMode <mode>SYStem.Option.MCKO <mode> (deprecated)
<mode>: Parallel NEXUS: 1/1 | 1/2 | 1/3 | 1/4 | 1/8
Aurora NEXUS:625MBPS | 750MBPS | 850MBPS | 1000MBPS | 1250MBPS | 1500MBPS | 1700MBPS | 2000MBPS | 2500MBPS | 3000MBPS | 3125MBPS
NOTES: Parallel NEXUS: The settings 1/1 and 1/3 is not supported by all processors. Check the processor reference manual if this is a valid mode for your processor.
Parallel NEXUS: Please check in the processor’s data sheet if the NEXUS trace port of your processor is functional at the selected system frequency and MCKO divider. Current silicon versions allow trace port frequencies up to 60~80 MHz.
Qorivva MPC5xxx/SPC5xx Debugger and NEXUS Trace 138 ©1989-2018 Lauterbach GmbH
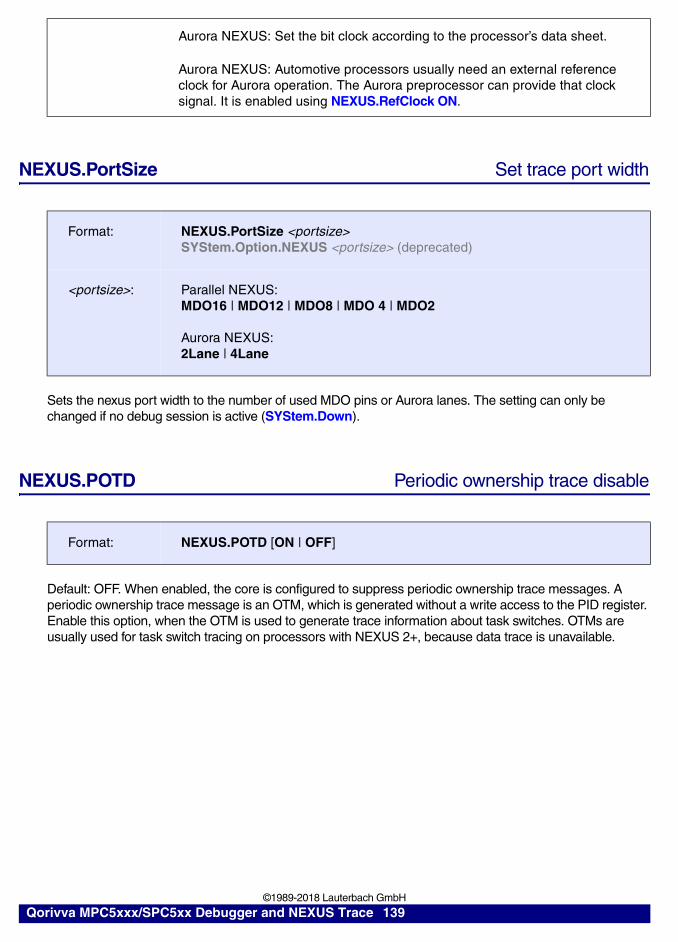
NEXUS.PortSize Set trace port width
Sets the nexus port width to the number of used MDO pins or Aurora lanes. The setting can only be changed if no debug session is active (SYStem.Down).
NEXUS.POTD Periodic ownership trace disable
Default: OFF. When enabled, the core is configured to suppress periodic ownership trace messages. A periodic ownership trace message is an OTM, which is generated without a write access to the PID register. Enable this option, when the OTM is used to generate trace information about task switches. OTMs are usually used for task switch tracing on processors with NEXUS 2+, because data trace is unavailable.
Aurora NEXUS: Set the bit clock according to the processor’s data sheet.
Aurora NEXUS: Automotive processors usually need an external reference clock for Aurora operation. The Aurora preprocessor can provide that clock signal. It is enabled using NEXUS.RefClock ON.
Format: NEXUS.PortSize <portsize>SYStem.Option.NEXUS <portsize> (deprecated)
<portsize>: Parallel NEXUS: MDO16 | MDO12 | MDO8 | MDO 4 | MDO2
Aurora NEXUS:2Lane | 4Lane
Format: NEXUS.POTD [ON | OFF]
Qorivva MPC5xxx/SPC5xx Debugger and NEXUS Trace 139 ©1989-2018 Lauterbach GmbH

NEXUS.PTCM Enable program trace correlation messages
Enables a program trace correlation message (PTCM) for the specified event. This program trace correlation messages are not needed to reconstruct the program flow, but give additional information which can increase precision of statistic measurements.
NEXUS.PTMARK Program trace mark
Controls the influence of MSR[PMM] in program trace messaging. Only available on processors which implement IEEE-ISTO 5001-2008 or later.
Format: NEXUS.PTCM.<event> [ON | OFF]
<event>: PID_MSR | BL_HTM | TLBNEW | TLBINV
PID_MSR Core generates PTCM when PID or MSR[IS] changes (EVCODE 0x5).
BL_HTM Core generates PTCM on Branch and Link occurrence (EVCODE 0xA).Enable this PTCM to improve function profiling in branch history tracing mode.
TLBNEW Core generates PTCM on new address translation - (EVCODE 0xB).
TLBINV Core generates PTCM on address translation invalidated - (EVCODE 0xC).
Format: NEXUS.PTMARK [ON | OFF]
OFF Ignore MSR[PMM] for masking program trace messages (default)
ON Mask (disable) program trace messages when MSR[PMM] = 0, unmask (enable) program trace messages when MSR[PMM] = 1
Qorivva MPC5xxx/SPC5xx Debugger and NEXUS Trace 140 ©1989-2018 Lauterbach GmbH
NEXUS.RefClock Enable Aurora reference clock
Aurora NEXUS only. When set to ON, the preprocessor provides the reference clock for the Aurora NEXUS block on the processor. Only enable when the processor requires this reference clock and when no module provides the Aurora clock source for the processor.
NEXUS.Register Display NEXUS trace control registers
This command opens a window which shows the NEXUS configuration and status registers of NPC, core and other trace clients.
NEXUS.RESet Reset NEXUS trace port settings
Resets NEXUS trace port settings to default settings.
NEXUS.SmartTrace Enable smart trace analysis
SmartTrace is a feature to reconstruct trace information that has been lost due to an on-chip NEXUS FIFO overflow. As the trace information during the fifo overflow is not available for analysis, there is no guarantee that the trace information generated by SmartTrace matches the actual executed code.
Format: NEXUS.RefClock [ON | OFF]
Format: NEXUS.Register
Format: NEXUS.RESet
Format: NEXUS.SmartTrace [ON | OFF] SYStem.Option.SmartTrace [ON | OFF] (deprecated)
Qorivva MPC5xxx/SPC5xx Debugger and NEXUS Trace 141 ©1989-2018 Lauterbach GmbH

NEXUS.Spen<messagetype> Enable message suppression
Configures the core to suppress one or more message types (WTM, PTM, DTM and OTM) when the on-chip NEXUS message FIFO reaches a certain fill level. Enabling one of these options will in most cases cause problems in trace analysis, because the trace message stream contains no information about if and when messages have been suppressed. The fill level at which message suppression occurs can be configured via the command NEXUS.SupprTHReshold.
NEXUS.STALL Stall the program execution when FIFO full
Stall the program execution whenever the on-chip NEXUS-FIFO threatens to overflow. If this option is enabled, the NEXUS port controller will stop the core’s execution pipeline until all messaged in the on-chip NEXUS FIFO are sent. Enabling this command will affect (delay) the instruction execution timing of the CPU. This system option, which is a representation of a feature of the processor, will remarkably reduce the amount FIFO OVERFLOW errors, but can not avoid them completely.
For processors which implement the IEEE-ISTO 5001-2008 or later, STALL can be configured to occur at several fill levels, while processors which implement an older standard have a fixed level.
NEXUS.state Display NEXUS port configuration window
Displays the NEXUS trace configuration window.
Format: NEXUS.SpenDTM [ON | OFF] NEXUS.SpenDQM [ON | OFF] NEXUS.SpenOTM [ON | OFF] NEXUS.SpenPTM [ON | OFF] NEXUS.SpenWTM [ON | OFF]
NOTE: Only available for processors which implement the IEEE-ISTO 5001-2008 or later.
Format: Processors which implement IEEE-ISTO 5001-2003 standard:NEXUS.STALL [ON | OFF]
Processors which implement IEEE-ISTO 5001-2008 or later:NEXUS.STALL [1/4 | 1/2 | 3/4 | OFF]
SYStem.Option.STALL [ON | OFF] (deprecated)
Format: NEXUS.state
Qorivva MPC5xxx/SPC5xx Debugger and NEXUS Trace 142 ©1989-2018 Lauterbach GmbH

NEXUS.SupprTHReshold Set fill level for message suppression
Sets the NEXUS message FIFO fill level, at which messages will be suppressed by the core. The message types which will be suppressed are configured via the command NEXUS.Suppr<message>
NEXUS.TimeStamps Enable on-chip timestamp generation
MPC57XX/SPC57X only. When enabled, the processor is configured to add timestamps to the NEXUS messages. If the chip-external trace is used (tracing to PowerTrace unit), on-chip timestamps are usually not needed, because the PowerTrace unit will add it’s own timestamp. When using the on-chip trace (trace-to-memory), enable NEXUS.TimeStamps for run-time measurements.
Format: NEXUS.SupprTHReshold [1/4 | 1/2 | 3/4]
NOTE: Only available for processors which implement the IEEE-ISTO 5001-2008 or later.
Format: NEXUS.TimeStamps [ON | OFF]
NOTE: • Check the processor reference manual if the used processor supports NEXUS timestamps.
• Not all trace clients of a processor may support NEXUS timestamps. (e.g. MPC5746M and SPC57EM80 do not support timestamps for NEXUS messages of the cores)
• Timestamps will consume ~20% of the trace bandwidth/trace memory
Qorivva MPC5xxx/SPC5xx Debugger and NEXUS Trace 143 ©1989-2018 Lauterbach GmbH

NEXUS.WTM Enable watchpoint messaging
Format: NEXUS.WTM [ON | OFF] SYStem.Option.WTM [ON | OFF] (deprecated)
ON NEXUS outputs watchpoint messages.
OFF No watchpoint messages are output by NEXUS.
NOTE: When a watchpoint is set with a Break.Set command, the NEXUS.WTM setting will be internally overridden to ON.
Qorivva MPC5xxx/SPC5xx Debugger and NEXUS Trace 144 ©1989-2018 Lauterbach GmbH

Nexus specific TrOnchip Commands
TrOnchip.Alpha Set special breakpoint function
Configures the functionality of the Alpha breakpoint. This breakpoint can be used to configure the on-chip NEXUS trace for special core features and for the trace clients configured via NEXUS.CLIENT<x>SELECT.
For a description of the functionality and examples, see Trace Filtering and Triggering with Debug Events and Tracing Peripheral Modules / Bus Masters.
TrOnchip.Beta Set special breakpoint function
See TrOnchip.Alpha.
Format: TrOnchip.Alpha <function>
<function>: OFF ProgramTraceONProgramTraceOFFDataTraceONDataTraceOFF
TraceEnableClient<x>TraceDataClient<x>TraceONClient<x>TraceOFFClient<x>TraceTriggerClient<x>BusTriggerClient<x>BusCountClient<x>WATCHClient<x>
deprecated:TraceEnableDMA | TraceDataDMA | TraceONDMA | TraceOFFDMATraceTriggerDMA | BusTriggerDMA | BusCountDMA | WATCHDMATraceEnableFRAY | TraceDataFRAY | TraceONFRAY | TraceOFFFRAYTraceTriggerFRAY | BusTriggerFRAY | BusCountFRAY | WATCHFRAY
<x>: 1 | 2 | 3 | 4 | 5
Format: TrOnchip.Beta <function>
Qorivva MPC5xxx/SPC5xx Debugger and NEXUS Trace 145 ©1989-2018 Lauterbach GmbH

TrOnchip.Charly Set special breakpoint function
See TrOnchip.Alpha.
TrOnchip.Delta Set special breakpoint function
See TrOnchip.Alpha.
TrOnchip.DISable Disable NEXUS trace register control
Disables NEXUS register control by the debugger. By executing this command, the debugger will not write or modify any registers of the NEXUS block. This option can be used to manually set up the NEXUS trace registers. The NEXUS memory access is not affected by this command. To re-enable NEXUS register control, use command TrOnchip.ENable. Per default, NEXUS register control is enabled.
TrOnchip.Echo Set special breakpoint function
See TrOnchip.Alpha.
Format: TrOnchip.Charly <function>
Format: TrOnchip.Delta <function>
Format: TrOnchip.DISable
Format: TrOnchip.Echo <function>
Qorivva MPC5xxx/SPC5xx Debugger and NEXUS Trace 146 ©1989-2018 Lauterbach GmbH

TrOnchip.ENable Enable NEXUS trace register control
Enables NEXUS register control by the debugger. By default, NEXUS register control is enabled. This command is only needed after disabling NEXUS register control using TrOnchip.DISable.
TrOnchip.EVTI Allow the EVTI signal to stop the program execution
Default: OFF. If enabled, the debugger will use the EVTI signal to break program execution instead of sending a JTAG command. This will speed up reaction time. If the complex trigger unit is used to stop program execution, it is recommended to enable this option to achieve a shorter delay. If this option is disabled, the debugger will drive EVTI permanently high.
NOTES:
• Only enable this option if the EVTI pin of the processor is connected to the NEXUS connector.
• This option has no effect if TrOnchip.EVTEN is disabled.
TrOnchip.EVTO Use EVTO signal for runtime measurement
Default: OFF. If enabled, the debugger will use the EVTO for Run-time measurement and external watchdog control. This will improve the precision of run-time measurement and reduce external watchdog control delays.
Format: TrOnchip.ENable
Format: TrOnchip.EVTI [ON | OFF]
Format: TrOnchip.EVTO [ON | OFF]
NOTE: • Only enable this option if the EVTO pin of the processor is connected to the NEXUS connector.
• This option has no effect if TrOnchip.EVTEN is disabled.
Qorivva MPC5xxx/SPC5xx Debugger and NEXUS Trace 147 ©1989-2018 Lauterbach GmbH

TrOnchip.EXTernal Enable trace trigger input of NEXUS adapter
The NEXUS adapter provides an additional (active-high) trigger input to stop the trace recording. The input is labeled “IN” or “IN0” on LA-7610 and “IX0” on LA-7630 adapters. The input channel recognizes signals with a minimum pulse length of 20 ns.
The recorded value of the input channel can be observed in the Trigger.0 row of the Trace.List window.
The Complex Trigger Unit (CTU) supports the input channel level as condition IN.
TrOnchip.Out0 Select OUT0 pin signal source
Selects the signal source for the OUT0 pin of the NEXUS connector. On LA-7630 adapters, the signal is labeled “Ox0”.
WDTC source can be used to activate the OUT0 output in parallel to the TD/WDTE pin. It can control an external WDTC (or something else). It is a second output, controlled by TrOnchip.TOOLIO2.
Format: TrOnchip.EXTernal <source>
<source>: OFF | IN0
;Show program flow and input channelTrace.List DEFault Trigger.0
Format: TrOnchip.Out0 <source>
<source>: Trigger | Evto | WDTC
Trigger Trigger output of CTU (OUT.A)
Evto Directly driven by EVTO input
WDTC Watchdog Timer Control
Qorivva MPC5xxx/SPC5xx Debugger and NEXUS Trace 148 ©1989-2018 Lauterbach GmbH

There are the following features and restrictions:
• Only valid for Nexus AutoFocus preprocessor (LA-7630)
• Settings before the correct CPU is recognized or selected, will be removed.
• If TriggerOnchip.Out0 WDTC is selected, an external WDT can be controlled by the OUT0 pin of the Nexus probe.
• OUT0 pin can control a WDTC before a SYStem.Up command. (TD/WDTE pin cannot offer that).
• OUT0 can not be tristated and is always driving HIGH or LOW.
• OUT0 is not 5V tolerant, it can drive only 3.3V circuitry.
TrOnchip.Out1 Select OUT1 pin signal source
Selects the signal source for the OUT1 pin of the NEXUS connector. Only available on LA-7610.
Format: TrOnchip.Out1 <source>
<source>: Trigger | Low | High | Run
Trigger Trigger output of CTU (OUT.B)
Low Permanently low (GND)
High Permanently high (VCC)
Run Low while CPU running, high while stopped
Qorivva MPC5xxx/SPC5xx Debugger and NEXUS Trace 149 ©1989-2018 Lauterbach GmbH

TrOnchip.TOOLIO2 Select TOOLIO2 pin signal source
Selects the signal source for the TOOLIO2 pin of the NEXUS connector. The signal source of TOOLIO2 is pin OUT1 on the NEXUS preprocessor, so changing this setting will also change OUT1.Refer also to TrOnchip.Out0 command as a second way to control an output pin with slightly different features.
Format: TrOnchip.TOOLIO2 <source>
<source>: OFF | Trigger | Low | High | Run | Stop
OFF Tristated
Trigger Trigger output of CTU (OUT.A)
Low Permanently low (GND)
High Permanently high (VCC)
Run Low while CPU running, high while stopped; can be used to disable on-board watchdogs.
Stop High while CPU running, low while stopped
Qorivva MPC5xxx/SPC5xx Debugger and NEXUS Trace 150 ©1989-2018 Lauterbach GmbH

TrOnchip.TRaceControl Trace control with special debug events
Use this command to enable above trace actions for the specified debug event. Only available on processors which implement IEEE-ISTO 5001-2008 or later. See Trace Filtering and Triggering with Debug Events for an explanation of the available actions.
The example below shows how to disable the program trace for interrupts. On account of the on-chip implementation, the program trace will start after the first interrupt return (RFI instruction) is executed.
Format: TrOnchip.TRaceControl <event> <action>
<event>: IRPTRETCIRPTCRET
<action>: OFFTraceON | TraceOFFProgramTraceON | ProgramTraceOFFDataTraceON | DataTraceOFFTraceTrigger | BusTriggerWATCH
IRPT Interrupt taken debug event
RET Interrupt return debug event
CIRPT Critical interrupt taken debug event
CRET Critical interrupt return debug event
;Disable program trace for interrupt handler
TrOnchip.TRaceControl IRPT TraceOFFTrOnchip.TRaceControl RET TraceON
Qorivva MPC5xxx/SPC5xx Debugger and NEXUS Trace 151 ©1989-2018 Lauterbach GmbH

Debug and Trace Connectors
14-pin JTAG/OnCE Connector (JTAG)
This connector is compatible to the JTAG connector used on the NXP/Freescale and STM evaluation boards.
AUTO26 Connector (JTAG)
Signal Pin Pin Signal
TDI 1 2 GNDTDO 3 4 GNDTCK 5 6 GND
(EVTI-) 7 8 N/CRESET- 9 10 TMS
JTAG-VTREF 11 12 GND(RDY-) 13 14 JCOMP
Signal Pin Pin SignalVTREF 1 2 TMS
GND 3 4 TCKGND 5 6 TDO
KEY(GND) - 8 TDIGND(PRESENCE) 9 10 RESET-
GND 11 12 RESETOUT-GND 13 14 WDTDISGND 15 16 JCOMPGND 17 18 EVTI-GND 19 20 EVTO-GND 21 22 BREQ-GND 23 24 BGRNT-GND 25 26 EXTIO
Qorivva MPC5xxx/SPC5xx Debugger and NEXUS Trace 152 ©1989-2018 Lauterbach GmbH

10-pin ECU14 Connector (with converter LA-3843)
38-pin Mictor Connector (NEXUS parallel)
Signal Pin Pin SignalGND 1 2 TCK/DAP0
TRST-/JCOMP 3 4 TDO/DAP2TMS/DAP1 5 6 TDI/DAPEN
USERIO 7 8 VTREFRESETOUT- 9 10 RESET-
Signal Pin Pin Signal
MDO12 1 2 MDO13MDO14 3 4 MDO15MDO09 5 6 (CLKOUT)
N/C 7 8 MDO08RSTIN- 9 10 EVTI-
TDO 11 12 VTREFMDO10 13 14 RDY-
TCK 15 16 MDO07TMS 17 18 MDO06TDI 19 20 MDO05
JCOMP 21 22 MDO04MDO11 23 24 MDO03
RESETOUT 25 26 MDO02TDET/WDTDIS 27 28 MDO01
BGRNT 29 30 MDO00N/C 31 32 EVTO-N/C 33 34 MCKO
BREQ 35 36 MSEO1-N/C 37 38 MSEO0-
Qorivva MPC5xxx/SPC5xx Debugger and NEXUS Trace 153 ©1989-2018 Lauterbach GmbH

50-pin SAMTEC ERF8 Connector (NEXUS parallel)
Signal Pin Pin SignalMSEO0- 1 2 VREFMSEO1- 3 4 TCK
GND 5 6 TMSMDO00 7 8 TDIMDO01 9 10 TDO
GND 11 12 TRST- (JCOMP)MDO02 13 14 DBGACK- (RDY)MDO03 15 16 EVTI-
GND 17 18 EVTO-MCKO 19 20 RSTIN-
MDO04 21 22 RSTOUTGND 23 24 GND
MDO05 25 26 CLKOUTMDO06 27 28 TD/WDTE
GND 29 30 GNDMDO07 31 32 DAI1MDO08 33 34 DAI2
GND 35 36 GNDMDO09 37 38 ARBREQMDO10 39 40 ARBGRT
GND 41 42 GNDMDO11 43 44 MDO13MDO12 45 46 MDO14
GND 47 48 GNDMDO15 49 50 N/C
Qorivva MPC5xxx/SPC5xx Debugger and NEXUS Trace 154 ©1989-2018 Lauterbach GmbH

51-pin GlenAir / ROBUST Connector (NEXUS parallel)
Pin Signal
1 N/C2 N/C3 N/C4 ARBREQ(TOOLIO0)5 TDO6 RDY-7 RSTIN-8 VREF9 EVTI-
10 GND11 TRST-12 GND13 TMS14 GND15 TDI16 GND17 TCK18 GND19 MDO020 GND21 MCKO22 GND23 EVTO-24 GND25 MSEO0-26 MDO927 MDO128 GND29 MDO230 GND31 MDO332 GND33 ARBGRT(TOOLIO1)34 GND35 MSEO1-36 GND37 MDO438 GND39 MDO540 GND41 MDO642 GND43 MDO744 GND45 MDO846 GND47 MDO1048 GND49 MDO1150 GND (TDET)51 RSTOUT(VENIO2)
Qorivva MPC5xxx/SPC5xx Debugger and NEXUS Trace 155 ©1989-2018 Lauterbach GmbH

34-pin SAMTEC ERF8 Connector (Aurora NEXUS)
Signal Pin Pin SignalTXP0 1 2 JTAG-VTREFTXN0 3 4 TCKGND 5 6 TMSTXP1 7 8 TDITXN1 9 10 TDOGND 11 12 JCOMP-TXP2 13 14 N/CTXN2 15 16 EVTI-GND 17 18 EVTO-TXP3 19 20 RSTOUT-TXN3 21 22 RSTIN-GND 23 24 GNDN/C 25 26 CLKPN/C 27 28 CLKN
GND 29 30 GNDN/C 31 32 RDY-N/C 33 34 WDIS
Qorivva MPC5xxx/SPC5xx Debugger and NEXUS Trace 156 ©1989-2018 Lauterbach GmbH

Mechanical Dimensions
Dimension
LA-7610 NEXUS-MPC5500
3500275
137
SIDE VIEW
TOP VIEW
ALL DIMENSIONS IN 1/1000 INCH
CABLE
50
014
6219
7524
75
1
67
5
275
REGULAR
M2,5 screw
2 X dia 100 for
CONVERTER MICTOR TO GLENAIR 51
400
1775
100
850 850
325
1375
PIN1
PIN1
OUTSIDE INSIDE
TOP VIEW
TWO ROTATE VERSIONS OF THE GLENAIR 51 PLUG AVAILABLE
STANDARD ORIENTATION IS OUTSIDE
Qorivva MPC5xxx/SPC5xx Debugger and NEXUS Trace 157 ©1989-2018 Lauterbach GmbH

LA-7611 CONV-MIC38-GL51-5500
LA-7612 NEXUS-MPC551X
Dimension
CONVERTER MICTOR TO GLENAIR 51
400
1775
100
850 850
325
1375
PIN1
PIN1
OUTSIDE INSIDE
TOP VIEW
TWO ROTATE VERSIONS OF THE GLENAIR 51 PLUG AVAILABLE
STANDARD ORIENTATION IS OUTSIDE
CABLETOP VIEW
SIDE VIEW
40501500
1050500
PIN1
538
152
5
24
75
275
675
475
ALL DIMENSIONS IN 1/1000 INCH
Qorivva MPC5xxx/SPC5xx Debugger and NEXUS Trace 158 ©1989-2018 Lauterbach GmbH
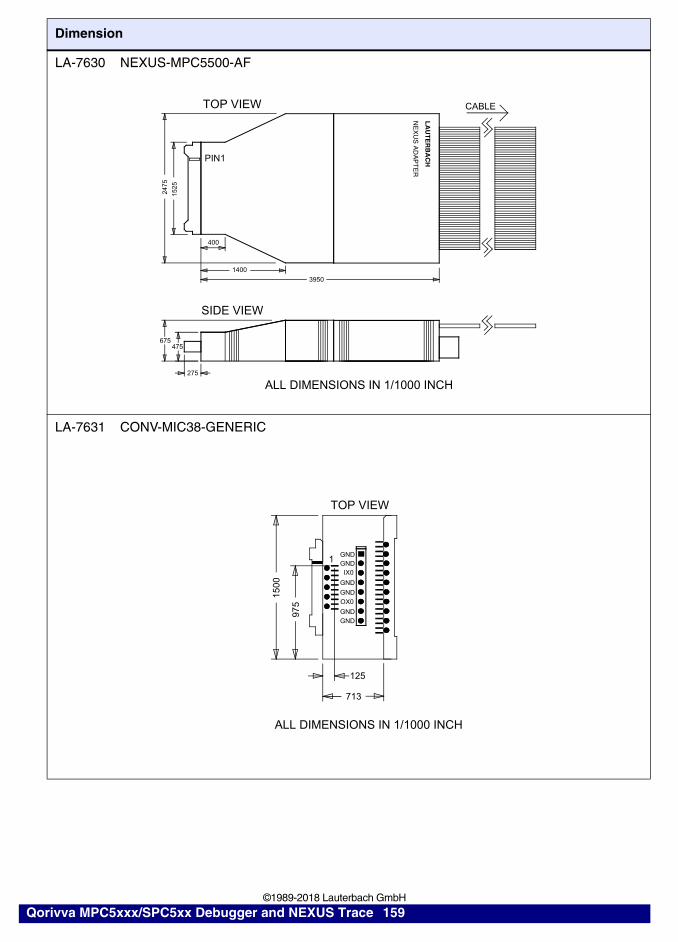
LA-7630 NEXUS-MPC5500-AF
LA-7631 CONV-MIC38-GENERIC
Dimension
PIN1
TOP VIEW
SIDE VIEW
ALL DIMENSIONS IN 1/1000 INCH 275
475675
3950
1400
400
1525
2475
CABLE
LA
UT
ER
BA
CH
NE
XU
S A
DA
PT
ER
125
713
975
15
00
1GNDGND
GND
GND
GNDGND
IX0
OX0
TOP VIEW
ALL DIMENSIONS IN 1/1000 INCH
oo
o
Qorivva MPC5xxx/SPC5xx Debugger and NEXUS Trace 159 ©1989-2018 Lauterbach GmbH

LA-7632 CONV-GL51-MPC5500
LA-7633 CONV-MIC38-MPC5500R
Dimension
TOP VIEW 2X R50
15
00
12
15
188
1050
ALL DIMENSIONS IN 1/1000 INCH
GND
IXO
OXO
GND
GNDGND
GND
GND
PIN1
LAUTERBACH
2x dia 100 for screws
100
ADAPTERMPC55xx
838
213
75
12510
88
160017
25
OOOOOOO
J101J100
J103J102
O
O
OO
OO
O
O
OOO
O
OOO
OO
PIN 1
TOP VIEW
ALL DIMENSIONS IN 1/1000 INCH
NAF MODULE
Qorivva MPC5xxx/SPC5xx Debugger and NEXUS Trace 160 ©1989-2018 Lauterbach GmbH

LA-7636 CONV-MIC76-MPC5500-L
LA-7637 CONV-MIC76-MPC5500-S
Dimension
TOP VIEW
ALL DIMENSIONS IN 1/1000 INCH 675
238
363
15
00
Adap
ter SA
MT
EC
ER
x8 (50 PIN
)
LAU
TE
RB
AC
H
GNDDAI2IX0N/CTD WDTOX0DAI1GND
J10
1
J10
01
PIN1
NEXUS
AutoFocus
TOP VIEW
ALL DIMENSIONS IN 1/1000 INCH
675
238
150
0
GNDGNDIX0N/CTD WDTOX0GNDGND
LAU
TE
RB
AC
H
Adapter SAMTEC
ERx8 (20 PIN)
613
1PIN 1
NEXUS
AutoFocus
Qorivva MPC5xxx/SPC5xx Debugger and NEXUS Trace 161 ©1989-2018 Lauterbach GmbH

LA-7638 CONV-MIC38-MPC5500-L
LA-7639 CONV-MIC38-MPC5500-S
Dimension
ALL DIMENSIONS IN 1/1000 INCH
TOP VIEW
LAUTERBACH
150
238
20
0
51
3
157
517
75
2 X
DIA
10
0 fo
r sc
rew
scon
verter SA
MT
EC
ER
x8 50 pin
PIN1
850
TOP VIEW
ALL DIMENSIONS IN 1/1000 INCH
150
238
850
45075
0
13
25
17
75
conve
rter S
AM
TE
C E
Rx8
20
PIN
PIN
1
2 X
DIA
100
fo
r sc
rew
s
Qorivva MPC5xxx/SPC5xx Debugger and NEXUS Trace 162 ©1989-2018 Lauterbach GmbH
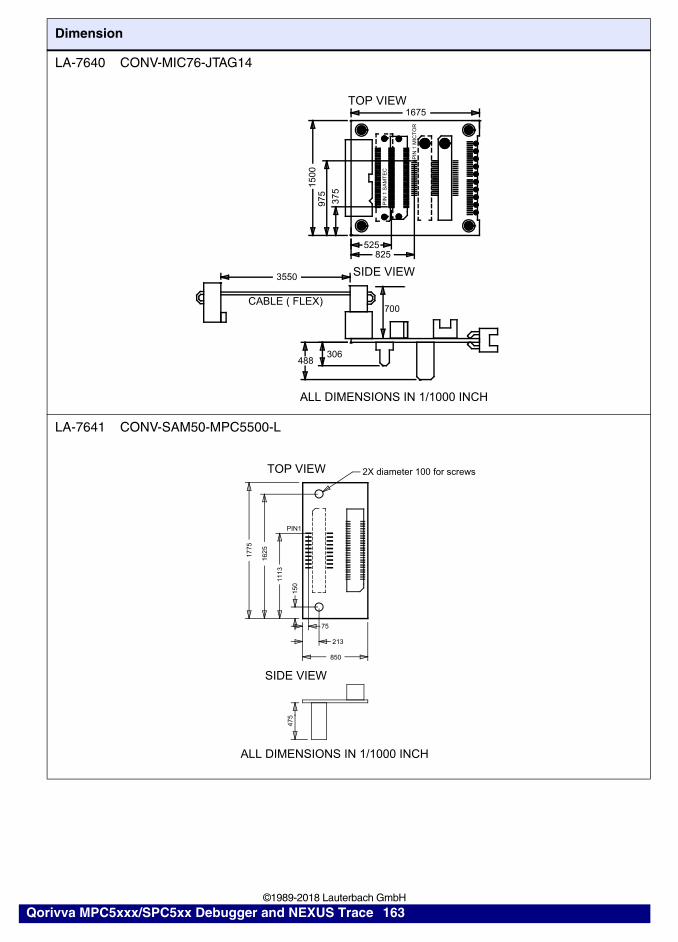
LA-7640 CONV-MIC76-JTAG14
LA-7641 CONV-SAM50-MPC5500-L
Dimension
TOP VIEW
SIDE VIEW
ALL DIMENSIONS IN 1/1000 INCH
CABLE ( FLEX)
3550
488306
15
0097
5
375
525825
1675
PIN
1 M
ICT
OR
PIN
1 S
AM
TE
C
700
SIDE VIEW
ALL DIMENSIONS IN 1/1000 INCH
TOP VIEW 2X diameter 100 for screws
PIN1
150
111
3
162
5
1775
75
213
850
475
Qorivva MPC5xxx/SPC5xx Debugger and NEXUS Trace 163 ©1989-2018 Lauterbach GmbH
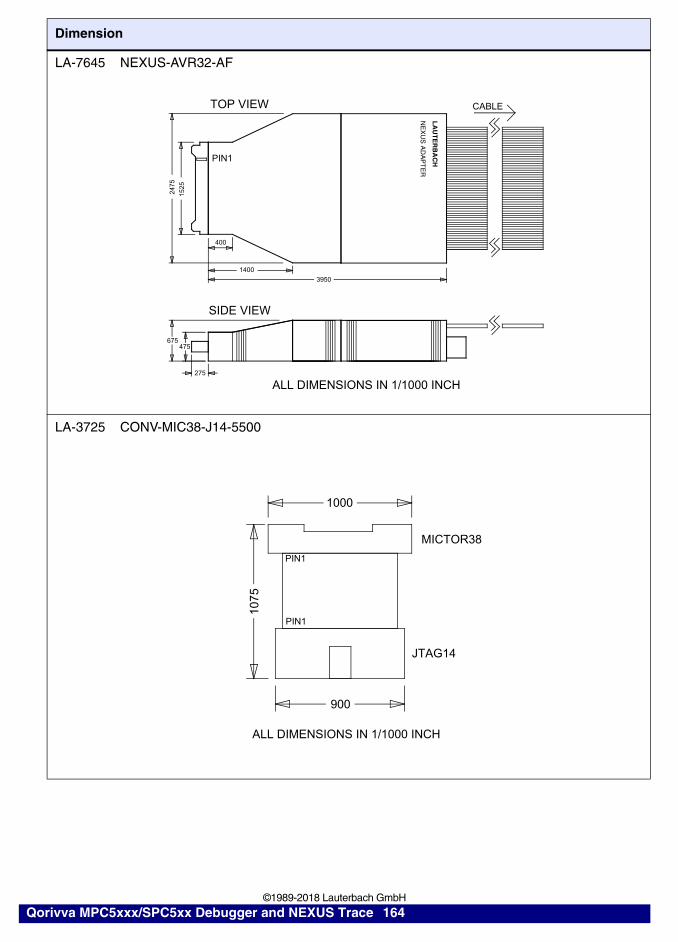
LA-7645 NEXUS-AVR32-AF
LA-3725 CONV-MIC38-J14-5500
Dimension
PIN1
TOP VIEW
SIDE VIEW
ALL DIMENSIONS IN 1/1000 INCH 275
475675
3950
1400
400
1525
2475
CABLE
LA
UT
ER
BA
CH
NE
XU
S A
DA
PT
ER
MICTOR38
JTAG14
900
107
5
1000
ALL DIMENSIONS IN 1/1000 INCH
PIN1
PIN1
Qorivva MPC5xxx/SPC5xx Debugger and NEXUS Trace 164 ©1989-2018 Lauterbach GmbH

LA-3854 ET176-SPC56ECXX
LA-3855 ET176-MPC5607BC
Dimension
SIDE VIEW
TOP VIEW
ALL DIMENSIONS IN mm
NEXUS connector
TARGET
TET-ADAPTER
SOCKET
80.0mm
80.0
mm
NEXUS CONNECTOR
12.1mm
12.1
mm
10.2mm TO-1325TO-1388
BGA
3150475
47
5
PIN1
315
0
TOP VIEW
3150NEXUS connector
TET ADAPTER
TET SOCKET55
0
TARGET
ALL DIMENSIONS IN 1/1000 INCH
SIDE VIEW
Qorivva MPC5xxx/SPC5xx Debugger and NEXUS Trace 165 ©1989-2018 Lauterbach GmbH

Technical Data
Operation Voltage
Operation Frequency
Parallel NEXUS:
• 0 .. 100MHz
Aurora NEXUS:
• up to 3.125 gigabit/second with 4 lanes
• up to 6.250 gigabit/second with up to 3 lanes
• reference clock output up to 3.125 GHz
Adapter OrderNo Voltage Range
JTAG Debugger for MPC5xxx Automotive LA-3736 1.6 .. 5.5 VDebugger-Bundle MPC5xxx/TriCore Automotive LA-3738 1.6 .. 5.5 VJTAG Debugger Qorivva MPC5xxx/SPC5xxx (ICD) LA-7753 1.6 .. 5.5 VJTAG Debugger for MPC5xxx (ICD) Additional LA-7753A 1.6 .. 5.5 V
Adapter OrderNo Voltage Range
Adap. SPC560B64-BGA208 to ET176 NEXUS LA-3850 3.0 .. 3.5 VAdap. SPC560C50-BGA208 to ET144 NEXUS LA-3851 3.0 .. 3.5 VAdap. SPC560C50-BGA208 to ET100 NEXUS LA-3852 3.0 .. 3.5 VAdap. MPC5646C-BGA256 to ET176 NEXUS LA-3853 3.0 .. 3.5 VAdap. SPC56ECxx-BGA256 to ET176 NEXUS LA-3854 3.0 .. 3.5 VAdap. MPC5607BC-BGA208 to ET176 NEXUS LA-3855 3.0 .. 3.5 VAdap. MPC5604BC-BGA208 to ET144 NEXUS LA-3856 3.0 .. 3.5 VAdap. MPC5604BC-BGA208 to ET100 NEXUS LA-3857 3.0 .. 3.5 VNEXUS Debug/Trace for Qorivva MPC5xxx/SPC5xxx LA-7630 1.0 .. 5.2 VDebug/Trace Lic. for MPC5xxx NEXUS AutoFocus LA-7630A 1.0 .. 5.2 V
Qorivva MPC5xxx/SPC5xx Debugger and NEXUS Trace 166 ©1989-2018 Lauterbach GmbH

Support
Available Tools
CP
U
ICE
FIR
E
ICD
DE
BU
G
ICD
MO
NIT
OR
ICD
TR
AC
E
PO
WE
RIN
TE
GR
ATO
R
INS
TR
UC
TIO
NS
IMU
LA
TOR
MPC5514 YES YESMPC5515 YES YESMPC5516 YES YESMPC5517 YES YESMPC5533 YES YESMPC5534 YES YESMPC5553 YES YESMPC5554 YES YESMPC5561 YES YESMPC5565 YES YESMPC5566 YES YESMPC5567 YES YESMPC5601D YES YESMPC5601P YES YESMPC5602B YES YESMPC5602C YES YESMPC5602D YES YESMPC5602P YES YESMPC5602S YES YESMPC5603B YES YESMPC5603C YES YESMPC5603P YES YESMPC5604B YES YESMPC5604C YES YESMPC5604E YES YESMPC5604P YES YESMPC5604S YES YESMPC5605B YES YESMPC5606B YES YESMPC5606S YES YESMPC5607B YES YESMPC5632M YES YESMPC5633M YES YESMPC5634M YES YES
Qorivva MPC5xxx/SPC5xx Debugger and NEXUS Trace 167 ©1989-2018 Lauterbach GmbH

MPC5642A YES YESMPC5643A YES YESMPC5643L YES YESMPC5644A YES YESMPC5644B YES YESMPC5644C YES YESMPC5645B YES YESMPC5645C YES YESMPC5645S YES YESMPC5646B YES YESMPC5646C YES YESMPC5668E YES YESMPC5668G YES YESMPC5673F YES YESMPC5673K YES YESMPC5673L YES YESMPC5674F YES YESMPC5674K YES YESMPC5675K YES YESMPC5676R YES YESMPC5726L YES YESMPC5741P YES YES YESMPC5742P YES YES YESMPC5743P YES YES YESMPC5743R YES YES YESMPC5744K YES YES YESMPC5744P YES YES YESMPC5745B YES YESMPC5745C YES YESMPC5745D YES YESMPC5745R YES YES YESMPC5746B YES YESMPC5746C YES YESMPC5746D YES YESMPC5746G YES YESMPC5746M YES YES YESMPC5746R YES YES YESMPC5747C YES YESMPC5747G YES YESMPC5748C YES YESMPC5748G YES YES
CP
U
ICE
FIR
E
ICD
DE
BU
G
ICD
MO
NIT
OR
ICD
TR
AC
E
PO
WE
RIN
TE
GR
ATO
R
INS
TR
UC
TIO
NS
IMU
LA
TOR
Qorivva MPC5xxx/SPC5xx Debugger and NEXUS Trace 168 ©1989-2018 Lauterbach GmbH
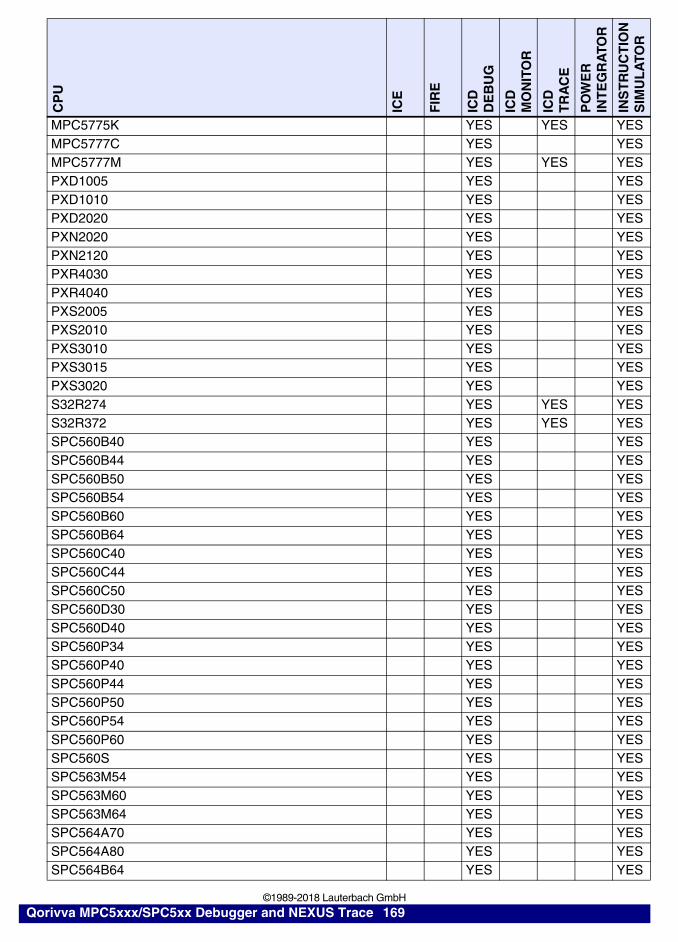
MPC5775K YES YES YESMPC5777C YES YESMPC5777M YES YES YESPXD1005 YES YESPXD1010 YES YESPXD2020 YES YESPXN2020 YES YESPXN2120 YES YESPXR4030 YES YESPXR4040 YES YESPXS2005 YES YESPXS2010 YES YESPXS3010 YES YESPXS3015 YES YESPXS3020 YES YESS32R274 YES YES YESS32R372 YES YES YESSPC560B40 YES YESSPC560B44 YES YESSPC560B50 YES YESSPC560B54 YES YESSPC560B60 YES YESSPC560B64 YES YESSPC560C40 YES YESSPC560C44 YES YESSPC560C50 YES YESSPC560D30 YES YESSPC560D40 YES YESSPC560P34 YES YESSPC560P40 YES YESSPC560P44 YES YESSPC560P50 YES YESSPC560P54 YES YESSPC560P60 YES YESSPC560S YES YESSPC563M54 YES YESSPC563M60 YES YESSPC563M64 YES YESSPC564A70 YES YESSPC564A80 YES YESSPC564B64 YES YES
CP
U
ICE
FIR
E
ICD
DE
BU
G
ICD
MO
NIT
OR
ICD
TR
AC
E
PO
WE
RIN
TE
GR
ATO
R
INS
TR
UC
TIO
NS
IMU
LA
TOR
Qorivva MPC5xxx/SPC5xx Debugger and NEXUS Trace 169 ©1989-2018 Lauterbach GmbH
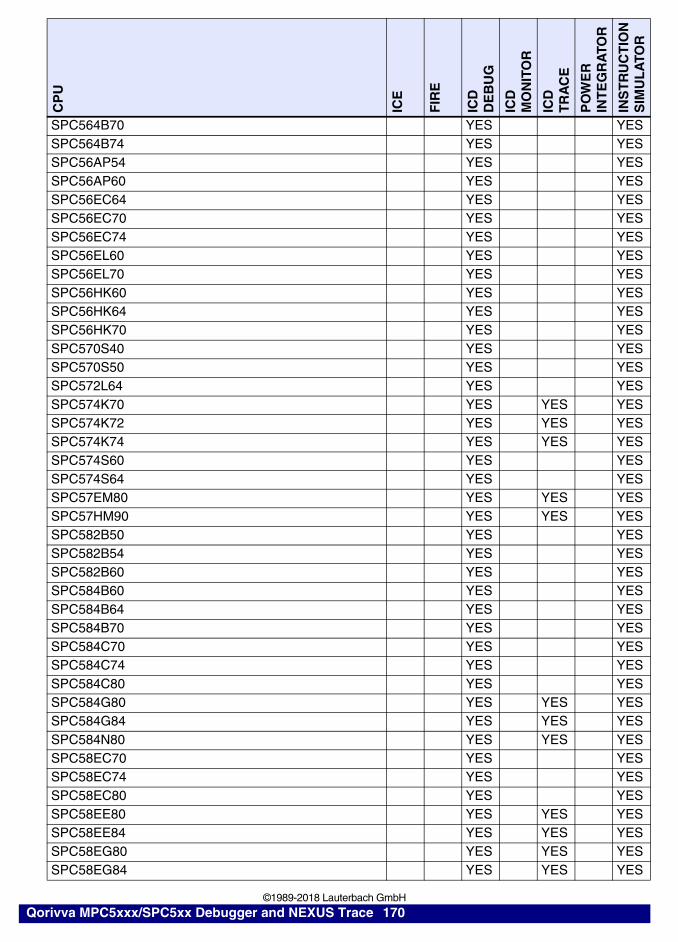
SPC564B70 YES YESSPC564B74 YES YESSPC56AP54 YES YESSPC56AP60 YES YESSPC56EC64 YES YESSPC56EC70 YES YESSPC56EC74 YES YESSPC56EL60 YES YESSPC56EL70 YES YESSPC56HK60 YES YESSPC56HK64 YES YESSPC56HK70 YES YESSPC570S40 YES YESSPC570S50 YES YESSPC572L64 YES YESSPC574K70 YES YES YESSPC574K72 YES YES YESSPC574K74 YES YES YESSPC574S60 YES YESSPC574S64 YES YESSPC57EM80 YES YES YESSPC57HM90 YES YES YESSPC582B50 YES YESSPC582B54 YES YESSPC582B60 YES YESSPC584B60 YES YESSPC584B64 YES YESSPC584B70 YES YESSPC584C70 YES YESSPC584C74 YES YESSPC584C80 YES YESSPC584G80 YES YES YESSPC584G84 YES YES YESSPC584N80 YES YES YESSPC58EC70 YES YESSPC58EC74 YES YESSPC58EC80 YES YESSPC58EE80 YES YES YESSPC58EE84 YES YES YESSPC58EG80 YES YES YESSPC58EG84 YES YES YES
CP
U
ICE
FIR
E
ICD
DE
BU
G
ICD
MO
NIT
OR
ICD
TR
AC
E
PO
WE
RIN
TE
GR
ATO
R
INS
TR
UC
TIO
NS
IMU
LA
TOR
Qorivva MPC5xxx/SPC5xx Debugger and NEXUS Trace 170 ©1989-2018 Lauterbach GmbH

Compilers
SPC58EN80 YES YES YESSPC58EN84 YES YES YESSPC58NE80 YES YES YESSPC58NE84 YES YES YESSPC58NG80 YES YES YESSPC58NG84 YES YES YESSPC58NN84 YES YES YES
Language Compiler Company Option Comment
ADA GNAT PRO AdaCore ELF/DWARF not all ADA constructs/DWARF
ADA GNAT Free Software Foundation, Inc.
ELF/DWARF
C CXPPC Cosmic Software ELF/DWARFC XCC-V GAIO Technology Co.,
Ltd.SAUF
C GREEN-HILLS-C Greenhills Software Inc. ELF/DWARFC MCCPPC Mentor Graphics
CorporationELF/DWARF
C CC NXP Semiconductors XCOFFC ULTRA-C Radisys Inc. ROFC HIGH-C Synopsys, Inc ELF/DWARFC DCPPC TASKING ELF/DWARFC D-CC Wind River Systems IEEEC D-CC Wind River Systems COFFC D-CC Wind River Systems ELF/DWARFC++ GCC Free Software
Foundation, Inc.ELF/DWARF
C++ GREEN-HILLS-C++
Greenhills Software Inc. ELF/DWARF
C++ CCCPPC Mentor Graphics Corporation
ELF/DWARF
C++ MSVC Microsoft Corporation EXE/CV5 WindowsCEC++ HIGH-C++ Synopsys, Inc ELF/DWARFC++ D-C++ Wind River Systems ELF/DWARF
CP
U
ICE
FIR
E
ICD
DE
BU
G
ICD
MO
NIT
OR
ICD
TR
AC
E
PO
WE
RIN
TE
GR
ATO
R
INS
TR
UC
TIO
NS
IMU
LA
TOR
Qorivva MPC5xxx/SPC5xx Debugger and NEXUS Trace 171 ©1989-2018 Lauterbach GmbH

C++ GCCPPC Wind River Systems ELF/STABSC/C++ GNAT PRO AdaCore ELF/DWARFC/C++ GCC HighTec EDV-Systeme
GmbHELF/DWARF
C/C++ CODEWARRIOR NXP Semiconductors ELF/DWARFGCC GCC Free Software
Foundation, Inc.ELF/DWARF
JAVA FASTJ Wind River Systems ELF/DWARF
Language Compiler Company Option Comment
Qorivva MPC5xxx/SPC5xx Debugger and NEXUS Trace 172 ©1989-2018 Lauterbach GmbH

Target Operating Systems
Company Product Comment
KadakProducts Ltd. AMXOracle Corporation ChorusOSCMX Systems Inc. CMX-RTXDDC-I, Inc. DEOS implemented by DDC-IeCosCentric Limited ECOS 1.3, 2.0 and 3.0Elektrobit Automotive GmbH
Elektrobit tresos via ORTI
ETAS GmbH ERCOSEK via ORTIEvidence Erika via ORTIfreeRTOS FreeRTOS up to v9HIPPEROS S.A. HIPPEROS implemented by HIPPEROS- Linux Kernel Version 2.4 and 2.6, 3.x, 4.xMontaVista Software, LLC Linux 3.0, 3.1, 4.0, 5.0LynuxWorks Inc. LynxOS 3.1.0, 3.1.0a, 4.0NXP Semiconductors MQX 3.x and 4.xSynopsys, Inc MQX 2.40 and 2.50- NetBSDMISPO Co. Ltd. NORTiMentor Graphics Corporation
Nucleus PLUS
Radisys Inc. OS-9Enea OSE Systems OSE Delta 4.x and 5.x- OSEK via ORTINXP Semiconductors OSEKturbo via ORTI/former MetrowerksOSEKSysgo AG PikeOS up to 4.2.1Elektrobit Automotive GmbH
ProOSEK via ORTI
Wind River Systems pSOS+ 2.1 to 2.5, 3.0, with TRACE32QNX Software Systems QNX 6.0 to 7.0RTEMS RTEMS up to v5Quadros Systems Inc. RTXC 3.2Quadros Systems Inc. RTXC QuadrosSciopta ScioptaMicro Digital Inc. SMX 3.4 to 4.3Express Logic Inc. ThreadX 3.0, 4.0, 5.0Micrium Inc. uC/OS-II 2.0 to 2.92- uITRON HI7000, RX4000, NORTi,PrKernelMentor Graphics Corporation
VRTXsa
Wind River Systems VxWorks 5.x to 7.x
Qorivva MPC5xxx/SPC5xx Debugger and NEXUS Trace 173 ©1989-2018 Lauterbach GmbH
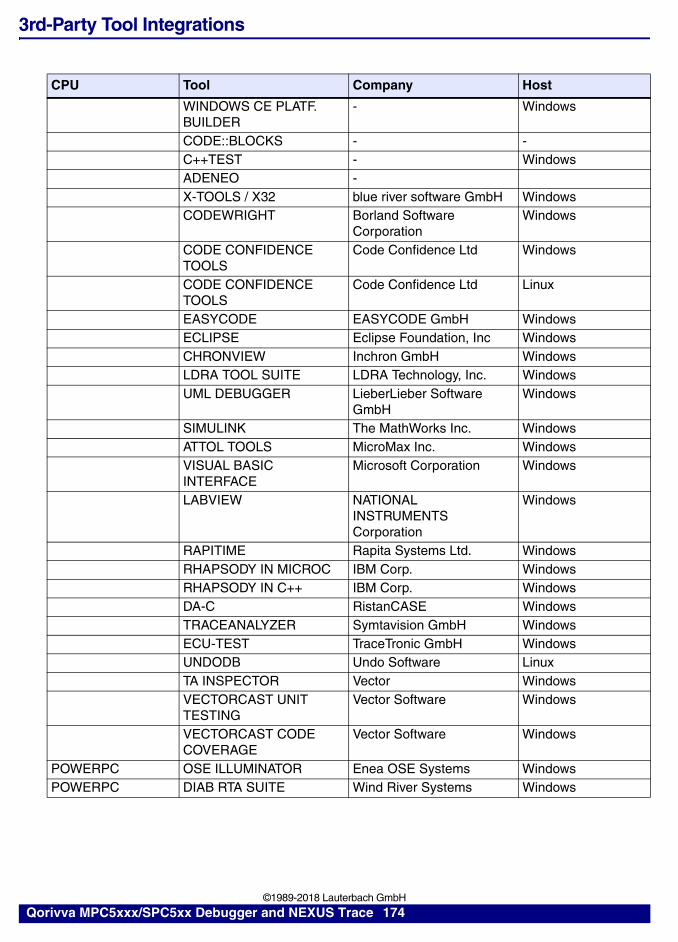
3rd-Party Tool Integrations
CPU Tool Company Host
WINDOWS CE PLATF. BUILDER
- Windows
CODE::BLOCKS - -C++TEST - WindowsADENEO -X-TOOLS / X32 blue river software GmbH WindowsCODEWRIGHT Borland Software
CorporationWindows
CODE CONFIDENCE TOOLS
Code Confidence Ltd Windows
CODE CONFIDENCE TOOLS
Code Confidence Ltd Linux
EASYCODE EASYCODE GmbH WindowsECLIPSE Eclipse Foundation, Inc WindowsCHRONVIEW Inchron GmbH WindowsLDRA TOOL SUITE LDRA Technology, Inc. WindowsUML DEBUGGER LieberLieber Software
GmbHWindows
SIMULINK The MathWorks Inc. WindowsATTOL TOOLS MicroMax Inc. WindowsVISUAL BASIC INTERFACE
Microsoft Corporation Windows
LABVIEW NATIONAL INSTRUMENTS Corporation
Windows
RAPITIME Rapita Systems Ltd. WindowsRHAPSODY IN MICROC IBM Corp. WindowsRHAPSODY IN C++ IBM Corp. WindowsDA-C RistanCASE WindowsTRACEANALYZER Symtavision GmbH WindowsECU-TEST TraceTronic GmbH WindowsUNDODB Undo Software LinuxTA INSPECTOR Vector WindowsVECTORCAST UNIT TESTING
Vector Software Windows
VECTORCAST CODE COVERAGE
Vector Software Windows
POWERPC OSE ILLUMINATOR Enea OSE Systems WindowsPOWERPC DIAB RTA SUITE Wind River Systems Windows
Qorivva MPC5xxx/SPC5xx Debugger and NEXUS Trace 174 ©1989-2018 Lauterbach GmbH

Products
Product Information
OrderNo Code Text
LA-3736 DEBUG-MPC5XXX-AUTO
JTAG Debugger for MPC5xxx Automotivesupports Qorivva MPC5xxx/SPC5xxx (e200 cores)and Freescale PX SERIES processorseTPU, GTM and SPT debugging includedConcurrent debugging of multiple e200 cores onmulticore processors requires aLicense for Multicore Debugging (LA-7960X)(not necessary for lockstep mode)includes software for Windows, Linux and MacOSXrequiresPower Debug Interface USB 2.0/USB 3.0,Power Debug Ethernet, Power Debug II orPowerDebug PROincludes LA-3873 (Conv. AUTO26 to JTAG14 OnCE)
LA-3738 DEBUG-MPC-TC-AUTO
Debugger-Bundle MPC5xxx/TriCore Automotivedebug cable with license bundleincludes software for Windows, Linux and MacOSXrequiresPower Debug Interface USB 2.0/USB 3.0,Power Debug Ethernet, PowerTrace, Power Debug IIor PowerDebug PROAutomotive Debug Cable 26-pin
LA-7753 DEBUG-MPC5500
JTAG Debugger Qorivva MPC5xxx/SPC5xxx (ICD)supports Qorivva MPC5xxx/SPC5xxx (e200 cores)and Freescale PX SERIES processorseTPU, GTM and SPT debugging includedincludes software for Windows, Linux and MacOSXrequires Power Debug ModuleConcurrent debugging of multiple e200 cores onmulticore processors requires aLicense for Multicore Debugging (LA-7960X)(not necessary for lockstep mode)debug cable with 14 pin connector
LA-7753A DEBUG-MPC5500-A
JTAG Debugger for MPC5xxx (ICD) Additionalsupports PowerPC MPC5xxx (e200 cores)eTPU and GTM debugging included
Qorivva MPC5xxx/SPC5xx Debugger and NEXUS Trace 175 ©1989-2018 Lauterbach GmbH

LA-3723 CON-JTAG14-MICTOR
Conv. 14 Pin JTAG to Mictor38 for MPC5xxxConverter 14 Pin JTAG/OnCE connector to Mictor38on target for Qorivva MPC5xxx and SPC5xxx
LA-3874 CON-AUTO26-MICTOR38
Conv. AUTO26 to MICTOR38 MPC5xxxConverter from Automotive Debug Cable (26-pin)to Mictor 38pin (NEXUS MPC5XXX pinout)forLA-3736 (JTAG Debugger for MPC5xxx Automotive)
LA-3875 CON-AUTO26-SAMTEC50
Conv. AUTO26 to Samtec50 MPC5xxxConverter from Automotive Debug Cable (26-pin)to Samtec 50pin (NEXUS MPC5XXX pinout)forLA-3736 (JTAG Debugger for MPC5xxx Automotive)
LA-3873 CON-AUTO26-JTAG14
Conv. AUTO26 to JTAG14 OnCEConverter from Automotive Debug Cable (26-pin)to 14 Pin JTAG/OnCE header on targetforLA-3736 (JTAG Debugger for MPC5xxx Automotive)
LA-3876 CON-JTAG14-AUTO26
Conv. JTAG14 OnCE to AUTO26Converter from 14 Pin JTAG/OnCE MPC5XXX to AUTO26/20/10use withLA-7753 JTAG Debugger Qorivva MPC5xxx/SPC5xxx (ICD)to connect to targets designed forLA-3736 (JTAG Debugger for MPC5xxx Automotive)
OrderNo Code Text
Qorivva MPC5xxx/SPC5xx Debugger and NEXUS Trace 176 ©1989-2018 Lauterbach GmbH

OrderNo Code Text
LA-7630 NEXUS-MPC5500-AF
NEXUS Debug/Trace for Qorivva MPC5xxx/SPC5xxxParallel NEXUS Adapter with AutoFocus technologyfor Qorivva MPC5xxx/SPC5xxx and PX seriesincludes debugger for eTPU and GTMConcurrent debugging of multiple e200 cores onmulticore processors requires aLicense for Multicore Debugging (LA-7960X)(not necessary for lockstep mode)Voltage range: 1..5 VTRACE port: 2..16 MDO (data) lines 1..2 MSEO (control) linesData Bandwidth: up to 200 MBit/sConnector: 76 pin mictor connectorrequires LA-7631 for Mictor 38 on targetrequires LA-7632 for Glenair 51 on targetrequires LA-7636 for SAMTEC 50 on targetrequires LA-7637 for SAMTEC 20 on targetincludes software for Windows, Linux and MacOSXrequires PowerTrace hardwareplease contact Lauterbach if the serial number ofyour PowerTrace is lower than E03010003982
LA-7630A NEXUS-MPC5500-AF-A
Debug/Trace Lic. for MPC5xxx NEXUS AutoFocusSupports debug/trace for MPC55xx/56xxapplied to a NEXUS Autofocus Adapterincludes debugger for single core and eTPUConcurrent debugging of both cores indual-core chip requires aLicense for Multicore Debugging (LA-7960X)(not necessary for lockstep mode)
LA-7631 CONV-MIC38-GENERIC
Conv. Mictor76 to Mictor38 (NEXUS AF)Converter from Mictor76 to Mictor38 for:LA-7630 (NEXUS Debugger/Trace for MPC5xxx AutoFocus)LA-7635 (NEXUS Debugger/Trace for MAC71xx AutoFocus)LA-7645 (NEXUS Debugger/Trace for AVR32 AutoFocus)
LA-7632 CONV-GL51-MPC5500
Conv. Mictor76 to Glenair51 MPC5xxx NAFAdapter from Mictor76 to Glenair51 for:LA-7630 (NEXUS Debugger/Trace for MPC5xxx AutoFocus)
LA-7633 CONV-MIC38-MPC5500R
Mictor76 to Mictor38 Right Angle (NEXUS AF)Converter from Mictor76 to Mictor38 for:LA-7630 (NEXUS Debugger/Trace for MPC5xxx AutoFocus)LA-7635 (NEXUS Debugger/Trace for MAC71xx AutoFocus)
LA-7636 CONV-MIC76-MPC5500-L
Conv. Mictor76 to Samtec50 MPC5xxx NAFConverter from Mictor76 to Samtec50 for:LA-7630 (NEXUS Debugger/Trace for MPC5xxx AutoFocus)LA-7635 (NEXUS Debugger/Trace for MAC71xx AutoFocus)
LA-7637 CONV-MIC76-MPC5500-S
Conv. Mictor76 to Samtec20 MPC5xxx (NEXUS AF)Converter from Mictor76 to Samtec20 for:LA-7630 (NEXUS Debugger/Trace for MPC5xxx AutoFocus)LA-7635 (NEXUS Debugger/Trace for MAC71xx AutoFocus)
LA-7638 CONV-MIC38-MPC5500-L
Conv. Mictor38 NEXUS to Samtec50 MPC5xxxConverter from Mictor38 to Samtec50 for:LA-7610 (NEXUS Debugger and Trace for MPC5xxx)
LA-7639 CONV-MIC38-MPC5500-S
Conv. Mictor38 NEXUS to Samtec20 MPC5xxxConverter from Mictor38 to Samtec20 for:LA-7610 (NEXUS Debugger and Trace for MPC5xxx)
Qorivva MPC5xxx/SPC5xx Debugger and NEXUS Trace 177 ©1989-2018 Lauterbach GmbH

LA-7641 CONV-SAM50-MPC5500-L
Conv. Samtec50 NEXUS to Mictor38 MPC5xxxConverter from Samtec50 to Mictor38 for:LA-7610 (NEXUS Debugger and Trace for MPC5xxx)LA-7630 (NEXUS Debug/Trace for MPC5xxx AutoFocus)
LA-7640 CONV-MIC76-JTAG14
Universal JTAG adapter for PowerPC architect.JTAG only converter from Mictor76, Mictor38,Samtec50, Samtec20 or JTAG14 to Mictor38,Samtec50, Samtec20 or JTAG14.(Not all connectors can be mounted atthe same time. Please refer to the FAQUniversal_JTAG-Adapter-LA-7640.pdf)Connector types for top and bottom side mustbe ordered explicitly!
LA-3725 CONV-MIC38-J14-5500
Conv. Mictor38 (NEXUS) to JTAG14 for MPC5xxxConverter Mictor38 (NEXUS) connector to 14 Pin JTAGon target for MPC5xxx
LA-3857 ET100-MPC5604BC
Adap. MPC5604BC-BGA208 to ET100 NEXUSConverter for- MPC5602B/3B/4B/2C/3C/4C (Bolero)adaptation fromET100-QF49 to BGA208 with additional Mictor38 NEXUSdebug connectorrequiresTO-1250 (Emul. Adapter for T0 socket ET100-QF49)
LA-3852 ET100-SPC560C50
Adap. SPC560C50-BGA208 to ET100 NEXUSConverter for- SPC560B40/B44/B50/C40/C44/C50 (Bolero)adaptation fromET100-QF49 to BGA208 with additional Mictor38 NEXUSdebug connectorrequiresTO-1250 (Emul. Adapter for T0 socket ET100-QF49)
LA-3856 ET144-MPC5604BC
Adap. MPC5604BC-BGA208 to ET144 NEXUSConverter for- MPC5602B/3B/4B/2C/3C/4C (Bolero)adaptation fromET144-QF63 to BGA208 with additional Mictor38 NEXUSdebug connectorrequiresTO-1310 (Emul. Adapter for T0 socket ET144-QF63)
OrderNo Code Text
Qorivva MPC5xxx/SPC5xx Debugger and NEXUS Trace 178 ©1989-2018 Lauterbach GmbH

LA-3851 ET144-SPC560C50
Adap. SPC560C50-BGA208 to ET144 NEXUSConverter for- SPC560B40/B44/B50/C40/C44/C50 (Bolero)adaptation fromET144-QF63 to BGA208 with additional Mictor38 NEXUSdebug connectorrequiresTO-1310 (Emul. Adapter for T0 socket ET144-QF63)
LA-3855 ET176-MPC5607BC
Adap. MPC5607BC-BGA208 to ET176 NEXUSConverter forMPC5605B/6B/7Badaptation fromET176-QF67 to BGA208 with additional Mictor38 NEXUSdebug connectorrequiresTO-1325 (Emul. Adapter for T0-socket ET176-QF67)
LA-3850 ET176-SPC560B64
Adap. SPC560B64-BGA208 to ET176 NEXUSConverter forSPC560B54/B60/B64 (Bolero)adaptation fromET176-QF67 to BGA208 with additional Mictor38 NEXUSdebug connectorrequiresTO-1325 (Emul. Adapter for T0-socket ET176-QF67)
LA-3854 ET176-SPC56ECXX
Adap. SPC56ECxx-BGA256 to ET176 NEXUSConverter for SPC56ECxx (Bolero3M)adaptation fromET176-QF67 to BGA256 with additional Mictor38 NEXUSdebug connectorrequiresTO-1325 (Emul. Adapter for T0-socket ET176-QF67)
LA-3853 ET176-MPC5646C
Adap. MPC5646C-BGA256 to ET176 NEXUSConverter for MPC5646Cxxx (Bolero3M)adaptation fromET176-QF67 to BGA256 with additional Mictor38 NEXUSdebug connectorrequiresTO-1325 (Emul. Adapter for T0-socket ET176-QF67)
OrderNo Code Text
Qorivva MPC5xxx/SPC5xx Debugger and NEXUS Trace 179 ©1989-2018 Lauterbach GmbH

OrderNo Code Text
LA-3911 PP-MPC57XX-HSTP
Preproc. Qorivva MPC57xx/SPC57XX HSTP HF-FlexAurora NEXUS Preprocessor for Qorivva MPC57xx/SPC57XX(high-speed serial trace port)- supports reference clock output up to 3125MHzPOWER TRACE II: full supportSupported speeds per lane:4 lanes @ 4.25Gbps3 lanes @ 6.0Gbps2 lanes @ 6.25Gbps1 lane @ 6.25GbpsPOWER TRACE ETHERNET or POWER TRACE PX limited supportSupported speeds per lane:4 lanes @ 1.25 GBPS2 lanes @ 2.5 GBPS- POWER TRACE ETHERNET module must have serial number E04xxxxxxxx or higherRequired converter:- Samtec34 on target requires LA-3871: Converter Samtec40 HSTP+AUTO26+JTAG14 to Samtec34 including Samtec 34-pin flex extension cable- Samtec22 on target requires LA-3872: Converter Samtec40 HSTP+AUTO26+JTAG14 to Samtec22 including Samtec 22-pin flex extension cable
LA-3911A PP-MPC57XX-HSTP-A
Trace Licence Qorivva MPC57xx/SPC57xx HSTPSupports Qorivva MPC57xx/SPC57XX Aurora NEXUS(high-speed trace port)please add the serial number of the preprocessor toyour order
LA-3871 CONV-SAM40/AUTO26-SA
Conv. Sam40 HSTP+AUTO26+JTAG14 to Samtec34Converter from JTAG14 ofLA-7753 (JTAG Debugger Qorivva MPC5xxx/SPC5xxx)and from AUTO26 ofLA-3736 (JTAG Debugger for MPC5xxx Automotive)and Samtec 40 pin ofLA-3911 (Preprocessor Aurora NEXUS Automotive)to Samtec ERF 34-pin Power.ORG pinoutIncludes Samtec 34-pin flex extension
LA-3872 CONV-SAM40/AUTO-SAM2
Conv. Sam40 HSTP+AUTO26+JTAG14 to Samtec22Converter from JTAG14 ofLA-7753 (JTAG Debugger Qorivva MPC5xxx/SPC5xxx)and from AUTO26 ofLA-3736 (JTAG Debugger for MPC5xxx Automotive)and Samtec 40 pin ofLA-3911 (Preprocessor Aurora NEXUS Automotive)to Samtec ERF 22-pin Power.ORG pinoutIncludes Samtec 22-pin flex extensionfor LA-3911 Preproc. Aurora NEXUSand if no separate JTAG/AUTO connector is availableon the target, forLA-7753 (JTAG Debugger Qorivva MPC5xxx/SPC5xxx)
Qorivva MPC5xxx/SPC5xx Debugger and NEXUS Trace 180 ©1989-2018 Lauterbach GmbH

Order Information
Order No. Code Text
LA-3736 DEBUG-MPC5XXX-AUTO JTAG Debugger for MPC5xxx AutomotiveLA-3738 DEBUG-MPC-TC-AUTO Debugger-Bundle MPC5xxx/TriCore AutomotiveLA-7753 DEBUG-MPC5500 JTAG Debugger Qorivva MPC5xxx/SPC5xxx (ICD)LA-7753A DEBUG-MPC5500-A JTAG Debugger for MPC5xxx (ICD) AdditionalLA-3723 CON-JTAG14-MICTOR Conv. 14 Pin JTAG to Mictor38 for MPC5xxxLA-3874 CON-AUTO26-MICTOR38 Conv. AUTO26 to MICTOR38 MPC5xxxLA-3875 CON-AUTO26-SAMTEC50 Conv. AUTO26 to Samtec50 MPC5xxxLA-3873 CON-AUTO26-JTAG14 Conv. AUTO26 to JTAG14 OnCELA-3876 CON-JTAG14-AUTO26 Conv. JTAG14 OnCE to AUTO26
Additional OptionsLA-3849 CON-AUTO26-JTAG16 Conv. AUTO26 to JTAG16-TriCoreLA-3843 CON-JTAG14/16-JTAG10 Conv. AUTO-26/OnCE14-PPC/JTAG16-TC to ECU14LA-3829 CONV-SAM40/22-TC Conv. Samtec40 to Samtec22 TriCore AGBTLA-3872 CONV-SAM40/AUTO-
SAM2Conv. Sam40 HSTP+AUTO26+JTAG14 to Samtec22
LA-3871 CONV-SAM40/AUTO26-SA
Conv. Sam40 HSTP+AUTO26+JTAG14 to Samtec34
LA-3501 GALVANIC-ISOLATION Galvanic Isolation for Debug CableLA-7844A JTAG-CORTEX_M-A JTAG Debugger License for Cortex-M Add.LA-7960X MULTICORE-LICENSE License for Multicore DebuggingLA-7756A OCDS-TRICORE-A Debugger for TriCore Standard AdditionalLA-3732A OCDS-XC800-A OCDS Debugger for XC800 AdditionalLA-7968X TRACE-LICENSE-
MPC57XTrace License Qorivva MPC57xx and SPC57x/58x
Order No. Code Text
LA-7630 NEXUS-MPC5500-AF NEXUS Debug/Trace for Qorivva MPC5xxx/SPC5xxxLA-7630A NEXUS-MPC5500-AF-A Debug/Trace Lic. for MPC5xxx NEXUS AutoFocusLA-7631 CONV-MIC38-GENERIC Conv. Mictor76 to Mictor38 (NEXUS AF)LA-7632 CONV-GL51-MPC5500 Conv. Mictor76 to Glenair51 MPC5xxx NAFLA-7633 CONV-MIC38-MPC5500R Mictor76 to Mictor38 Right Angle (NEXUS AF)LA-7636 CONV-MIC76-MPC5500-L Conv. Mictor76 to Samtec50 MPC5xxx NAFLA-7637 CONV-MIC76-MPC5500-S Conv. Mictor76 to Samtec20 MPC5xxx (NEXUS AF)LA-7638 CONV-MIC38-MPC5500-L Conv. Mictor38 NEXUS to Samtec50 MPC5xxxLA-7639 CONV-MIC38-MPC5500-S Conv. Mictor38 NEXUS to Samtec20 MPC5xxxLA-7641 CONV-SAM50-MPC5500-L Conv. Samtec50 NEXUS to Mictor38 MPC5xxx
Qorivva MPC5xxx/SPC5xx Debugger and NEXUS Trace 181 ©1989-2018 Lauterbach GmbH

LA-7640 CONV-MIC76-JTAG14 Universal JTAG adapter for PowerPC architect.LA-3725 CONV-MIC38-J14-5500 Conv. Mictor38 (NEXUS) to JTAG14 for MPC5xxx
LA-3857 ET100-MPC5604BC Adap. MPC5604BC-BGA208 to ET100 NEXUSLA-3852 ET100-SPC560C50 Adap. SPC560C50-BGA208 to ET100 NEXUSLA-3856 ET144-MPC5604BC Adap. MPC5604BC-BGA208 to ET144 NEXUSLA-3851 ET144-SPC560C50 Adap. SPC560C50-BGA208 to ET144 NEXUSLA-3855 ET176-MPC5607BC Adap. MPC5607BC-BGA208 to ET176 NEXUSLA-3850 ET176-SPC560B64 Adap. SPC560B64-BGA208 to ET176 NEXUSLA-3854 ET176-SPC56ECXX Adap. SPC56ECxx-BGA256 to ET176 NEXUSLA-3853 ET176-MPC5646C Adap. MPC5646C-BGA256 to ET176 NEXUS
Additional OptionsLA-1231 FLEXEXT-ERM-ERF-50 Flex Ext. for SAMTEC 50 pin ERM-ERF seriesLA-7960X MULTICORE-LICENSE License for Multicore Debugging
Order No. Code Text
LA-3911 PP-MPC57XX-HSTP Preproc. Qorivva MPC57xx/SPC57XX HSTP HF-FlexLA-3911A PP-MPC57XX-HSTP-A Trace Licence Qorivva MPC57xx/SPC57xx HSTPLA-3871 CONV-SAM40/AUTO26-SA Conv. Sam40 HSTP+AUTO26+JTAG14 to Samtec34LA-3872 CONV-SAM40/AUTO-SAM2 Conv. Sam40 HSTP+AUTO26+JTAG14 to Samtec22
Additional OptionsLA-7987 PP-PPC-QORIQ-HSTP Preproc. PowerPC QorIQ HSTP HF-FlexLA-3943A PP-RH850-HF-A Trace Licence RH850 HFLA-3912A PP-TRICORE-AGBT-A Trace License for TriCore AGBT
Order No. Code Text
Qorivva MPC5xxx/SPC5xx Debugger and NEXUS Trace 182 ©1989-2018 Lauterbach GmbH