quality of service indicators - ibnet english€¦ · web viewall coverage indicators are...
TRANSCRIPT

IBNET indicator definitions IBNET toolkit
INTERNATIONAL BENCHMARKING NETWORKWATER AND SANITATION UTILITIES
CONTEXT INFORMATION & INDICATORS – DEFINITIONS
Contents Page
Introduction 2
Definitions 3
Context information 4
Process indicators 6
A. Service coverage 8
B. Water consumption & production 9
C. Non revenue water 11
D. Meters 12
E. Network performance 13
F. Operating costs & staff 14
G. Quality of service 16
H. Billings & collections 18
I. Financial performance 20
J. Assets 21
K. Affordability / PPP 22
IBNET 08/05/23 1

IBNET indicator definitions IBNET toolkit
IntroductionThis is a reference document. It contains definitions of the indicators and context information contained in the IBNET data entry and indicator calculation files, and held on the IBNET database.
IBNET caters for a large number of indicators, all of which we believe to be useful. We recognize that the large number may be intimidating, requiring a lot of data and generating a lot of numbers to be understood. The indicators are primarily designed for utilities that distribute water and/or collect wastewater; and may also abstract and treat water and/or treat wastewater.
Normalizing factors
Many indicators have ‘normalising factors’, such as the volume of water sold in the indicator
11,3 Unit Operational Cost per m3 water sold
There are several different normalizing factors (see the table). In IBNET, the operating cost, staff, revenue and system failure indicators use one or more of population, number of connections, volume and network length. To allow IBNET users to convert from one normalizing factor to another, the context information includes:
- number of connections per km
- population served per connection
- volume of water used per person (this is indicator 4).
Normalizing factor Water services1
Sewerage services1
Water and sewerage combined1
Population served √ √ √Number of connections √ √ √Number of households √ √ √Volume of water sold √ ? √Volume of water produced ? × ×Length of network √ √ ×Volume of wastewater collected or treated
× √ ×
Population equivalent × √ ×Note 1. Operating costs, staff or revenue
IBNET 08/05/23 2

IBNET indicator definitions IBNET toolkit
Definitions
Water and Wastewater
In the tables, ‘water supply’ is sometimes abbreviated by an upper case W, and ‘wastewater’ or sewer/ sewerage/ sanitation by ‘WW’. The terms ‘sewerage’ and ‘sewer’ and ‘wastewater’ refer to waterborne sewer systems; ‘sanitation’ is a more general term that includes other forms of human waste disposal. All the numerical indicators in IBNET refer to sewerage.
This does not belittle the importance of other sanitation systems, but is due to the difficulty of defining numerical indicators for which utilities could be expected to provide data.
Process indicatorsThese contain information on whether or how a utility carries out certain processes, such as planning, staff management or customer relations. They are in the form of yes/no answers, or choice of one from a number of options.
Start-up indicatorsThere is a lot of data to be entered, so we have marked (with a green background) those fields in the data input file that we recommend companies new to benchmarking should fill in first. The indicators calculated using these fields are marked in this document by a .
IBNET 08/05/23 3

IBNET indicator definitions IBNET toolkit
Context information
1 Information
INFORMATION UNIT CONCEPT
Node CountryServices provided Water Wastewater Other
Yes / NoYes / NoYes / No Other services can be described as text
Extent of private sector involvement in operations
More than 50% belongs to the State, municipality or other public body
Type of service provider A to G A. Municipal water departmentB. Municipal water companyC. Regional water companyD. National water company
Nature of service area: urban, rural or mixedNumber of towns served with waterNumber of towns served with sewerageDensity of water connections #/kmDensity of sewer connections #/kmPopulation per water connectionPopulation per sewer connection Month in which fiscal year starts
month
2 Discussion
The context factors are distinct from indicators in that they are, in the short to medium term, beyond the influence of the Utility.
Information on the services provided is essential to interpreting the indicator values. The size of the Utility is also relevant, as large utilities can benefit from economies of scale.
The connection density indicates whether the area served by the utility is dense and urban, or more widely spread. In areas where many households are not yet connected, it helps to assess the likely costs and benefits of extending the network.
IBNET 08/05/23 4

IBNET indicator definitions IBNET toolkit
The population per connection helps to distinguish situations in which blocks of flats are supplied through a small number of connections, from those where each household has its own connection.
The fiscal year starts in different months in different countries. Ideally all data provided should be for the local fiscal years.
IBNET 08/05/23 5

IBNET indicator definitions IBNET toolkit
Process indicatorsInformation on how a Utility carries out its functions is provided through ‘process indicators’. IBNET provides for their use to describe planning, staff (human resources) management, oversight of the Utility, sources of finance and customer relations.
INDICATOR CATEGORIES
P.1 What best describes the utility’s planning process?
A. Setting budgets for next yearB. A multi-year plan that identifies
targets and resources for change and improvement
C. Neither of the above (Describe....)
The management of your utility undertakes the following:HR.1 Has a skills and training strategy for all staff?HR.2 Has an annual appraisal and target setting system for managers?HR.3 Has an annual appraisal and target setting system for all staff?HR.4 Has a reward and recognition programme for all staff?HR.5 Has the ability to recruit and dismiss staff (within an agreed plan)?
Yes / NoYes / No
Yes / No
Yes / No
Yes / No
R.1 Who has general oversight of the utility’s services and prices?
A. Local, regional or national government department
B. Independent board of stakeholdersC. Independent service & price
regulatorD. Other (Describe....)
What are the main sources of finance for investment?F.1 Grants or Government transfers to the utility?F.2 Borrowing from International Financial Agencies (multi or bi laterals)?F.3 Government owned banks?F.4 Commercial banks or bond holders?
Yes / NoYes / No
Yes / NoYes / No
C.1 Does the utility offer more than one level of service for household or shared water supplies?1
C.2 Does the utility offer more than one level of sanitation or sewerage service/ technology for households?2
Yes / No / Not applicable
Yes / No / Not applicable
IBNET 08/05/23 6

IBNET indicator definitions IBNET toolkit
C.3 Does the utility offer a flexible / amortized repayment option to spread the costs of connection to the water and/or sanitation network?C.4 – See 19.2How does the utility find out the views of its customers?C.5.1 Letters, telephone calls etc from customersC.5.2 Inviting customers’ views through radio, TV or other publicityC.5.3 Questionnaire surveyC.5.4 Other
Yes / No / Not applicable
Yes / NoYes / No
Yes / NoYes / No (Describe...)
Note 1. Excluding free standpipesNote 2. Excluding free public toilets
IBNET 08/05/23 7

IBNET indicator definitions IBNET toolkit
A. Service Coverage
A.1 Indicators
INDICATOR UNIT CONCEPT
1.1 Water Coverage % Population with easy access to water services (either with direct service connection or within reach of a public water point)/total population under utility’s nominal responsibility, expressed in percentage.
1.2 Water Coverage – Household Connections
% Sub-set of 1.1
1.3 Water Coverage – Public Water Points
% Sub-set of 1.1
2.1 Sewerage Coverage % Population with sewerage services (direct service connection)/total population under utility’s notional responsibility, expressed in percentage.
A.2 Discussion
Coverage is a key development indicator. All coverage indicators are impacted by whether the data on populations and household sizes is up to date and accurate. The need to estimate populations served by public water points may affect the confidence that can be placed in the water coverage measure. In the WHO Global Water Supply and Sanitation Assessment 2000, reasonable access was defined as ‘the availability of at least 20 litres per person per day from a source within one kilometre of the user’s dwelling’. However, we recommend that the population within 250m be used as a rule of thumb.
IBNET 08/05/23 8

IBNET indicator definitions IBNET toolkit
B. Water Consumption & Production
B.1 Indicators
INDICATOR UNIT CONCEPT
3.1 Water Production
3.2 Water Production
litres/person/ daym3/conn /month
Total annual water supplied to the distribution system (including purchased water, if any) expressed by population served per day & by connection per month.
4.1 Total Water Consumption
4.2 Total Water Consumption
litres/person/ daym3/conn /month
Total annual water sold expressed by population served per day & by connection per month
Water consumption split by customer type:4.3 Residential Consumption4.4 Industrial / commercial Consumption4.5 Consumption by Institutions & others4.6 Bulk treated supply
% Shows the split of total water consumption into 4 customer type categories
Residential consumption:4.7 Residential Consumption4.8 Residential Consumption – connections to mains supply4.9Residential consumption - public water points
litres/person/day
Shows the average water consumption of groups of people
B.2 Discussion
Theoretically the “best” water consumption indicator is expressed in terms of litres/person/day. However there are data problems. Particularly:
lack of accurate total consumption data (for example from universal metering)
poor quality, or out of date, census data
While the accuracy of service populations may need improvement, utilities are often more confident in the number of connections in their system. In addition water production figures may be known more reliably than those for water consumption.
To draw on these other sources of (potentially) more reliable data a number of indicators have been included. These will allow trending analyses to be undertaken within a utility. Inter utility comparisons will be more difficult, however, given the different mix of household sizes and
IBNET 08/05/23 9

IBNET indicator definitions IBNET toolkit
dwellings served by one connection. This is especially the case between utilities in different countries. Homogeneity of household size, and dwellings per connection, within a country will allow informed in-country comparisons to be made.
IBNET 08/05/23 10

IBNET indicator definitions IBNET toolkit
C. Non Revenue Water
C.1 Indicators
INDICATOR UNIT CONCEPT
6.1 Non Revenue Water6.2 Non Revenue Water6.3 Non Revenue Water
%m3/km/daym3/conn/day
Difference between water supplied and water sold expressed as a percentage of net water supplied; as volume of water “lost” per km of water distribution network per day; and volume of water “lost” per water connection per day.
C.2 Discussion
Non revenue water represents water that has been produced and is “lost” before it reaches the customer (either through leaks, through theft, or through legal usage for which no payment is made). Part of this can be saved by appropriate technical and managerial actions. It can then be used to meet currently unsatisfied demand (and hence increase revenues to the utility), or to defer future capital expenditures to provide additional supply (and hence reduce costs to the utility).
The IWA distinguish between non revenue water (%) and unaccounted for water, which does not include legal usage that is not paid for, and is usually measured in m3/conn/day. The difference is usually small, and here only non revenue water is used.
There is a debate as to the most appropriate measure of unaccounted for water. A percentage approach can make utilities with high levels of consumption, or compact networks, look to be better performing than those with low levels of consumption or extensive networks. To capture these different perspectives the reporting of three measures of unaccounted for water has become the norm.
IBNET 08/05/23 11

IBNET indicator definitions IBNET toolkit
D. Meters
D.1 Indicators
INDICATOR UNIT CONCEPT
7.1 Metering level % Total number of connections with operating meter/ total number of connections, expressed in percentage
8.1 % sold that is metered
% Volume of water sold that is metered/ Total volume of water sold, expressed in percentage
D.2 Discussion
Metering of customers is considered good practice. It allows customers the opportunity to influence their water bills, and provides utilities with tools and information to allow them to better manage their systems.
The indicators provide two separate perspectives on the issue, both of which are relevant in their own right. Taken together the indicators provide insights into the effectiveness of a metering installation strategy (the ratio of indicator (8)/(7) indicates the extent to which a utility is targeting large water users as the highest priority).
IBNET 08/05/23 12

IBNET indicator definitions IBNET toolkit
E. Network Performance
E.1 Indicators
INDICATOR UNIT CONCEPT
9.1 Pipe Breaks breaks/km/yr. Total number of pipe breaks per year expressed per km of the water distribution network
10.1 Sewer System Blockages
blockages/km/yr.
Total number of blockages per year expressed per km of sewers
E.2 Discussion
The number of pipe breaks, relative to the scale of the system, is a measure of the ability of the pipe network to provide a service to customers.
The rate of water pipe breaks can also be seen as a surrogate for the general state of the network, although it reflects operation and maintenance practices too. It must be recognized, however, that highly aggregated reporting can hide the fact that sections of the network may be perpetually failing, whilst much of the remainder is in reasonable condition. Break rates for different materials, diameters or time periods laid can show where breaks are concentrated.
Sewer blockages are, likewise, a measure of the ability of the sewer network to provide a service to customers. Blockages can reflect a number of issues including the effectiveness of routine operations and maintenance activities, the hydraulic performance of the network, and the general condition of the pipes.
Bursts include failures on mains, service pipes where they are the Utility’s responsibility, or at joints or fittings, that are found by visible signs of water, not through leak detection by Utility staff.
Sewer blockages include all blockages or collapses that occur in sewers or drains that are the Utility’s responsibility, whatever action is needed to clear them.
IBNET 08/05/23 13

IBNET indicator definitions IBNET toolkit
F. Operating Costs & Staff
F.1 Indicators
INDICATOR UNIT CONCEPT
11.1 Unit Operational Cost W&WW11.2 Unit Operational Cost W&WW
US$/m3 sold
US$/m3 produced
Total annual operational expenses1/Total annual volume sold.Total annual operational expenses1/Total annual water produced.
11.3 Unit Operational Cost – Water only11.4Operational Cost Split - % Water11.5Operational Cost Split - % Wastewater11.6 Unit Operational Cost – Wastewater
US$/m3 sold
%
%
US$/WW pop served
Annual water service operational expenses1/Total annual volume sold.
Split of the total cost into water and wastewater
Annual wastewater operational expenses1/ Population served
12.2 Staff W&WW/’000 W&WW conn.
12.1 Staff W/’000 W conn.
12.5 Staff WW/’000 WW conn
#/’000 W&WW conn#/’000 W conn#/’000 WW conn
Total number of staff expressed as per thousand connections
12.4 Staff W&WW/’000 W&WW pop served
12.3 Staff W/’000 W pop served12.6 Staff WW/’000 WW pop served
#/’000 W&WW pop served#/’000 W pop served#/’000 WW pop served
Total number of staff expressed as per thousand people served
12.7 Staff % Water12.8 Staff % Wastewater
%
13.1 Labor Costs vs Operational Costs
% Total annual labor costs (including benefits) expressed as a percentage of total annual operational costs.
13.2 Electrical Energy Costs vs Operational Costs
% Annual electrical energy costs expressed as a percentage of total annual operational costs.
14.1 Contracted-out service costs vs operational costs
% Total cost of services contracted-out to the private sector expressed as a percentage of total annual operational1 costs.
Note 1: Annual operating expenses exclude depreciation, interest and debt service
IBNET 08/05/23 14

IBNET indicator definitions IBNET toolkit
F.2 Discussion
Unit operational costs provide a “bottom line” assessment of the mix of resources used to achieve the outputs required. The preferred denominator related to operational costs is the amount of water sold. This ratio then reflects the cost of providing water at the customer take off point.
Lack of universal metering, doubtful accuracy of many household meters, and a focus in the past on water production, mean that an alternative measure of operational cost per cubic metre of water produced is also relevant in the short term.
Staff costs are traditionally a major component of operating costs. Understanding staffing levels can often give a quick guide to the extent of any over-manning in a water utility. While it is preferable to be able to allocate staff time to either water or wastewater services, this information is sometimes not available. Comparisons are best made between utilities which offer the same scope of service both in terms of total size, and mix of water and sewer service. Note that where outside contractors are used a lot (see indicator 14.1), staff number comparisons should take this into account.
The number of people served per connection varies from country to country, and from utility to utility, depending on the housing stock and different approaches to service connections. To facilitate international comparisons a denominator of populations served has also been included.
The relative importance of staff costs compared to total costs is captured in indicator 13.1. Utilities are often over staffed and this measure provides insights into the impact of possible changes in future staff numbers.
Electrical power costs are often important (indicator 13.2), for example where power has been very cheap and is not used efficiently.
Indicator 14.1 quantifies the degree to which outside (private) contractors are used to provide the utility service.
IBNET 08/05/23 15

IBNET indicator definitions IBNET toolkit
G. Quality of Service
G.1 Indicators
INDICATOR UNIT CONCEPT
15.1 Continuity of Service
Hrs/day Average hours of service per day for water supply.
15.2 Customers with discontinuous supply
% The % of customers with a water supply that is discontinuous during normal operation.
15.3 Quality of water supplied: nr of tests for residual chlorine
% of # required
The number of tests carried out on samples taken from the distribution system, as a % of the number required by the standard that applies. This may exceed 100%. Operational samples, or any others that were not taken to check compliance with the standard, are excluded.
15.4 Quality of water supplied: samples passing on residual chlorine
% The % of samples tested for residual chlorine that pass the relevant standard
16.1 Complaints about W&WW services
% of W&WW conn
Total number of W&WW complaints per year expressed as a percentage of the total number of W&WW connections
17.1 Wastewater – at least primary treatment
% Proportion of collected sewage that receives at least primary treatment, i.e. involving settlement with the intention of removing solids, but not biological treatment. Both lagoon and mechanical treatment can be included, where appropriate.
17.2 Wastewater primary treatment only
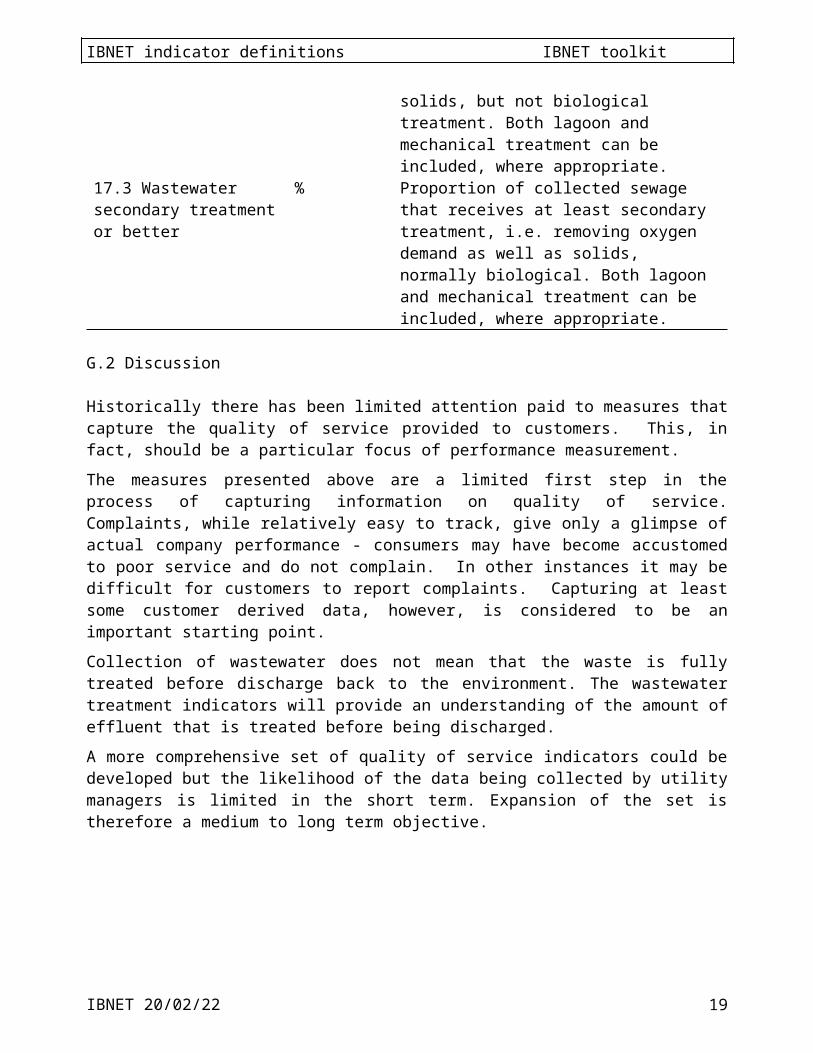
% Proportion of collected sewage that receives primary treatment only, i.e. involving settlement with the intention of removing solids, but not biological treatment. Both lagoon and mechanical treatment can be included, where appropriate.
17.3 Wastewater secondary treatment or better
% Proportion of collected sewage that receives at least secondary treatment, i.e. removing oxygen demand as well as solids, normally biological. Both lagoon and mechanical treatment can be included, where appropriate.
G.2 Discussion
Historically there has been limited attention paid to measures that capture the quality of service provided to customers. This, in fact, should be a particular focus of performance measurement.
IBNET 08/05/23 16

IBNET indicator definitions IBNET toolkit
The measures presented above are a limited first step in the process of capturing information on quality of service. Complaints, while relatively easy to track, give only a glimpse of actual company performance - consumers may have become accustomed to poor service and do not complain. In other instances it may be difficult for customers to report complaints. Capturing at least some customer derived data, however, is considered to be an important starting point.
Collection of wastewater does not mean that the waste is fully treated before discharge back to the environment. The wastewater treatment indicators will provide an understanding of the amount of effluent that is treated before being discharged.
A more comprehensive set of quality of service indicators could be developed but the likelihood of the data being collected by utility managers is limited in the short term. Expansion of the set is therefore a medium to long term objective.
IBNET 08/05/23 17

IBNET indicator definitions IBNET toolkit
H. Billings & Collections
H.1 Indicators
INDICATOR UNIT CONCEPT
18.1 Average Revenue W&WW18.2 Average Revenue W&WW
US$/m3 water soldUS$/W conn./yr.
Total annual W&WW operating revenues expressed by annual amount of water sold and by the number of connections.
18.3 Average Revenue – water only
US$/m3 water sold.
Operating revenues (W only) expressed by annual amount of water sold.
18.4 Revenue Split - % water18.5 Revenue Split - % wastewater
% of total for W&WW
% split of total revenue into water and wastewater
18.6 Water revenue – residential18.7 Water revenue – industrial/commercial18.8 Water revenue – institutions & others18.9 Water revenue – bulk treated supply
% of total water revenue
% split of water revenue by customer type
18.10 WW revenue US$/person served
Operating revenues (WW only) expressed per person served
19.1 Total revenues per service pop/GNI
19.2 Monthly water bill for a household consuming 6m3 of water per month through a household or shared yard tap (but excluding the use of standposts)?
% GNI per capita
US$/year
Total annual operating revenues per population served/National GNI per capita; expressed in percentageCost in local currency to a household per month of 6m3 water / Exchange rate with US$ * 12
20.1 Residential fixed component of tariff20.3 Residential fixed component of tariff - water20.4 Residential fixed component of tariff - wastewater
US$/conn./yr.Any fixed component of the residential tariff (total amount).Water & wastewater together, and separated if possible.
20.2 Residential fixed component of tariff20.5 Residential fixed component of tariff - water
% of average bill
Any fixed component of the residential tariff as a proportion of the average tariff per connection per year.Water & wastewater together, and separated if
IBNET 08/05/23 18
IBNET indicator definitions IBNET toolkit
20.6 Residential fixed component of tariff - wastewater
possible.
21.1 Ratio of industrial to residential tariff21.2 Ratio of industrial to residential tariff - water21.3 Ratio of industrial to residential tariff - wastewater
ratio The average charge (per m3) to industrial customers compared against the average charge (per m3) to residential customers.Water & wastewater together, and separated if possible.
22.1 Connection charge - water22.2 Connection charge - water22.3 Connection charge - sewerage22.4 Connection charge - sewerage
US$/conn
% GNI per capitaUS$/conn
% GNI per capita
The cost to make a residential pipe connection to the water system and the sewer system measured in absolute amount and as a proportion of national GNI per capita.
23.1 Collection Period Days (Year-end accounts receivable/Total annual operating revenues) * 365
23.2 Collection ratio % Cash income / Billed revenue as a %Note 1. W = water service, WW = wastewater / sewerage service
H.2 Discussion
Average tariffs need to be put in the perspective of affordability. Household income data, however, is not easy to obtain. The indicator selected here, therefore, compares average per capita tariffs as a proportion of per capita GNI. GNI will be for a whole country, and not reflect local variations, but is the most appropriate consistent measure available for most countries. Here the GNI should be that calculated using the Atlas method.
Some utilities use fixed charge components within the residential tariff (i.e. irrespective of the amount of water consumed). Such tariffs can adversely affect low volume water consumers. They also protect the revenue stream to the utility in periods when consumption is highly variable. Comparison of the fixed component with the average tariff will give an indication of the relative weight of the fixed and variable component of a water bill.
There may be a cross subsidy between industrial consumers and residential consumers. The ratio of the average charges (per m3) to industrial and residential customers provides some quantification of this subsidy. Subsidies are complex and this ratio provides only a simplistic assessment of the situation in any utility.
For many, the cost of connecting to the pipe network can be a significant financial hurdle. Comparing connection charges will provide insights into the level to which this hurdle has been raised. It is a particular issue when seeking to connect poorer sections of the community. The indicator provides the absolute level and as a proportion of national GNI per capita.
IBNET 08/05/23 19

IBNET indicator definitions IBNET toolkit
Billing customers, and getting paid are two different things. The effectiveness of the collections process is measured by the amount of outstanding revenues at year end compared to the total billed revenue for the year, in day equivalents, and by the total amount collected as a % of the billed amount.
IBNET 08/05/23 20

IBNET indicator definitions IBNET toolkit
I. Financial Performance
I.1 Indicators
INDICATOR UNIT CONCEPT
24.1 Operating Cost Coverage
ratio Total annual operational revenues/Total annual operating costs
25.1 Debt Service Ratio % Cash income / Debt service * 100
I.2 Discussion
These two indicators have been selected from a much larger range of financial indicators (which include leverage, liquidity, profitability and efficiency ratios). They help answer two important questions:
Do revenues exceed operating costs?
And
Does the utility’s income enable it to service its debts?
IBNET 08/05/23 21

IBNET indicator definitions IBNET toolkit
J. Assets
J.1 Indicators
INDICATOR UNIT CONCEPT
27.1 Gross Fixed Assets – water & wastewater
US$/W&WWpop served
Total gross fixed W&WW assets per W&WW populations served.
27.2 Gross Fixed Assets - water27.3 Gross Fixed Assets - wastewater
US$/W pop servedUS$/WW pop served
Total gross fixed assets per population served, separately for water (W) and wastewater (WW).
J.2 Discussion
Gross fixed assets are defined to include work in progress.
The capital intensity of the utility is indicated by the gross fixed asset value per capita served. Unfortunately there is often limited information available about asset values and until more emphasis is placed on this item the values derived must be treated with caution.
No investment indicators are included. This reflects the difficulty of making meaningful comparisons at this high level between utilities whose situations and investment needs differ very widely. At a more detailed level, comparisons of unit costs for particular items of equipment can be very useful; this is beyond the scope of IBNET.
IBNET 08/05/23 22

IBNET indicator definitions IBNET toolkit
K. Affordability/PPPGross National Income (GNI) can be converted from the local currency to US$ in two ways:
a) Using the official exchange rate,
b) Using purchasing power parity.
Purchasing Power Parity (PPP) takes account of what can be bought locally, and should be considered for indicators of what customers pay. These indicators are:
18,1 Average Revenue W&WW US$/m3 water sold18,2 Average Revenue W&WW US$/W conn/year18,3 Average Revenue - water only
US$/m3 water sold
19,1 Total Revenues per Service Pop/GNI
% GNI per capita
19.2 Monthly water bill for a household consuming 6m3 of water per month through a household or shared yard tap (but excluding the use of standposts)?
% GNI per capita
20,1 Residential Fixed Component of Tariff
US$/conn/yr
20,3 Residential Fixed Component of Tariff - water
US$/conn/yr
20,4 Residential Fixed Component of Tariff - wastewater
US$/conn/yr
22,1 Connection Charge - water US$/conn22,2 Connection Charge – water % GNI per capita22,3 Connection Charge – sewerage
US$/conn
22,4 Connection Charge – sewerage
% GNI per capita
IBNET 08/05/23 23

IBNET indicator definitions IBNET toolkit
L. New Indicators
L.1 Indicators
INDICATOR UNIT CONCEPT
30,1 Capacity Utilization: m3 produced over maximum possible30,2 Electricity Consumption per m3 Sold
%
kWh/m3
30,3 Electricity Consumption per m3 of wastewater
kWh/m3
30,4 Percentage of operational costs that are maintenance30,5 Average cost of each repair
%
US$/repair
30,6 Average depreciation ratio of assets30,7 Average depreciation ratio of water assets30,8 Average depreciation ratio of wastewater assets30,9 Percentage of government transfers over total operating revenues
%
%
%
%
40,1 Percentage of female staff40,2 Percentage of women who are engineer over total employees40,3 Average Women Salary
%%
US$/year
40,4 Capacity Utilization: treated wastewater over maximum amount of treated wastewater possible
%
IBNET 08/05/23 24