quantification of soil contaminant extraction - avs - home · 2015-01-07 · quantification of soil...
TRANSCRIPT
Quantification of Soil Contaminant Extraction
Mrs. Jacqueline G. Kane St. Ursula Academy Toledo, Ohio 43606
[email protected] Abstract: The challenge of toxic liquid contaminated subsurface site remediation represents a practical combination of vacuum science and technology principles. High school students will model this connection by exploring the relationship between principles of low pressure environments and the vaporization and extraction of ground contaminants in a process called soil vapor extraction (SVE). SVE technology is an accepted method for removing volatile organic compounds (VOC) from a permeable non-saturated subsurface material. With a reduction of the subsurface contamination site environment pressure, the partial pressures associated with the soil components and liquid contaminates shift the molecular composition of the soil air. Continued vacuum extraction establishes a Le Chatlier steady state environment that forces the volatilization and ultimate removal of the pure liquids. In this demonstration, 6 M acetic acid is used as a VOC demonstration molecule. It is volatile so reduction in pressure effectively increases vaporization. Acetic acid is inexpensive and usually stocked in high School equipment rooms. Being a weak acid, it is fairly safe to use as long as safety procedures are followed. Additionally, the detection and measurement of the extracted vapor requires skills and knowledge consistent with high school course objectives and the national science standards. As a demonstration, it is applicable to Earth, Environmental and Physical Sciences and is easily adapted to 7-12 curriculum levels. As a "hand-on" activity the demonstration exercises and expands student skills in laboratory procedures, data acquisition and analysis, and graphic presentation using computer spreadsheets. An ultimate benefit is a clear connection in the student's mind between an abstract physiochemical property and a real world environmental management application. Since SVE is an application that students may witness in their own communities, the demonstration is a segue to the political, economic, social aspects of this technology's application.

I. Purpose and Discussion The purpose of this demonstration is to model the Soil Vapor Extraction Process (SVE). SVE is a well-accepted, in situ, soil remediation process that removes highly volatile organic contaminants from permeable, non-saturated, subsurface material. The problem with leaving the contaminant in the ground is that it eventually contaminates ground water, volatizes and seeps into basements, and, in the case of landfills, vaporizes until it is potentially explosive In SVE, air pressure in the soil is reduced, which disturbs the equilibrium between the liquid contaminant and its vapor phase in the soil gas causing more contaminant to vaporize. The vaporized contaminant can now be extracted with the pump.
The properties of the soil, pollutant, and the environment of the extracted zone control the effectiveness of SVE.
1 Although the process is quite complex, this demonstration minimizes the effect of several variables so
that the basic idea can be demonstrated. In a real SVE application, toxic non-aqueous phase liquid (NAPL), is extracted; in this demonstration, a low molarity weak acid, HC
2H
3O
2 , (HAc) is used for safety reasons. In real
applications, the subsurface is likely to be a mixture of different soils and permeability, where as in this demonstration, homogenous grain size sand is used. In the subsurface, colder temperatures affect removal rates; in this demonstration, temperature is assumed to be room temperature. By drawing the air directly through the contaminated sand, the pressure gradient variable is minimized. Since soil moisture reduces the effectiveness of the process, dry sand is used in the tube although the contaminated sand’s liquid effects air flow. Low molarities acetic acid and sodium hydroxide are used to simplify the chemistry, to keep chemical danger low, and to produce no toxic fumes. To reduce implosion risks, the vacuum of 5-11 inches Hg is maintained.
This demonstration is of interest to controlled pressure environment study because it demonstrates the
principle that establishing a reduce air pressure environment will increase vaporization. The concepts of energy balances and equilibrium can be addressed through the Le Chatelier's Principle
2.. Vapor pressure concepts are
introduced with Henry’s Law3 and Avogadro’s Law
4.
To quantify the amount of pollutant removed, NaOH is titrated with the extracted HC
2H
3O
2 vapor using
phenolphthalein as an indicator. Because the mass balance equation indicates a one-to one molar ration, it is possible to determine the amount of acetic acid extracted through titration. Mass transfer rates are related to one model used to predict and determine mass transfer using SVE: M/t = QC
air.5
Safety concerns: Goggles are worn at all times and hands must be washed if molecule contact is made. Chemicals used in this demonstration include low molarities HC
2H
3O
2 (acetic acid) and NaOH. Neither is
particularly dangerous in the low molarity concentrations proposed, particularly since proper laboratory and chemical-handling procedures must be employed.
6 Glass tubing is covered with rubber tubing or is within a
plastic bottle. The only exposed glass is with the gauges and purge meter. The demonstration can be completed with equipment and supplies usually stocked in a high school science equipment room.
1 P 27 http://www.soe.uoguelph.ca/webfiles/rzytner/HazWaste/soil_overview_03.pdf
2 Le Chatelier's Principle: When a system at equilibrium is disturbed, the equilibrium conditions shift to counteract the
disturbance. 3 Henry's law the concentration of a solute gas in a solution is directly proportional to the partial pressure of that gas above
the solution.
4 Avogadro's Law states that under conditions of constant pressure and temperature, there is a direct relationship between the
volume and number of moles for an ideal gas. 5 http://www.epa.gov/OUST/pubs/tum_ch2.pdf
http://www.bren.ucsb.edu/fac_staff/fac/keller/courses/esm223/SuthersanCh03SVE.pdf 6 For information on secondary science safety rules and procedures see:
http://www.bced.gov.bc.ca/irp/resdocs/scisafe/moescisaf.pdf
National Science Content Standards Addressed:
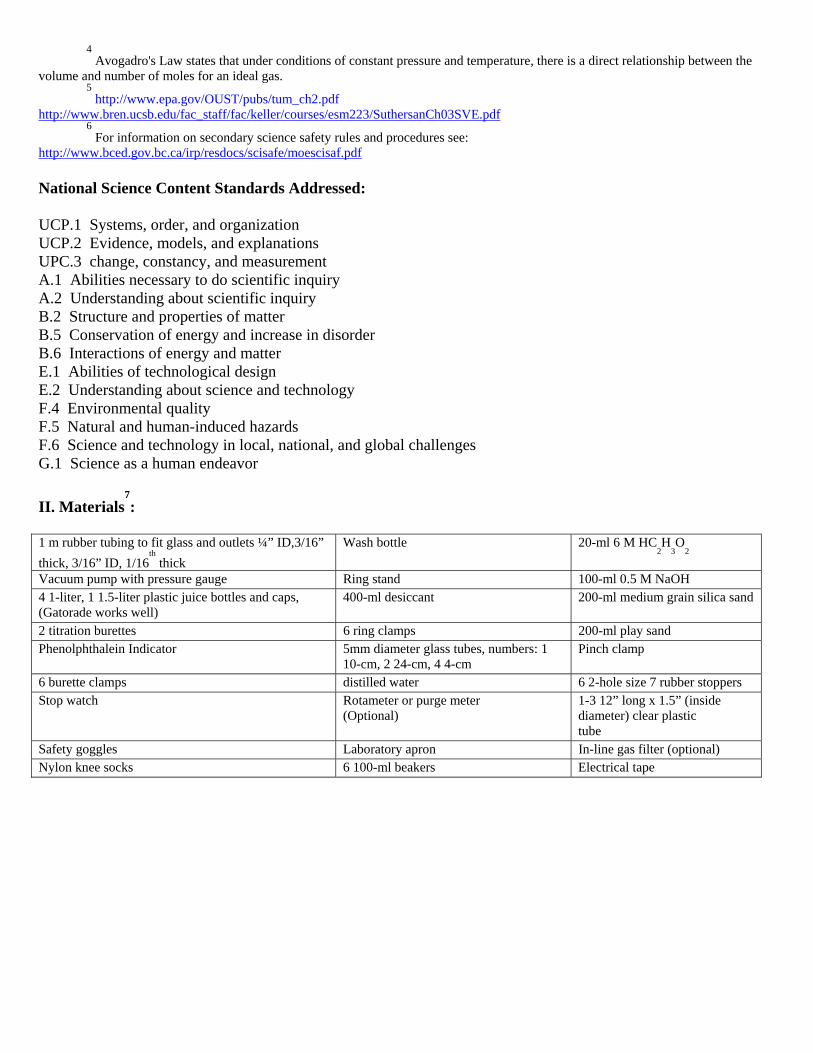
UCP.1 Systems, order, and organization UCP.2 Evidence, models, and explanations UPC.3 change, constancy, and measurement A.1 Abilities necessary to do scientific inquiry A.2 Understanding about scientific inquiry B.2 Structure and properties of matter B.5 Conservation of energy and increase in disorder B.6 Interactions of energy and matter E.1 Abilities of technological design E.2 Understanding about science and technology F.4 Environmental quality F.5 Natural and human-induced hazards F.6 Science and technology in local, national, and global challenges G.1 Science as a human endeavor II. Materials
7:
1 m rubber tubing to fit glass and outlets ¼” ID,3/16” thick, 3/16” ID, 1/16
th thick
Wash bottle 20-ml 6 M HC2H
3O
2
Vacuum pump with pressure gauge Ring stand 100-ml 0.5 M NaOH 4 1-liter, 1 1.5-liter plastic juice bottles and caps, (Gatorade works well)
400-ml desiccant 200-ml medium grain silica sand
2 titration burettes 6 ring clamps 200-ml play sand Phenolphthalein Indicator 5mm diameter glass tubes, numbers: 1
10-cm, 2 24-cm, 4 4-cm Pinch clamp
6 burette clamps distilled water 6 2-hole size 7 rubber stoppers Stop watch Rotameter or purge meter
(Optional) 1-3 12” long x 1.5” (inside diameter) clear plastic tube
Safety goggles Laboratory apron In-line gas filter (optional) Nylon knee socks 6 100-ml beakers Electrical tape
7 Many of these items can be substituted with other equipment and materials.
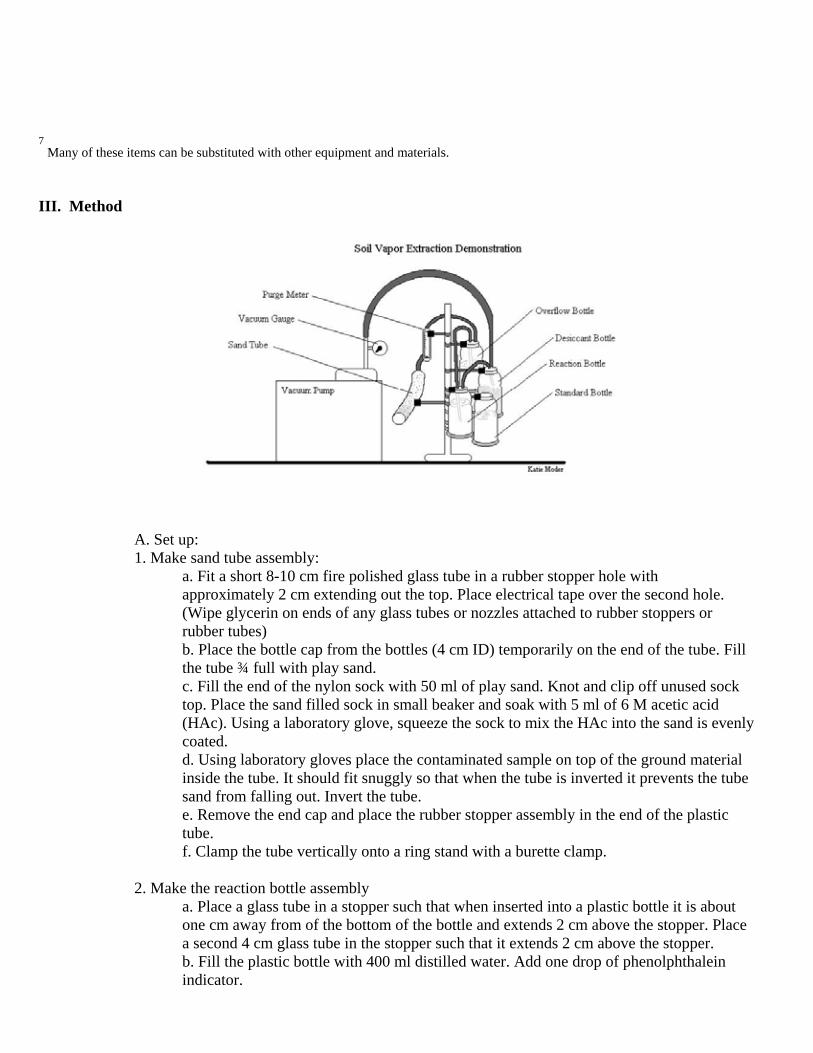
III. Method
A. Set up: 1. Make sand tube assembly:
a. Fit a short 8-10 cm fire polished glass tube in a rubber stopper hole with approximately 2 cm extending out the top. Place electrical tape over the second hole. (Wipe glycerin on ends of any glass tubes or nozzles attached to rubber stoppers or rubber tubes)
b. Place the bottle cap from the bottles (4 cm ID) temporarily on the end of the tube. Fill the tube ¾ full with play sand.
c. Fill the end of the nylon sock with 50 ml of play sand. Knot and clip off unused sock top. Place the sand filled sock in small beaker and soak with 5 ml of 6 M acetic acid (HAc). Using a laboratory glove, squeeze the sock to mix the HAc into the sand is evenly coated.
d. Using laboratory gloves place the contaminated sample on top of the ground material inside the tube. It should fit snuggly so that when the tube is inverted it prevents the tube sand from falling out. Invert the tube.
e. Remove the end cap and place the rubber stopper assembly in the end of the plastic tube.
f. Clamp the tube vertically onto a ring stand with a burette clamp.
2. Make the reaction bottle assembly a. Place a glass tube in a stopper such that when inserted into a plastic bottle it is about
one cm away from of the bottom of the bottle and extends 2 cm above the stopper. Place a second 4 cm glass tube in the stopper such that it extends 2 cm above the stopper.
b. Fill the plastic bottle with 400 ml distilled water. Add one drop of phenolphthalein indicator.
c. Slowly add one drop at a time of 0.5 M NaOH (solution turns pink and then clear) and swirl until the pink color just barely disappears. This means that the pH is at the colorimetric endpoint of phenolphthalein (8.3 pH) . (If too much is added, it can be neutralized to the endpoint buy running the experiment briefly before the measured NaOH is added)
d. Place the stopper assembly in the reaction bottle. e. Place the reaction bottle assembly on a ring clamp on the ring stand and secure with a
burette clamp. f. Place a white paper under and behind the bottle so that color changes can be observed
well.
3. Make the desiccant bottle assembly. a. Place a glass tube in a stopper such that when inserted into the plastic bottle it is about
a cm away from of the bottom of the bottle and extends 2 cm above the stopper. Place a second 4 cm glass tube in the stopper such that it extends 2 cm above the stopper.
b. Cover the inside end of the short tube with a piece of silk cloth using electrical tape to prevent desiccant from traveling into pump and or use an in-line gas filter
c. Fill the plastic bottle ¾ full of desiccant. d. Place the stopper assembly on the desiccant bottle. e. Place the desiccant assembly on a ring clamp on the ring stand and secure with a
burette clamp.
4. Make the overflow bottle: a. Make a rubber stopper assemble with two 4 cm glass tubes extending 2 cm above the
stopper. b. Place the stopper assemble in bottle. c. Place the overflow bottle assembly on a ring clamp on the ring stand and secure with a
burette clamp.
5. Make a standard bottle (to compare reaction bottle neutralization point): a. Fill a bottle ¾ full with distilled water. b. Place the comparison bottle on a ring clamp on the ring stand adjacent to the reaction
bottle and secure with a burette clamp.
6. Optional: attach the purge meter to the ring stand with a burette clamp. See step B below. 7. Connect parts together with rubber tubes
8:
a. Connect pump to desiccant bottle. b. Connect the desiccant bottle to the short glass tube in the reaction bottle. c. Connect the long glass tube in the reaction bottle to the overflow bottle. d. Connect the overflow bottle to the purge meter. e. Connect the overflow bottle to the ground material tube.
8. In lieu of purge meter: Determine the air flow rate through the set up by measuring the time it takes to deflate a gallon size inflated plastic bag attached to the sand tube bottom
a. Seal a 1 gal plastic bag with electrical tape. b. Insert a straw in one corner and tape air tight with electrical tape. c. Cut one corner of the bag and tape to the sand tube bottom. d. Using a mechanical pump inflate the plastic bag and seal straw end.
9
e. Turn on the vacuum pump, keeping the vacuum the same as the vacuum used in the experiment and record the deflation time.

f. Calculate the airflow rate as volume/deflation time. Convert to l/min. http://www.onlineconversion.com
B. Experiment: Determine the mass removal rate of acetic acid through various grain size sand beds
using the SVE model. 1. Unstop and lift stopper assemble in reaction bottle so NaOH can be added. 2. Add 0.4 ml 0.5 M NaOH to the reaction bottle using a pipette, so that no NaOH spills on
bottle sides. Solution should turn pink. Replace stopper assembly. 3. Check all connections and stoppers for air leaks. 4. Turn on vacuum pump and start stopwatch while making sure pressure gauge stays
constant and below 11 inches Hg. Measure the time it takes for the reaction flask solution to reach the endpoint. Record minutes and seconds as minutes. (1 minute 30 seconds = 1.50 minutes.)
5. Repeat steps as desired for data reliability and to observe trends. 6. Optional: Repeat the set up and experiment with different ground material and/or replace
the vacuum pump with an aspirator. 7. Option: Run experiment using distilled water and universal indicator with or without pH
probes.
8 Use different size rubber tubing to connect the rubber tubing to various nozzles and glass tubes.
9 Blowing it up will add CO
2 to the air and interfere with the acid base reaction in the experiment.
IV Results And Analysis Variables:
M = mass removed (moles/l) C
w = concentration of contaminant in the water in bed (moles/l)
Cair
= concentration of the contaminant in vapor (moles/l)
KH = Henry’s constant (dimensionless) K
H for HAc is 4.09 E-6 (expressed for C
a/C
w at 25
o C)
Q = airflow through system (l/min) Givens:
Vacuum
pump: between 635-762 torr (5-10 in Hg gauge reading)

Vacuumaspirator
: unknown Concentration Acetic Acid (HAc): 6 M Concentration NaOH: 0.5 M V
HAc: 5 ml (0.005 l)
VNaOH
: 0.4 ml = (0.0004 l) Deflation time for vacuum pump only: 21.03 l/min Deflation time for aspirator only: 25.24 l/min
Assumptions:
1. Temperature remains constant and at room temperature 2. Changes in the soil or contaminant caused by vaporization do not affect results significantly 3. Air viscosity and air density changes do not affect data. 4. Soil moisture is low. 5. Aspirator pressure is constant. 6. All HAc vapor reacted completely in the reaction bottle. 7. pH and Concentration of HAc in the sand remained constant or any change is not a critical variable. 8. There is little or no chemical reaction between the HAc vapor and the particles.
Parameters: Modeling Parameters Operational Parameters Henry’s constant Vacuum pressure Air flow Air flow Contaminant concentrations Bed particle grain size Equations: HC
2H
3O
2 +NaOH H
2O + Na + C
2H
3O
2
(Conc
1) (V
1) = Conc
2) (V
2)
Model
10:
M/t = QCair
mass removed/time = airflow * concentration of HAc in the air = Q KHC
water
Cair
= KHC
water concentration of HAc in the air = airflow * Henry’s constant * concentration of HAc in the
water M/t = Q K
HC
water
Graph 1 Model Mass Removal Rate And Airflow For Different Sand And Bead Beds

10
http://www.soe.uoguelph.ca/webfiles/rzytner/HazWaste/soil_overview_03.pdf Experimental Data: Mass removal = 0.0002 moles HAc / titration Data and Graphs: Graph 2 Experimental Mass Removal Rate For Different Sand and Bead Beds

Graph 3 Comparison of Experimental Data with Model Values

Graph 4 Comparison Between Mass Removal Time and Air Flow for Three Types of Beds at Two
Different Pressures
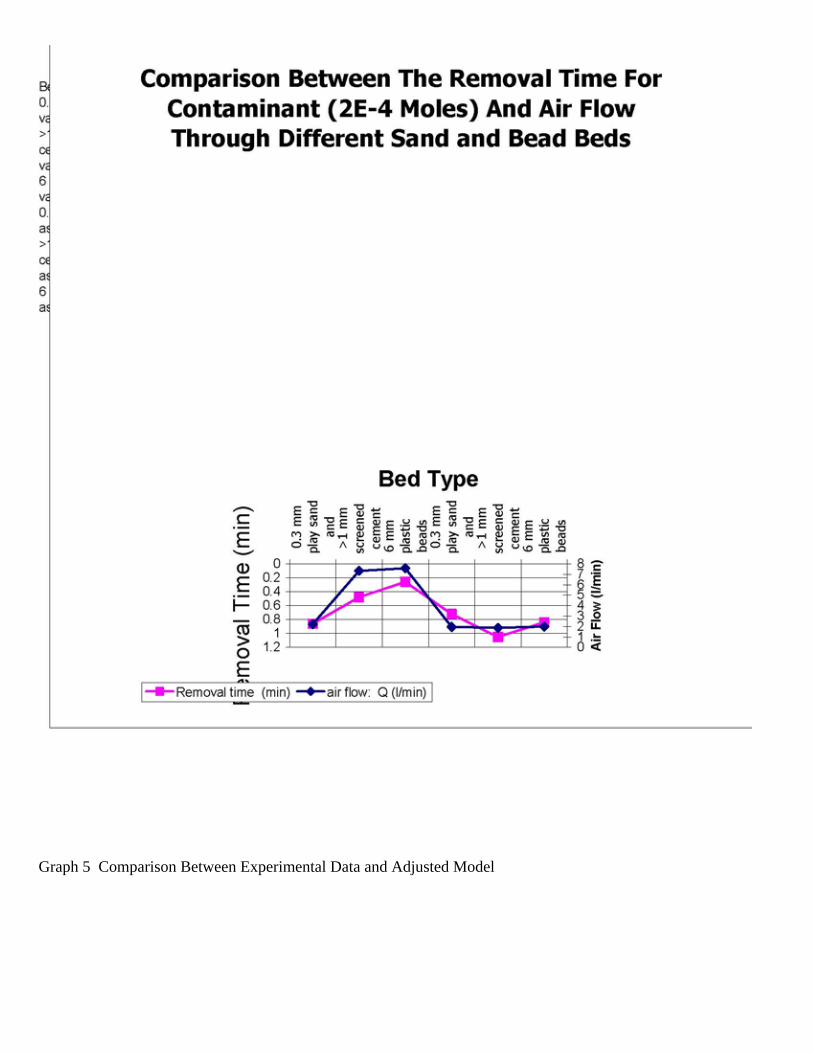
Graph 5 Comparison Between Experimental Data and Adjusted Model

Graph 6 Mass Removal Rate per Titration For Different Sand and Bead Beds

t

Graph 7 Mass Removal Rate per Titration For Screened Cement Sand and Vacuum Pump With Extended Number Titrations
Table 1: Conversion l/min to scfh
11 (purge meter)
12

Analysis: 1. As shown in Graph 1: “Model Mass Removal Rate For Different Beds,” The model predicts a direct
relationship between the mass removal rate and the airflow. 2. As shown in Graph 2: “Experimental Mass Removal Rate For Different Sand and Bead Beds,” the
experimental data shows that the mass removal rates increased with an increase in particle size using the vacuum pump. The mass removal rate was about the same for all bed types using the aspirator.
3. As shown in Graph 3: “Comparison Of Experimental Data With Model Values,” the experimental data
shows the same trend that the model predicts. 4. As shown in Graph 4: “Comparison Between Mass Removal Time and Air Flow for Three Types of Beds at
Two Different Pressures,” airflow using the vacuum pump was significantly larger with larger grain size. Airflow was not significantly larger with larger grain size using the aspirator. Literature indicates that the two most influential factors contributing to mass removal is permeability and airflow. Particle size effects permeability and air flow
13.
5. As shown in Graph 5: “Comparison Between Experimental Data And Adjusted Model,” if the model is
adjusted by a factor of 4.398, the adjusted model predicts the experimental data well. 6. Graph 6: “Mass Removal Rate Per Titration For Different Sand And Bead Beds,” shows that the mass
removal rate initially was not constant. Each bed type showed an increase removal rate for the first few titrations before the rate became constant. Factors accounting for this initial change may include, time for the air to become saturated with the contaminant vapor, unequal contaminant vaporization due to different water and acetic acid boiling points, temperature changes due to the evaporation process, or variances in the obedience of acetic acid to the gas laws.
14 A constant removal rate indicates that the air concentration was
constant if the temperature did not change (assumption) 7. In graph 7: “Mass Removal Rate Per Titration For Screened Cement Sand And Vacuum Pump With
Extended Number Titrations,” indicates that all the contaminant would be removed in 51 minutes if the mass removal rate remained constant. However, after 34 minutes the end point titration time had decreased from a maximum of 2.0E-4 moles HAc per 28 seconds to a low of 2.0E-4 moles HAc per 1.58 minutes. Therefore it would take longer to remove all the contaminant. The reduced removal rate is well documented in SVE applications.
15
The amount of mass removed is very small and that the number of variables influencing the mass removal rate is large. Because a value for the concentration of contaminant in the air could not be measured experimentally, Henry’s constant was used. Henry’s constant is applicable only to states of equilibrium between the concentration of contaminant in the water and the concentration of contaminant in the vapor phase directly above the liquid-vapor boundary. However, it is used to provide a rough estimate of removal rate in

actual SVE sites. In this demonstration, using Henry’s constant predicted a lower removal rate than was removed.
A second model used in packed beds was applied to see if it could predict the data. The model shows an
inverse relationship to the experimental data. The model predicted that a larger grain size would yield a lower removal rate. Several possible factors may be responsible for this discrepancy. The grains are not spheres. The amount of actual surface area is hard to determine because of cohesion,
16 adsorption,
17 and surface tension of
the liquid and between the liquid and the particles. 11
standard cubic feet per hour 12
airflow is controlled by vacuum pressure. Therefore, if a different vacuum is applied in other experiments, different airflow rates for different bed types will be measured than what is reported here., 13
http://chemelab.ucsd.edu/sve/index.html , http://www.soe.uoguelph.ca/webfiles/rzytner/HazWaste/soil_overview_03.pdf 14
http://pedia.nodeworks.com/A/AC/ACE/Acetic_acid “As a vapor, acetic acid does not consist of individual acetic acid molecules. Instead, it consists mostly of pairs of acetic acid molecules hydrogen bonded to one another. As a result, acetic acid vapors behave in a way that grossly violates the ideal gas law .” Graph 8 Mass Remoal Rate Using A Packed Beds Equation
18
15
http://www.soe.uoguelph.ca/webfiles/rzytner/HazWaste/soil_overview_03.pdf 16
the attraction between two dissimilar species. 17
The property of a solid or liquid to attract and hold to its surface a gas, liquid, solute, or suspension. 18
McCabe and others, Unit Operations of Chemical Engineering, fifth ed., McGraw-Hill

VI Conclusion The contaminant, acetic acid, can be extracted qualitatively and quantitatively from a soil medium the titration process in this demonstration. A Model, often used in SVE, using Henry’s constant to qualitatively determine mass removal rates, is good beginning point as shown in Graph 3 Comparison of Experimental Data with Model Values. Working backwards from the experimental data established a factor that would adjust the model to fit the data. As with all SVE sites, to predict how long it will take to remove the contaminant, the application of a model to each environment with a unique set of parameters, requires a unique multiplying factor. A good web based simulated titration exercise by Yue-Ling Wong allows students to perform virtual titrations and calculations as the see the titration curve drawn form them. http://www.wfu.edu/~ylwong/chem/titrationsimulator