quantifying tradeoffs between ecology, economy and climate in the northern california current...
Post on 21-Dec-2015
214 views
TRANSCRIPT

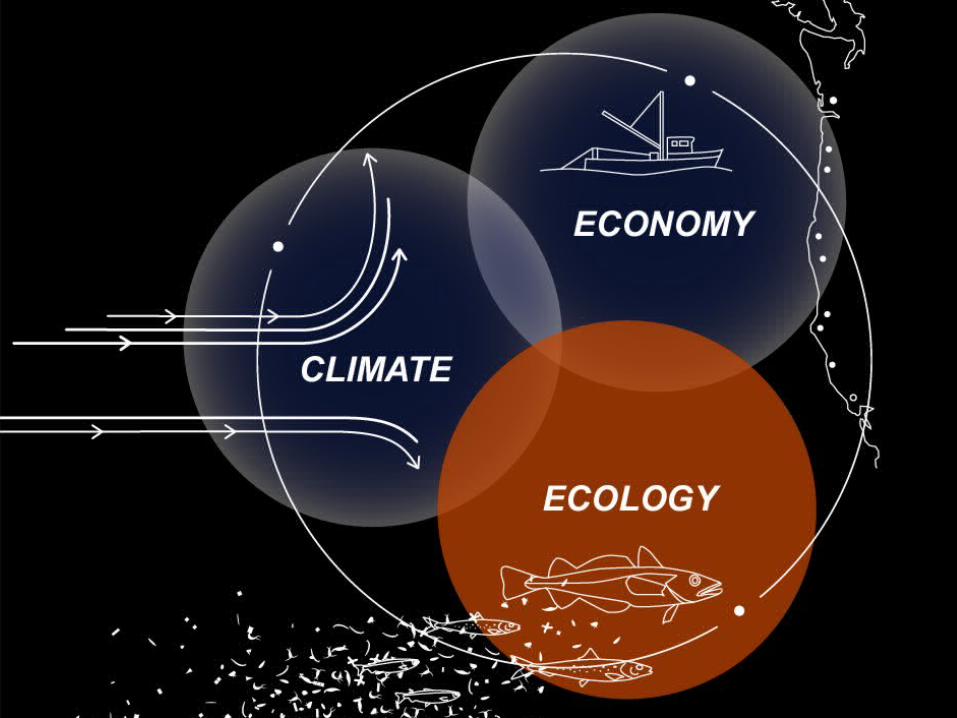
Quantifying tradeoffs between ecology, economy and climate in the Northern California Current Ecosystem
Jodie E. Little1, R.C. Francis1, M.G. Dalton2 and J.C. Field3
1School of Aquatic & Fishery Sciences, University of Washington, Seattle, WA
2AFSC, NMFS, NOAA, Seattle, WA3Santa Cruz Laboratory, NMFS, NOAA, Santa Cruz, CA

Wash.
Oregon
California
Northern California Current Ecosystem (NCCE)


1960 2000


-
10
20
30
40
ma
mm
als
bir
ds
salm
on
flatfi
sh
rock
fish
rou
nd
fish
ha
ke
fora
ge
fish
cru
sta
cea
ns
zoo
pla
nkt
on
BIO
MA
SS
(m
t/k
m2
)
82.4BIOMASS
-
20
40
60
80
salm
on
tro
ll
fixe
d g
ea
r
bo
ttom
tra
wl
ha
ke tr
aw
l
cra
b p
ot
shri
mp
tra
wl
RE
VE
NU
E (
mill
ion
$)
REVENUE
Baseline: year 2000

how do ecology and economy respond to…
1. different CLIMATE
2. additional FISHING effort
3. CLIMATE & FISHING
*all scenarios for year 2000 and year 1960 systems*
SCENARIOS

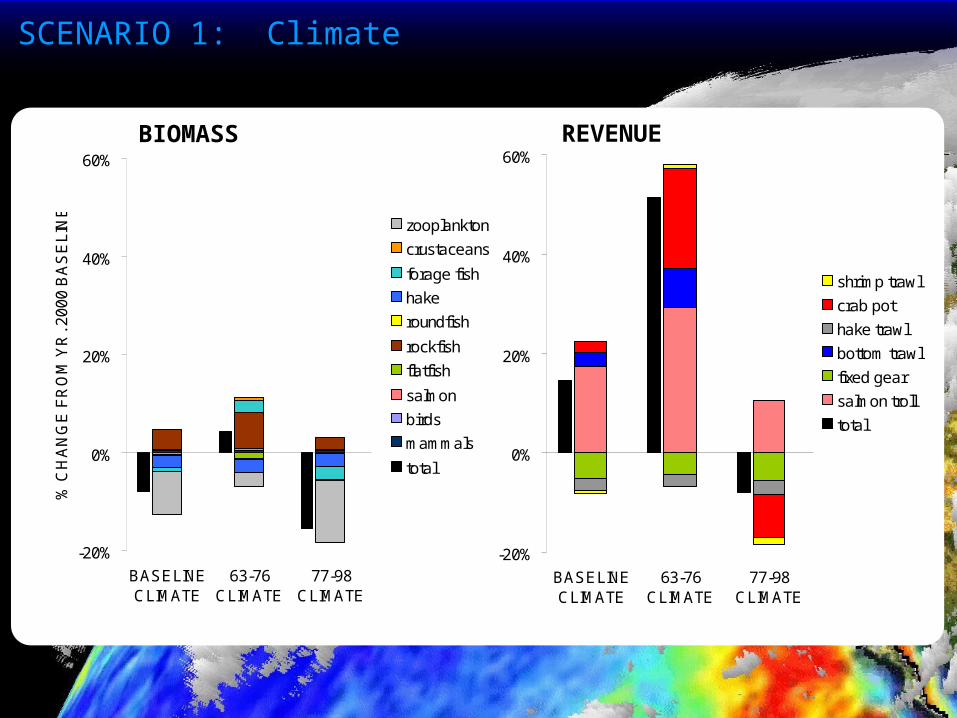
SCENARIO 1: Climate

0.6
0.8
1
1.2
1.4
1.6
1960 1970 1980 1990 2000 2010 2020 2030 2040 2050 2060 2070 2080 2090 2100
Bottom Up Index (Logerwell)
Top Down Index (PDO)
SCENARIO 1: Climate

0.6
0.8
1
1.2
1.4
1.6
1960 1970 1980 1990 2000 2010 2020 2030 2040 2050 2060 2070 2080 2090 2100
Bottom Up Index (Logerwell)
Top Down Index (PDO)
…to 2100
Average 1960-2000
SCENARIO 1: Climate

0.6
0.8
1
1.2
1.4
1.6
1960 1970 1980 1990 2000 2010 2020 2030 2040 2050 2060 2070 2080 2090 2100
Bottom Up Index (Logerwell)
Top Down Index (PDO)
…to 2100
0.6
0.8
1
1.2
1.4
1.6
1960 1970 1980 1990 2000 2010 2020 2030 2040 2050 2060 2070 2080 2090 2100
Average 1963-76
SCENARIO 1: Climate

0.6
0.8
1
1.2
1.4
1.6
1960 1970 1980 1990 2000 2010 2020 2030 2040 2050 2060 2070 2080 2090 2100
Bottom Up Index (Logerwell)
Top Down Index (PDO)
…to 2100
0.6
0.8
1
1.2
1.4
1.6
1960 1970 1980 1990 2000 2010 2020 2030 2040 2050 2060 2070 2080 2090 2100
Average 1977-98
SCENARIO 1: Climate

-20%
0%
20%
40%
60%
BASELINECLIMATE
63-76CLIMATE
77-98CLIMATE
% C
HA
NG
E F
RO
M Y
R. 2
00
0 B
AS
EL
INE
zooplankton
crustaceans
forage fish
hake
roundfish
rockfish
flatfish
salmon
birds
mammals
total
-20%
0%
20%
40%
60%
BASELINECLIMATE
63-76CLIMATE
77-98CLIMATE
shrimp trawl
crab pot
hake trawl
bottom trawl
fixed gear
salmon troll
total
BIOMASS REVENUE
SCENARIO 1: Climate
-20%
0%
20%
40%
60%
BASELINECLIMATE
63-76CLIMATE
77-98CLIMATE
% C
HA
NG
E F
RO
M Y
R. 2
00
0 B
AS
EL
INE
zooplankton
crustaceans
forage fish
hake
roundfish
rockfish
flatfish
salmon
birds
mammals
total
-20%
0%
20%
40%
60%
BASELINECLIMATE
63-76CLIMATE
77-98CLIMATE
shrimp trawl
crab pot
hake trawl
bottom trawl
fixed gear
salmon troll
total
BIOMASS REVENUE
SCENARIO 1: Climate

-100%
0%
100%
200%
300%
400%
500%
mam
mal
s
bird
s
salm
on
flatfi
sh
rock
fish
roun
dfis
h
hake
fora
ge fi
sh
crus
tace
ans
zoop
lank
ton
salm
on tr
oll
fixed
gea
r
botto
m tr
awl
hake
traw
l
crab
pot
shrim
p tra
wl
% C
HA
NG
E F
RO
M Y
R. 2
000
BA
SE
LIN
E
-100%
0%
100%
200%
300%
400%
500%
mam
mal
s
bird
s
salm
on
flatfi
sh
rock
fish
roun
dfis
h
hake
fora
ge fi
sh
crus
tace
ans
zoop
lank
ton
salm
on tr
oll
fixed
gea
r
botto
m tr
awl
hake
traw
l
crab
pot
shrim
p tra
wl
63-76 CLIMATE
BASELINE CLIMATE
77-98 CLIMATE
-100%
0%
100%
200%
300%
400%
500%
mam
mal
s
bird
s
salm
on
flatfi
sh
rock
fish
roun
dfis
h
hake
fora
ge fi
sh
crus
tace
ans
zoop
lank
ton
salm
on tr
oll
fixed
gea
r
botto
m tr
awl
hake
traw
l
crab
pot
shrim
p tra
wl
63-76 CLIMATE
BASELINE CLIMATE
77-98 CLIMATE
BIOMASS REVENUE
SCENARIO 1: Climate

Compared to year 1960 system?
SCENARIO 1: Climate

-
10
20
30
40
ma
mm
als
bir
ds
salm
on
flatfi
sh
rock
fish
rou
nd
fish
ha
ke
fora
ge
fish
cru
sta
cea
ns
zoo
pla
nkt
on
BIO
MA
SS
(m
t/k
m2
)
2000 system
1960 system
-
20
40
60
80
salm
on
tro
ll
fixe
d g
ea
r
bo
ttom
tra
wl
ha
ke tr
aw
l
cra
b p
ot
shri
mp
tra
wl
RE
VE
NU
E (
mill
ion
$)
2000 system
1960 system
BIOMASS REVENUE
SCENARIO 1: Climate

-20%
0%
20%
40%
60%
BASELINECLIMATE
63-76CLIMATE
77-98CLIMATE
% C
HA
NG
E F
RO
M Y
R. 2
00
0 B
AS
EL
INE
zooplankton
crustaceans
forage fish
hake
roundfish
rockfish
flatfish
salmon
birds
mammals
total
2000 SYSTEM 1960 SYSTEM
-20%
0%
20%
40%
60%
BASELINECLIMATE
63-76CLIMATE
77-98CLIMATE
zooplankton
salmon
roundfish
rockfish
mammals
hake
forage fish
flatfish
crustaceans
birds
total
-20%
0%
20%
40%
60%
BASELINECLIMATE
63-76CLIMATE
77-98CLIMATE
-20%
0%
20%
40%
60%
BASELINECLIMATE
63-76CLIMATE
77-98CLIMATE
zooplankton
crustaceans
forage fish
hake
roundfish
rockfish
flatfish
salmon
birds
mammals
total
SCENARIO 1: Climate

-20%
0%
20%
40%
60%
BASELINECLIMATE
63-76CLIMATE
77-98CLIMATE
2000 SYSTEM
-20%
0%
20%
40%
60%
BASELINECLIMATE
63-76CLIMATE
77-98CLIMATE
shrimp trawl
crab pot
hake trawl
bottom trawl
fixed gear
salmon troll
total
1960 SYSTEM
-40%
-20%
0%
20%
40%
60%
BA
SE
LIN
EC
LIM
ATE
63-7
6 C
LIM
ATE
77-9
8 C
LIM
ATE
shrimp trawl
crab pot
hake trawl
bottom trawl
fixed gear
salmon
total
-20%
0%
20%
40%
60%
BASELINECLIMATE
63-76CLIMATE
77-98CLIMATE
SCENARIO 1: Climate

SCENARIO 1: Climate

SCENARIO 2: Fishing

Are we measuring
RESILIENCE?
from Walker et al. 04
SCENARIO 2: Fishing

SCENARIO 2: Fishing

SCENARIO 2: Fishing

SCENARIO 2: Fishing

SCENARIO 2: Fishing

SCENARIO 2: Fishing
SCENARIO 3: Climate & Fishing

SCENARIO 3: Climate & Fishing
-100%
0%
100%
200%
300%
400%
500%
mam
mal
s
bird
s
salm
on
flatfi
sh
rock
fish
roun
dfis
h
hake
fora
ge fi
sh
crus
tace
ans
zoop
lank
ton
salm
on tr
oll
fixed
gea
r
botto
m tr
awl
hake
traw
l
crab
pot
shrim
p tra
wl
% C
HA
NG
E F
RO
M Y
R. 2
000
BA
SE
LIN
E
-1.00
-0.75
-0.50
-0.25
0.00
0.25
0.50
0.75
1.00
50
%-
- cu
rre
nt
40
%-
- cu
rre
nt
30
%-
- cu
rre
nt
20
%-
-cu
rre
nt
10
%-
-cu
rre
nt
Eq
- c
urr
en
t
10
%+
- c
urr
en
t
20
%+
- c
urr
en
t
30
%+
- c
urr
en
t
40
%+
- c
urr
en
t
50
%+
- c
urr
en
t
-1
-0.75
-0.5
-0.25
0
0.25
0.5
0.75
1
-50%
-25%
0%
25%
50%
75%
63-76CLIMATE
77-98CLIMATE
shrimp trawl
crab pot
hake trawl
bottom trawl
fixed gear
salmon
total
REVENUE
-1.00
-0.75
-0.50
-0.25
0.00
0.25
0.50
0.75
1.0050
%-
- cu
rren
t
40%
- -
curr
ent
30%
- -
curr
ent
20%
- -c
urre
nt
10%
- -c
urre
nt
Eq
- cu
rren
t
10%
+ -
cur
rent
20%
+ -
cur
rent
30%
+ -
cur
rent
40%
+ -
cur
rent
50%
+ -
cur
rent
63-76 CLIMATE
-1.00
-0.75
-0.50
-0.25
0.00
0.25
0.50
0.75
1.00
50%
- -cu
rrent
40%
- -cu
rrent
30%
- -cu
rrent
20%
- -cu
rrent
10%
- -cu
rrent
Eq -
curre
nt
10%
+ -
curre
nt20
%+
-cu
rrent
30%
+ -
curre
nt40
%+
-cu
rrent
50%
+ -
curre
nt
-1
-0.75
-0.5
-0.25
0
0.25
0.5
0.75
1
77-98 CLIMATE

SUMMARY
thanks to: WA Sea Grant, IPDES, SAFS