quarterly coal report july – september 2017 · data presented in the quarterly coal report ......
TRANSCRIPT
Independent Statistics & Analysis
www.eia.gov U.S. Department of Energy
Washington, DC 20585
Quarterly Coal Report October – December 2017
April 2018

This report was prepared by the U.S. Energy Information Administration (EIA), the statistical and analytical agency within the U.S. Department of Energy. By law, EIA’s data, analyses, and forecasts are independent of approval by any other officer or employee of the United States Government. The views in this report therefore should not be construed as representing those of the Department of Energy or other Federal agencies.

iii U.S. Energy Information Administration | Quarterly Coal Report, October – December 2017
Contacts This publication was prepared by the U.S. Energy Information Administration. General information about the data in this report can be obtained from [email protected]. Requests for additional information on other statistics available from the U.S. Energy Information Administration or questions concerning subscriptions and report distribution may be directed to the Office of Communications of the U.S. Energy Information Administration at [email protected].
U.S. Energy Information Administration | Quarterly Coal Report, October – December 2017 iv
Preface Data presented in the Quarterly Coal Report (QCR) are collected and published by the U.S. Energy Information Administration (EIA) to fulfill data collection and dissemination responsibilities as specified in the Federal Energy Administration Act of 1974 (Public Law 93-275), as amended. The Quarterly Coal Report (QCR) presents U.S. coal production, exports, imports, receipts, prices, consumption, quality, stocks, and refined coal data. In addition, the QCR offers U.S. coke production, consumption, stocks, imports, and exports data. The fourth quarter 2017 QCR includes detailed quarterly coal data for October – December 2017 and aggregated quarterly historical coal data for 2010 through fourth quarter 2017. All data for 2016 and prior years are final. All data for 2017 are preliminary.
v U.S. Energy Information Administration | Quarterly Coal Report, October – December 2017
Contents Contacts ..................................................................................................................................................................................... iii
Preface ........................................................................................................................................................................................ iv
Tables .......................................................................................................................................................................................... vi
Production ................................................................................................................................................................................... 4
Exports and Imports..................................................................................................................................................................... 8
Receipts and Prices .................................................................................................................................................................... 27
Consumption ............................................................................................................................................................................. 35
Stocks ......................................................................................................................................................................................... 41
Quality ....................................................................................................................................................................................... 47

U.S. Energy Information Administration | Quarterly Coal Report, October – December 2017 vi
Tables
ES-1. U.S. Coal Summary Statistics, 2010 - 2016 ................................................................................................................. 1
ES-2. U.S. Coke Summary Statistics, 2010 - 2016 ................................................................................................................ 2
ES-3. Summary Statistics for Coal Refining Plants, 2012 - 2016 .......................................................................................... 3
1. U.S. Coal Production, 2010 - 2016 ................................................................................................................................. 5
2. Coal production by State ............................................................................................................................................... 6
3. Coke and Breeze Production at Coke Plants ................................................................................................................. 7
4. U.S. Coal Exports and Imports, 2010 - 2016 .................................................................................................................. 9
5. Average Price of U.S. Coal Exports and Imports, 2010 - 2016 ....................................................................................... 9
6. Quantity and Average Price of U.S. Coal Imports by Origin, 2010 - 2016 ................................................................... 10
7. U.S. Coal Exports.......................................................................................................................................................... 11
8. Average Price of U.S. Coal Exports .............................................................................................................................. 12
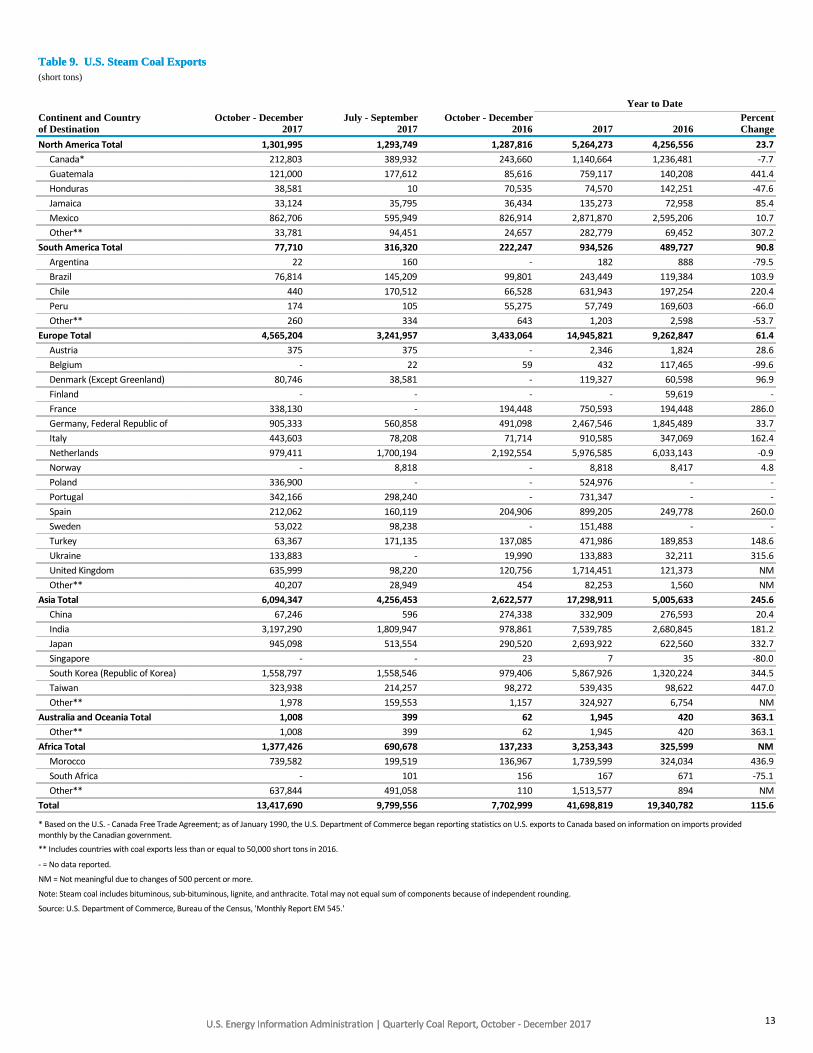
9. U.S. Steam Coal Exports .............................................................................................................................................. 13
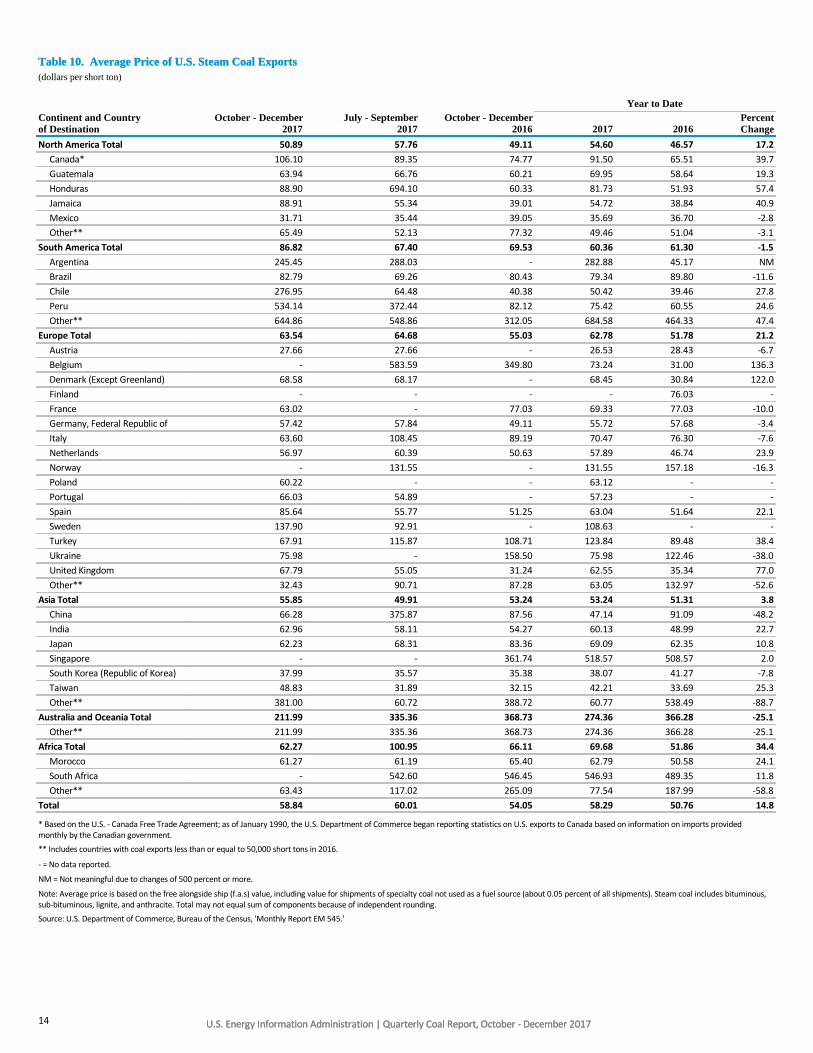
10. Average Price of U.S. Steam Coal Exports ................................................................................................................... 14
11. U.S. Metallurgical Coal Exports ................................................................................................................................... 15
12. Average Price of U.S. Metallurgical Coal Exports ........................................................................................................ 16
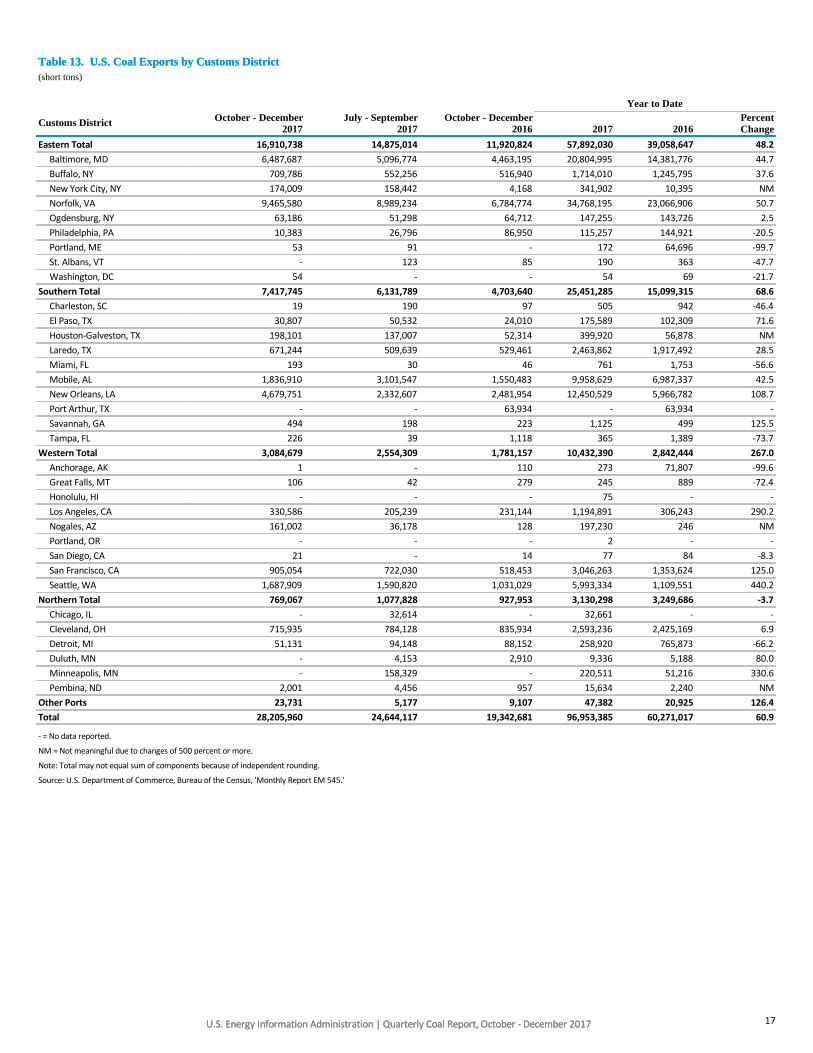
13. U.S. Coal Exports by Customs District.......................................................................................................................... 17
14. Steam Coal Exports by Customs District ...................................................................................................................... 18
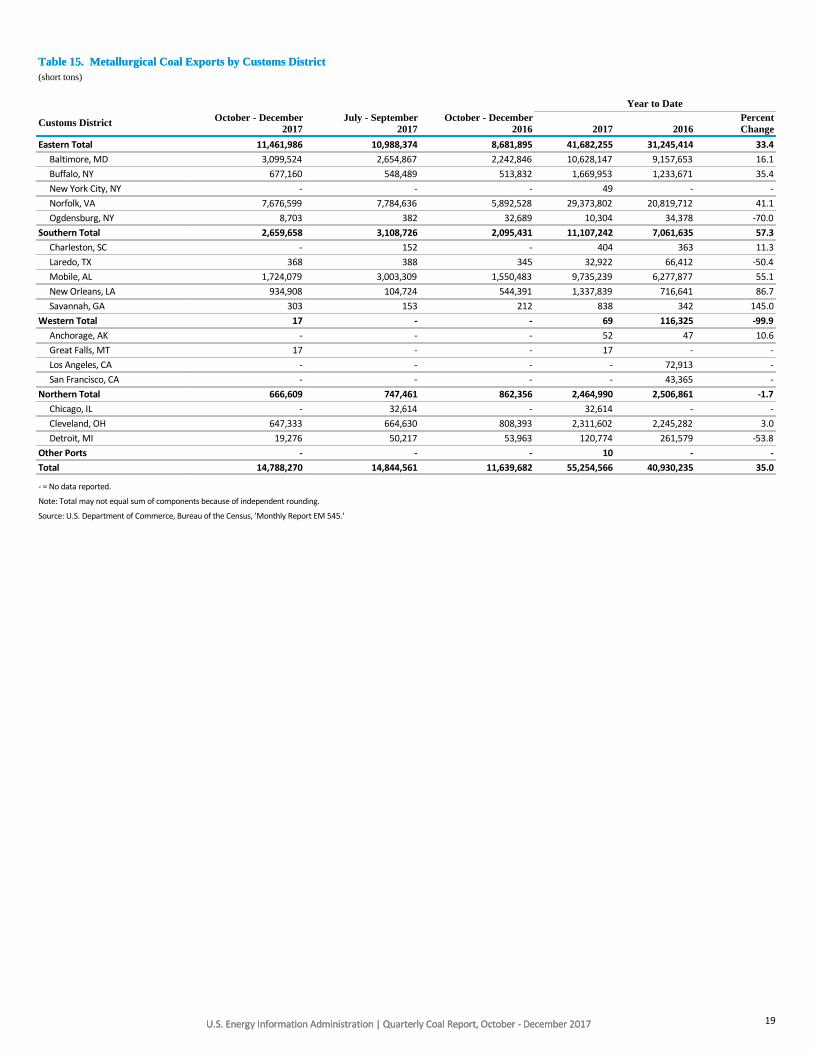
15. Metallurgical Coal Exports by Customs District ........................................................................................................... 19
16. U.S. Coke Exports ......................................................................................................................................................... 20
17. Average Price of U.S. Coke Exports ............................................................................................................................. 21
18. U.S. Coal Imports ......................................................................................................................................................... 22
19. Average Price of U.S. Coal Imports .............................................................................................................................. 23
20. Coal Imports by Customs District ................................................................................................................................ 24
21. U.S. Coke Imports ........................................................................................................................................................ 25
22. Average Price of U.S. Coke Imports ............................................................................................................................. 26
23. Coal Receipts at Coke Plants by Census Division ......................................................................................................... 28
24. Average Price of Coal Receipts at Coke Plants by Census Division .............................................................................. 28
25. Open Market Sales and Average Price of Coke and Breeze ........................................................................................ 29
26. Coal Receipts at Other Industrial Plants by Census Division and State ....................................................................... 30
27. Average Price of Coal Receipts at Other Industrial Plants by Census Division and State ............................................ 31
28. U.S. Coal Receipts at Manufacturing Plants by North American Industry Classification System (NAICS) Code .......... 32
29. Average Price of U.S. Coal Receipts at Manufacturing Plants by North American Industry Classification System (NAICS) Code ............................................................................................................................................................... 32
30. Coal Receipts at Commercial and Institutional Users by Census Division and State ................................................... 33
31. Average Price of Coal Receipts at Commercial and Institutional Users by Census Division and State ........................ 34
32. U.S. Coal Consumption by End-Use Sector, 2010 - 2016 ............................................................................................. 36

vii U.S. Energy Information Administration | Quarterly Coal Report, October – December 2017
33. Coal Carbonized at Coke Plants by Census Division .................................................................................................... 37
34. Coal Consumption at Other Industrial Plants by Census Division and State ............................................................... 38
35. U.S. Coal Consumption at Manufacturing Plants by North American Industry Classification System (NAICS) Code .. 39
36. Coal Consumption at Commercial and Institutional Users by Census Division and State ........................................... 40
37. U.S. Coal Stocks, 2010 - 2016 ...................................................................................................................................... 42
38. Coal Stocks at Coke Plants by Census Division ............................................................................................................ 43
39. Coal Stocks at Other Industrial Plants by Census Division and State .......................................................................... 44
40. U.S. Coal Stocks at Manufacturing Plants by North American Industry Classification System (NAICS) Code ............. 45
41. Coke and Breeze Stocks at Coke Plants by Census Division ........................................................................................ 45
42. Coke Stocks at Commercial and Institutional Users by Census Division and State ..................................................... 46
43. Average Quality of Coal Received at Manufacturing and Coke Plants by Census Division and State ......................... 48
44. Average Quality of Coal Received at Commercial and Institutional Users by Census Division and State ................... 52

U.S. Energy Information Administration | Quarterly Coal Report, October – December 2017 viii
[This page is intentionally left blank]

U.S. Energy Information Administration | Quarterly Coal Report, October - December 2017
Table ES-1. U.S. Coal Summary Statistics, 2011 - 2017(thousand short tons)
Year andQuarter Production1 Imports
Waste CoalSupplied
Producer andDistributor
Stocks2 Consumption ExportsConsumer
Stocks2
Losses andUnaccounted
For3
2011
January - March 273,478 3,381 3,354 48,165 254,647 26,617 172,581 -
April - June 264,291 3,419 3,069 50,507 241,247 26,987 171,795 -
July - September 275,006 3,588 3,500 49,909 279,722 25,976 150,881 -
October - December 282,853 2,700 3,287 51,897 227,332 27,679 180,054 -
Total 1,095,628 13,088 13,209 1,002,948 107,259 11,506
2012
January - March 266,865 2,022 2,893 51,141 207,833 28,642 202,166 -
April - June 241,047 2,329 2,500 50,374 201,555 37,534 205,023 -
July - September 258,956 2,415 2,982 46,231 253,984 31,563 189,530 -
October - December 249,591 2,394 2,821 46,157 225,813 28,006 192,696 -
Total 1,016,458 9,159 11,196 889,185 125,746 14,980
2013
January - March 244,867 1,429 3,169 48,422 228,987 31,835 178,419 -
April - June 243,211 2,756 2,687 50,129 216,014 29,427 178,110 -
July - September 257,595 2,398 2,782 47,135 253,357 28,589 160,079 -
October - December 239,169 2,323 2,640 45,652 226,084 27,809 154,676 -
Total 984,842 8,906 11,279 924,442 117,659 1,451
2014
January - March 245,271 2,450 3,277 44,728 248,329 27,584 123,990 -
April - June 245,844 3,574 2,896 42,682 211,881 24,674 139,471 -
July - September 255,377 3,151 3,256 38,828 247,453 22,723 131,386 -
October - December 253,557 2,174 2,662 38,894 210,068 22,276 158,833 -
Total 1,000,049 11,350 12,090 917,731 97,257 11,101
2015
January - March 240,324 3,009 2,821 39,610 212,772 21,979 160,509 -
April - June 212,557 2,640 2,209 39,399 188,975 19,766 173,314 -
July - September 236,823 2,965 2,722 36,213 229,393 16,914 169,784 -
October - December 207,237 2,705 2,217 35,871 166,974 15,299 202,560 -
Total 896,941 11,318 9,969 798,115 73,958 5,452
2016
January - March 173,225 2,698 2,829 35,207 166,448 14,153 197,755 -
April - June 160,853 2,292 2,174 32,932 160,278 14,223 188,060 -
July - September 195,101 2,733 2,880 27,282 223,358 12,552 162,318 -
October - December 199,186 2,124 2,256 25,309 180,987 19,343 167,681 -
Total 728,364 9,846 10,138 731,071 60,271 2,449
2017
January - March 197,033 1,915 2,511 25,190* 173,482 22,307 166,649 -
April - June 187,082 2,197 1,840 23,430* 166,842 21,796 162,970 -
July - September 196,161 2,308 2,342 21,984* 203,898 24,644 144,809 -
October - December 193,842 1,357 2,055 21,108* 172,740 28,206 142,431 -
Total 774,118 7,777 8,748 716,961 96,953 6,179
2016 January - December 728,364 9,846 10,138 731,071 60,271 -
2015 January - December 896,941 11,318 9,969 798,115 73,958 -
1 Includes refuse recovery.
2 Reported as of the last day of the quarter.
3 'Losses and Unaccounted For' is calculated as production plus imports plus waste coal supplied minus the change in producer and distributor stocks minus consumption minus exports minus the change inconsumer stocks.
* Estimated.
Note: Beginning with 1999, the first three quarters of Producer and Distributor Stocks data for each year are estimated. Total may not equal sum of components because of independent rounding.
Source: *Production: U.S. Department of Labor, Mine Safety and Health Administration, Form 7000-2, 'Quarterly Mine Employment and Coal Production Report.' *Imports: U.S. Department of Commerce,Bureau of the Census, 'Monthly Report IM 145.' *Waste Coal Supplied: Form EIA-923, 'Power Plant Operations Report' and Form EIA-3, 'Quarterly Survey of Industrial, Commercial & Institutional Coal Users.'*Producer and Distributor Stocks: 'Short-Term Energy Outlook' estimates, Form EIA-7A, 'Annual Survey of Coal Production and Preparation,' and Form EIA-8A, 'Annual Survey of Coal Stocks and Coal Exports.'*Exports: U.S. Department of Commerce, Bureau of the Census, 'Monthly Report EM 545.' *Consumption: Form EIA-923, 'Power Plant Operations Report,' Form EIA-3, 'Quarterly Survey of Industrial,Commercial & Institutional Coal Users,' and Form EIA-7A, 'Annual Survey of Coal Production and Preparation.' *Consumer Stocks: Form EIA-923, 'Power Plant Operations Report' and Form EIA-3, 'QuarterlySurvey of Industrial, Commercial & Institutional Coal Users.' Prior to third quarter 2014, coke plant data was collected under Form EIA-5, 'Quarterly Coal Consumption and Quality Report - Coke Plants.'
1
U.S. Energy Information Administration | Quarterly Coal Report, October - December 2017
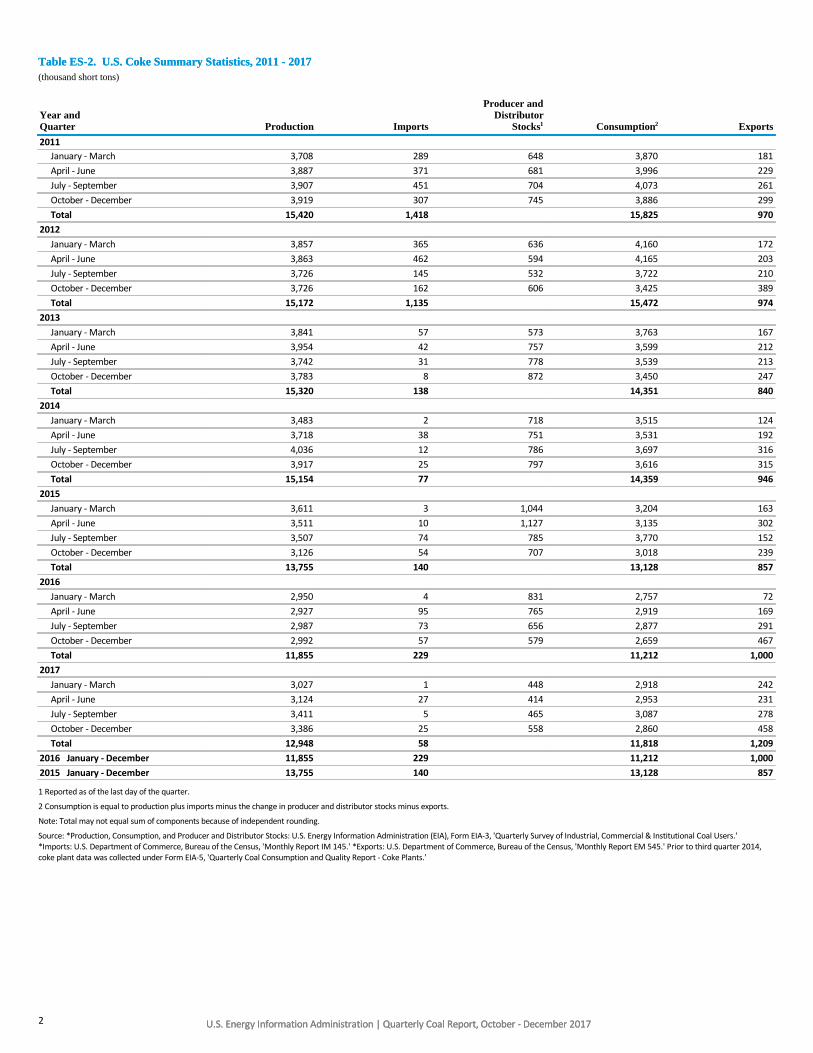
Table ES-2. U.S. Coke Summary Statistics, 2011 - 2017
U.S. Energy Information Administration | Quarterly Coal Report, October - December 2017
Table ES-2. U.S. Coke Summary Statistics, 2011 - 2017(thousand short tons)
Year andQuarter Production Imports
Producer andDistributor
Stocks1 Consumption2 Exports
2011
January - March 3,708 289 648 3,870 181
April - June 3,887 371 681 3,996 229
July - September 3,907 451 704 4,073 261
October - December 3,919 307 745 3,886 299
Total 15,420 1,418 15,825 970
2012
January - March 3,857 365 636 4,160 172
April - June 3,863 462 594 4,165 203
July - September 3,726 145 532 3,722 210
October - December 3,726 162 606 3,425 389
Total 15,172 1,135 15,472 974
2013
January - March 3,841 57 573 3,763 167
April - June 3,954 42 757 3,599 212
July - September 3,742 31 778 3,539 213
October - December 3,783 8 872 3,450 247
Total 15,320 138 14,351 840
2014
January - March 3,483 2 718 3,515 124
April - June 3,718 38 751 3,531 192
July - September 4,036 12 786 3,697 316
October - December 3,917 25 797 3,616 315
Total 15,154 77 14,359 946
2015
January - March 3,611 3 1,044 3,204 163
April - June 3,511 10 1,127 3,135 302
July - September 3,507 74 785 3,770 152
October - December 3,126 54 707 3,018 239
Total 13,755 140 13,128 857
2016
January - March 2,950 4 831 2,757 72
April - June 2,927 95 765 2,919 169
July - September 2,987 73 656 2,877 291
October - December 2,992 57 579 2,659 467
Total 11,855 229 11,212 1,000
2017
January - March 3,027 1 448 2,918 242
April - June 3,124 27 414 2,953 231
July - September 3,411 5 465 3,087 278
October - December 3,386 25 558 2,860 458
Total 12,948 58 11,818 1,209
2016 January - December 11,855 229 11,212 1,000
2015 January - December 13,755 140 13,128 857
1 Reported as of the last day of the quarter.
2 Consumption is equal to production plus imports minus the change in producer and distributor stocks minus exports.
Note: Total may not equal sum of components because of independent rounding.
Source: *Production, Consumption, and Producer and Distributor Stocks: U.S. Energy Information Administration (EIA), Form EIA-3, 'Quarterly Survey of Industrial, Commercial & Institutional Coal Users.'*Imports: U.S. Department of Commerce, Bureau of the Census, 'Monthly Report IM 145.' *Exports: U.S. Department of Commerce, Bureau of the Census, 'Monthly Report EM 545.' Prior to third quarter 2014,coke plant data was collected under Form EIA-5, 'Quarterly Coal Consumption and Quality Report - Coke Plants.'
2

U.S. Energy Information Administration | Quarterly Coal Report, October - December 2017
Table ES-3. Summary Statistics for Coal Refining Plants, 2012 - 2017(thousand short tons)
U.S. Energy Information Administration | Quarterly Coal Report, October - December 2017
Table ES-3. Summary Statistics for Coal Refining Plants, 2012 - 2017(thousand short tons)
Coal Receipts by Rank
Year andQuarter Bituminous Subbituminous Lignite Total
Average Price ofReceipts
(dollars per short ton)Refined Coal
ProducedRefined Coal
Sold
2012
January - March 30 1,890 231 2,151 27.47 1,756 -
April - June - 2,853 992 3,844 25.42 3,668 -
July - September - 2,806 2,593 5,399 24.32 4,182 -
October - December - 2,571 2,347 4,919 24.55 4,434 -
Total 30 10,120 6,164 16,313 25.06 14,040 -
2013
January - March - 2,733 2,334 5,067 24.60 4,989 -
April - June - 2,105 1,910 4,015 25.24 3,615 -
July - September 54 3,279 2,823 6,156 26.93 6,197 -
October - December 733 3,848 2,635 7,216 29.01 6,111 -
Total 786 11,966 9,701 22,454 26.77 20,912 -
2014
January - March 486 4,887 2,623 7,996 29.13 7,717 -
April - June 552 3,985 2,737 7,273 28.16 6,909 -
July - September 426 7,550 3,181 11,157 30.08 10,113 -
October - December 1,130 8,549 2,841 12,520 28.13 11,105 -
Total 2,594 24,972 11,381 38,946 28.90 35,843 -
2015
January - March 1,475 7,784 3,212 12,471 29.07 11,403 -
April - June 1,355 7,435 3,146 11,936 28.67 11,237 -
July - September w w w w w w w
October - December w w w w w w w
Total w w w w w w w
2016
January - March w w w w w w w
April - June w w w w w w w
July - September w w w w w w w
October - December w w w w w w w
Total w w w w w w w
2017
January - March w w w w w w w
April - June w w w w w w w
July - September 15,127 17,625 3,186 35,938 35.64 33,556 33,556
October - December 13,245 17,509 2,798 33,552 35.75 31,894 31,894
Total w w w w w w w
w = Data withheld to avoid disclosure.
Note: Average price is based on the cost, insurance, and freight (c.i.f. value). Total may not equal sum of components because of independent rounding.
Source: U.S. Energy Information Administration (EIA), Form EIA-3, 'Quarterly Survey of Industrial, Commercial & Institutional Coal Users.'
Respondent survey frame updated for Q3 2017 to include full universe of coal refining facilities. Frame was incomplete prior to Q3 2017, resulting in incomplete data.
3

U.S. Energy Information Administration | Quarterly Coal Report, October - December 2017U.S. Energy Information Administration | Quarterly Coal Report, October - December 2017
Production____________________________________________________________________________________________________
4
U.S. Energy Information Administration | Quarterly Coal Report, October - December 2017
Table 1. U.S. Coal Production, 2011 - 2017
U.S. Energy Information Administration | Quarterly Coal Report, October - December 2017
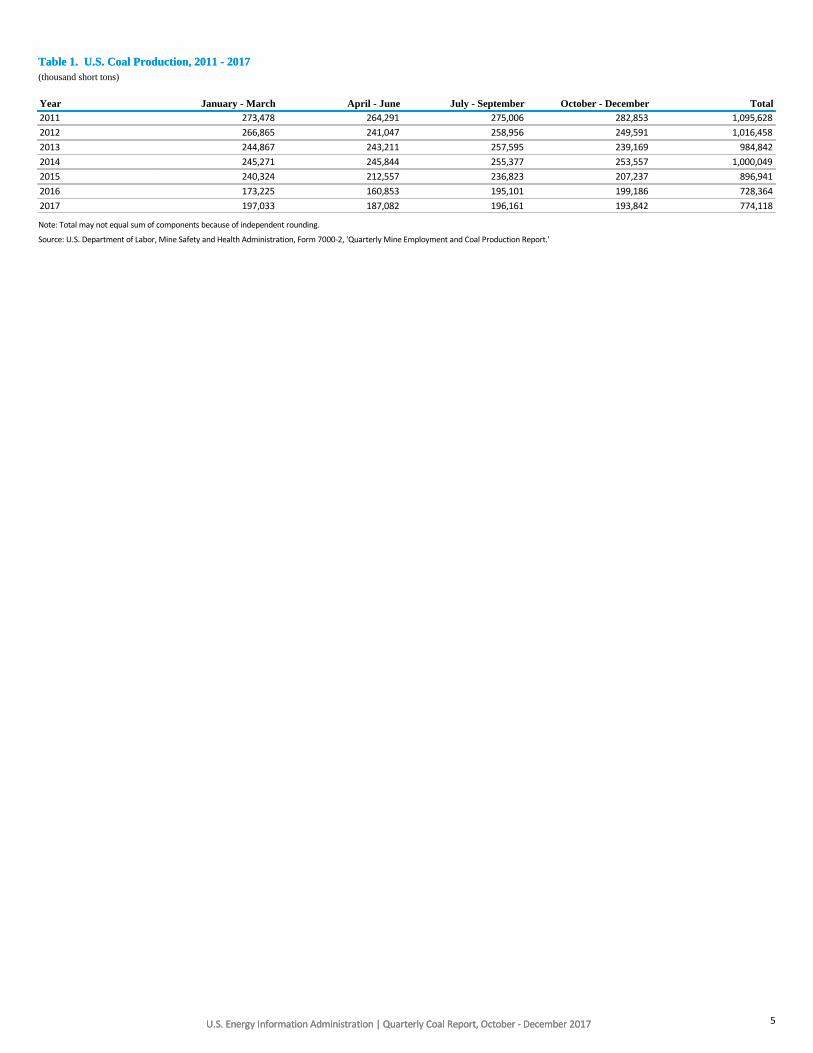
Table 1. U.S. Coal Production, 2011 - 2017(thousand short tons)
Year January - March April - June July - September October - December Total2011 273,478 264,291 275,006 282,853 1,095,628
2012 266,865 241,047 258,956 249,591 1,016,458
2013 244,867 243,211 257,595 239,169 984,842
2014 245,271 245,844 255,377 253,557 1,000,049
2015 240,324 212,557 236,823 207,237 896,941
2016 173,225 160,853 195,101 199,186 728,364
2017 197,033 187,082 196,161 193,842 774,118
Note: Total may not equal sum of components because of independent rounding.
Source: U.S. Department of Labor, Mine Safety and Health Administration, Form 7000-2, 'Quarterly Mine Employment and Coal Production Report.'
5

U.S. Energy Information Administration | Quarterly Coal Report, October - December 2017
Table 2. Coal Production by State
U.S. Energy Information Administration | Quarterly Coal Report, October - December 2017
Table 2. Coal Production by State(thousand short tons)
Year to DateCoal-Producing Regionand State
October - December2017
July - September2017
October - December2016 2017 2016
PercentChange
Alabama 3,084 2,780 2,597 12,613 9,643 30.8
Alaska 264 237 211 959 932 2.9
Arizona 1,798 1,374 1,384 6,221 5,423 14.7
Arkansas - - 11 27 49 -46.4
Colorado 3,745 3,147 4,012 15,047 12,634 19.1
Illinois 11,430 11,311 10,990 48,128 43,422 10.8
Indiana 7,668 7,738 7,296 31,418 28,767 9.2
Kansas - - - - 27 -
Kentucky Total 9,926 9,890 11,164 42,608 42,868 -0.6
Eastern (Kentucky) 4,613 4,205 4,427 18,842 16,772 12.3
Western (Kentucky) 5,314 5,686 6,737 23,766 26,096 -8.9
Louisiana 489 164 805 2,079 2,798 -25.7
Maryland 351 431 491 1,662 1,616 2.8
Mississippi 582 453 751 2,604 2,870 -9.3
Missouri 60 63 60 244 234 4.5
Montana 9,739 10,450 9,398 35,232 32,336 9.0
New Mexico 2,765 3,175 3,691 13,198 13,341 -1.1
North Dakota 7,506 7,463 7,455 28,788 28,121 2.4
Ohio 2,439 2,265 2,451 9,336 12,564 -25.7
Oklahoma 146 131 160 561 654 -14.2
Pennsylvania Total 12,165 11,688 12,802 49,065 45,720 7.3
Anthracite (Pennsylvania) 483 409 387 1,849 1,500 23.3
Bituminous (Pennsylvania) 11,682 11,279 12,416 47,217 44,220 6.8
Tennessee 71 90 141 431 644 -33.1
Texas 9,906 9,288 10,071 36,338 39,001 -6.8
Utah 4,127 3,272 3,673 14,326 13,966 2.6
Virginia 3,133 3,137 3,339 13,205 12,910 2.3
West Virginia Total 24,241 21,528 21,064 92,733 79,757 16.3
Northern (West Virginia) 12,375 10,389 11,505 46,785 43,524 7.5
Southern (West Virginia) 11,866 11,139 9,559 45,948 36,233 26.8
Wyoming 78,052 85,867 84,943 316,454 297,218 6.5
Appalachia Total 50,096 46,123 47,312 197,887 179,626 10.2
Appalachia Central 19,683 18,570 17,466 78,426 66,558 17.8
Appalachia Northern 27,330 24,773 27,249 106,849 103,424 3.3
Appalachia Southern 3,084 2,780 2,597 12,613 9,643 30.8
Interior Region Total 35,594 34,833 36,881 145,164 143,917 0.9
Illinois Basin 24,411 24,734 25,022 103,312 98,285 5.1
Interior 11,183 10,099 11,858 41,853 45,632 -8.3
Western Region Total 107,996 114,985 114,768 430,224 403,971 6.5
Powder River Basin 83,362 91,214 90,512 334,366 313,752 6.6
Uinta Region 7,519 6,116 7,287 28,068 25,077 11.9
Western 17,115 17,655 16,969 67,790 65,142 4.1
East of Mississippi River 75,089 71,310 73,086 303,802 280,780 8.2
West of Mississippi River 118,597 124,631 125,875 469,473 446,734 5.1
U.S. Subtotal 193,687 195,941 198,960 773,275 727,514 6.3
Refuse Recovery 155 220 226 843 851 -0.9
U.S. Total 193,842 196,161 199,186 774,118 728,364 6.3
Note: Total may not equal sum of components because of independent rounding.
Source: U.S. Department of Labor, Mine Safety and Health Administration, Form 7000-2, 'Quarterly Mine Employment and Coal Production Report.'
6
U.S. Energy Information Administration | Quarterly Coal Report, October - December 2017
Table 3. Coke and Breeze Production at Coke Plants
U.S. Energy Information Administration | Quarterly Coal Report, October - December 2017
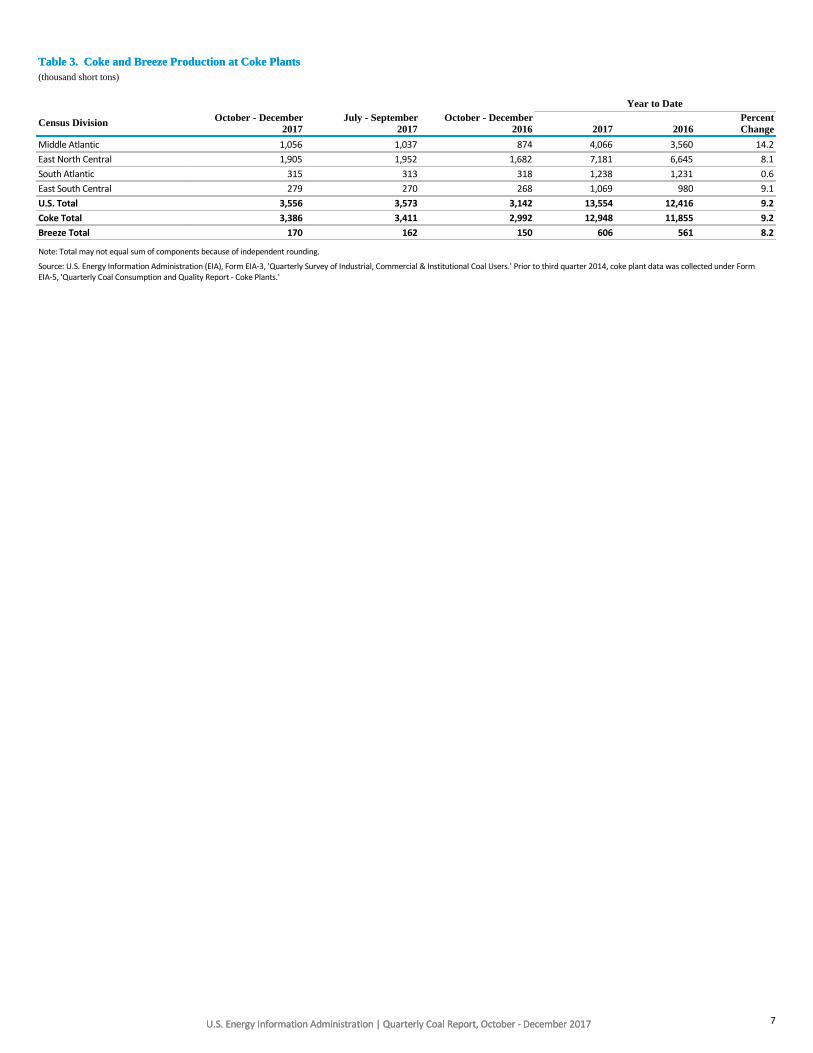
Table 3. Coke and Breeze Production at Coke Plants(thousand short tons)
Year to Date
Census Division October - December2017
July - September2017
October - December2016 2017 2016
PercentChange
Middle Atlantic 1,056 1,037 874 4,066 3,560 14.2
East North Central 1,905 1,952 1,682 7,181 6,645 8.1
South Atlantic 315 313 318 1,238 1,231 0.6
East South Central 279 270 268 1,069 980 9.1
U.S. Total 3,556 3,573 3,142 13,554 12,416 9.2
Coke Total 3,386 3,411 2,992 12,948 11,855 9.2
Breeze Total 170 162 150 606 561 8.2
Note: Total may not equal sum of components because of independent rounding.
Source: U.S. Energy Information Administration (EIA), Form EIA-3, 'Quarterly Survey of Industrial, Commercial & Institutional Coal Users.' Prior to third quarter 2014, coke plant data was collected under FormEIA-5, 'Quarterly Coal Consumption and Quality Report - Coke Plants.'
7

U.S. Energy Information Administration | Quarterly Coal Report, October - December 2017U.S. Energy Information Administration | Quarterly Coal Report, October - December 2017
Exports and Imports____________________________________________________________________________________________________
8

U.S. Energy Information Administration | Quarterly Coal Report, October - December 2017
Table 4. U.S. Coal Exports and Imports, 2011 - 2017
U.S. Energy Information Administration | Quarterly Coal Report, October - December 2017
Table 4. U.S. Coal Exports and Imports, 2011 - 2017(thousand short tons)
January - March April - June July - September October - December TotalYear Exports Imports Exports Imports Exports Imports Exports Imports Exports Imports
2011 26,617 3,381 26,987 3,419 25,976 3,588 27,679 2,700 107,259 13,088
2012 28,642 2,022 37,534 2,329 31,563 2,415 28,006 2,394 125,746 9,159
2013 31,835 1,429 29,427 2,756 28,589 2,398 27,809 2,323 117,659 8,906
2014 27,584 2,450 24,674 3,574 22,723 3,151 22,276 2,174 97,257 11,350
2015 21,979 3,009 19,766 2,640 16,914 2,965 15,299 2,705 73,958 11,318
2016 14,153 2,698 14,223 2,292 12,552 2,733 19,343 2,124 60,271 9,846
2017 22,307 1,915 21,796 2,197 24,644 2,308 28,206 1,357 96,953 7,777
Note: Total may not equal sum of components because of independent rounding.
Source: Exports: U.S. Department of Commerce, Bureau of the Census, 'Monthly Report EM 545;' and Imports: U.S. Department of Commerce, Bureau of the Census, 'Monthly Report IM 145.'
Table 5. Average Price of U.S. Coal Exports and Imports, 2011 - 2017(dollars per short ton)
January - March April - June July - September October - December TotalYear Exports Imports Exports Imports Exports Imports Exports Imports Exports Imports
2011 139.34 86.00 153.00 105.86 155.88 112.06 147.38 110.19 148.86 103.32
2012 134.88 103.82 118.95 100.89 115.12 93.25 104.64 90.39 118.43 96.78
2013 99.68 86.87 96.77 83.18 91.64 81.66 91.46 83.12 95.06 83.35
2014 90.72 78.15 86.24 80.46 85.69 80.60 84.94 85.48 87.08 80.96
2015 82.31 69.95 80.14 74.40 73.52 71.85 68.61 70.48 76.89 71.61
2016 61.41 63.97 65.79 66.30 67.24 62.70 92.57 71.32 73.66 65.75
2017 110.44 74.81 110.65 79.44 98.79 79.71 90.59 86.54 101.75 79.62
Note: Exports: Average price is based on the free alongside ship (f.a.s.) value. Imports: Average price is based on the customs import value. Customs import value is the price paid for merchandise when sold forexportation to the United States, excluding U.S. import duties, freight, insurance, and other charges incurred in bringing the merchandise to the United States. Total may not equal sum of components becauseof independent rounding.
Source: Exports: U.S. Department of Commerce, Bureau of the Census, 'Monthly Report EM 545;' and Imports: U.S. Department of Commerce, Bureau of the Census, 'Monthly Report IM 145.'
9

U.S. Energy Information Administration | Quarterly Coal Report, October - December 2017
Table 6. Quantity and Average Price of U.S. Coal Imports by Origin, 2011 - 2017
U.S. Energy Information Administration | Quarterly Coal Report, October - December 2017
Table 6. Quantity and Average Price of U.S. Coal Imports by Origin, 2011 - 2017(short tons and dollars per short ton)
Year and Quarter Australia Canada Colombia Indonesia China VenezuelaOther
Countries Total2011 61,745 1,680,490 9,500,387 856,038 22,128 778,887 187,931 13,087,606
2012 - 1,107,727 6,951,515 517,532 77,738 287,147 217,598 9,159,257
2013 22 1,116,076 6,575,927 886,920 51,944 42,428 233,108 8,906,425
2014 532 1,026,523 8,295,286 1,526,611 39,776 288,738 172,460 11,349,926
2015 60,994 1,187,655 8,936,034 890,124 16,099 74,175 152,930 11,318,011
2016
January - March 59,398 239,440 2,190,869 200,846 837 - 6,154 2,697,544
April - June 62,569 240,878 1,987,017 - 469 - 875 2,291,808
July - September - 323,436 2,176,901 168,154 5,070 - 59,515 2,733,076
October - December - 274,726 1,536,013 244,944 579 - 67,668 2,123,930
U.S. Total 121,967 1,078,480 7,890,800 613,944 6,955 - 134,212 9,846,358
2017
January - March - 204,185 1,649,757 58,863 1,202 - 1,047 1,915,054
April - June 700 205,598 1,789,959 199,996 676 - 121 2,197,050
July - September - 306,509 1,767,445 196,208 2,081 - 35,740 2,307,983
October - December - 175,442 879,451 244,386 2,515 46 55,245 1,357,085
U.S. Total 700 891,734 6,086,612 699,453 6,474 46 92,153 7,777,172
Average Price(dollars per short ton)2011 52.72 253.79 82.89 47.13 267.33 83.22 127.37 103.32
2012 - 184.89 83.94 53.54 133.39 109.51 131.25 96.78
2013 182.64 145.52 75.11 59.45 107.55 91.81 101.89 83.35
2014 117.40 131.45 78.63 56.36 155.20 83.80 88.53 80.96
2015 60.25 114.88 66.70 56.65 184.78 68.88 103.61 71.61
2016
January - March 49.49 71.93 64.73 50.45 70.24 - 63.72 63.97
April - June 45.92 73.61 66.00 - 285.66 - 76.90 66.30
July - September - 80.09 61.74 42.64 117.58 - 55.30 62.70
October - December - 82.33 69.20 60.12 162.95 - 114.45 71.32
U.S. Total 47.66 77.40 65.10 52.17 126.99 - 85.65 65.75
2017
January - March - 150.23 65.70 66.51 155.91 - 85.19 74.81
April - June 74.89 238.56 63.75 55.81 168.50 - 363.51 79.44
July - September - 188.40 62.12 60.01 69.52 - 126.07 79.71
October - December - 181.32 68.13 73.61 73.22 103.33 136.41 86.54
U.S. Total 74.89 189.83 64.44 64.11 97.33 103.33 132.12 79.62
- = No data reported.
Note: Average price is based on the customs import value, including value for shipments of specialty coal not used as a fuel source (about 0.05 percent of all shipments). Customs import value is the price paid formerchandise when sold for exportation to the United States, excluding U.S. import duties, freight, insurance, and other charges incurred in bringing the merchandise to the United States. Coal imports includecoal to Puerto Rico and the Virgin Islands. Total may not equal sum of components because of independent rounding.
Source: U.S. Department of Commerce, Bureau of the Census, 'Monthly Report IM 145.'
10
U.S. Energy Information Administration | Quarterly Coal Report, October - December 2017
Table 7. U.S. Coal Exports
U.S. Energy Information Administration | Quarterly Coal Report, October - December 2017
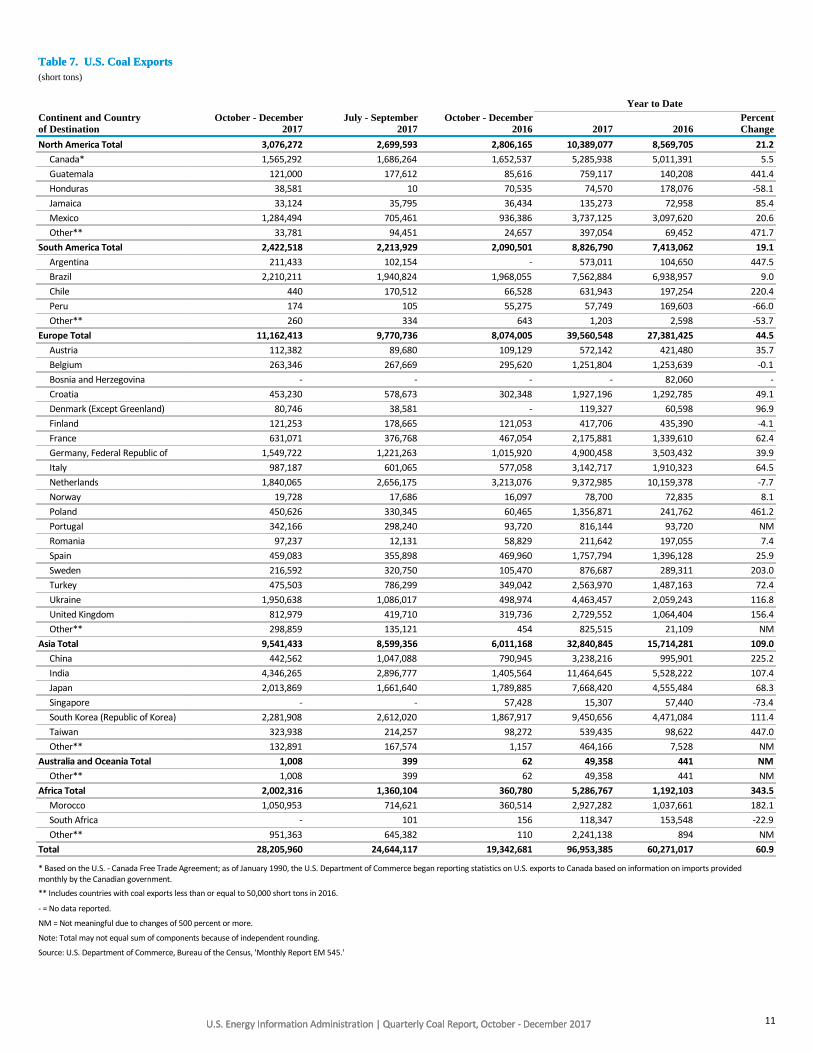
Table 7. U.S. Coal Exports(short tons)
Year to DateContinent and Countryof Destination
October - December2017
July - September2017
October - December2016 2017 2016
PercentChange
North America Total 3,076,272 2,699,593 2,806,165 10,389,077 8,569,705 21.2
Canada* 1,565,292 1,686,264 1,652,537 5,285,938 5,011,391 5.5
Guatemala 121,000 177,612 85,616 759,117 140,208 441.4
Honduras 38,581 10 70,535 74,570 178,076 -58.1
Jamaica 33,124 35,795 36,434 135,273 72,958 85.4
Mexico 1,284,494 705,461 936,386 3,737,125 3,097,620 20.6
Other** 33,781 94,451 24,657 397,054 69,452 471.7
South America Total 2,422,518 2,213,929 2,090,501 8,826,790 7,413,062 19.1
Argentina 211,433 102,154 - 573,011 104,650 447.5
Brazil 2,210,211 1,940,824 1,968,055 7,562,884 6,938,957 9.0
Chile 440 170,512 66,528 631,943 197,254 220.4
Peru 174 105 55,275 57,749 169,603 -66.0
Other** 260 334 643 1,203 2,598 -53.7
Europe Total 11,162,413 9,770,736 8,074,005 39,560,548 27,381,425 44.5
Austria 112,382 89,680 109,129 572,142 421,480 35.7
Belgium 263,346 267,669 295,620 1,251,804 1,253,639 -0.1
Bosnia and Herzegovina - - - - 82,060 -
Croatia 453,230 578,673 302,348 1,927,196 1,292,785 49.1
Denmark (Except Greenland) 80,746 38,581 - 119,327 60,598 96.9
Finland 121,253 178,665 121,053 417,706 435,390 -4.1
France 631,071 376,768 467,054 2,175,881 1,339,610 62.4
Germany, Federal Republic of 1,549,722 1,221,263 1,015,920 4,900,458 3,503,432 39.9
Italy 987,187 601,065 577,058 3,142,717 1,910,323 64.5
Netherlands 1,840,065 2,656,175 3,213,076 9,372,985 10,159,378 -7.7
Norway 19,728 17,686 16,097 78,700 72,835 8.1
Poland 450,626 330,345 60,465 1,356,871 241,762 461.2
Portugal 342,166 298,240 93,720 816,144 93,720 NM
Romania 97,237 12,131 58,829 211,642 197,055 7.4
Spain 459,083 355,898 469,960 1,757,794 1,396,128 25.9
Sweden 216,592 320,750 105,470 876,687 289,311 203.0
Turkey 475,503 786,299 349,042 2,563,970 1,487,163 72.4
Ukraine 1,950,638 1,086,017 498,974 4,463,457 2,059,243 116.8
United Kingdom 812,979 419,710 319,736 2,729,552 1,064,404 156.4
Other** 298,859 135,121 454 825,515 21,109 NM
Asia Total 9,541,433 8,599,356 6,011,168 32,840,845 15,714,281 109.0
China 442,562 1,047,088 790,945 3,238,216 995,901 225.2
India 4,346,265 2,896,777 1,405,564 11,464,645 5,528,222 107.4
Japan 2,013,869 1,661,640 1,789,885 7,668,420 4,555,484 68.3
Singapore - - 57,428 15,307 57,440 -73.4
South Korea (Republic of Korea) 2,281,908 2,612,020 1,867,917 9,450,656 4,471,084 111.4
Taiwan 323,938 214,257 98,272 539,435 98,622 447.0
Other** 132,891 167,574 1,157 464,166 7,528 NM
Australia and Oceania Total 1,008 399 62 49,358 441 NM
Other** 1,008 399 62 49,358 441 NM
Africa Total 2,002,316 1,360,104 360,780 5,286,767 1,192,103 343.5
Morocco 1,050,953 714,621 360,514 2,927,282 1,037,661 182.1
South Africa - 101 156 118,347 153,548 -22.9
Other** 951,363 645,382 110 2,241,138 894 NM
Total 28,205,960 24,644,117 19,342,681 96,953,385 60,271,017 60.9
* Based on the U.S. - Canada Free Trade Agreement; as of January 1990, the U.S. Department of Commerce began reporting statistics on U.S. exports to Canada based on information on imports providedmonthly by the Canadian government.
** Includes countries with coal exports less than or equal to 50,000 short tons in 2016.
- = No data reported.
NM = Not meaningful due to changes of 500 percent or more.
Note: Total may not equal sum of components because of independent rounding.
Source: U.S. Department of Commerce, Bureau of the Census, 'Monthly Report EM 545.'
11
U.S. Energy Information Administration | Quarterly Coal Report, October - December 2017
Table 8. Average Price of U.S. Coal Exports
U.S. Energy Information Administration | Quarterly Coal Report, October - December 2017
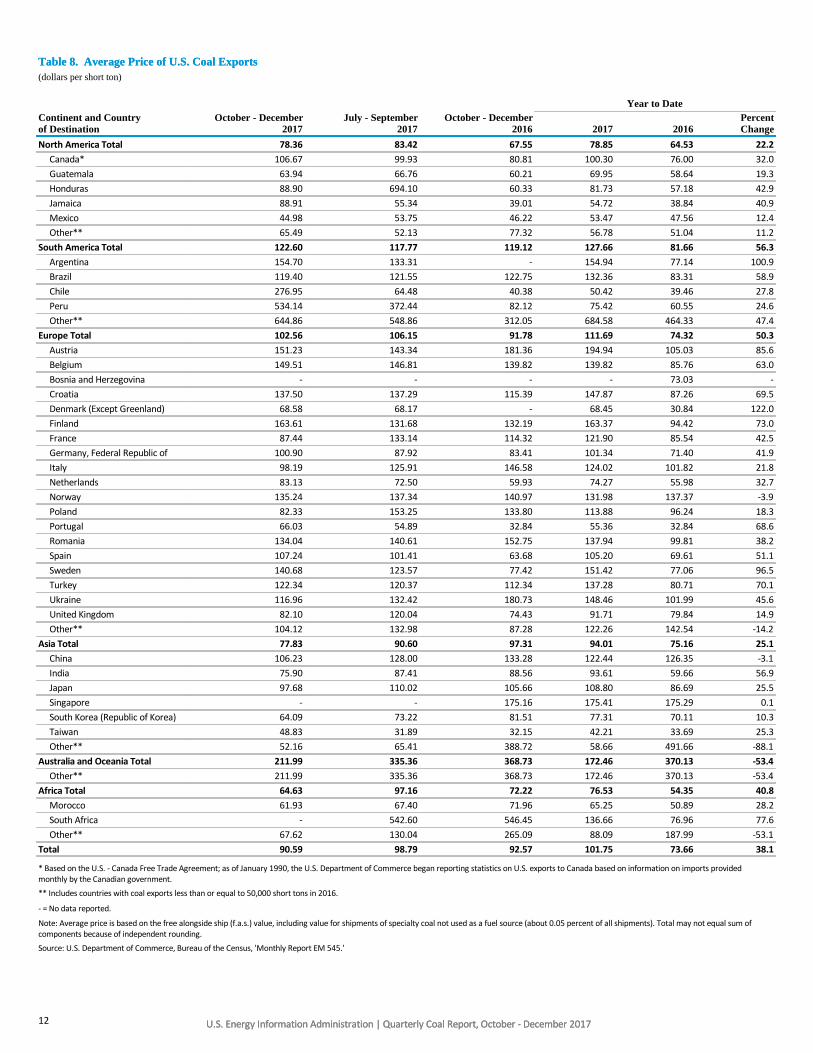
Table 8. Average Price of U.S. Coal Exports(dollars per short ton)
Year to DateContinent and Countryof Destination
October - December2017
July - September2017
October - December2016 2017 2016
PercentChange
North America Total 78.36 83.42 67.55 78.85 64.53 22.2
Canada* 106.67 99.93 80.81 100.30 76.00 32.0
Guatemala 63.94 66.76 60.21 69.95 58.64 19.3
Honduras 88.90 694.10 60.33 81.73 57.18 42.9
Jamaica 88.91 55.34 39.01 54.72 38.84 40.9
Mexico 44.98 53.75 46.22 53.47 47.56 12.4
Other** 65.49 52.13 77.32 56.78 51.04 11.2
South America Total 122.60 117.77 119.12 127.66 81.66 56.3
Argentina 154.70 133.31 - 154.94 77.14 100.9
Brazil 119.40 121.55 122.75 132.36 83.31 58.9
Chile 276.95 64.48 40.38 50.42 39.46 27.8
Peru 534.14 372.44 82.12 75.42 60.55 24.6
Other** 644.86 548.86 312.05 684.58 464.33 47.4
Europe Total 102.56 106.15 91.78 111.69 74.32 50.3
Austria 151.23 143.34 181.36 194.94 105.03 85.6
Belgium 149.51 146.81 139.82 139.82 85.76 63.0
Bosnia and Herzegovina - - - - 73.03 -
Croatia 137.50 137.29 115.39 147.87 87.26 69.5
Denmark (Except Greenland) 68.58 68.17 - 68.45 30.84 122.0
Finland 163.61 131.68 132.19 163.37 94.42 73.0
France 87.44 133.14 114.32 121.90 85.54 42.5
Germany, Federal Republic of 100.90 87.92 83.41 101.34 71.40 41.9
Italy 98.19 125.91 146.58 124.02 101.82 21.8
Netherlands 83.13 72.50 59.93 74.27 55.98 32.7
Norway 135.24 137.34 140.97 131.98 137.37 -3.9
Poland 82.33 153.25 133.80 113.88 96.24 18.3
Portugal 66.03 54.89 32.84 55.36 32.84 68.6
Romania 134.04 140.61 152.75 137.94 99.81 38.2
Spain 107.24 101.41 63.68 105.20 69.61 51.1
Sweden 140.68 123.57 77.42 151.42 77.06 96.5
Turkey 122.34 120.37 112.34 137.28 80.71 70.1
Ukraine 116.96 132.42 180.73 148.46 101.99 45.6
United Kingdom 82.10 120.04 74.43 91.71 79.84 14.9
Other** 104.12 132.98 87.28 122.26 142.54 -14.2
Asia Total 77.83 90.60 97.31 94.01 75.16 25.1
China 106.23 128.00 133.28 122.44 126.35 -3.1
India 75.90 87.41 88.56 93.61 59.66 56.9
Japan 97.68 110.02 105.66 108.80 86.69 25.5
Singapore - - 175.16 175.41 175.29 0.1
South Korea (Republic of Korea) 64.09 73.22 81.51 77.31 70.11 10.3
Taiwan 48.83 31.89 32.15 42.21 33.69 25.3
Other** 52.16 65.41 388.72 58.66 491.66 -88.1
Australia and Oceania Total 211.99 335.36 368.73 172.46 370.13 -53.4
Other** 211.99 335.36 368.73 172.46 370.13 -53.4
Africa Total 64.63 97.16 72.22 76.53 54.35 40.8
Morocco 61.93 67.40 71.96 65.25 50.89 28.2
South Africa - 542.60 546.45 136.66 76.96 77.6
Other** 67.62 130.04 265.09 88.09 187.99 -53.1
Total 90.59 98.79 92.57 101.75 73.66 38.1
* Based on the U.S. - Canada Free Trade Agreement; as of January 1990, the U.S. Department of Commerce began reporting statistics on U.S. exports to Canada based on information on imports providedmonthly by the Canadian government.
** Includes countries with coal exports less than or equal to 50,000 short tons in 2016.
- = No data reported.
Note: Average price is based on the free alongside ship (f.a.s.) value, including value for shipments of specialty coal not used as a fuel source (about 0.05 percent of all shipments). Total may not equal sum ofcomponents because of independent rounding.
Source: U.S. Department of Commerce, Bureau of the Census, 'Monthly Report EM 545.'
12
U.S. Energy Information Administration | Quarterly Coal Report, October - December 2017
Table 9. U.S. Steam Coal Exports
U.S. Energy Information Administration | Quarterly Coal Report, October - December 2017
Table 9. U.S. Steam Coal Exports(short tons)
Year to DateContinent and Countryof Destination
October - December2017
July - September2017
October - December2016 2017 2016
PercentChange
North America Total 1,301,995 1,293,749 1,287,816 5,264,273 4,256,556 23.7
Canada* 212,803 389,932 243,660 1,140,664 1,236,481 -7.7
Guatemala 121,000 177,612 85,616 759,117 140,208 441.4
Honduras 38,581 10 70,535 74,570 142,251 -47.6
Jamaica 33,124 35,795 36,434 135,273 72,958 85.4
Mexico 862,706 595,949 826,914 2,871,870 2,595,206 10.7
Other** 33,781 94,451 24,657 282,779 69,452 307.2
South America Total 77,710 316,320 222,247 934,526 489,727 90.8
Argentina 22 160 - 182 888 -79.5
Brazil 76,814 145,209 99,801 243,449 119,384 103.9
Chile 440 170,512 66,528 631,943 197,254 220.4
Peru 174 105 55,275 57,749 169,603 -66.0
Other** 260 334 643 1,203 2,598 -53.7
Europe Total 4,565,204 3,241,957 3,433,064 14,945,821 9,262,847 61.4
Austria 375 375 - 2,346 1,824 28.6
Belgium - 22 59 432 117,465 -99.6
Denmark (Except Greenland) 80,746 38,581 - 119,327 60,598 96.9
Finland - - - - 59,619 -
France 338,130 - 194,448 750,593 194,448 286.0
Germany, Federal Republic of 905,333 560,858 491,098 2,467,546 1,845,489 33.7
Italy 443,603 78,208 71,714 910,585 347,069 162.4
Netherlands 979,411 1,700,194 2,192,554 5,976,585 6,033,143 -0.9
Norway - 8,818 - 8,818 8,417 4.8
Poland 336,900 - - 524,976 - -
Portugal 342,166 298,240 - 731,347 - -
Spain 212,062 160,119 204,906 899,205 249,778 260.0
Sweden 53,022 98,238 - 151,488 - -
Turkey 63,367 171,135 137,085 471,986 189,853 148.6
Ukraine 133,883 - 19,990 133,883 32,211 315.6
United Kingdom 635,999 98,220 120,756 1,714,451 121,373 NM
Other** 40,207 28,949 454 82,253 1,560 NM
Asia Total 6,094,347 4,256,453 2,622,577 17,298,911 5,005,633 245.6
China 67,246 596 274,338 332,909 276,593 20.4
India 3,197,290 1,809,947 978,861 7,539,785 2,680,845 181.2
Japan 945,098 513,554 290,520 2,693,922 622,560 332.7
Singapore - - 23 7 35 -80.0
South Korea (Republic of Korea) 1,558,797 1,558,546 979,406 5,867,926 1,320,224 344.5
Taiwan 323,938 214,257 98,272 539,435 98,622 447.0
Other** 1,978 159,553 1,157 324,927 6,754 NM
Australia and Oceania Total 1,008 399 62 1,945 420 363.1
Other** 1,008 399 62 1,945 420 363.1
Africa Total 1,377,426 690,678 137,233 3,253,343 325,599 NM
Morocco 739,582 199,519 136,967 1,739,599 324,034 436.9
South Africa - 101 156 167 671 -75.1
Other** 637,844 491,058 110 1,513,577 894 NM
Total 13,417,690 9,799,556 7,702,999 41,698,819 19,340,782 115.6
* Based on the U.S. - Canada Free Trade Agreement; as of January 1990, the U.S. Department of Commerce began reporting statistics on U.S. exports to Canada based on information on imports providedmonthly by the Canadian government.
** Includes countries with coal exports less than or equal to 50,000 short tons in 2016.
- = No data reported.
NM = Not meaningful due to changes of 500 percent or more.
Note: Steam coal includes bituminous, sub-bituminous, lignite, and anthracite. Total may not equal sum of components because of independent rounding.
Source: U.S. Department of Commerce, Bureau of the Census, 'Monthly Report EM 545.'
13
U.S. Energy Information Administration | Quarterly Coal Report, October - December 2017
Table 10. Average Price of U.S. Steam Coal Exports
U.S. Energy Information Administration | Quarterly Coal Report, October - December 2017
Table 10. Average Price of U.S. Steam Coal Exports(dollars per short ton)
Year to DateContinent and Countryof Destination
October - December2017
July - September2017
October - December2016 2017 2016
PercentChange
North America Total 50.89 57.76 49.11 54.60 46.57 17.2
Canada* 106.10 89.35 74.77 91.50 65.51 39.7
Guatemala 63.94 66.76 60.21 69.95 58.64 19.3
Honduras 88.90 694.10 60.33 81.73 51.93 57.4
Jamaica 88.91 55.34 39.01 54.72 38.84 40.9
Mexico 31.71 35.44 39.05 35.69 36.70 -2.8
Other** 65.49 52.13 77.32 49.46 51.04 -3.1
South America Total 86.82 67.40 69.53 60.36 61.30 -1.5
Argentina 245.45 288.03 - 282.88 45.17 NM
Brazil 82.79 69.26 80.43 79.34 89.80 -11.6
Chile 276.95 64.48 40.38 50.42 39.46 27.8
Peru 534.14 372.44 82.12 75.42 60.55 24.6
Other** 644.86 548.86 312.05 684.58 464.33 47.4
Europe Total 63.54 64.68 55.03 62.78 51.78 21.2
Austria 27.66 27.66 - 26.53 28.43 -6.7
Belgium - 583.59 349.80 73.24 31.00 136.3
Denmark (Except Greenland) 68.58 68.17 - 68.45 30.84 122.0
Finland - - - - 76.03 -
France 63.02 - 77.03 69.33 77.03 -10.0
Germany, Federal Republic of 57.42 57.84 49.11 55.72 57.68 -3.4
Italy 63.60 108.45 89.19 70.47 76.30 -7.6
Netherlands 56.97 60.39 50.63 57.89 46.74 23.9
Norway - 131.55 - 131.55 157.18 -16.3
Poland 60.22 - - 63.12 - -
Portugal 66.03 54.89 - 57.23 - -
Spain 85.64 55.77 51.25 63.04 51.64 22.1
Sweden 137.90 92.91 - 108.63 - -
Turkey 67.91 115.87 108.71 123.84 89.48 38.4
Ukraine 75.98 - 158.50 75.98 122.46 -38.0
United Kingdom 67.79 55.05 31.24 62.55 35.34 77.0
Other** 32.43 90.71 87.28 63.05 132.97 -52.6
Asia Total 55.85 49.91 53.24 53.24 51.31 3.8
China 66.28 375.87 87.56 47.14 91.09 -48.2
India 62.96 58.11 54.27 60.13 48.99 22.7
Japan 62.23 68.31 83.36 69.09 62.35 10.8
Singapore - - 361.74 518.57 508.57 2.0
South Korea (Republic of Korea) 37.99 35.57 35.38 38.07 41.27 -7.8
Taiwan 48.83 31.89 32.15 42.21 33.69 25.3
Other** 381.00 60.72 388.72 60.77 538.49 -88.7
Australia and Oceania Total 211.99 335.36 368.73 274.36 366.28 -25.1
Other** 211.99 335.36 368.73 274.36 366.28 -25.1
Africa Total 62.27 100.95 66.11 69.68 51.86 34.4
Morocco 61.27 61.19 65.40 62.79 50.58 24.1
South Africa - 542.60 546.45 546.93 489.35 11.8
Other** 63.43 117.02 265.09 77.54 187.99 -58.8
Total 58.84 60.01 54.05 58.29 50.76 14.8
* Based on the U.S. - Canada Free Trade Agreement; as of January 1990, the U.S. Department of Commerce began reporting statistics on U.S. exports to Canada based on information on imports providedmonthly by the Canadian government.
** Includes countries with coal exports less than or equal to 50,000 short tons in 2016.
- = No data reported.
NM = Not meaningful due to changes of 500 percent or more.
Note: Average price is based on the free alongside ship (f.a.s) value, including value for shipments of specialty coal not used as a fuel source (about 0.05 percent of all shipments). Steam coal includes bituminous,sub-bituminous, lignite, and anthracite. Total may not equal sum of components because of independent rounding.
Source: U.S. Department of Commerce, Bureau of the Census, 'Monthly Report EM 545.'
14

U.S. Energy Information Administration | Quarterly Coal Report, October - December 2017
Table 11. U.S. Metallurgical Coal Exports
U.S. Energy Information Administration | Quarterly Coal Report, October - December 2017
Table 11. U.S. Metallurgical Coal Exports(short tons)
Year to DateContinent and Countryof Destination
October - December2017
July - September2017
October - December2016 2017 2016
PercentChange
North America Total 1,774,277 1,405,844 1,518,349 5,124,804 4,313,149 18.8
Canada* 1,352,489 1,296,332 1,408,877 4,145,274 3,774,910 9.8
Honduras - - - - 35,825 -
Mexico 421,788 109,512 109,472 865,255 502,414 72.2
Other** - - - 114,275 - -
South America Total 2,344,808 1,897,609 1,868,254 7,892,264 6,923,335 14.0
Argentina 211,411 101,994 - 572,829 103,762 452.1
Brazil 2,133,397 1,795,615 1,868,254 7,319,435 6,819,573 7.3
Europe Total 6,597,209 6,528,779 4,640,941 24,614,727 18,118,578 35.9
Austria 112,007 89,305 109,129 569,796 419,656 35.8
Belgium 263,346 267,647 295,561 1,251,372 1,136,174 10.1
Bosnia and Herzegovina - - - - 82,060 -
Croatia 453,230 578,673 302,348 1,927,196 1,292,785 49.1
Finland 121,253 178,665 121,053 417,706 375,771 11.2
France 292,941 376,768 272,606 1,425,288 1,145,162 24.5
Germany, Federal Republic of 644,389 660,405 524,822 2,432,912 1,657,943 46.7
Italy 543,584 522,857 505,344 2,232,132 1,563,254 42.8
Netherlands 860,654 955,981 1,020,522 3,396,400 4,126,235 -17.7
Norway 19,728 8,868 16,097 69,882 64,418 8.5
Poland 113,726 330,345 60,465 831,895 241,762 244.1
Portugal - - 93,720 84,797 93,720 -9.5
Romania 97,237 12,131 58,829 211,642 197,055 7.4
Spain 247,021 195,779 265,054 858,589 1,146,350 -25.1
Sweden 163,570 222,512 105,470 725,199 289,311 150.7
Turkey 412,136 615,164 211,957 2,091,984 1,297,310 61.3
Ukraine 1,816,755 1,086,017 478,984 4,329,574 2,027,032 113.6
United Kingdom 176,980 321,490 198,980 1,015,101 943,031 7.6
Other** 258,652 106,172 - 743,262 19,549 NM
Asia Total 3,447,086 4,342,903 3,388,591 15,541,934 10,708,648 45.1
China 375,316 1,046,492 516,607 2,905,307 719,308 303.9
India 1,148,975 1,086,830 426,703 3,924,860 2,847,377 37.8
Japan 1,068,771 1,148,086 1,499,365 4,974,498 3,932,924 26.5
Singapore - - 57,405 15,300 57,405 -73.3
South Korea (Republic of Korea) 723,111 1,053,474 888,511 3,582,730 3,150,860 13.7
Other** 130,913 8,021 - 139,239 774 NM
Australia and Oceania Total - - - 47,413 21 NM
Other** - - - 47,413 21 NM
Africa Total 624,890 669,426 223,547 2,033,424 866,504 134.7
Morocco 311,371 515,102 223,547 1,187,683 713,627 66.4
South Africa - - - 118,180 152,877 -22.7
Other** 313,519 154,324 - 727,561 - -
Total 14,788,270 14,844,561 11,639,682 55,254,566 40,930,235 35.0
* Based on the U.S. - Canada Free Trade Agreement; as of January 1990, the U.S. Department of Commerce began reporting statistics on U.S. exports to Canada based on information on imports providedmonthly by the Canadian government.
** Includes countries with coal exports less than or equal to 50,000 short tons in 2016.
- = No data reported.
NM = Not meaningful due to changes of 500 percent or more.
Note: Total may not equal sum of components because of independent rounding.
Source: U.S. Department of Commerce, Bureau of the Census, 'Monthly Report EM 545.'
15

U.S. Energy Information Administration | Quarterly Coal Report, October - December 2017
Table 12. Average Price of U.S. Metallurgical Coal Exports
U.S. Energy Information Administration | Quarterly Coal Report, October - December 2017
Table 12. Average Price of U.S. Metallurgical Coal Exports(dollars per short ton)
Year to DateContinent and Countryof Destination
October - December2017
July - September2017
October - December2016 2017 2016
PercentChange
North America Total 98.52 107.03 83.19 103.75 82.25 26.1
Canada* 106.76 103.12 81.86 102.73 79.44 29.3
Honduras - - - - 78.02 -
Mexico 72.10 153.35 100.33 112.48 103.67 8.5
Other** - - - 74.87 - -
South America Total 123.79 126.17 125.02 135.63 83.10 63.2
Argentina 154.69 133.07 - 154.90 77.41 100.1
Brazil 120.72 125.78 125.02 134.12 83.19 61.2
Europe Total 129.55 126.75 118.97 141.39 85.85 64.7
Austria 151.64 143.82 181.36 195.64 105.36 85.7
Belgium 149.51 146.77 139.78 139.84 91.42 53.0
Bosnia and Herzegovina - - - - 73.03 -
Croatia 137.50 137.29 115.39 147.87 87.26 69.5
Finland 163.61 131.68 132.19 163.37 97.34 67.8
France 115.62 133.14 140.91 149.58 86.98 72.0
Germany, Federal Republic of 161.99 113.47 115.50 147.60 86.67 70.3
Italy 126.43 128.53 154.72 145.86 107.48 35.7
Netherlands 112.91 94.03 79.91 103.10 69.49 48.4
Norway 135.24 143.09 140.97 132.04 134.78 -2.0
Poland 147.82 153.25 133.80 145.91 96.24 51.6
Portugal - - 32.84 39.19 32.84 19.3
Romania 134.04 140.61 152.75 137.94 99.81 38.2
Spain 125.79 138.74 73.29 149.35 73.53 103.1
Sweden 141.59 137.11 77.42 160.35 77.06 108.1
Turkey 130.71 121.62 114.69 140.31 79.43 76.6
Ukraine 119.98 132.42 181.66 150.71 101.67 48.2
United Kingdom 133.55 139.89 100.64 140.97 85.57 64.7
Other** 115.27 144.51 - 128.81 143.30 -10.1
Asia Total 116.69 130.48 131.41 139.38 86.31 61.5
China 113.38 127.86 157.56 131.07 139.91 -6.3
India 111.90 136.21 167.20 157.94 69.69 126.6
Japan 129.03 128.67 109.99 130.30 90.54 43.9
Singapore - - 175.09 175.25 175.09 0.1
South Korea (Republic of Korea) 120.37 128.91 132.35 141.59 82.19 72.3
Other** 47.19 158.70 - 53.73 82.99 -35.3
Australia and Oceania Total - - - 168.28 447.00 -62.4
Other** - - - 168.28 447.00 -62.4
Africa Total 69.84 93.24 75.98 87.50 55.29 58.3
Morocco 63.50 69.80 75.98 68.86 51.03 34.9
South Africa - - - 136.08 75.15 81.1
Other** 76.13 171.46 - 110.04 - -
Total 119.39 124.39 118.07 134.55 84.48 59.3
* Based on the U.S. - Canada Free Trade Agreement; as of January 1990, the U.S. Department of Commerce began reporting statistics on U.S. exports to Canada based on information on imports providedmonthly by the Canadian government.
** Includes countries with coal exports less than or equal to 50,000 short tons in 2016.
- = No data reported.
Note: Average price is based on the free alongside ship (f.a.s) value, including value for shipments of specialty coal not used as a fuel source (about 0.05 percent of all shipments). Total may not equal sum ofcomponents because of independent rounding.
Source: U.S. Department of Commerce, Bureau of the Census, 'Monthly Report EM 545.'
16
U.S. Energy Information Administration | Quarterly Coal Report, October - December 2017
Table 13. U.S. Coal Exports by Customs District
U.S. Energy Information Administration | Quarterly Coal Report, October - December 2017
Table 13. U.S. Coal Exports by Customs District(short tons)
Year to Date
Customs District October - December2017
July - September2017
October - December2016 2017 2016
PercentChange
Eastern Total 16,910,738 14,875,014 11,920,824 57,892,030 39,058,647 48.2
Baltimore, MD 6,487,687 5,096,774 4,463,195 20,804,995 14,381,776 44.7
Buffalo, NY 709,786 552,256 516,940 1,714,010 1,245,795 37.6
New York City, NY 174,009 158,442 4,168 341,902 10,395 NM
Norfolk, VA 9,465,580 8,989,234 6,784,774 34,768,195 23,066,906 50.7
Ogdensburg, NY 63,186 51,298 64,712 147,255 143,726 2.5
Philadelphia, PA 10,383 26,796 86,950 115,257 144,921 -20.5
Portland, ME 53 91 - 172 64,696 -99.7
St. Albans, VT - 123 85 190 363 -47.7
Washington, DC 54 - - 54 69 -21.7
Southern Total 7,417,745 6,131,789 4,703,640 25,451,285 15,099,315 68.6
Charleston, SC 19 190 97 505 942 -46.4
El Paso, TX 30,807 50,532 24,010 175,589 102,309 71.6
Houston-Galveston, TX 198,101 137,007 52,314 399,920 56,878 NM
Laredo, TX 671,244 509,639 529,461 2,463,862 1,917,492 28.5
Miami, FL 193 30 46 761 1,753 -56.6
Mobile, AL 1,836,910 3,101,547 1,550,483 9,958,629 6,987,337 42.5
New Orleans, LA 4,679,751 2,332,607 2,481,954 12,450,529 5,966,782 108.7
Port Arthur, TX - - 63,934 - 63,934 -
Savannah, GA 494 198 223 1,125 499 125.5
Tampa, FL 226 39 1,118 365 1,389 -73.7
Western Total 3,084,679 2,554,309 1,781,157 10,432,390 2,842,444 267.0
Anchorage, AK 1 - 110 273 71,807 -99.6
Great Falls, MT 106 42 279 245 889 -72.4
Honolulu, HI - - - 75 - -
Los Angeles, CA 330,586 205,239 231,144 1,194,891 306,243 290.2
Nogales, AZ 161,002 36,178 128 197,230 246 NM
Portland, OR - - - 2 - -
San Diego, CA 21 - 14 77 84 -8.3
San Francisco, CA 905,054 722,030 518,453 3,046,263 1,353,624 125.0
Seattle, WA 1,687,909 1,590,820 1,031,029 5,993,334 1,109,551 440.2
Northern Total 769,067 1,077,828 927,953 3,130,298 3,249,686 -3.7
Chicago, IL - 32,614 - 32,661 - -
Cleveland, OH 715,935 784,128 835,934 2,593,236 2,425,169 6.9
Detroit, MI 51,131 94,148 88,152 258,920 765,873 -66.2
Duluth, MN - 4,153 2,910 9,336 5,188 80.0
Minneapolis, MN - 158,329 - 220,511 51,216 330.6
Pembina, ND 2,001 4,456 957 15,634 2,240 NM
Other Ports 23,731 5,177 9,107 47,382 20,925 126.4
Total 28,205,960 24,644,117 19,342,681 96,953,385 60,271,017 60.9
- = No data reported.
NM = Not meaningful due to changes of 500 percent or more.
Note: Total may not equal sum of components because of independent rounding.
Source: U.S. Department of Commerce, Bureau of the Census, 'Monthly Report EM 545.'
17

U.S. Energy Information Administration | Quarterly Coal Report, October - December 2017
Table 14. Steam Coal Exports by Customs District
U.S. Energy Information Administration | Quarterly Coal Report, October - December 2017
Table 14. Steam Coal Exports by Customs District(short tons)
Year to Date
Customs District October - December2017
July - September2017
October - December2016 2017 2016
PercentChange
Eastern Total 5,448,752 3,886,640 3,238,929 16,209,775 7,813,233 107.5
Baltimore, MD 3,388,163 2,441,907 2,220,349 10,176,848 5,224,123 94.8
Buffalo, NY 32,626 3,767 3,108 44,057 12,124 263.4
New York City, NY 174,009 158,442 4,168 341,853 10,395 NM
Norfolk, VA 1,788,981 1,204,598 892,246 5,394,393 2,247,194 140.1
Ogdensburg, NY 54,483 50,916 32,023 136,951 109,348 25.2
Philadelphia, PA 10,383 26,796 86,950 115,257 144,921 -20.5
Portland, ME 53 91 - 172 64,696 -99.7
St. Albans, VT - 123 85 190 363 -47.7
Washington, DC 54 - - 54 69 -21.7
Southern Total 4,758,087 3,023,063 2,608,209 14,344,043 8,037,680 78.5
Charleston, SC 19 38 97 101 579 -82.6
El Paso, TX 30,807 50,532 24,010 175,589 102,309 71.6
Houston-Galveston, TX 198,101 137,007 52,314 399,920 56,878 NM
Laredo, TX 670,876 509,251 529,116 2,430,940 1,851,080 31.3
Miami, FL 193 30 46 761 1,753 -56.6
Mobile, AL 112,831 98,238 - 223,390 709,460 -68.5
New Orleans, LA 3,744,843 2,227,883 1,937,563 11,112,690 5,250,141 111.7
Port Arthur, TX - - 63,934 - 63,934 -
Savannah, GA 191 45 11 287 157 82.8
Tampa, FL 226 39 1,118 365 1,389 -73.7
Western Total 3,084,662 2,554,309 1,781,157 10,432,321 2,726,119 282.7
Anchorage, AK 1 - 110 221 71,760 -99.7
Great Falls, MT 89 42 279 228 889 -74.4
Honolulu, HI - - - 75 - -
Los Angeles, CA 330,586 205,239 231,144 1,194,891 233,330 412.1
Nogales, AZ 161,002 36,178 128 197,230 246 NM
Portland, OR - - - 2 - -
San Diego, CA 21 - 14 77 84 -8.3
San Francisco, CA 905,054 722,030 518,453 3,046,263 1,310,259 132.5
Seattle, WA 1,687,909 1,590,820 1,031,029 5,993,334 1,109,551 440.2
Northern Total 102,458 330,367 65,597 665,308 742,825 -10.4
Chicago, IL - - - 47 - -
Cleveland, OH 68,602 119,498 27,541 281,634 179,887 56.6
Detroit, MI 31,855 43,931 34,189 138,146 504,294 -72.6
Duluth, MN - 4,153 2,910 9,336 5,188 80.0
Minneapolis, MN - 158,329 - 220,511 51,216 330.6
Pembina, ND 2,001 4,456 957 15,634 2,240 NM
Other Ports 23,731 5,177 9,107 47,372 20,925 126.4
Total 13,417,690 9,799,556 7,702,999 41,698,819 19,340,782 115.6
- = No data reported.
NM = Not meaningful due to changes of 500 percent or more.
Note: Total may not equal sum of components because of independent rounding.
Source: U.S. Department of Commerce, Bureau of the Census, 'Monthly Report EM 545.'
18
U.S. Energy Information Administration | Quarterly Coal Report, October - December 2017
Table 15. Metallurgical Coal Exports by Customs District
U.S. Energy Information Administration | Quarterly Coal Report, October - December 2017
Table 15. Metallurgical Coal Exports by Customs District(short tons)
Year to Date
Customs District October - December2017
July - September2017
October - December2016 2017 2016
PercentChange
Eastern Total 11,461,986 10,988,374 8,681,895 41,682,255 31,245,414 33.4
Baltimore, MD 3,099,524 2,654,867 2,242,846 10,628,147 9,157,653 16.1
Buffalo, NY 677,160 548,489 513,832 1,669,953 1,233,671 35.4
New York City, NY - - - 49 - -
Norfolk, VA 7,676,599 7,784,636 5,892,528 29,373,802 20,819,712 41.1
Ogdensburg, NY 8,703 382 32,689 10,304 34,378 -70.0
Southern Total 2,659,658 3,108,726 2,095,431 11,107,242 7,061,635 57.3
Charleston, SC - 152 - 404 363 11.3
Laredo, TX 368 388 345 32,922 66,412 -50.4
Mobile, AL 1,724,079 3,003,309 1,550,483 9,735,239 6,277,877 55.1
New Orleans, LA 934,908 104,724 544,391 1,337,839 716,641 86.7
Savannah, GA 303 153 212 838 342 145.0
Western Total 17 - - 69 116,325 -99.9
Anchorage, AK - - - 52 47 10.6
Great Falls, MT 17 - - 17 - -
Los Angeles, CA - - - - 72,913 -
San Francisco, CA - - - - 43,365 -
Northern Total 666,609 747,461 862,356 2,464,990 2,506,861 -1.7
Chicago, IL - 32,614 - 32,614 - -
Cleveland, OH 647,333 664,630 808,393 2,311,602 2,245,282 3.0
Detroit, MI 19,276 50,217 53,963 120,774 261,579 -53.8
Other Ports - - - 10 - -
Total 14,788,270 14,844,561 11,639,682 55,254,566 40,930,235 35.0
- = No data reported.
Note: Total may not equal sum of components because of independent rounding.
Source: U.S. Department of Commerce, Bureau of the Census, 'Monthly Report EM 545.'
19

U.S. Energy Information Administration | Quarterly Coal Report, October - December 2017
Table 16. U.S. Coke Exports
U.S. Energy Information Administration | Quarterly Coal Report, October - December 2017
Table 16. U.S. Coke Exports(short tons)
Year to DateContinent and Countryof Destination
October - December2017
July - September2017
October - December2016 2017 2016
PercentChange
North America Total 387,738 277,649 466,796 1,066,195 976,131 9.2
Canada* 244,822 183,506 247,481 772,477 602,934 28.1
Mexico 142,081 93,601 219,081 291,871 372,138 -21.6
Other** 835 542 234 1,847 1,059 74.4
South America Total - 69 - 95 53 79.2
Other** - 69 - 95 53 79.2
Europe Total 69,855 110 92 102,002 22,402 355.3
Other** 69,855 110 92 102,002 22,402 355.3
Asia Total 126 343 87 22,233 1,119 NM
Other** 126 343 87 22,233 1,119 NM
Australia and Oceania Total 86 171 268 334 613 -45.5
Other** 86 171 268 334 613 -45.5
Africa Total - - - 18,188 - -
Other** - - - 18,188 - -
Total 457,805 278,342 467,243 1,209,047 1,000,318 20.9
* Based on the U.S. - Canada Free Trade Agreement; as of January 1990, the U.S. Department of Commerce began reporting statistics on U.S. exports to Canada based on information on imports providedmonthly by the Canadian government.
** Includes countries with coal exports less than or equal to 50,000 short tons in 2016.
- = No data reported.
NM = Not meaningful due to changes of 500 percent or more.
Note: Total may not equal sum of components because of independent rounding.
Source: U.S. Department of Commerce, Bureau of the Census, 'Monthly Report EM 545.'
20

U.S. Energy Information Administration | Quarterly Coal Report, October - December 2017
Table 17. Average Price of U.S. Coke Exports
U.S. Energy Information Administration | Quarterly Coal Report, October - December 2017
Table 17. Average Price of U.S. Coke Exports(dollars per short ton)
Year to DateContinent and Countryof Destination
October - December2017
July - September2017
October - December2016 2017 2016
PercentChange
North America Total 235.26 257.78 181.69 243.55 219.33 11.0
Canada* 219.52 249.07 179.84 229.52 211.66 8.4
Mexico 261.78 274.22 183.36 279.56 230.64 21.2
Other** 336.67 364.51 568.95 419.06 611.64 -31.5
South America Total - 529.43 - 526.36 515.13 2.2
Other** - 529.43 - 526.36 515.13 2.2
Europe Total 151.46 461.85 488.74 137.64 76.83 79.1
Other** 151.46 461.85 488.74 137.64 76.83 79.1
Asia Total 892.87 826.23 671.06 180.17 729.01 -75.3
Other** 892.87 826.23 671.06 180.17 729.01 -75.3
Australia and Oceania Total 446.52 463.73 498.19 412.89 460.74 -10.4
Other** 446.52 463.73 498.19 412.89 460.74 -10.4
Africa Total - - - 90.72 - -
Other** - - - 90.72 - -
Total 222.69 258.75 182.02 231.22 216.88 6.6
* Based on the U.S. - Canada Free Trade Agreement; as of January 1990, the U.S. Department of Commerce began reporting statistics on U.S. exports to Canada based on information on imports providedmonthly by the Canadian government.
** Includes countries with coal exports less than or equal to 50,000 short tons in 2016.
- = No data reported.
Note: Total may not equal sum of components because of independent rounding.
Source: U.S. Department of Commerce, Bureau of the Census, 'Monthly Report EM 545.'
21
U.S. Energy Information Administration | Quarterly Coal Report, October - December 2017
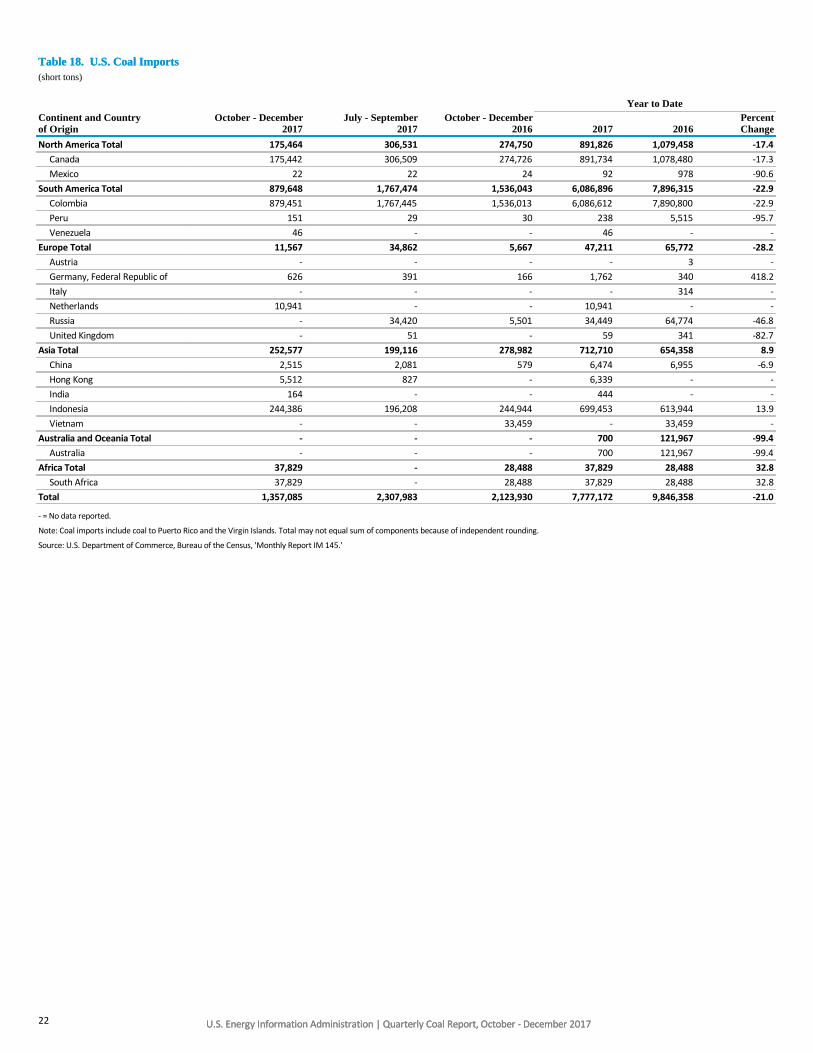
Table 18. U.S. Coal Imports
U.S. Energy Information Administration | Quarterly Coal Report, October - December 2017
Table 18. U.S. Coal Imports(short tons)
Year to DateContinent and Countryof Origin
October - December2017
July - September2017
October - December2016 2017 2016
PercentChange
North America Total 175,464 306,531 274,750 891,826 1,079,458 -17.4
Canada 175,442 306,509 274,726 891,734 1,078,480 -17.3
Mexico 22 22 24 92 978 -90.6
South America Total 879,648 1,767,474 1,536,043 6,086,896 7,896,315 -22.9
Colombia 879,451 1,767,445 1,536,013 6,086,612 7,890,800 -22.9
Peru 151 29 30 238 5,515 -95.7
Venezuela 46 - - 46 - -
Europe Total 11,567 34,862 5,667 47,211 65,772 -28.2
Austria - - - - 3 -
Germany, Federal Republic of 626 391 166 1,762 340 418.2
Italy - - - - 314 -
Netherlands 10,941 - - 10,941 - -
Russia - 34,420 5,501 34,449 64,774 -46.8
United Kingdom - 51 - 59 341 -82.7
Asia Total 252,577 199,116 278,982 712,710 654,358 8.9
China 2,515 2,081 579 6,474 6,955 -6.9
Hong Kong 5,512 827 - 6,339 - -
India 164 - - 444 - -
Indonesia 244,386 196,208 244,944 699,453 613,944 13.9
Vietnam - - 33,459 - 33,459 -
Australia and Oceania Total - - - 700 121,967 -99.4
Australia - - - 700 121,967 -99.4
Africa Total 37,829 - 28,488 37,829 28,488 32.8
South Africa 37,829 - 28,488 37,829 28,488 32.8
Total 1,357,085 2,307,983 2,123,930 7,777,172 9,846,358 -21.0
- = No data reported.
Note: Coal imports include coal to Puerto Rico and the Virgin Islands. Total may not equal sum of components because of independent rounding.
Source: U.S. Department of Commerce, Bureau of the Census, 'Monthly Report IM 145.'
22
U.S. Energy Information Administration | Quarterly Coal Report, October - December 2017
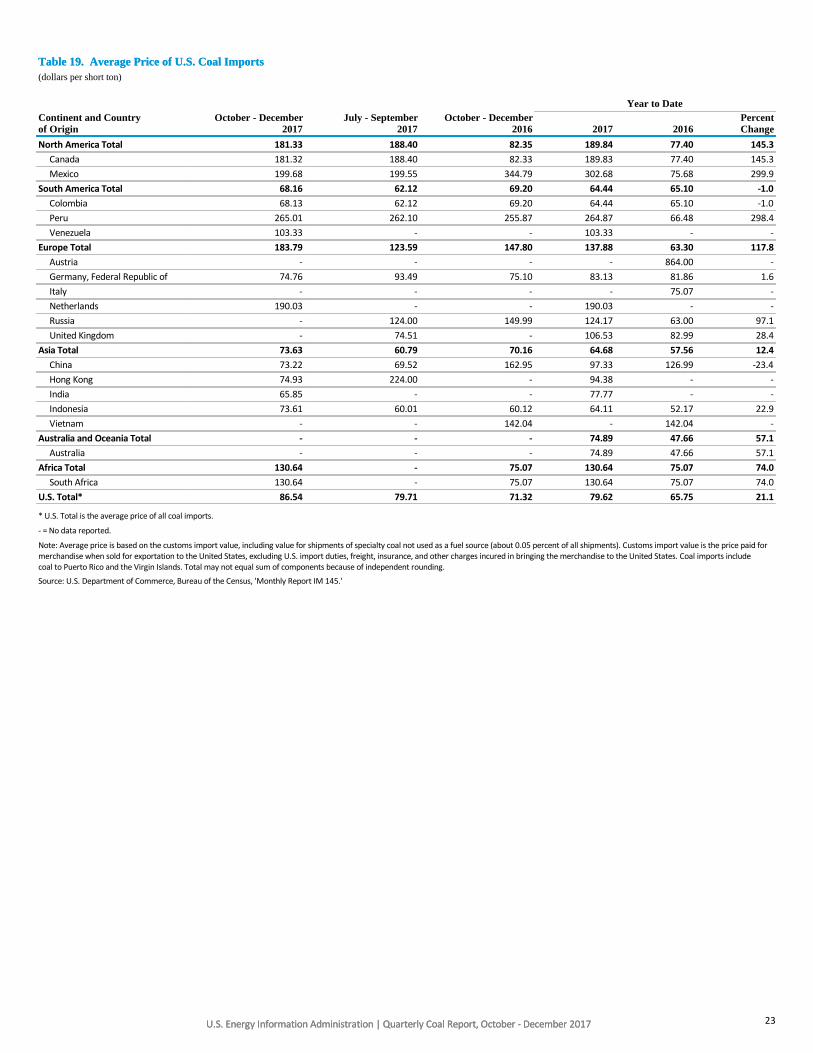
Table 19. Average Price of U.S. Coal Imports
U.S. Energy Information Administration | Quarterly Coal Report, October - December 2017
Table 19. Average Price of U.S. Coal Imports(dollars per short ton)
Year to DateContinent and Countryof Origin
October - December2017
July - September2017
October - December2016 2017 2016
PercentChange
North America Total 181.33 188.40 82.35 189.84 77.40 145.3
Canada 181.32 188.40 82.33 189.83 77.40 145.3
Mexico 199.68 199.55 344.79 302.68 75.68 299.9
South America Total 68.16 62.12 69.20 64.44 65.10 -1.0
Colombia 68.13 62.12 69.20 64.44 65.10 -1.0
Peru 265.01 262.10 255.87 264.87 66.48 298.4
Venezuela 103.33 - - 103.33 - -
Europe Total 183.79 123.59 147.80 137.88 63.30 117.8
Austria - - - - 864.00 -
Germany, Federal Republic of 74.76 93.49 75.10 83.13 81.86 1.6
Italy - - - - 75.07 -
Netherlands 190.03 - - 190.03 - -
Russia - 124.00 149.99 124.17 63.00 97.1
United Kingdom - 74.51 - 106.53 82.99 28.4
Asia Total 73.63 60.79 70.16 64.68 57.56 12.4
China 73.22 69.52 162.95 97.33 126.99 -23.4
Hong Kong 74.93 224.00 - 94.38 - -
India 65.85 - - 77.77 - -
Indonesia 73.61 60.01 60.12 64.11 52.17 22.9
Vietnam - - 142.04 - 142.04 -
Australia and Oceania Total - - - 74.89 47.66 57.1
Australia - - - 74.89 47.66 57.1
Africa Total 130.64 - 75.07 130.64 75.07 74.0
South Africa 130.64 - 75.07 130.64 75.07 74.0
U.S. Total* 86.54 79.71 71.32 79.62 65.75 21.1
* U.S. Total is the average price of all coal imports.
- = No data reported.
Note: Average price is based on the customs import value, including value for shipments of specialty coal not used as a fuel source (about 0.05 percent of all shipments). Customs import value is the price paid formerchandise when sold for exportation to the United States, excluding U.S. import duties, freight, insurance, and other charges incured in bringing the merchandise to the United States. Coal imports includecoal to Puerto Rico and the Virgin Islands. Total may not equal sum of components because of independent rounding.
Source: U.S. Department of Commerce, Bureau of the Census, 'Monthly Report IM 145.'
23

U.S. Energy Information Administration | Quarterly Coal Report, October - December 2017
Table 20. Coal Imports by Customs District
U.S. Energy Information Administration | Quarterly Coal Report, October - December 2017
Table 20. Coal Imports by Customs District(short tons)
Year to Date
Customs District October - December2017
July - September2017
October - December2016 2017 2016
PercentChange
Eastern Total 41,215 2,124 92,473 167,986 900,129 -81.3
Baltimore, MD - 278 - 278 118,034 -99.8
Boston, MA - - 92,118 45,176 668,096 -93.2
Buffalo, NY 11,180 516 154 12,452 248 NM
New York City, NY 273 1,330 201 2,065 1,062 94.4
Ogdensburg, NY - - - 187 - -
Philadelphia, PA - - - 21 - -
Portland, ME 29,762 - - 107,807 42,440 154.0
Providence, RI - - - - 70,249 -
Southern Total 895,656 1,803,186 1,511,757 6,017,839 7,216,206 -16.6
Charleston, SC - - - - 54,020 -
Houston-Galveston, TX 315 29 358 1,804 718 151.3
Laredo, TX 22 22 24 92 978 -90.6
Miami, FL - 36,420 31,837 70,599 68,235 3.5
Mobile, AL 393,365 578,951 346,222 1,726,130 2,475,852 -30.3
New Orleans, LA 7,755 1,336 - 10,078 5,222 93.0
Port Arthur. TX - - - - 314 -
San Juan, PR 46 361,011 465,355 1,217,179 1,762,572 -30.9
Tampa, FL 494,153 825,417 667,961 2,991,957 2,848,295 5.0
Western Total 285,979 293,400 386,952 1,019,188 1,282,069 -20.5
Anchorage, AK - - - - 341 -
Great Falls, MT 40,363 96,299 141,823 250,993 433,932 -42.2
Honolulu, HI 244,386 196,208 244,944 765,487 831,195 -7.9
Los Angeles, CA - 10 18 10 18 -44.4
San Francisco, CA - 30 - 59 56 5.4
Seattle, WA 1,230 853 167 2,639 16,527 -84.0
Northern Total 134,235 209,273 132,748 572,159 447,954 27.7
Chicago, IL - 10 - 10 - -
Cleveland, OH 626 208 166 1,395 329 324.0
Detroit, MI 62,580 128,978 105,557 255,696 251,141 1.8
Duluth, MN 102 42 21 354 21 NM
Pembina, ND 70,927 80,035 27,004 314,704 196,463 60.2
Total 1,357,085 2,307,983 2,123,930 7,777,172 9,846,358 -21.0
- = No data reported.
NM = Not meaningful due to changes of 500 percent or more.
Note: Coal imports include coal to Puerto Rico and the Virgin Islands. Total may not equal sum of components because of independent rounding.
Source: U.S. Department of Commerce, Bureau of the Census, 'Monthly Report IM 145.'
24

U.S. Energy Information Administration | Quarterly Coal Report, October - December 2017
Table 21. U.S. Coke Imports
U.S. Energy Information Administration | Quarterly Coal Report, October - December 2017
Table 21. U.S. Coke Imports(short tons)
Year to DateContinent and Countryof Origin
October - December2017
July - September2017
October - December2016 2017 2016
PercentChange
North America Total 272 380 704 3,063 45,369 -93.2
Canada 272 380 704 3,052 45,369 -93.3
Mexico - - - 11 - -
South America Total 18,585 - 55,116 18,585 138,857 -86.6
Colombia 18,585 - 55,116 18,585 138,857 -86.6
Europe Total 443 266 782 23,301 42,023 -44.6
Germany, Federal Republic of - - - 8 77 -89.6
Italy 433 262 774 1,037 8,847 -88.3
Poland - - - 22,220 - -
Russia - - - - 33,069 -
United Kingdom 10 4 8 36 30 20.0
Asia Total 2,306 835 412 3,386 2,314 46.3
China 1,482 276 - 1,905 243 NM
Indonesia 24 78 54 200 200 s
Japan 800 481 358 1,281 1,871 -31.5
Africa Total 3,478 3,389 11 10,145 11 NM
Egypt - - 11 - 11 -
South Africa 3,478 3,389 - 10,145 - -
U.S. Total 25,084 4,870 57,025 58,480 228,574 -74.4
- = No data reported.
NM = Not meaningful due to changes of 500 percent or more.
s = Absolute percentage less than 0.05.
Note: Total may not equal sum of components because of independent rounding.
Source: U.S. Department of Commerce, Bureau of the Census, 'Monthly Report IM 145.'
25
U.S. Energy Information Administration | Quarterly Coal Report, October - December 2017
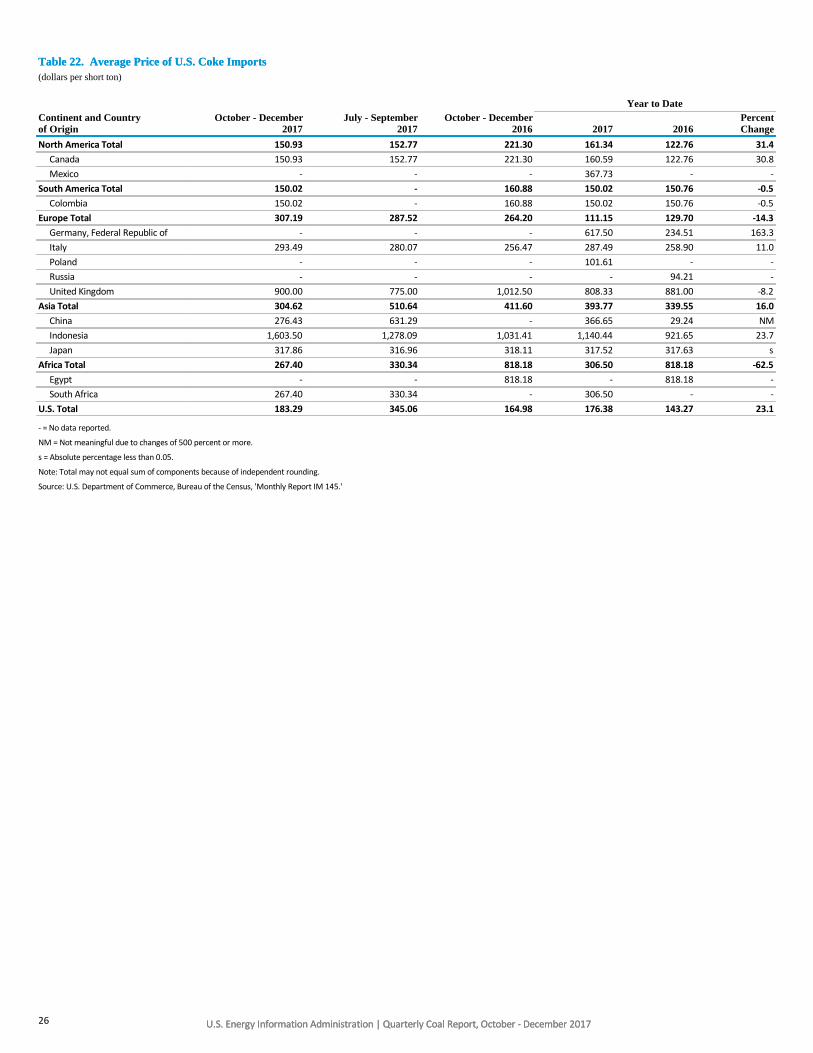
Table 22. Average Price of U.S. Coke Imports
U.S. Energy Information Administration | Quarterly Coal Report, October - December 2017
Table 22. Average Price of U.S. Coke Imports(dollars per short ton)
Year to DateContinent and Countryof Origin
October - December2017
July - September2017
October - December2016 2017 2016
PercentChange
North America Total 150.93 152.77 221.30 161.34 122.76 31.4
Canada 150.93 152.77 221.30 160.59 122.76 30.8
Mexico - - - 367.73 - -
South America Total 150.02 - 160.88 150.02 150.76 -0.5
Colombia 150.02 - 160.88 150.02 150.76 -0.5
Europe Total 307.19 287.52 264.20 111.15 129.70 -14.3
Germany, Federal Republic of - - - 617.50 234.51 163.3
Italy 293.49 280.07 256.47 287.49 258.90 11.0
Poland - - - 101.61 - -
Russia - - - - 94.21 -
United Kingdom 900.00 775.00 1,012.50 808.33 881.00 -8.2
Asia Total 304.62 510.64 411.60 393.77 339.55 16.0
China 276.43 631.29 - 366.65 29.24 NM
Indonesia 1,603.50 1,278.09 1,031.41 1,140.44 921.65 23.7
Japan 317.86 316.96 318.11 317.52 317.63 s
Africa Total 267.40 330.34 818.18 306.50 818.18 -62.5
Egypt - - 818.18 - 818.18 -
South Africa 267.40 330.34 - 306.50 - -
U.S. Total 183.29 345.06 164.98 176.38 143.27 23.1
- = No data reported.
NM = Not meaningful due to changes of 500 percent or more.
s = Absolute percentage less than 0.05.
Note: Total may not equal sum of components because of independent rounding.
Source: U.S. Department of Commerce, Bureau of the Census, 'Monthly Report IM 145.'
26

U.S. Energy Information Administration | Quarterly Coal Report, October - December 2017U.S. Energy Information Administration | Quarterly Coal Report, October - December 2017
Receipts and Prices____________________________________________________________________________________________________
27
U.S. Energy Information Administration | Quarterly Coal Report, October - December 2017
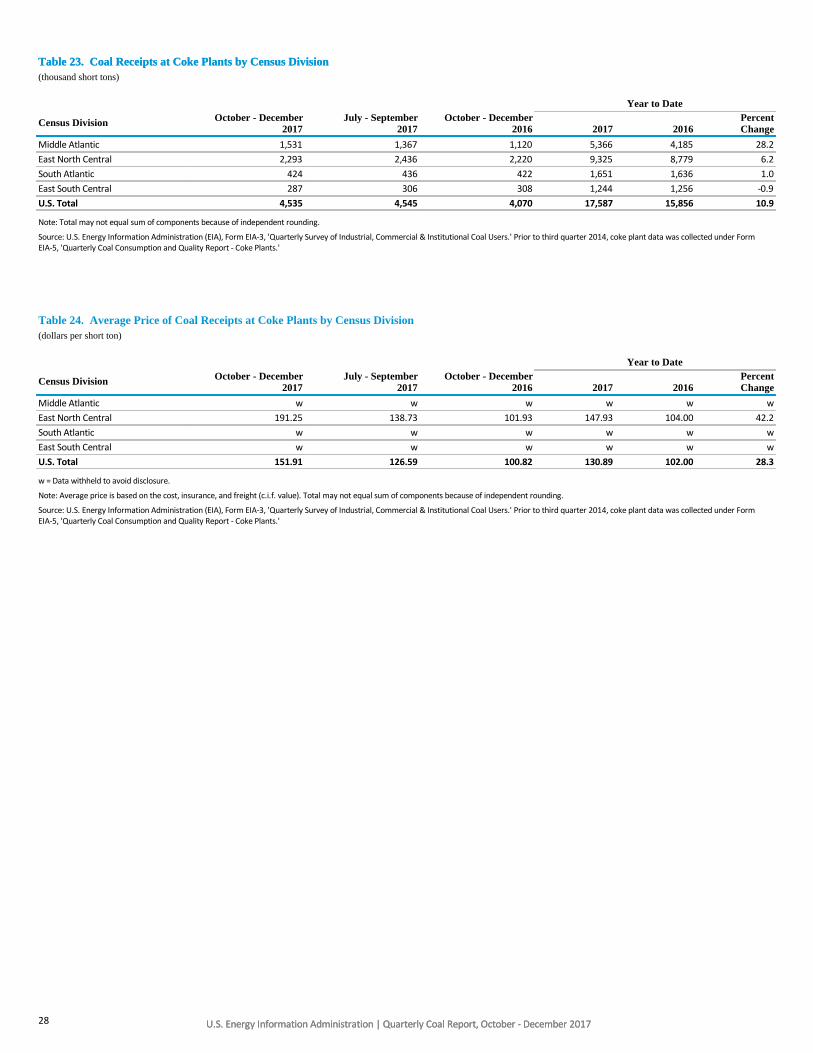
Table 23. Coal Receipts at Coke Plants by Census Division
U.S. Energy Information Administration | Quarterly Coal Report, October - December 2017
Table 23. Coal Receipts at Coke Plants by Census Division(thousand short tons)
Year to Date
Census Division October - December2017
July - September2017
October - December2016 2017 2016
PercentChange
Middle Atlantic 1,531 1,367 1,120 5,366 4,185 28.2
East North Central 2,293 2,436 2,220 9,325 8,779 6.2
South Atlantic 424 436 422 1,651 1,636 1.0
East South Central 287 306 308 1,244 1,256 -0.9
U.S. Total 4,535 4,545 4,070 17,587 15,856 10.9
Note: Total may not equal sum of components because of independent rounding.
Source: U.S. Energy Information Administration (EIA), Form EIA-3, 'Quarterly Survey of Industrial, Commercial & Institutional Coal Users.' Prior to third quarter 2014, coke plant data was collected under FormEIA-5, 'Quarterly Coal Consumption and Quality Report - Coke Plants.'
Table 24. Average Price of Coal Receipts at Coke Plants by Census Division(dollars per short ton)
Year to Date
Census Division October - December2017
July - September2017
October - December2016 2017 2016
PercentChange
Middle Atlantic w w w w w w
East North Central 191.25 138.73 101.93 147.93 104.00 42.2
South Atlantic w w w w w w
East South Central w w w w w w
U.S. Total 151.91 126.59 100.82 130.89 102.00 28.3
w = Data withheld to avoid disclosure.
Note: Average price is based on the cost, insurance, and freight (c.i.f. value). Total may not equal sum of components because of independent rounding.
Source: U.S. Energy Information Administration (EIA), Form EIA-3, 'Quarterly Survey of Industrial, Commercial & Institutional Coal Users.' Prior to third quarter 2014, coke plant data was collected under FormEIA-5, 'Quarterly Coal Consumption and Quality Report - Coke Plants.'
28

U.S. Energy Information Administration | Quarterly Coal Report, October - December 2017
Table 25. Open Market Sales and Average Price of Coke and Breeze
U.S. Energy Information Administration | Quarterly Coal Report, October - December 2017
Table 25. Open Market Sales and Average Price of Coke and Breeze(thousand short tons and dollars per short ton)
Year to Date
Commodity October - December2017
July - September2017
October - December2016 2017 2016
PercentChange
Coke
Sales 1,627 1,620 1,500 6,384 5,771 10.6
Average Price 389.23 274.05 278.68 301.67 289.61 4.2
Breeze
Sales 146 178 107 525 375 39.9
Average Price 80.57 69.91 74.59 75.71 77.86 -2.8
Note: Total may not equal sum of components because of independent rounding.
Source: U.S. Energy Information Administration (EIA), Form EIA-3, 'Quarterly Survey of Industrial, Commercial & Institutional Coal Users.' Prior to third quarter 2014, coke plant data was collected under FormEIA-5, 'Quarterly Coal Consumption and Quality Report - Coke Plants.'
29
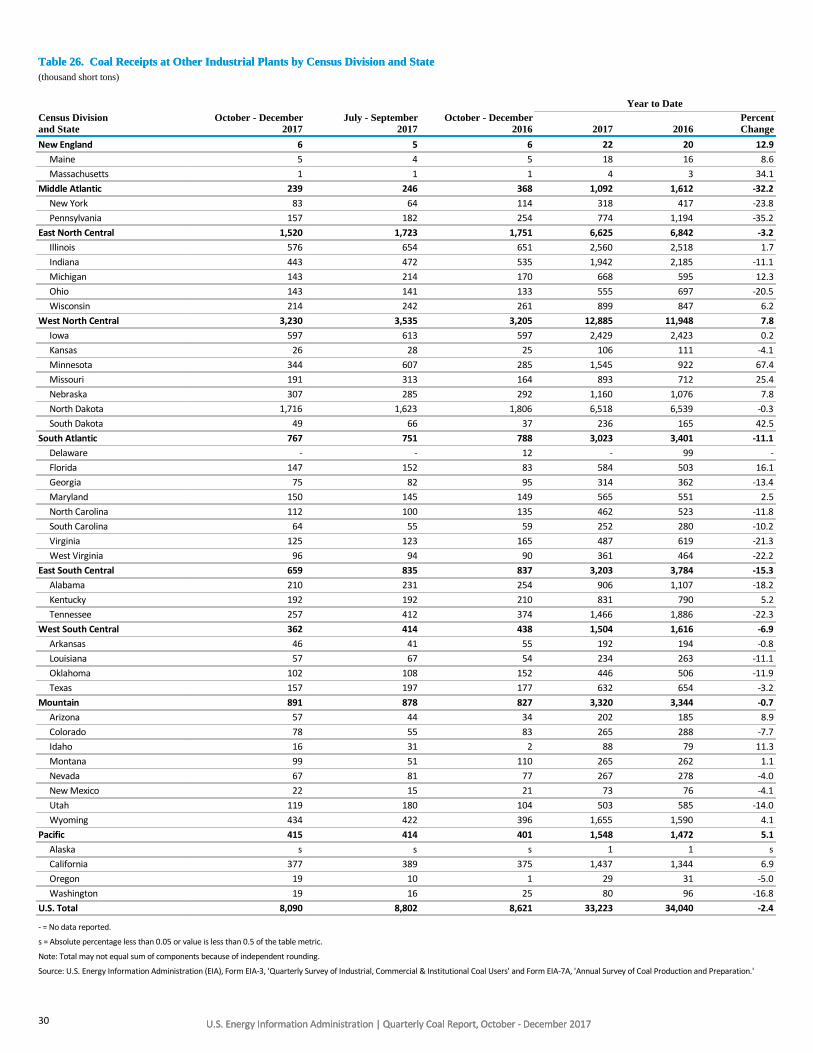
U.S. Energy Information Administration | Quarterly Coal Report, October - December 2017
Table 26. Coal Receipts at Other Industrial Plants by Census Division and State
U.S. Energy Information Administration | Quarterly Coal Report, October - December 2017
Table 26. Coal Receipts at Other Industrial Plants by Census Division and State(thousand short tons)
Year to DateCensus Divisionand State
October - December2017
July - September2017
October - December2016 2017 2016
PercentChange
New England 6 5 6 22 20 12.9
Maine 5 4 5 18 16 8.6
Massachusetts 1 1 1 4 3 34.1
Middle Atlantic 239 246 368 1,092 1,612 -32.2
New York 83 64 114 318 417 -23.8
Pennsylvania 157 182 254 774 1,194 -35.2
East North Central 1,520 1,723 1,751 6,625 6,842 -3.2
Illinois 576 654 651 2,560 2,518 1.7
Indiana 443 472 535 1,942 2,185 -11.1
Michigan 143 214 170 668 595 12.3
Ohio 143 141 133 555 697 -20.5
Wisconsin 214 242 261 899 847 6.2
West North Central 3,230 3,535 3,205 12,885 11,948 7.8
Iowa 597 613 597 2,429 2,423 0.2
Kansas 26 28 25 106 111 -4.1
Minnesota 344 607 285 1,545 922 67.4
Missouri 191 313 164 893 712 25.4
Nebraska 307 285 292 1,160 1,076 7.8
North Dakota 1,716 1,623 1,806 6,518 6,539 -0.3
South Dakota 49 66 37 236 165 42.5
South Atlantic 767 751 788 3,023 3,401 -11.1
Delaware - - 12 - 99 -
Florida 147 152 83 584 503 16.1
Georgia 75 82 95 314 362 -13.4
Maryland 150 145 149 565 551 2.5
North Carolina 112 100 135 462 523 -11.8
South Carolina 64 55 59 252 280 -10.2
Virginia 125 123 165 487 619 -21.3
West Virginia 96 94 90 361 464 -22.2
East South Central 659 835 837 3,203 3,784 -15.3
Alabama 210 231 254 906 1,107 -18.2
Kentucky 192 192 210 831 790 5.2
Tennessee 257 412 374 1,466 1,886 -22.3
West South Central 362 414 438 1,504 1,616 -6.9
Arkansas 46 41 55 192 194 -0.8
Louisiana 57 67 54 234 263 -11.1
Oklahoma 102 108 152 446 506 -11.9
Texas 157 197 177 632 654 -3.2
Mountain 891 878 827 3,320 3,344 -0.7
Arizona 57 44 34 202 185 8.9
Colorado 78 55 83 265 288 -7.7
Idaho 16 31 2 88 79 11.3
Montana 99 51 110 265 262 1.1
Nevada 67 81 77 267 278 -4.0
New Mexico 22 15 21 73 76 -4.1
Utah 119 180 104 503 585 -14.0
Wyoming 434 422 396 1,655 1,590 4.1
Pacific 415 414 401 1,548 1,472 5.1
Alaska s s s 1 1 s
California 377 389 375 1,437 1,344 6.9
Oregon 19 10 1 29 31 -5.0
Washington 19 16 25 80 96 -16.8
U.S. Total 8,090 8,802 8,621 33,223 34,040 -2.4
- = No data reported.
s = Absolute percentage less than 0.05 or value is less than 0.5 of the table metric.
Note: Total may not equal sum of components because of independent rounding.
Source: U.S. Energy Information Administration (EIA), Form EIA-3, 'Quarterly Survey of Industrial, Commercial & Institutional Coal Users' and Form EIA-7A, 'Annual Survey of Coal Production and Preparation.'
30

U.S. Energy Information Administration | Quarterly Coal Report, October - December 2017
Table 27. Average Price of Coal Receipts at Other Industrial Plants by Census Division and State
U.S. Energy Information Administration | Quarterly Coal Report, October - December 2017
Table 27. Average Price of Coal Receipts at Other Industrial Plants by Census Division and State(dollars per short ton)
Year to DateCensus Divisionand State
October - December2017
July - September2017
October - December2016 2017 2016
PercentChange
New England w w w w w w
Maine w w w w w w
Massachusetts w w w w w w
Middle Atlantic 92.05 85.48 72.27 81.87 79.11 3.5
New York 120.54 132.49 79.52 104.22 96.38 8.1
Pennsylvania 76.79 68.78 68.99 72.57 73.03 -0.6
East North Central 73.56 71.49 69.19 71.71 69.15 3.7
Illinois w 45.14 45.68 w w w
Indiana w 88.84 86.11 w w w
Michigan 91.07 81.65 74.94 83.81 77.91 7.6
Ohio 100.08 102.47 93.30 101.33 84.33 20.2
Wisconsin 81.29 81.92 77.13 80.45 77.95 3.2
West North Central 27.86 30.90 31.74 29.97 34.50 -13.1
Iowa 40.20 42.01 43.59 42.41 43.24 -1.9
Kansas w w w w w w
Minnesota 46.85 44.91 49.20 46.63 51.13 -8.8
Missouri 51.76 44.22 59.56 49.47 58.92 -16.0
Nebraska 26.72 30.73 28.70 29.72 29.07 2.2
North Dakota w w w w w w
South Dakota w w w w w w
South Atlantic 94.91 94.78 89.28 94.19 90.31 4.3
Delaware - - w - w -
Florida w w 91.35 w w w
Georgia 95.32 90.67 96.32 93.15 97.77 -4.7
Maryland w w w w w w
North Carolina 94.14 94.44 94.33 93.57 97.40 -3.9
South Carolina 97.41 100.10 92.98 97.33 93.60 4.0
Virginia 89.12 93.08 89.98 90.23 85.87 5.1
West Virginia 155.23 153.56 125.70 154.88 122.00 27.0
East South Central 85.22 86.99 85.51 87.53 88.20 -0.8
Alabama w 93.88 84.12 w w w
Kentucky 87.11 84.97 86.49 89.26 90.75 -1.6
Tennessee w 84.14 85.88 w w w
West South Central 67.85 64.32 67.09 65.36 67.15 -2.7
Arkansas w w w w w w
Louisiana w w w w w w
Oklahoma 64.25 w w w w w
Texas 73.96 75.48 75.37 73.32 81.81 -10.4
Mountain 52.19 55.16 50.21 52.62 52.58 0.1
Arizona w w w w w w
Colorado 40.30 w 58.25 w w w
Idaho 152.98 126.99 w 98.82 w w
Montana 33.42 44.36 35.13 37.48 40.60 -7.7
Nevada 73.52 71.08 69.90 69.91 69.87 0.1
New Mexico w w w w w w
Utah 52.77 52.86 51.80 53.77 50.01 7.5
Wyoming 45.46 43.09 43.45 44.47 42.47 4.7
Pacific 81.91 91.91 75.80 85.94 77.95 10.3
California 84.21 92.87 75.72 87.14 78.04 11.7
Oregon w w w w w w
Washington w w w w w w
U.S. Total 56.64 58.00 57.20 57.87 60.34 -4.1
- = No data reported.
w = Data withheld to avoid disclosure.
Note: Average price is based on the cost, insurance, and freight (c.i.f. value). Total may not equal sum of components because of independent rounding.
Source: U.S. Energy Information Administration (EIA), Form EIA-3, 'Quarterly Survey of Industrial, Commercial & Institutional Coal Users.'
31

U.S. Energy Information Administration | Quarterly Coal Report, October - December 2017
Table 28. U.S. Coal Receipts at Manufacturing Plants by North American Industry Classification System (NAICS) Code
U.S. Energy Information Administration | Quarterly Coal Report, October - December 2017
Table 28. U.S. Coal Receipts at Manufacturing Plants by North American Industry Classification System (NAICS) Code(thousand short tons)
Year to Date
NAICS Code October - December2017
July - September2017
October - December2016 2017 2016
PercentChange
311 Food Manufacturing 2,010 2,178 2,032 8,157 7,797 4.6
312 Beverage and Tobacco Product Mfg. 4 3 5 23 30 -22.7
313 Textile Mills 22 17 27 99 98 0.8
322 Paper Manufacturing 706 700 886 2,967 3,709 -20.0
324 Petroleum and Coal Products* 1,595 1,527 1,723 6,170 6,314 -2.3
325 Chemical Manufacturing 817 972 1,135 3,621 4,992 -27.5
327 Nonmetallic Mineral Products Mfg. 2,044 2,401 2,037 8,447 7,919 6.7
331 Primary Metal Manufacturing** 547 632 545 2,274 2,206 3.1
333 Machinery Manufacturing 3 5 27 17 101 -83.0
339 Miscellaneous Manufacturing 342 365 205 1,446 873 65.7
U.S. Total 8,090 8,802 8,621 33,223 34,040 -2.4
* Includes coal gasification projects.
** Excludes coke plants.
- = No data reported.
Note: Total may not equal sum of components because of independent rounding.
Source: U.S. Energy Information Administration (EIA), Form EIA-3, 'Quarterly Survey of Industrial, Commercial & Institutional Coal Users.'
Table 29. Average Price of U.S. Coal Receipts at Manufacturing Plants by North American Industry Classification System (NAICS) Code(dollars per short ton)
Year to Date
NAICS Code October - December2017
July - September2017
October - December2016 2017 2016
PercentChange
311 Food Manufacturing 42.16 43.87 44.13 42.86 45.80 -6.4
312 Beverage and Tobacco Product Mfg. w w w w 108.14 w
313 Textile Mills 112.67 114.80 111.93 110.10 110.47 -0.3
322 Paper Manufacturing 81.57 79.04 76.39 79.60 77.17 3.1
324 Petroleum and Coal Products* w w w w w w
325 Chemical Manufacturing 65.51 69.16 71.47 71.53 72.74 -1.7
327 Nonmetallic Mineral Products Mfg. 74.33 74.19 72.26 74.13 73.60 0.7
331 Primary Metal Manufacturing** 120.26 105.17 99.80 113.06 102.76 10.0
333 Machinery Manufacturing w w w w w w
339 Miscellaneous Manufacturing 52.52 53.43 54.72 52.91 62.91 -15.9
U.S. Total 56.64 58.00 57.20 57.87 60.34 -4.1
* Includes coal gasification projects.
** Excludes coke plants.
- = No data reported.
w = Data withheld to avoid disclosure.
Note: Average price is based on the cost, insurance, and freight (c.i.f. value). Total may not equal sum of components because of independent rounding.
Source: U.S. Energy Information Administration (EIA), Form EIA-3, 'Quarterly Survey of Industrial, Commercial & Institutional Coal Users.'
32

U.S. Energy Information Administration | Quarterly Coal Report, October - December 2017
Table 30. Coal Receipts at Commercial and Institutional Users by Census Division and State
U.S. Energy Information Administration | Quarterly Coal Report, October - December 2017
Table 30. Coal Receipts at Commercial and Institutional Users by Census Division and State(thousand short tons)
Year to DateCensus Divisionand State
October - December2017
July - September2017
October - December2016 2017 2016
PercentChange
Middle Atlantic 9 1 9 28 37 -24.7
Pennsylvania 9 1 9 28 37 -24.7
East North Central 48 33 60 165 225 -26.8
Illinois 27 20 32 101 112 -9.1
Indiana 16 13 15 44 59 -25.9
Ohio - - 7 - 33 -
Wisconsin 5 - 6 19 21 -9.5
West North Central 56 27 80 198 254 -22.0
Iowa 25 24 29 115 129 -10.7
Minnesota 1 s 1 8 9 -12.0
Missouri 6 3 27 24 57 -57.7
North Dakota 23 - 23 51 59 -13.6
South Atlantic 39 32 36 128 148 -13.2
District of Columbia - - - 2 2 -0.1
North Carolina 26 26 27 98 108 -9.1
Virginia 12 6 9 28 38 -25.7
East South Central 2 3 2 10 15 -32.2
Kentucky 2 3 2 10 15 -32.2
Mountain 6 1 6 15 10 52.1
Colorado 1 - 1 1 1 -47.7
Montana 1 s 1 2 2 35.2
Wyoming 4 1 3 12 7 73.6
Pacific 106 111 124 473 477 -0.9
Alaska 106 111 124 473 477 -0.9
U.S. Total 264 209 315 1,017 1,166 -12.8
- = No data reported.
s = Absolute percentage less than 0.05 or value is less than 0.5 of the table metric.
Note: Total may not equal sum of components because of independent rounding.
Source: U.S. Energy Information Administration (EIA), Form EIA-3, 'Quarterly Survey of Industrial, Commercial & Institutional Coal Users.'
33
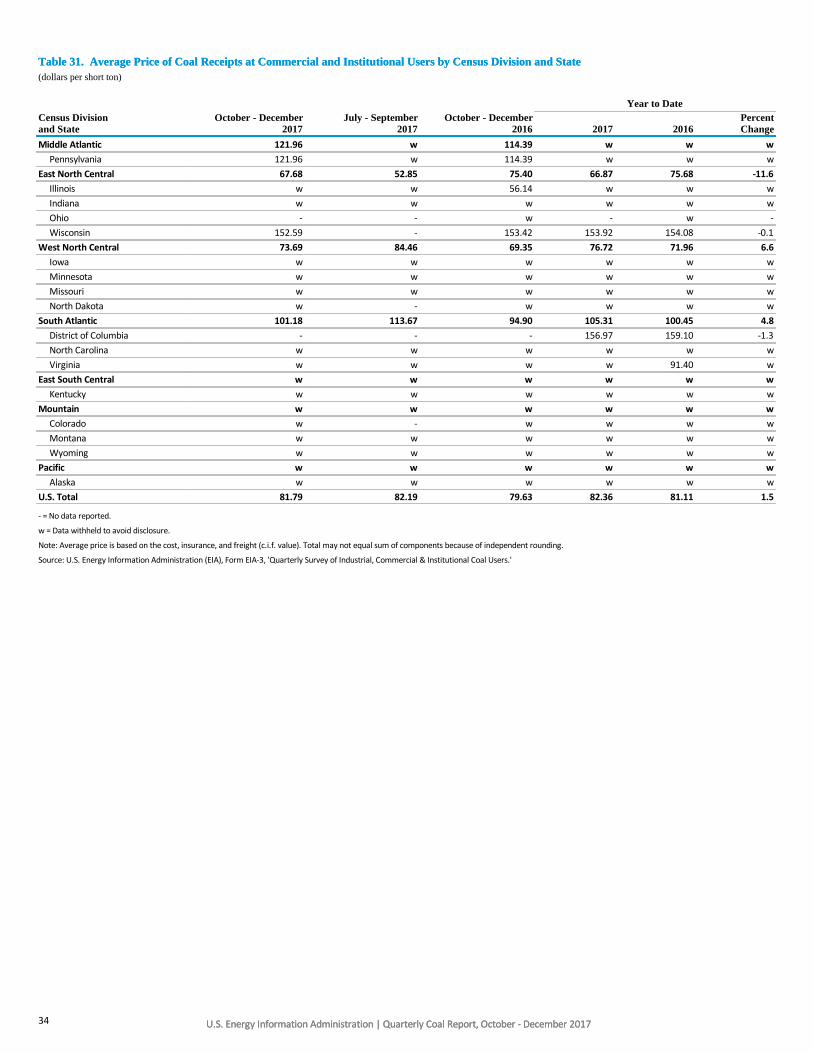
U.S. Energy Information Administration | Quarterly Coal Report, October - December 2017
Table 31. Average Price of Coal Receipts at Commercial and Institutional Users by Census Division and State
U.S. Energy Information Administration | Quarterly Coal Report, October - December 2017
Table 31. Average Price of Coal Receipts at Commercial and Institutional Users by Census Division and State(dollars per short ton)
Year to DateCensus Divisionand State
October - December2017
July - September2017
October - December2016 2017 2016
PercentChange
Middle Atlantic 121.96 w 114.39 w w w
Pennsylvania 121.96 w 114.39 w w w
East North Central 67.68 52.85 75.40 66.87 75.68 -11.6
Illinois w w 56.14 w w w
Indiana w w w w w w
Ohio - - w - w -
Wisconsin 152.59 - 153.42 153.92 154.08 -0.1
West North Central 73.69 84.46 69.35 76.72 71.96 6.6
Iowa w w w w w w
Minnesota w w w w w w
Missouri w w w w w w
North Dakota w - w w w w
South Atlantic 101.18 113.67 94.90 105.31 100.45 4.8
District of Columbia - - - 156.97 159.10 -1.3
North Carolina w w w w w w
Virginia w w w w 91.40 w
East South Central w w w w w w
Kentucky w w w w w w
Mountain w w w w w w
Colorado w - w w w w
Montana w w w w w w
Wyoming w w w w w w
Pacific w w w w w w
Alaska w w w w w w
U.S. Total 81.79 82.19 79.63 82.36 81.11 1.5
- = No data reported.
w = Data withheld to avoid disclosure.
Note: Average price is based on the cost, insurance, and freight (c.i.f. value). Total may not equal sum of components because of independent rounding.
Source: U.S. Energy Information Administration (EIA), Form EIA-3, 'Quarterly Survey of Industrial, Commercial & Institutional Coal Users.'
34

U.S. Energy Information Administration | Quarterly Coal Report, October - December 2017U.S. Energy Information Administration | Quarterly Coal Report, October - December 2017
Consumption____________________________________________________________________________________________________
35

U.S. Energy Information Administration | Quarterly Coal Report, October - December 2017
Table 32. U.S. Coal Consumption by End-Use Sector, 2011 - 2017
U.S. Energy Information Administration | Quarterly Coal Report, October - December 2017
Table 32. U.S. Coal Consumption by End-Use Sector, 2011 - 2017(thousand short tons)
Other Industrial Commercial and Institutional
Year andQuarter
ElectricPower
Sector1Coke
PlantsCHP2 Non-
CHP3 Total CHP4 Non-CHP5 Total Total
2011
January - March 235,953 5,188 5,773 6,716 12,489 526 490 1,016 254,647
April - June 224,177 5,392 5,466 5,571 11,036 378 264 643 241,247
July - September 262,618 5,407 5,696 5,473 11,168 396 132 528 279,722
October - December 209,736 5,447 5,384 6,160 11,543 367 239 605 227,332
Total 932,484 21,434 22,319 23,919 46,238 1,668 1,125 2,793 1,002,948
2012
January - March 190,664 5,283 5,531 5,667 11,198 418 270 688 207,833
April - June 185,721 5,296 4,598 5,528 10,125 319 94 414 201,555
July - September 238,076 5,044 4,950 5,521 10,470 347 46 393 253,984
October - December 209,091 5,128 4,987 6,057 11,044 366 184 550 225,813
Total 823,551 20,751 20,065 22,773 42,838 1,450 595 2,045 889,185
2013
January - March 211,971 5,280 5,115 5,942 11,057 418 260 679 228,987
April - June 199,845 5,471 4,747 5,554 10,301 307 91 397 216,014
July - September 237,205 5,429 4,830 5,538 10,368 299 57 355 253,357
October - December 208,942 5,294 5,069 6,260 11,329 333 187 520 226,084
Total 857,962 21,474 19,761 23,294 43,055 1,356 595 1,951 924,442
2014
January - March 231,534 4,886 5,153 6,029 11,181 381 348 729 248,329
April - June 195,922 5,174 4,561 5,853 10,414 232 140 372 211,881
July - September 231,066 5,636 4,683 5,743 10,425 221 105 326 247,453
October - December 193,081 5,601 4,680 6,245 10,925 229 231 460 210,068
Total 851,602 21,297 19,076 23,870 42,946 1,063 824 1,887 917,731
2015
January - March 196,656 5,156 4,602 5,791 10,393 277 290 567 212,772
April - June 174,376 4,987 4,095 5,216 9,311 166 136 302 188,975
July - September 214,811 5,030 4,316 4,957 9,273 173 105 278 229,393
October - December 152,601 4,535 3,971 5,511 9,482 183 174 357 166,974
Total 738,444 19,708 16,984 21,475 38,459 798 706 1,503 798,115
2016
January - March 152,744 4,124 3,954 5,177 9,131 225 224 448 166,448
April - June 147,491 4,096 3,496 4,986 8,482 128 81 209 160,278
July - September 210,512 4,163 3,771 4,713 8,483 145 55 200 223,358
October - December 167,807 4,102 3,499 5,253 8,752 185 141 326 180,987
Total 678,554 16,485 14,720 20,129 34,849 683 500 1,183 731,071
2017
January - March 160,339 4,236 3,550 4,985 8,535 178 194 373 173,482
April - June 154,202 4,325 3,260 4,852 8,112 126 77 203 166,842
July - September 190,614 4,491 3,142 5,455 8,597 149 46 195 203,898
October - December 159,595 4,485 3,472 4,897 8,369 154 136 290 172,740
Total 664,749 17,538 13,424 20,189 33,613 607 454 1,061 716,961
2016 January - December 678,554 16,485 14,720 20,129 34,849 683 500 1,183 731,071
2015 January - December 738,444 19,708 16,984 21,475 38,459 798 706 1,503 798,115
1 The electric power sector (electric utilities and independent power producers) comprises electricity-only and combined-heat-and-power (CHP) plants whose primary business is to sell electricity or electricityand heat to the public (i.e. NAICS 22 plants). The reported coal consumption is the total for producing electricity and useful thermal output.
2 Industrial combined-heat-and-power (CHP) and a small number of industrial electricity-only plants. The reported coal consumption is the total for producing electricity and useful thermal output.
3 All industrial sector fuel use other than in 'Coke Plants' and 'Industrial CHP.'
4 Includes commercial combined-heat-and-power (CHP) and a small number of commercial electricity-only plants, such as hospitals and universities. The reported coal consumption is the total for producingelectricity and useful thermal output.
5 All commercial sector fuel use other than that in 'Commercial CHP.' Excludes residential use.
Note: Total may not equal sum of components because of independent rounding.
Source: U.S. Energy Information Administration (EIA). *Electric Power Sector and CHP: Form EIA-923, 'Power Plant Operations Report.' *Coke Plants: Form EIA-3, 'Quarterly Survey of Industrial,Commercial & Institutional Coal Users.' *Other Industrial: Form EIA-3, 'Quarterly Survey of Industrial, Commercial & Institutional Coal Users,' Form EIA-7A, 'Annual Survey of Coal Production and Preparation,'and Form EIA-923, 'Power Plant Operations Report.' *Commercial and Institutional: Form EIA-3, 'Quarterly Survey of Industrial, Commercial & Institutional Coal Users.' Prior to third quarter 2014, coke plantdata was collected under Form EIA-5, 'Quarterly Coal Consumption and Quality Report - Coke Plants.'
36
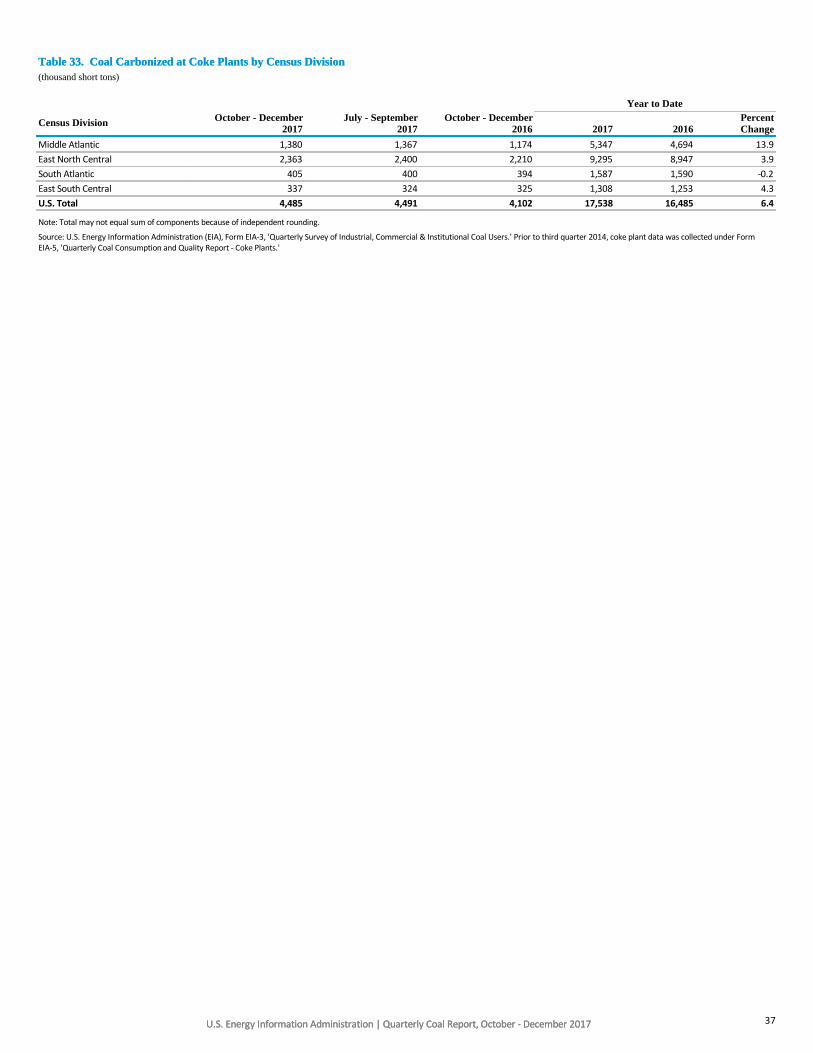
U.S. Energy Information Administration | Quarterly Coal Report, October - December 2017
Table 33. Coal Carbonized at Coke Plants by Census Division
U.S. Energy Information Administration | Quarterly Coal Report, October - December 2017
Table 33. Coal Carbonized at Coke Plants by Census Division(thousand short tons)
Year to Date
Census Division October - December2017
July - September2017
October - December2016 2017 2016
PercentChange
Middle Atlantic 1,380 1,367 1,174 5,347 4,694 13.9
East North Central 2,363 2,400 2,210 9,295 8,947 3.9
South Atlantic 405 400 394 1,587 1,590 -0.2
East South Central 337 324 325 1,308 1,253 4.3
U.S. Total 4,485 4,491 4,102 17,538 16,485 6.4
Note: Total may not equal sum of components because of independent rounding.
Source: U.S. Energy Information Administration (EIA), Form EIA-3, 'Quarterly Survey of Industrial, Commercial & Institutional Coal Users.' Prior to third quarter 2014, coke plant data was collected under FormEIA-5, 'Quarterly Coal Consumption and Quality Report - Coke Plants.'
37

U.S. Energy Information Administration | Quarterly Coal Report, October - December 2017
Table 34. Coal Consumption at Other Industrial Plants by Census Division and State
U.S. Energy Information Administration | Quarterly Coal Report, October - December 2017
Table 34. Coal Consumption at Other Industrial Plants by Census Division and State(thousand short tons)
Year to DateCensus Divisionand State
October - December2017
July - September2017
October - December2016 2017 2016
PercentChange
New England 6 5 6 22 21 8.9
Maine 5 4 5 18 17 9.8
Massachusetts 1 1 1 4 4 4.7
Middle Atlantic 244 290 363 1,152 1,645 -30.0
New York 87 115 90 386 410 -5.8
Pennsylvania 157 175 273 766 1,235 -38.0
East North Central 1,602 1,706 1,677 6,778 7,011 -3.3
Illinois 572 679 618 2,590 2,510 3.2
Indiana 466 504 552 2,006 2,209 -9.2
Michigan 184 189 137 706 704 0.2
Ohio 146 145 136 561 707 -20.5
Wisconsin 235 189 234 915 881 3.8
West North Central 3,371 3,349 3,337 12,909 12,185 5.9
Iowa 621 571 629 2,412 2,485 -2.9
Kansas 33 30 32 112 104 7.8
Minnesota 363 537 296 1,551 1,055 47.0
Missouri 201 303 182 898 711 26.2
Nebraska 327 291 308 1,173 1,113 5.3
North Dakota 1,764 1,561 1,837 6,540 6,505 0.5
South Dakota 62 57 53 224 212 5.6
South Atlantic 736 733 845 3,016 3,578 -15.7
Delaware - - 15 - 102 -
Florida 123 138 122 562 500 12.4
Georgia 89 73 93 335 432 -22.5
Maryland 150 150 157 562 554 1.4
North Carolina 108 94 133 454 526 -13.7
South Carolina 55 64 91 251 324 -22.7
Virginia 122 120 152 503 613 -17.9
West Virginia 89 93 82 350 526 -33.6
East South Central 730 835 842 3,296 3,800 -13.3
Alabama 255 233 241 972 1,105 -12.0
Kentucky 191 200 207 834 782 6.6
Tennessee 283 401 395 1,490 1,913 -22.1
West South Central 358 405 407 1,542 1,732 -11.0
Arkansas 50 48 49 198 200 -1.4
Louisiana 56 72 56 241 267 -9.9
Oklahoma 111 113 145 474 591 -19.9
Texas 140 172 156 630 673 -6.4
Mountain 887 869 877 3,317 3,376 -1.7
Arizona 61 67 36 227 175 29.9
Colorado 71 81 68 295 285 3.6
Idaho 36 24 35 114 107 6.4
Montana 92 43 110 252 261 -3.4
Nevada 64 66 75 258 285 -9.5
New Mexico 21 17 19 74 73 0.6
Utah 111 166 111 484 575 -15.7
Wyoming 433 405 423 1,611 1,614 -0.1
Pacific 434 406 398 1,582 1,502 5.3
Alaska s s s 1 1 s
California 390 376 366 1,464 1,389 5.4
Hawaii - - 5 - 12 -
Oregon 27 14 - 41 - -
Washington 17 16 27 76 100 -24.6
U.S. Total 8,369 8,597 8,752 33,613 34,849 -3.5
- = No data reported.
s = Absolute percentage less than 0.05 or value is less than 0.5 of the table metric.
Note: Total may not equal sum of components because of independent rounding.
Source: U.S. Energy Information Administration (EIA), Form EIA-3, 'Quarterly Survey of Industrial, Commercial & Institutional Coal Users' and Form EIA-7A, 'Annual Survey of Coal Production and Preparation.'
38

U.S. Energy Information Administration | Quarterly Coal Report, October - December 2017
Table 35. U.S. Coal Consumption at Manufacturing Plants by North American Industry Classification System (NAICS) Code
U.S. Energy Information Administration | Quarterly Coal Report, October - December 2017
Table 35. U.S. Coal Consumption at Manufacturing Plants by North American Industry Classification System (NAICS) Code(thousand short tons)
Year to Date
NAICS Code October - December2017
July - September2017
October - December2016 2017 2016
PercentChange
311 Food Manufacturing 2,060 2,131 2,045 8,213 7,854 4.6
312 Beverage and Tobacco Product Mfg. 4 3 5 24 29 -19.6
313 Textile Mills 23 16 27 99 99 0.6
322 Paper Manufacturing 746 673 907 3,001 3,958 -24.2
324 Petroleum and Coal Products* 1,611 1,505 1,752 6,162 6,308 -2.3
325 Chemical Manufacturing 849 975 1,176 3,674 5,177 -29.0
327 Nonmetallic Mineral Products Mfg. 2,093 2,298 2,079 8,553 8,170 4.7
331 Primary Metal Manufacturing** 587 619 524 2,364 2,269 4.2
332 Fabricated Metal Product Mfg. - - - - 4 -
333 Machinery Manufacturing 35 6 17 67 80 -16.5
336 Transportation Equipment Mfg. 1 - 1 3 2 18.4
339 Miscellaneous Manufacturing 361 370 219 1,454 899 61.7
U.S. Total 8,369 8,597 8,752 33,613 34,849 -3.5
* Includes coal gasification projects.
** Excludes coke plants.
- = No data reported.
Note: Total may not equal sum of components because of independent rounding.
Source: U.S. Energy Information Administration (EIA), Form EIA-3, 'Quarterly Survey of Industrial, Commercial & Institutional Coal Users.'
39

U.S. Energy Information Administration | Quarterly Coal Report, October - December 2017
Table 36. Coal Consumption at Commercial and Institutional Users by Census Division and State
U.S. Energy Information Administration | Quarterly Coal Report, October - December 2017
Table 36. Coal Consumption at Commercial and Institutional Users by Census Division and State(thousand short tons)
Year to DateCensus Divisionand State
October - December2017
July - September2017
October - December2016 2017 2016
PercentChange
Middle Atlantic 6 1 10 25 39 -37.7
Pennsylvania 6 1 10 25 39 -37.7
East North Central 47 38 53 180 252 -28.5
Illinois 23 22 28 103 105 -2.5
Indiana 19 16 13 57 67 -14.8
Michigan - - - - 14 -
Ohio - - 7 1 45 -98.2
Wisconsin 5 - 5 20 21 -6.7
West North Central 53 37 79 208 254 -18.0
Iowa 25 33 29 122 130 -6.6
Minnesota 3 s 4 8 10 -21.6
Missouri 6 3 26 25 55 -54.9
North Dakota 19 s 21 54 58 -7.5
South Atlantic 40 22 42 143 154 -6.8
District of Columbia s - s 1 1 -13.1
North Carolina 29 21 31 105 119 -11.3
Virginia 11 1 11 37 34 9.1
East South Central 2 2 3 14 14 -0.8
Kentucky 2 2 3 14 14 -0.8
Mountain 5 1 6 15 10 48.3
Colorado - s 1 s 1 -76.4
Montana 1 - 1 2 2 47.8
Wyoming 4 1 3 12 7 73.6
Pacific 136 95 134 476 460 3.6
Alaska 136 95 134 476 460 3.6
U.S. Total 290 195 326 1,061 1,183 -10.3
- = No data reported.
s = Absolute percentage less than 0.05 or value is less than 0.5 of the table metric.
Note: Total may not equal sum of components because of independent rounding.
Source: U.S. Energy Information Administration (EIA), Form EIA-3, 'Quarterly Survey of Industrial, Commercial & Institutional Coal Users.'
40

U.S. Energy Information Administration | Quarterly Coal Report, October - December 2017U.S. Energy Information Administration | Quarterly Coal Report, October - December 2017
Stocks____________________________________________________________________________________________________
41
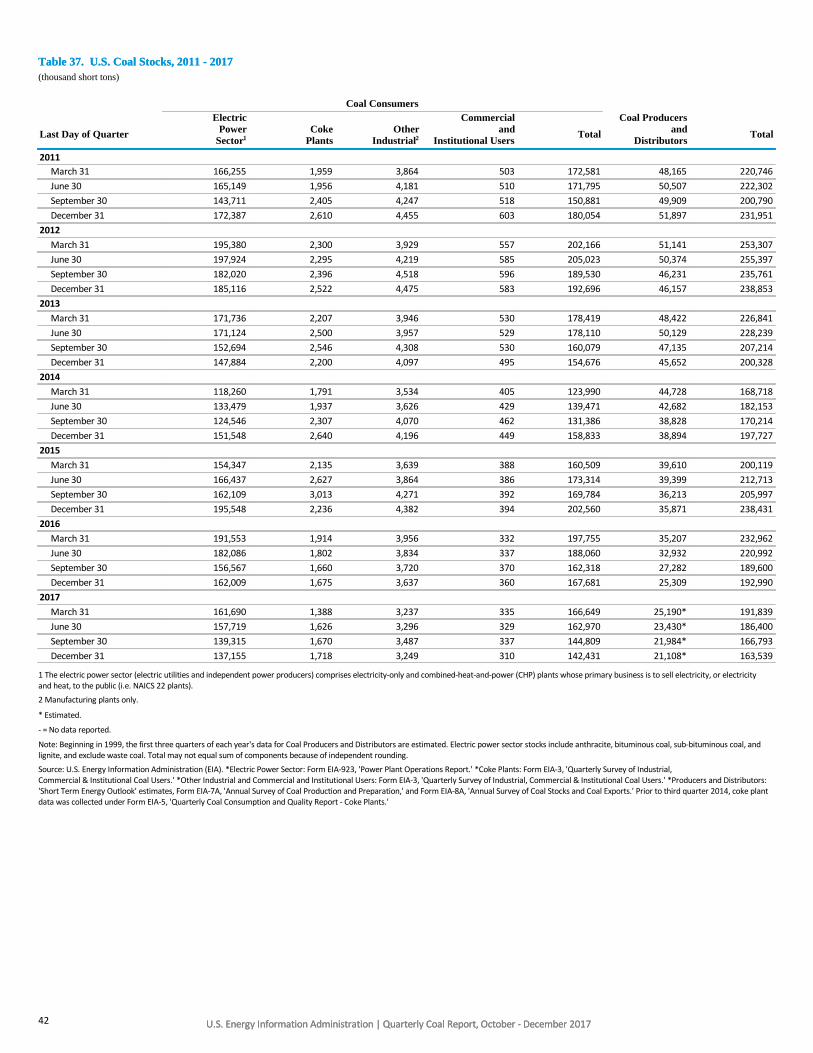
U.S. Energy Information Administration | Quarterly Coal Report, October - December 2017
Table 37. U.S. Coal Stocks, 2011 - 2017
U.S. Energy Information Administration | Quarterly Coal Report, October - December 2017
Table 37. U.S. Coal Stocks, 2011 - 2017(thousand short tons)
Coal Consumers
Last Day of Quarter
ElectricPower
Sector1Coke
PlantsOther
Industrial2
Commercialand
Institutional UsersTotal
Coal Producersand
DistributorsTotal
2011
March 31 166,255 1,959 3,864 503 172,581 48,165 220,746
June 30 165,149 1,956 4,181 510 171,795 50,507 222,302
September 30 143,711 2,405 4,247 518 150,881 49,909 200,790
December 31 172,387 2,610 4,455 603 180,054 51,897 231,951
2012
March 31 195,380 2,300 3,929 557 202,166 51,141 253,307
June 30 197,924 2,295 4,219 585 205,023 50,374 255,397
September 30 182,020 2,396 4,518 596 189,530 46,231 235,761
December 31 185,116 2,522 4,475 583 192,696 46,157 238,853
2013
March 31 171,736 2,207 3,946 530 178,419 48,422 226,841
June 30 171,124 2,500 3,957 529 178,110 50,129 228,239
September 30 152,694 2,546 4,308 530 160,079 47,135 207,214
December 31 147,884 2,200 4,097 495 154,676 45,652 200,328
2014
March 31 118,260 1,791 3,534 405 123,990 44,728 168,718
June 30 133,479 1,937 3,626 429 139,471 42,682 182,153
September 30 124,546 2,307 4,070 462 131,386 38,828 170,214
December 31 151,548 2,640 4,196 449 158,833 38,894 197,727
2015
March 31 154,347 2,135 3,639 388 160,509 39,610 200,119
June 30 166,437 2,627 3,864 386 173,314 39,399 212,713
September 30 162,109 3,013 4,271 392 169,784 36,213 205,997
December 31 195,548 2,236 4,382 394 202,560 35,871 238,431
2016
March 31 191,553 1,914 3,956 332 197,755 35,207 232,962
June 30 182,086 1,802 3,834 337 188,060 32,932 220,992
September 30 156,567 1,660 3,720 370 162,318 27,282 189,600
December 31 162,009 1,675 3,637 360 167,681 25,309 192,990
2017
March 31 161,690 1,388 3,237 335 166,649 25,190* 191,839
June 30 157,719 1,626 3,296 329 162,970 23,430* 186,400
September 30 139,315 1,670 3,487 337 144,809 21,984* 166,793
December 31 137,155 1,718 3,249 310 142,431 21,108* 163,539
1 The electric power sector (electric utilities and independent power producers) comprises electricity-only and combined-heat-and-power (CHP) plants whose primary business is to sell electricity, or electricityand heat, to the public (i.e. NAICS 22 plants).
2 Manufacturing plants only.
* Estimated.
- = No data reported.
Note: Beginning in 1999, the first three quarters of each year's data for Coal Producers and Distributors are estimated. Electric power sector stocks include anthracite, bituminous coal, sub-bituminous coal, andlignite, and exclude waste coal. Total may not equal sum of components because of independent rounding.
Source: U.S. Energy Information Administration (EIA). *Electric Power Sector: Form EIA-923, 'Power Plant Operations Report.' *Coke Plants: Form EIA-3, 'Quarterly Survey of Industrial,Commercial & Institutional Coal Users.' *Other Industrial and Commercial and Institutional Users: Form EIA-3, 'Quarterly Survey of Industrial, Commercial & Institutional Coal Users.' *Producers and Distributors:'Short Term Energy Outlook' estimates, Form EIA-7A, 'Annual Survey of Coal Production and Preparation,' and Form EIA-8A, 'Annual Survey of Coal Stocks and Coal Exports.' Prior to third quarter 2014, coke plantdata was collected under Form EIA-5, 'Quarterly Coal Consumption and Quality Report - Coke Plants.'
42

U.S. Energy Information Administration | Quarterly Coal Report, October - December 2017
Table 38. Coal Stocks at Coke Plants by Census Division
U.S. Energy Information Administration | Quarterly Coal Report, October - December 2017
Table 38. Coal Stocks at Coke Plants by Census Division(thousand short tons)
Census Division December 31, 2017 September 30, 2017 December 31, 2016
Percent Change(December 31)
2017 versus 2016Middle Atlantic 355 196 304 16.6
East North Central 1,042 1,128 1,024 1.8
South Atlantic 177 153 144 22.6
East South Central 145 192 203 -28.7
U.S. Total 1,718 1,670 1,675 2.6
Note: Total may not equal sum of components because of independent rounding.
Source: U.S. Energy Information Administration (EIA), Form EIA-3, 'Quarterly Survey of Industrial, Commercial & Institutional Coal Users.' Prior to third quarter 2014, coke plant data was collected under FormEIA-5, 'Quarterly Coal Consumption and Quality Report - Coke Plants.'
43
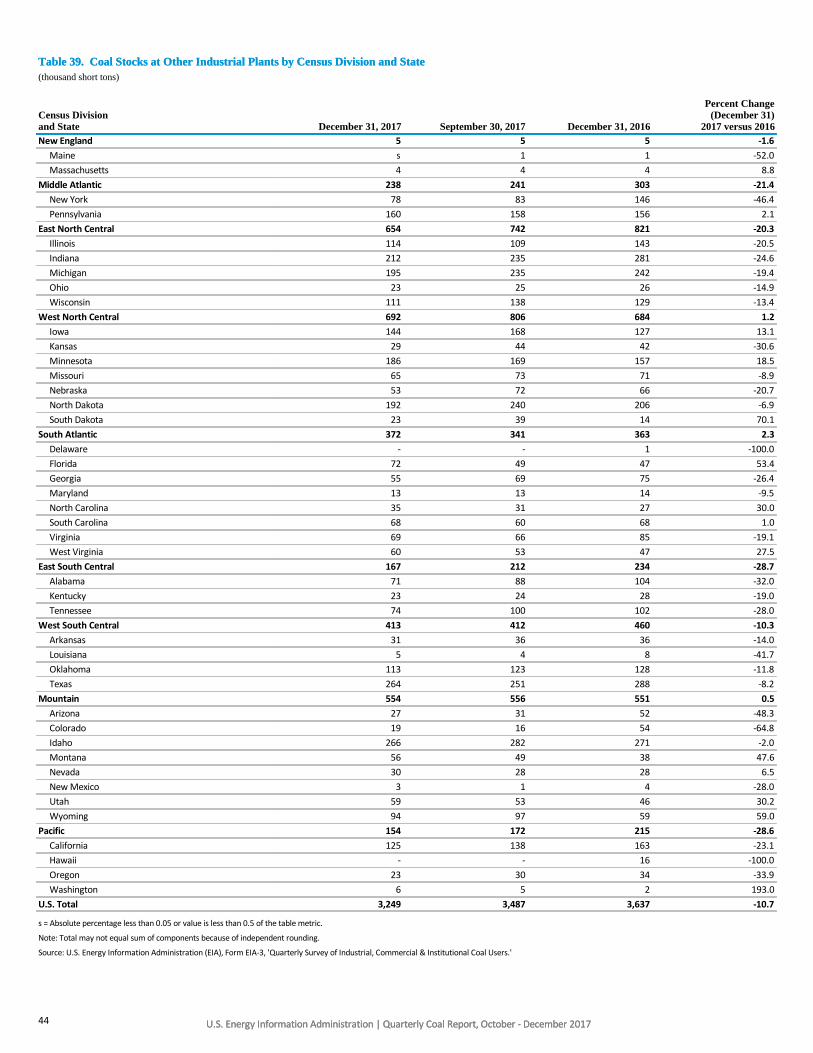
U.S. Energy Information Administration | Quarterly Coal Report, October - December 2017
Table 39. Coal Stocks at Other Industrial Plants by Census Division and State
U.S. Energy Information Administration | Quarterly Coal Report, October - December 2017
Table 39. Coal Stocks at Other Industrial Plants by Census Division and State(thousand short tons)
Census Divisionand State December 31, 2017 September 30, 2017 December 31, 2016
Percent Change(December 31)
2017 versus 2016New England 5 5 5 -1.6
Maine s 1 1 -52.0
Massachusetts 4 4 4 8.8
Middle Atlantic 238 241 303 -21.4
New York 78 83 146 -46.4
Pennsylvania 160 158 156 2.1
East North Central 654 742 821 -20.3
Illinois 114 109 143 -20.5
Indiana 212 235 281 -24.6
Michigan 195 235 242 -19.4
Ohio 23 25 26 -14.9
Wisconsin 111 138 129 -13.4
West North Central 692 806 684 1.2
Iowa 144 168 127 13.1
Kansas 29 44 42 -30.6
Minnesota 186 169 157 18.5
Missouri 65 73 71 -8.9
Nebraska 53 72 66 -20.7
North Dakota 192 240 206 -6.9
South Dakota 23 39 14 70.1
South Atlantic 372 341 363 2.3
Delaware - - 1 -100.0
Florida 72 49 47 53.4
Georgia 55 69 75 -26.4
Maryland 13 13 14 -9.5
North Carolina 35 31 27 30.0
South Carolina 68 60 68 1.0
Virginia 69 66 85 -19.1
West Virginia 60 53 47 27.5
East South Central 167 212 234 -28.7
Alabama 71 88 104 -32.0
Kentucky 23 24 28 -19.0
Tennessee 74 100 102 -28.0
West South Central 413 412 460 -10.3
Arkansas 31 36 36 -14.0
Louisiana 5 4 8 -41.7
Oklahoma 113 123 128 -11.8
Texas 264 251 288 -8.2
Mountain 554 556 551 0.5
Arizona 27 31 52 -48.3
Colorado 19 16 54 -64.8
Idaho 266 282 271 -2.0
Montana 56 49 38 47.6
Nevada 30 28 28 6.5
New Mexico 3 1 4 -28.0
Utah 59 53 46 30.2
Wyoming 94 97 59 59.0
Pacific 154 172 215 -28.6
California 125 138 163 -23.1
Hawaii - - 16 -100.0
Oregon 23 30 34 -33.9
Washington 6 5 2 193.0
U.S. Total 3,249 3,487 3,637 -10.7
s = Absolute percentage less than 0.05 or value is less than 0.5 of the table metric.
Note: Total may not equal sum of components because of independent rounding.
Source: U.S. Energy Information Administration (EIA), Form EIA-3, 'Quarterly Survey of Industrial, Commercial & Institutional Coal Users.'
44
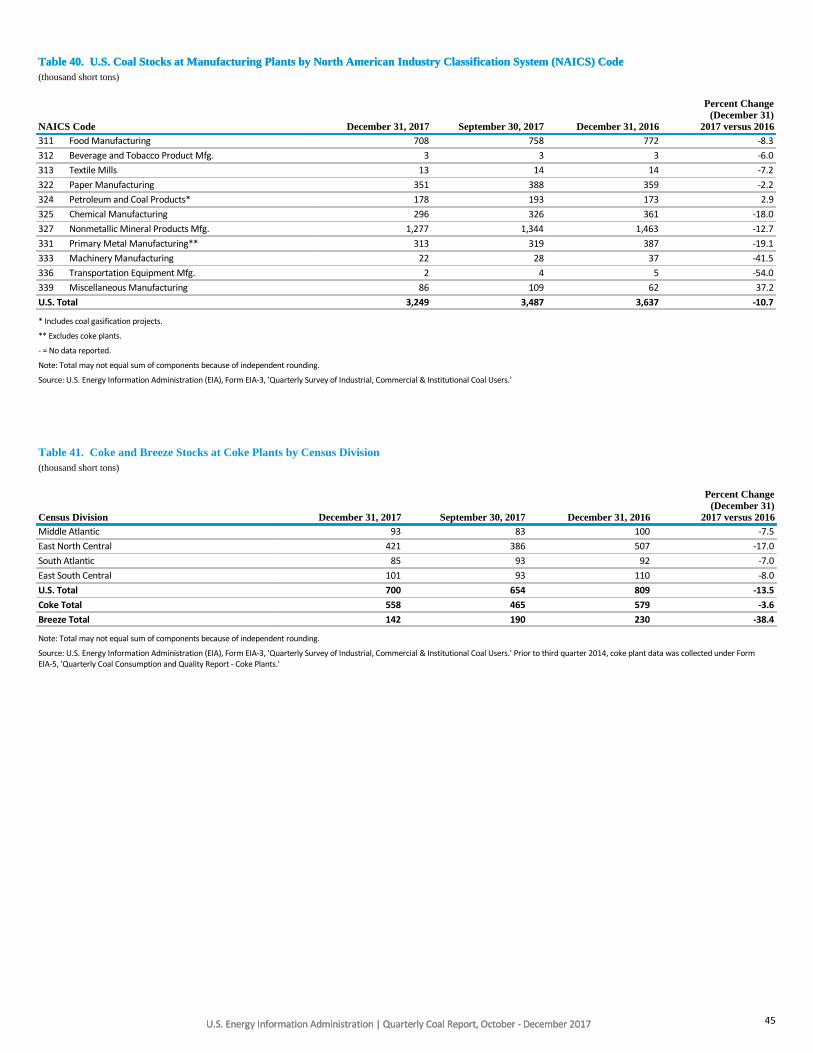
U.S. Energy Information Administration | Quarterly Coal Report, October - December 2017
Table 40. U.S. Coal Stocks at Manufacturing Plants by North American Industry Classification System (NAICS) Code
U.S. Energy Information Administration | Quarterly Coal Report, October - December 2017
Table 40. U.S. Coal Stocks at Manufacturing Plants by North American Industry Classification System (NAICS) Code(thousand short tons)
NAICS Code December 31, 2017 September 30, 2017 December 31, 2016
Percent Change(December 31)
2017 versus 2016311 Food Manufacturing 708 758 772 -8.3
312 Beverage and Tobacco Product Mfg. 3 3 3 -6.0
313 Textile Mills 13 14 14 -7.2
322 Paper Manufacturing 351 388 359 -2.2
324 Petroleum and Coal Products* 178 193 173 2.9
325 Chemical Manufacturing 296 326 361 -18.0
327 Nonmetallic Mineral Products Mfg. 1,277 1,344 1,463 -12.7
331 Primary Metal Manufacturing** 313 319 387 -19.1
333 Machinery Manufacturing 22 28 37 -41.5
336 Transportation Equipment Mfg. 2 4 5 -54.0
339 Miscellaneous Manufacturing 86 109 62 37.2
U.S. Total 3,249 3,487 3,637 -10.7
* Includes coal gasification projects.
** Excludes coke plants.
- = No data reported.
Note: Total may not equal sum of components because of independent rounding.
Source: U.S. Energy Information Administration (EIA), Form EIA-3, 'Quarterly Survey of Industrial, Commercial & Institutional Coal Users.'
Table 41. Coke and Breeze Stocks at Coke Plants by Census Division(thousand short tons)
Census Division December 31, 2017 September 30, 2017 December 31, 2016
Percent Change(December 31)
2017 versus 2016Middle Atlantic 93 83 100 -7.5
East North Central 421 386 507 -17.0
South Atlantic 85 93 92 -7.0
East South Central 101 93 110 -8.0
U.S. Total 700 654 809 -13.5
Coke Total 558 465 579 -3.6
Breeze Total 142 190 230 -38.4
Note: Total may not equal sum of components because of independent rounding.
Source: U.S. Energy Information Administration (EIA), Form EIA-3, 'Quarterly Survey of Industrial, Commercial & Institutional Coal Users.' Prior to third quarter 2014, coke plant data was collected under FormEIA-5, 'Quarterly Coal Consumption and Quality Report - Coke Plants.'
45

U.S. Energy Information Administration | Quarterly Coal Report, October - December 2017
Table 42. Coal Stocks at Commercial and Institutional Users by Census Division and State
U.S. Energy Information Administration | Quarterly Coal Report, October - December 2017
Table 42. Coal Stocks at Commercial and Institutional Users by Census Division and State(thousand short tons)
Census Divisionand State December 31, 2017 September 30, 2017 December 31, 2016
Percent Change(December 31)
2017 versus 2016Middle Atlantic 42 40 44 -4.4
Pennsylvania 42 40 44 -4.4
East North Central 51 48 62 -17.5
Illinois 23 16 19 18.5
Indiana 21 24 33 -38.6
Ohio 5 5 6 -14.0
Wisconsin 3 2 3 -19.7
West North Central 48 49 62 -22.1
Iowa 28 28 35 -19.9
Minnesota 7 12 11 -37.4
Missouri 1 1 2 -15.2
North Dakota 12 8 15 -17.1
South Atlantic 48 49 63 -23.4
District of Columbia 4 4 4 20.7
North Carolina 26 29 33 -21.5
Virginia 18 16 26 -31.7
East South Central 8 9 12 -38.2
Kentucky 8 9 12 -37.0
Tennessee - - s -100.0
Mountain 3 3 3 -18.4
Colorado 1 s s 90.9
Montana 2 2 3 -32.7
Wyoming s s s s
Pacific 110 140 113 -3.3
Alaska 110 140 113 -3.3
U.S. Total 310 337 360 -14.0
- = No data reported.
s = Absolute percentage less than 0.05 or value is less than 0.5 of the table metric.
Note: Total may not equal sum of components because of independent rounding.
Source: U.S. Energy Information Administration (EIA), Form EIA-3, 'Quarterly Survey of Industrial, Commercial & Institutional Coal Users.'
46

U.S. Energy Information Administration | Quarterly Coal Report, October - December 2017U.S. Energy Information Administration | Quarterly Coal Report, October - December 2017
Quality____________________________________________________________________________________________________
47
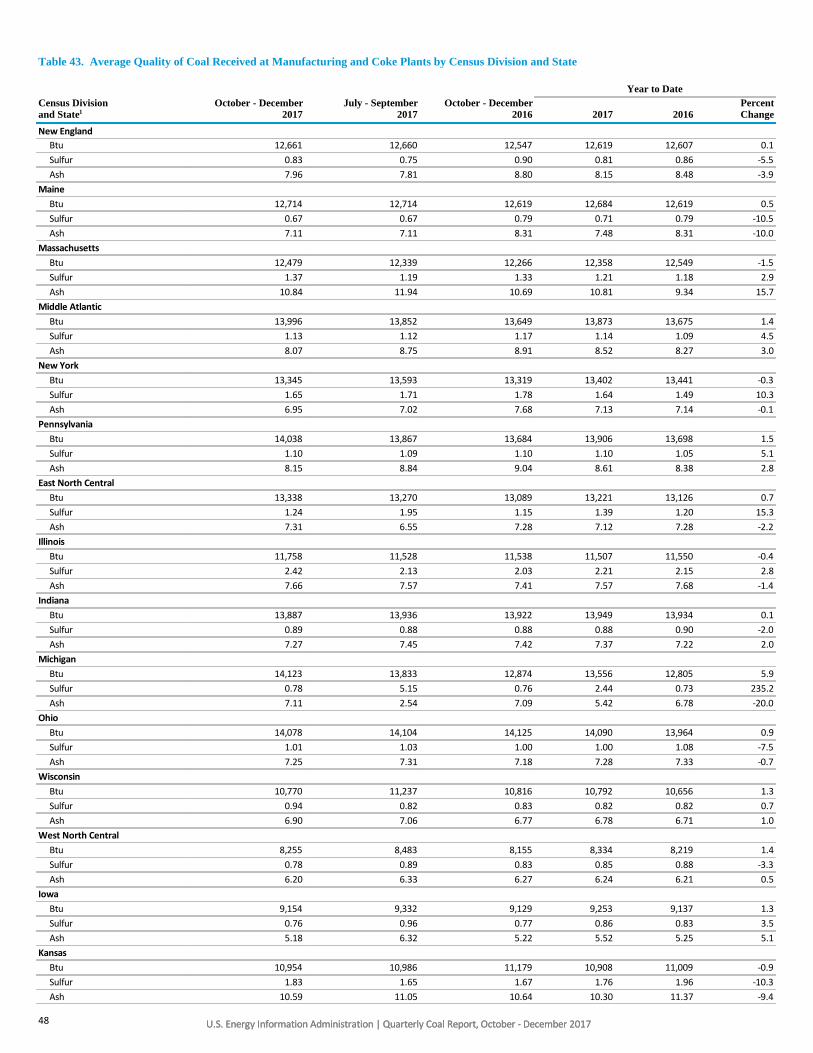
U.S. Energy Information Administration | Quarterly Coal Report, October - December 2017U.S. Energy Information Administration | Quarterly Coal Report, October - December 2017
Table 43. Average Quality of Coal Received at Manufacturing and Coke Plants by Census Division and State
Year to DateCensus Divisionand State1
October - December2017
July - September2017
October - December2016 2017 2016
PercentChange
New England
Btu 12,661 12,660 12,547 12,619 12,607 0.1
Sulfur 0.83 0.75 0.90 0.81 0.86 -5.5
Ash 7.96 7.81 8.80 8.15 8.48 -3.9
Maine
Btu 12,714 12,714 12,619 12,684 12,619 0.5
Sulfur 0.67 0.67 0.79 0.71 0.79 -10.5
Ash 7.11 7.11 8.31 7.48 8.31 -10.0
Massachusetts
Btu 12,479 12,339 12,266 12,358 12,549 -1.5
Sulfur 1.37 1.19 1.33 1.21 1.18 2.9
Ash 10.84 11.94 10.69 10.81 9.34 15.7
Middle Atlantic
Btu 13,996 13,852 13,649 13,873 13,675 1.4
Sulfur 1.13 1.12 1.17 1.14 1.09 4.5
Ash 8.07 8.75 8.91 8.52 8.27 3.0
New York
Btu 13,345 13,593 13,319 13,402 13,441 -0.3
Sulfur 1.65 1.71 1.78 1.64 1.49 10.3
Ash 6.95 7.02 7.68 7.13 7.14 -0.1
Pennsylvania
Btu 14,038 13,867 13,684 13,906 13,698 1.5
Sulfur 1.10 1.09 1.10 1.10 1.05 5.1
Ash 8.15 8.84 9.04 8.61 8.38 2.8
East North Central
Btu 13,338 13,270 13,089 13,221 13,126 0.7
Sulfur 1.24 1.95 1.15 1.39 1.20 15.3
Ash 7.31 6.55 7.28 7.12 7.28 -2.2
Illinois
Btu 11,758 11,528 11,538 11,507 11,550 -0.4
Sulfur 2.42 2.13 2.03 2.21 2.15 2.8
Ash 7.66 7.57 7.41 7.57 7.68 -1.4
Indiana
Btu 13,887 13,936 13,922 13,949 13,934 0.1
Sulfur 0.89 0.88 0.88 0.88 0.90 -2.0
Ash 7.27 7.45 7.42 7.37 7.22 2.0
Michigan
Btu 14,123 13,833 12,874 13,556 12,805 5.9
Sulfur 0.78 5.15 0.76 2.44 0.73 235.2
Ash 7.11 2.54 7.09 5.42 6.78 -20.0
Ohio
Btu 14,078 14,104 14,125 14,090 13,964 0.9
Sulfur 1.01 1.03 1.00 1.00 1.08 -7.5
Ash 7.25 7.31 7.18 7.28 7.33 -0.7
Wisconsin
Btu 10,770 11,237 10,816 10,792 10,656 1.3
Sulfur 0.94 0.82 0.83 0.82 0.82 0.7
Ash 6.90 7.06 6.77 6.78 6.71 1.0
West North Central
Btu 8,255 8,483 8,155 8,334 8,219 1.4
Sulfur 0.78 0.89 0.83 0.85 0.88 -3.3
Ash 6.20 6.33 6.27 6.24 6.21 0.5
Iowa
Btu 9,154 9,332 9,129 9,253 9,137 1.3
Sulfur 0.76 0.96 0.77 0.86 0.83 3.5
Ash 5.18 6.32 5.22 5.52 5.25 5.1
Kansas
Btu 10,954 10,986 11,179 10,908 11,009 -0.9
Sulfur 1.83 1.65 1.67 1.76 1.96 -10.3
Ash 10.59 11.05 10.64 10.30 11.37 -9.4
48

U.S. Energy Information Administration | Quarterly Coal Report, October - December 2017
Year to DateCensus Divisionand State1
October - December2017
July - September2017
October - December2016 2017 2016
PercentChange
Minnesota
Btu 9,097 9,232 9,239 9,180 9,286 -1.1
Sulfur 0.30 0.33 0.33 0.32 0.35 -6.1
Ash 4.53 4.43 4.55 4.49 4.31 4.3
Missouri
Btu 11,549 11,269 11,229 11,290 11,265 0.2
Sulfur 2.29 2.52 2.12 2.29 2.14 6.9
Ash 8.87 8.97 8.71 8.91 8.50 4.8
Nebraska
Btu 8,861 9,091 8,902 8,962 8,988 -0.3
Sulfur 0.23 0.24 0.23 0.24 0.24 -0.6
Ash 4.93 4.99 4.81 4.83 4.87 -0.9
North Dakota
Btu 7,256 7,197 7,221 7,231 7,228 s
Sulfur 0.81 0.88 0.91 0.88 0.93 -6.1
Ash 6.73 6.66 6.86 6.73 6.74 -0.3
South Dakota
Btu 8,313 8,399 8,140 8,375 8,189 2.3
Sulfur 0.57 0.59 0.37 0.59 0.45 30.5
Ash 6.67 6.70 5.13 6.65 5.56 19.5
South Atlantic
Btu 13,332 13,369 13,380 13,361 13,297 0.5
Sulfur 1.19 1.23 1.14 1.17 1.17 0.5
Ash 9.59 9.79 9.19 9.63 9.15 5.2
Delaware
Btu - - 12,349 - 11,484 -
Sulfur - - 2.21 - 2.30 -
Ash - - 7.84 - 7.63 -
Florida
Btu 12,471 12,617 12,977 12,604 13,088 -3.7
Sulfur 1.13 1.62 1.35 1.32 1.15 14.1
Ash 8.90 9.94 7.88 9.05 6.59 37.4
Georgia
Btu 12,803 12,287 12,673 12,498 12,859 -2.8
Sulfur 1.02 0.97 0.97 0.99 0.98 1.4
Ash 8.79 11.61 9.66 10.27 8.94 14.8
Maryland
Btu 10,927 10,996 11,028 10,929 10,926 s
Sulfur 1.86 1.84 1.78 1.85 1.82 1.7
Ash 24.13 22.79 21.34 23.47 23.19 1.2
North Carolina
Btu 13,607 13,550 13,581 13,646 13,227 3.2
Sulfur 0.94 0.96 0.94 0.95 0.94 0.9
Ash 7.03 7.07 7.34 6.98 7.23 -3.4
South Carolina
Btu 13,206 13,764 13,098 13,433 13,019 3.2
Sulfur 1.53 2.02 0.94 1.34 0.92 46.6
Ash 7.65 9.55 7.68 9.33 7.95 17.3
Virginia
Btu 14,142 14,198 14,007 14,160 14,014 1.0
Sulfur 0.86 0.82 0.94 0.87 1.01 -14.3
Ash 7.13 7.07 7.17 7.10 7.18 -1.1
West Virginia
Btu 14,089 14,089 14,141 14,117 13,952 1.2
Sulfur 1.39 1.31 1.19 1.30 1.21 7.2
Ash 6.99 7.00 7.00 6.99 7.60 -8.1
East South Central
Btu 13,578 13,588 13,392 13,541 13,417 0.9
Sulfur 1.08 1.22 1.13 1.17 1.13 3.9
Ash 7.54 7.28 7.59 7.30 7.49 -2.5
Alabama
Btu 13,881 13,861 13,671 13,887 13,703 1.3
Sulfur 1.11 1.05 0.99 1.07 0.98 9.5
Ash 7.31 7.17 7.93 7.21 7.75 -7.1
49
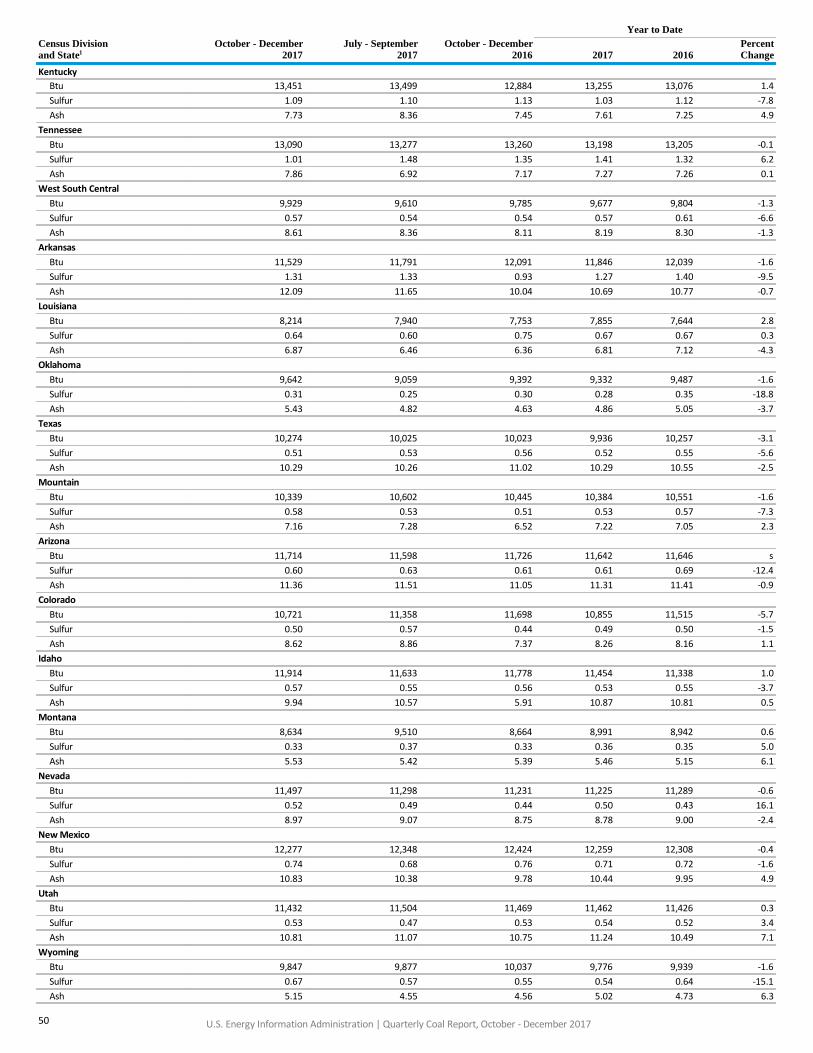
U.S. Energy Information Administration | Quarterly Coal Report, October - December 2017
Year to DateCensus Divisionand State1
October - December2017
July - September2017
October - December2016 2017 2016
PercentChange
Kentucky
Btu 13,451 13,499 12,884 13,255 13,076 1.4
Sulfur 1.09 1.10 1.13 1.03 1.12 -7.8
Ash 7.73 8.36 7.45 7.61 7.25 4.9
Tennessee
Btu 13,090 13,277 13,260 13,198 13,205 -0.1
Sulfur 1.01 1.48 1.35 1.41 1.32 6.2
Ash 7.86 6.92 7.17 7.27 7.26 0.1
West South Central
Btu 9,929 9,610 9,785 9,677 9,804 -1.3
Sulfur 0.57 0.54 0.54 0.57 0.61 -6.6
Ash 8.61 8.36 8.11 8.19 8.30 -1.3
Arkansas
Btu 11,529 11,791 12,091 11,846 12,039 -1.6
Sulfur 1.31 1.33 0.93 1.27 1.40 -9.5
Ash 12.09 11.65 10.04 10.69 10.77 -0.7
Louisiana
Btu 8,214 7,940 7,753 7,855 7,644 2.8
Sulfur 0.64 0.60 0.75 0.67 0.67 0.3
Ash 6.87 6.46 6.36 6.81 7.12 -4.3
Oklahoma
Btu 9,642 9,059 9,392 9,332 9,487 -1.6
Sulfur 0.31 0.25 0.30 0.28 0.35 -18.8
Ash 5.43 4.82 4.63 4.86 5.05 -3.7
Texas
Btu 10,274 10,025 10,023 9,936 10,257 -3.1
Sulfur 0.51 0.53 0.56 0.52 0.55 -5.6
Ash 10.29 10.26 11.02 10.29 10.55 -2.5
Mountain
Btu 10,339 10,602 10,445 10,384 10,551 -1.6
Sulfur 0.58 0.53 0.51 0.53 0.57 -7.3
Ash 7.16 7.28 6.52 7.22 7.05 2.3
Arizona
Btu 11,714 11,598 11,726 11,642 11,646 s
Sulfur 0.60 0.63 0.61 0.61 0.69 -12.4
Ash 11.36 11.51 11.05 11.31 11.41 -0.9
Colorado
Btu 10,721 11,358 11,698 10,855 11,515 -5.7
Sulfur 0.50 0.57 0.44 0.49 0.50 -1.5
Ash 8.62 8.86 7.37 8.26 8.16 1.1
Idaho
Btu 11,914 11,633 11,778 11,454 11,338 1.0
Sulfur 0.57 0.55 0.56 0.53 0.55 -3.7
Ash 9.94 10.57 5.91 10.87 10.81 0.5
Montana
Btu 8,634 9,510 8,664 8,991 8,942 0.6
Sulfur 0.33 0.37 0.33 0.36 0.35 5.0
Ash 5.53 5.42 5.39 5.46 5.15 6.1
Nevada
Btu 11,497 11,298 11,231 11,225 11,289 -0.6
Sulfur 0.52 0.49 0.44 0.50 0.43 16.1
Ash 8.97 9.07 8.75 8.78 9.00 -2.4
New Mexico
Btu 12,277 12,348 12,424 12,259 12,308 -0.4
Sulfur 0.74 0.68 0.76 0.71 0.72 -1.6
Ash 10.83 10.38 9.78 10.44 9.95 4.9
Utah
Btu 11,432 11,504 11,469 11,462 11,426 0.3
Sulfur 0.53 0.47 0.53 0.54 0.52 3.4
Ash 10.81 11.07 10.75 11.24 10.49 7.1
Wyoming
Btu 9,847 9,877 10,037 9,776 9,939 -1.6
Sulfur 0.67 0.57 0.55 0.54 0.64 -15.1
Ash 5.15 4.55 4.56 5.02 4.73 6.3
50

U.S. Energy Information Administration | Quarterly Coal Report, October - December 2017
Year to DateCensus Divisionand State1
October - December2017
July - September2017
October - December2016 2017 2016
PercentChange
Pacific
Btu 11,417 11,410 11,360 11,392 11,408 -0.1
Sulfur 0.58 0.60 0.54 0.58 0.58 -0.9
Ash 11.13 11.49 9.80 11.22 10.20 10.0
California
Btu 11,501 11,489 11,488 11,497 11,549 -0.4
Sulfur 0.60 0.61 0.56 0.59 0.60 -1.8
Ash 11.51 11.80 10.18 11.62 10.62 9.5
Oregon
Btu 11,795 11,362 11,670 11,650 11,522 1.1
Sulfur 0.53 0.53 0.51 0.53 0.52 1.0
Ash 9.80 10.59 9.78 10.07 10.87 -7.4
Washington
Btu 9,328 9,483 9,401 9,386 9,390 s
Sulfur 0.33 0.35 0.32 0.33 0.33 2.1
Ash 4.70 4.44 4.14 4.45 4.20 5.9
U.S. Total
Btu 11,772 11,760 11,621 11,757 11,729 0.2
Sulfur 1.00 1.26 0.99 1.08 1.02 5.3
Ash 7.51 7.36 7.48 7.48 7.45 0.4
1 Quality units are Btu (per pound); sulfur (percent by weight); and ash (percent by weight).
- = No data reported.
s = Absolute percentage less than 0.05.
Source: U.S. Energy Information Administration (EIA), Form EIA-3, 'Quarterly Survey of Industrial, Commercial & Institutional Coal Users.' Prior to third quarter 2014, coke plant data was collected under FormEIA-5, 'Quarterly Coal Consumption and Quality Report - Coke Plants.'
51
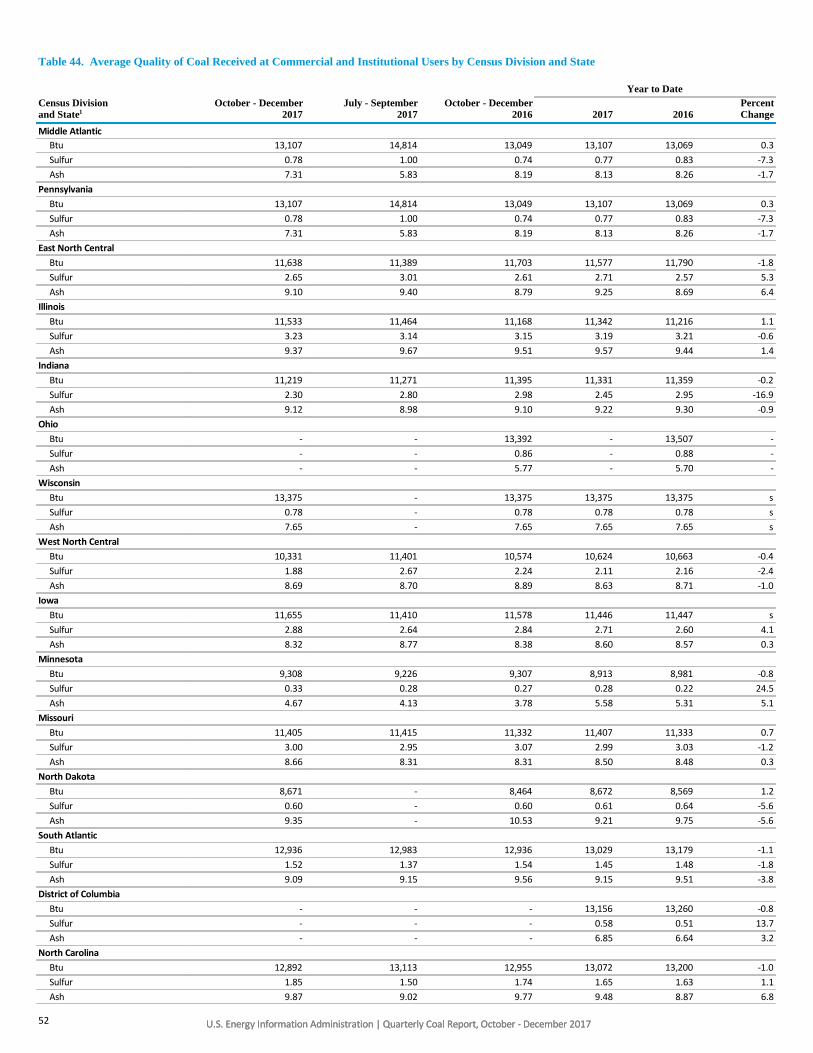
U.S. Energy Information Administration | Quarterly Coal Report, October - December 2017U.S. Energy Information Administration | Quarterly Coal Report, October - December 2017
Table 44. Average Quality of Coal Received at Commercial and Institutional Users by Census Division and State
Year to DateCensus Divisionand State1
October - December2017
July - September2017
October - December2016 2017 2016
PercentChange
Middle Atlantic
Btu 13,107 14,814 13,049 13,107 13,069 0.3
Sulfur 0.78 1.00 0.74 0.77 0.83 -7.3
Ash 7.31 5.83 8.19 8.13 8.26 -1.7
Pennsylvania
Btu 13,107 14,814 13,049 13,107 13,069 0.3
Sulfur 0.78 1.00 0.74 0.77 0.83 -7.3
Ash 7.31 5.83 8.19 8.13 8.26 -1.7
East North Central
Btu 11,638 11,389 11,703 11,577 11,790 -1.8
Sulfur 2.65 3.01 2.61 2.71 2.57 5.3
Ash 9.10 9.40 8.79 9.25 8.69 6.4
Illinois
Btu 11,533 11,464 11,168 11,342 11,216 1.1
Sulfur 3.23 3.14 3.15 3.19 3.21 -0.6
Ash 9.37 9.67 9.51 9.57 9.44 1.4
Indiana
Btu 11,219 11,271 11,395 11,331 11,359 -0.2
Sulfur 2.30 2.80 2.98 2.45 2.95 -16.9
Ash 9.12 8.98 9.10 9.22 9.30 -0.9
Ohio
Btu - - 13,392 - 13,507 -
Sulfur - - 0.86 - 0.88 -
Ash - - 5.77 - 5.70 -
Wisconsin
Btu 13,375 - 13,375 13,375 13,375 s
Sulfur 0.78 - 0.78 0.78 0.78 s
Ash 7.65 - 7.65 7.65 7.65 s
West North Central
Btu 10,331 11,401 10,574 10,624 10,663 -0.4
Sulfur 1.88 2.67 2.24 2.11 2.16 -2.4
Ash 8.69 8.70 8.89 8.63 8.71 -1.0
Iowa
Btu 11,655 11,410 11,578 11,446 11,447 s
Sulfur 2.88 2.64 2.84 2.71 2.60 4.1
Ash 8.32 8.77 8.38 8.60 8.57 0.3
Minnesota
Btu 9,308 9,226 9,307 8,913 8,981 -0.8
Sulfur 0.33 0.28 0.27 0.28 0.22 24.5
Ash 4.67 4.13 3.78 5.58 5.31 5.1
Missouri
Btu 11,405 11,415 11,332 11,407 11,333 0.7
Sulfur 3.00 2.95 3.07 2.99 3.03 -1.2
Ash 8.66 8.31 8.31 8.50 8.48 0.3
North Dakota
Btu 8,671 - 8,464 8,672 8,569 1.2
Sulfur 0.60 - 0.60 0.61 0.64 -5.6
Ash 9.35 - 10.53 9.21 9.75 -5.6
South Atlantic
Btu 12,936 12,983 12,936 13,029 13,179 -1.1
Sulfur 1.52 1.37 1.54 1.45 1.48 -1.8
Ash 9.09 9.15 9.56 9.15 9.51 -3.8
District of Columbia
Btu - - - 13,156 13,260 -0.8
Sulfur - - - 0.58 0.51 13.7
Ash - - - 6.85 6.64 3.2
North Carolina
Btu 12,892 13,113 12,955 13,072 13,200 -1.0
Sulfur 1.85 1.50 1.74 1.65 1.63 1.1
Ash 9.87 9.02 9.77 9.48 8.87 6.8
52
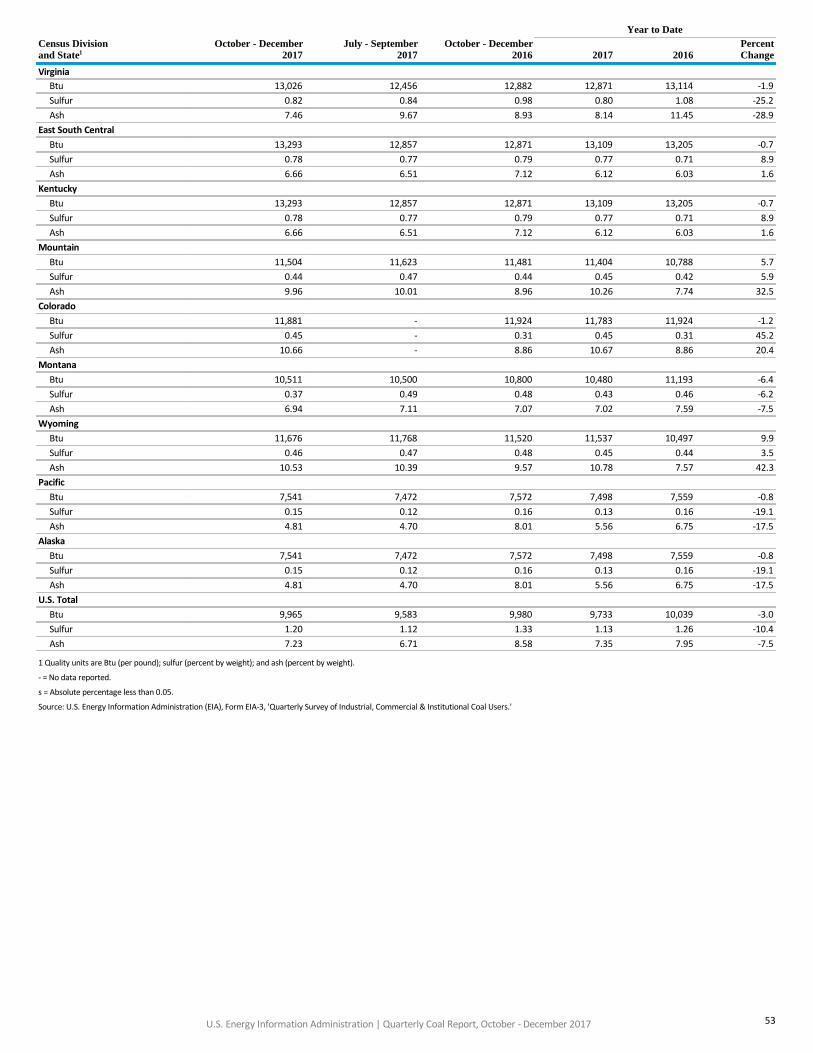
U.S. Energy Information Administration | Quarterly Coal Report, October - December 2017
Year to DateCensus Divisionand State1
October - December2017
July - September2017
October - December2016 2017 2016
PercentChange
Virginia
Btu 13,026 12,456 12,882 12,871 13,114 -1.9
Sulfur 0.82 0.84 0.98 0.80 1.08 -25.2
Ash 7.46 9.67 8.93 8.14 11.45 -28.9
East South Central
Btu 13,293 12,857 12,871 13,109 13,205 -0.7
Sulfur 0.78 0.77 0.79 0.77 0.71 8.9
Ash 6.66 6.51 7.12 6.12 6.03 1.6
Kentucky
Btu 13,293 12,857 12,871 13,109 13,205 -0.7
Sulfur 0.78 0.77 0.79 0.77 0.71 8.9
Ash 6.66 6.51 7.12 6.12 6.03 1.6
Mountain
Btu 11,504 11,623 11,481 11,404 10,788 5.7
Sulfur 0.44 0.47 0.44 0.45 0.42 5.9
Ash 9.96 10.01 8.96 10.26 7.74 32.5
Colorado
Btu 11,881 - 11,924 11,783 11,924 -1.2
Sulfur 0.45 - 0.31 0.45 0.31 45.2
Ash 10.66 - 8.86 10.67 8.86 20.4
Montana
Btu 10,511 10,500 10,800 10,480 11,193 -6.4
Sulfur 0.37 0.49 0.48 0.43 0.46 -6.2
Ash 6.94 7.11 7.07 7.02 7.59 -7.5
Wyoming
Btu 11,676 11,768 11,520 11,537 10,497 9.9
Sulfur 0.46 0.47 0.48 0.45 0.44 3.5
Ash 10.53 10.39 9.57 10.78 7.57 42.3
Pacific
Btu 7,541 7,472 7,572 7,498 7,559 -0.8
Sulfur 0.15 0.12 0.16 0.13 0.16 -19.1
Ash 4.81 4.70 8.01 5.56 6.75 -17.5
Alaska
Btu 7,541 7,472 7,572 7,498 7,559 -0.8
Sulfur 0.15 0.12 0.16 0.13 0.16 -19.1
Ash 4.81 4.70 8.01 5.56 6.75 -17.5
U.S. Total
Btu 9,965 9,583 9,980 9,733 10,039 -3.0
Sulfur 1.20 1.12 1.33 1.13 1.26 -10.4
Ash 7.23 6.71 8.58 7.35 7.95 -7.5
1 Quality units are Btu (per pound); sulfur (percent by weight); and ash (percent by weight).
- = No data reported.
s = Absolute percentage less than 0.05.
Source: U.S. Energy Information Administration (EIA), Form EIA-3, 'Quarterly Survey of Industrial, Commercial & Institutional Coal Users.'
53