quarterly report for 2018 third quarter - nis
TRANSCRIPT

0

Quarterly Report for 2018 Third Quarter
1
The Quarterly Report for 2018 Third Quarter presents a factual overview of NIS
Group’s activities, development and performance in the third quarter of 2018.
The Report presents data for NIS Group, which comprises NIS j.s.c. Novi Sad and
its subsidiaries. If specific reference is made to individual subsidiaries or to NIS
j.s.c. Novi Sad only, it is so noted in the Report. The terms “NIS j.s.c. Novi Sad”
and “the Company” denote NIS j.s.c. Novi Sad the parent company, whereas the
terms “NIS” and “NIS Group” denote NIS j.s.c. Novi Sad together with all
subsidiaries.
The Quarterly Report for 2018 Third Quarter is compiled in Serbian, English and
Russian. In the event of any discrepancy, the Serbian version shall prevail.
The Quarterly Report for 2018 Third Quarter is also available for download from
the corporate website. For more information on NIS Group, visit the corporate
website www.nis.eu.

NIS Group
2
Contents
Contents ......................................................................................................................................... 2
Introduction .................................................................................................................................... 3
Business Report .............................................................................................................................................. 4
Highlights ........................................................................................................................................ 4
NIS Group ....................................................................................................................................... 7
Risk Management ......................................................................................................................... 11
Business Environment .................................................................................................................. 17
Performance Analysis ................................................................................................................... 21
Securities ...................................................................................................................................... 43
Corporate Governance ................................................................................................................. 46
Human Resources ......................................................................................................................... 58
Research and Development ......................................................................................................... 60
Financial Statements ..................................................................................................................................... 61
Stand-Alone Financial Statements ............................................................................................... 61
Consolidated Financial Statements .............................................................................................. 84
Statement of Individuals Responsible for the Preparation of Financial Statements .................................. 107

Quarterly Report for 2018 Third Quarter
3
Introduction
During the past nine months of 2018, NIS Group continued to improve financial and operational indicators
and at the same time invest generous funds in strategic projects which will further build NIS. This reporting
period has been marked by better financial results when compared to the same period in 2017. The net
profit amounted to 21.7 billion dinars, which is 8% more than last year. Also, the EBITDA indicator is 42
billion dinars, which is 23 percent better than in the same period of the previous year. On the one hand,
these results have been realized under the influence of external factors, primarily due to the rise in oil prices
on the world market (the average price of Urals oil in this reporting period is $ 70.7 per barrel, which is 39
percent more than in the same period last year). On the other hand, the improvement in the financial results
of the NIS Group has been influenced by the growth of turnover, as well as the increase in the efficiency of
operations, in which NIS will continue to insist at all levels and in all segments of the business in the future.
Measures for increasing operational efficiency in the nine months of the current year resulted in an effect
of 3.7 billion dinars on the EBITDA indicator.
Investments in development projects are particularly important for the NIS Group, so in the nine months of
2018, 27.3 billion dinars were allocated for capital investments, which is 64 percent more than the amount
allocated for investments in the nine months of 2017. Most of the funds were invested in research and
production of oil and gas, while the emphasis in individual projects was on the realization of the
construction of a deep processing facility with delayed coking technology. Since it is a capital project of the
second phase of modernization of the Oil Refinery in Pancevo, the public has been fully aware of this project
due to a visit of the leading domestic media sites to the Refinery. NIS has also continued to digitalize its
operation in all business directions, and realization of this goal will be one of the priorities in the years to
come so that NIS would successfully respond to the challenges of the Fourth Industrial Realization and
provide its customers with quality servicing and services along with increased efficiency.
It is important to note that, at the same time, the liabilities of the NIS Group increased on the basis of public
revenues and that they amounted to 142.26 billion dinars, which is 16 percent more than in the previous
year. Also, NIS j.s.c. Novi Sad, continued with the practice of paying dividends to shareholders for the sixth
consecutive year, in the amount of 25 percent from last year's net profit of the Company, thus 6.95 billion
dinars were paid to shareholders for this purpose.
When it comes to operational indicators, again, there has been a growth in processing and sales and
distribution. The total volume of oil and semi-finished products is 2.769 thousand tons, which is 6 percent
more than in the nine months of 2017. The growth of petroleum products turnover was recorded at the
same time and it amounted 2.741 thousand tons (without internal traffic), which is 10 percent more than
last year. It is important to note that during this reporting period NIS exports increased by as much as 20
percent, while better results were recorded in both wholesale and retail in Serbia. The production of oil and
gas amounted to 999 thousand conditional tons.
By the end of this year, NIS continues to focus on the implementation of capital projects, improving financial
and operating results, increasing operational efficiency and digitalizing business, so that it could continue
to create additional value for its shareholders, employees and the community in which it operates, in line
with the Development Strategy of 2025 and in challenging macroeconomic conditions.

NIS Group
4
Business Report
Highlights
January - September
Start of a new 3D seismic project in Romania, Block EX-3
During the first 9 months, 42 development and 7 exploratory wells were drilled in Serbia (39 development and 8 exploratory wells were put into operation). In third quarter 14 development wells and one exploratory were drilled in Serbia.
The drilling of two exploratory wells was initiated in Romania (Beba Veche Sud-1000 and Teremia-1001)
The Energy Plant was formed by transformations within the Exploration and Production Block
The competition for the best technologist in 2018 in the Exploration and Production Block was held on 31 August
Twenty-two students from the Faculty of Technical Sciences “Mihajlo Pupin” in Zrenjanin and students from several prestigious faculties for oil and gas in Russia completed the summer internship through the program Energy of Knowledge
3D seismic project “South Banat 2” was completed
New 3D seismic project in Serbia, “Turija IV”, was initiated
Final construction works on 3 PS “Bagrdan”, “Subotica” and “Lazarevac”
Bitumen unit revamped.
New gas ejector GB-2202 put into operation.
Test refining of new „Iran Heavy“ crude completed
90% of 3D model designs under Work Package 2 of the Delayed Coker Unit project completed. Concrete structure of the coking reactor finished and the reactor structure erected under the Delayer Coker Unit Project. The main compressor unit was installed and the concrete foundation laid for the coke silos.
Development of a digital transformation plan for Refining under the OMS Project
Revamp of Klaus unit (S-2450) completed
Merox unit (S-2550) handed over for reconstruction as part of activities under the DCU Project
In September, a maximum monthly refining and reprocessing output recorded (374 thou. t) for the last 10 years
In August, a record production and transport of bitumen (51 thousand tonnes)
Regular maintenance of Visbreaking (S-200) and Diesel Dewaxing (S-2400) units completed
Works on horizontal and vertical signalling in front of Pančevo Oil Refinery completed
Definition of technological requirements for connection of CCPP Pančevo to the existing lines in Pančevo Oil Refinery
In September, extension of the certification scope to include new road bitumen „EB 35/50“, which NIS intends to place in the European market, was completed

Quarterly Report for 2018 Third Quarter
5
Rebranding completed at 2 petrol stations – 12. februar (NIS
brand) and Vojvode Mišica (GAZPROM brand). After rebranding,
Bagrdan petrol station was put into operation on 14 March 2018,
and the reconstruction of the PS Subotica 1 and Lazarevac-city
was completed.
Development of the loyalty program: On the Road with Us and
introduction of the new payment function on this card.
Installation of additization system on vehicles and beginning of
supply and sale of OPTI fuels on Gazprom PSs
Twenty three new G-Drive trademarked products introduced
Rebranding of ‘‘Jazak” brand and introduction of new packaging
of 0.5l and 1.5l
Aviation fuel resale expansion
Over 146 marketing campaigns were carried out at our PSs in
Serbia and the region during the period of 9 months of 2018
Heavy fuel oil flow control system installed in the Pančevo Energy
Plant, enabling significant energy savings.
The celebration of the 10th anniversary of the "Together for the
Community" programme continued and the jubilee of this
programme was celebrated during the third quarter in Novi Sad,
Nis, Kikinda, Zitiste and Novi Becej
Within the "Together for the Community" programme, in cooperation with the "Novi Sad" Table Tennis
Club and the city administration, NIS supported the project of placing concrete table tennis tables on 10 public areas in Novi Sad
The sixth Festival of Russian Music "Bolshoy", a joint project by Emir Kusturica and Gazprom Neft, the majority shareholder of NIS, was held in the ethno village of Mecavniк
For the sixth year in a row, NIS paid a dividend to its shareholders; a total of RSD 6.95 billion was allocated for this purpose, which is 25% of the last year's net profit of the Company
Within the “Together for the Community” programme, the City of Belgrade and NIS signed the Cooperation Agreement continuing the joint realization of capital projects which contribute to improving the quality of life of the citizens of Belgrade. The Agreement was signed by Kirill Tyurdenev, the CEO of NIS, and Zoran Radojicic, the mayor of Belgrade
Within the "We are all one team" project, the NIS company rewarded its consumers with kart racing with Dusan Borkovic in Belgrade
The assembling of oversized equipment within the construction of the deep processing plant with delayed coking technology project realization in Pancevo Oil Refinery was successfully completed. On that occasion, the Department of External Communications organized a visit of the leading domestic media to the construction site in the Refinery
Technical School "23. maj" in Pancevo got a modern ecological laboratory, designed and equipped with the support of NIS within the “Together for the Community” programme
NIS supported the reconstruction of kindergarten in Kikinda within the “Together for the Community” programme
In Belgrade, with the support of NIS, the 57th October Salon opened
With the support of the Basketball Association of Serbia, NIS organized a mini 3x3 tournament on the
platform in front of Belgrade BC

NIS Group
6
NIS and Serbian Ministry of Education, Science and Technological
Development signed a Memorandum of Cooperation for joining
forces on promoting science and education
NIS representatives presented a donation to the Children and Youth
Healthcare Institute of Vojvodina in Novi Sad for purchasing new
medical equipment.
In a Best Employer 2018 survey of Poslovi.infostud.com, NIS was
declared one of Serbia’s most attractive employers
Sberbank Serbia and NIS received the Banking Technology Award –
Most Innovative Card Product 2018 for the On the Road With Us
Card
NIS received the prestigious Captain Miša Anastasijević Award for
best company in Serbia in an official ceremony at Matica Srpska in
Novi Sad
NIS continued to improve the quality of life in local communities in
Serbia so Zrenjanin got a modern Volleyball Training Centre, while
Čačak got a children’s playground and an outdoor gym
GAZPROM petrol station opened in Niš, marking the 20th station
under this premium brand in Serbia
NIS j.s.c. Novi Sad 10th Annual General Meeting adopted a Decision
on 2017 profit distribution, dividend payment and determination of
the Company’s total retained earnings
NIS received its second successive award for best corporate brand in the Production Goods and Business
Services category at the Best of Serbia Awards. NIS also received the Winner No. 1 Award in the Energy
category at the Corporate Superbrands Serbia 2017/2018 Awards
NIS supported the renovation of the Petrovaradin Fortress Observatory in Novi Sad.

Quarterly Report for 2018 Third Quarter
7
NIS Group
NIS Group is one of the largest vertically-integrated energy systems in Southeast Europe. The main activities
of NIS Group are the exploration, production and refining of oil and natural gas, the sale and distribution of
a wide range of petroleum and gas products and the implementation of petrochemical and energy projects.
The main production capacities are located in the Republic of Serbia, but the Group also operates in several
countries around the world1 and employs an international team of experts.
NIS’ goal is to become the fastest-growing energy system in the Balkans and to set an example in business
efficiency and sustainable development.
Business Activities
NIS Group’s business activities are organised within NIS j.s.c. Novi Sad as the parent company and delivered
through five Blocks2 and nine Functions supporting the core business. The Blocks are: Exploration and
Production, Services, Refining, Sales and Distribution and Energy3.
The activities of Exploration and Production cover exploration, production, infrastructure and operational
support to production, oil and gas reserves management, oil and gas reservoir engineering, and
implementation of major exploration and production projects.
The majority of NIS’ oilfields are located in Serbia, but NIS also carries out exploration operations in Bosnia
and Herzegovina, Hungary and Romania. NIS’ oldest foreign concession is in Angola, where NIS has been
undertaking oil exploitation operations ever since 1985.
This Block operates an Elemir-based plant for natural gas conditioning, LPG and natural gasoline production
and CO2 capture, with a design capacity of 65,000 tonnes of LPG and natural gasoline per year. This plant
also operates the Amine Plant for the purification of natural gas applying HiPACT technology. The Elemir
plant is the first HiPACT plant in Europe, and the gas processing method employed completely prevents any
carbon dioxide emissions into the atmosphere.
The Group’s subsidiary STC NIS Naftagas d.o.o. Novi Sad provides scientific and technical support to the
Block’s main activities, while being the development and innovation hub of the entire NIS.
Services provides oil and gas exploration and production services through geophysical survey, well
construction, completion and workover, and specialist wellbore operations and measurements. The Block
also delivers equipment maintenance services and constructs and maintains oil and gas systems and
facilities. Apart from rendering freight transport and equipment operation services, Services as also engage
in passenger transport and vehicle rental services. NIS has its own servicing capacities, which fully meet the
Group’s requirements and are able to provide services to third parties. These services are provided through
subsidiaries: Naftagas – Naftni servisi d.o.o. Novi Sad, Naftagas – Tehnički servisi d.o.o. Zrenjanin and
Naftagas – Transport d.o.o. Novi Sad. Services has expanded the business into foreign markets also: Bosnia
and Herzegovina, Romania and Russia.
Refining is engaged in the processing of crude oil and other feedstock and the production of petroleum
products. It produces a broad range of petroleum products: from motor and high-octane fuels to feedstock
for the petrochemical industry and other products derived from oil. The Block’s refining complex comprises
1 Look at the NIS Worldwide on the page no. 9 and NIS Group Business Structure on the page no. 11 2 The reorganisation and creation of a new Division resulted in abolishment of Energy. The Energy Department is kept in the structure, but is
subordinated to the Division. Other organisational units are decentralised to Exploration and Production, Refining and Sales and Distribution. 3 The reorganisation and creation of a new Division resulted in abolishment of Energy. The Energy Department is kept in the structure, but is
subordinated to the Division. Other organisational units are decentralised to Exploration and Production, Refining and Sales and Distribution.
NIS Group
8
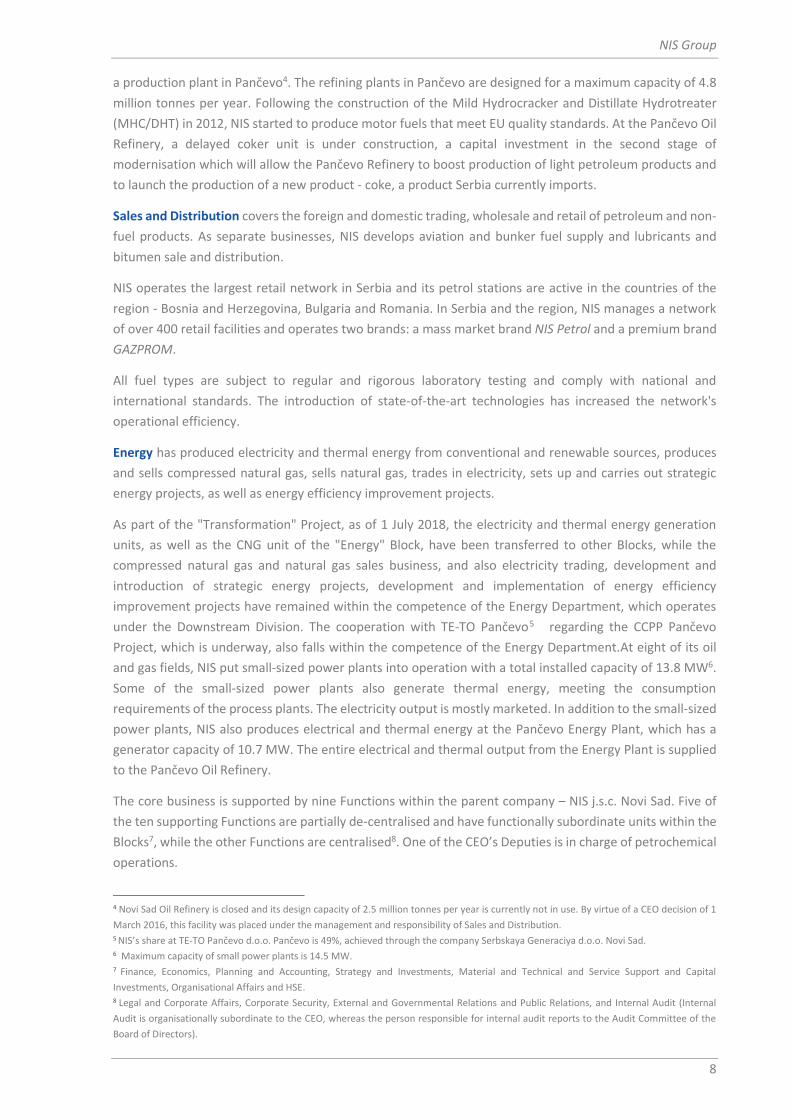
a production plant in Pančevo4. The refining plants in Pančevo are designed for a maximum capacity of 4.8
million tonnes per year. Following the construction of the Mild Hydrocracker and Distillate Hydrotreater
(MHC/DHT) in 2012, NIS started to produce motor fuels that meet EU quality standards. At the Pančevo Oil
Refinery, a delayed coker unit is under construction, a capital investment in the second stage of
modernisation which will allow the Pančevo Refinery to boost production of light petroleum products and
to launch the production of a new product - coke, a product Serbia currently imports.
Sales and Distribution covers the foreign and domestic trading, wholesale and retail of petroleum and non-
fuel products. As separate businesses, NIS develops aviation and bunker fuel supply and lubricants and
bitumen sale and distribution.
NIS operates the largest retail network in Serbia and its petrol stations are active in the countries of the
region - Bosnia and Herzegovina, Bulgaria and Romania. In Serbia and the region, NIS manages a network
of over 400 retail facilities and operates two brands: a mass market brand NIS Petrol and a premium brand
GAZPROM.
All fuel types are subject to regular and rigorous laboratory testing and comply with national and
international standards. The introduction of state-of-the-art technologies has increased the network's
operational efficiency.
Energy has produced electricity and thermal energy from conventional and renewable sources, produces
and sells compressed natural gas, sells natural gas, trades in electricity, sets up and carries out strategic
energy projects, as well as energy efficiency improvement projects.
As part of the "Transformation" Project, as of 1 July 2018, the electricity and thermal energy generation
units, as well as the CNG unit of the "Energy" Block, have been transferred to other Blocks, while the
compressed natural gas and natural gas sales business, and also electricity trading, development and
introduction of strategic energy projects, development and implementation of energy efficiency
improvement projects have remained within the competence of the Energy Department, which operates
under the Downstream Division. The cooperation with TE-TO Pančevo5 regarding the CCPP Pančevo
Project, which is underway, also falls within the competence of the Energy Department.At eight of its oil
and gas fields, NIS put small-sized power plants into operation with a total installed capacity of 13.8 MW6.
Some of the small-sized power plants also generate thermal energy, meeting the consumption
requirements of the process plants. The electricity output is mostly marketed. In addition to the small-sized
power plants, NIS also produces electrical and thermal energy at the Pančevo Energy Plant, which has a
generator capacity of 10.7 MW. The entire electrical and thermal output from the Energy Plant is supplied
to the Pančevo Oil Refinery.
The core business is supported by nine Functions within the parent company – NIS j.s.c. Novi Sad. Five of
the ten supporting Functions are partially de-centralised and have functionally subordinate units within the
Blocks7, while the other Functions are centralised8. One of the CEO’s Deputies is in charge of petrochemical
operations.
4 Novi Sad Oil Refinery is closed and its design capacity of 2.5 million tonnes per year is currently not in use. By virtue of a CEO decision of 1
March 2016, this facility was placed under the management and responsibility of Sales and Distribution. 5 NIS’s share at TE-TO Pančevo d.o.o. Pančevo is 49%, achieved through the company Serbskaya Generaciya d.o.o. Novi Sad.
6 Maximum capacity of small power plants is 14.5 MW. 7 Finance, Economics, Planning and Accounting, Strategy and Investments, Material and Technical and Service Support and Capital
Investments, Organisational Affairs and HSE. 8 Legal and Corporate Affairs, Corporate Security, External and Governmental Relations and Public Relations, and Internal Audit (Internal
Audit is organisationally subordinate to the CEO, whereas the person responsible for internal audit reports to the Audit Committee of the
Board of Directors).

Quarterly Report for 2018 Third Quarter
9
NIS Worldwide
Business expansion into the region is one of NIS’ strategic goals. NIS began expanding the business to
regional countries in 2011. The regional expansion pursued two main courses - oil and gas exploration and
production (in Bosnia and Herzegovina, Hungary and Romania) and retail network development (in Bulgaria,
Bosnia and Herzegovina and Romania). In addition, NIS is also active in electricity trading and, apart from
Serbia, has a market presence in Bosnia and Herzegovina, Romania, Slovenia and Hungary.

NIS Group
10
NIS Group Business Structure
9 Under the Law on Tourism of the Republic of Serbia, if a company does not operate in hospitality as its core activity, the company is obliged
to form a branch, i.e. premises outside its registered seat, and register it accordingly or otherwise establish an organisational unit that is
registered in the Tourism Registry. To this end, the Company registered all petrol stations where it provides hospitality services as separate
branches. The list of petrol stations which are registered as branches is available at http://ir.nis.eu/en/corporate-governance/group-
structure/.
Turkmenistan Branch Office
Branch Offices in Serbia9
Angola Representative Office
Bulgaria Representative Office
Croatia Representative Office
Bosnia and Herzegovina Representative Office
Romania Representative Office
Russian Federation Representative Office
O Zone a.d. Beograd - NIS Energowind d.o.o. Beograd
Naftagas – Naftni servisi d.o.o. Novi Sad
Naftagas – Tehnički servisi d.o.o. Zrenjanin
Naftagas – Transport d.o.o. Novi Sad
NTC NIS – Naftagas d.o.o. Novi Sad
NIS Oversees o.o.o. St. Petersburg
NIS Petrol EOOD Sofia
NIS Petrol SRL Bucharest
NIS Petrol d.o.o. Banja Luka - G – Petrol d.o.o. Sarajevo
Pannon Naftagas kft Budapest
Jadran Naftagas d.o.o. Banja Luka
NIS-Svetlost d.o.o. Bujanovac

Quarterly Report for 2018 Third Quarter
11
Risk Management
Integrated Risk Management System
Risk is a likely future event that can exert a negative or positive influence on the achievement of the
Company's objectives at all management levels. Risk management is a continuous and systematic business
process that serves to support management decision-making in a risk exposure environment.
The Company’s operations are exposed to various risks that carry a potential to essentially impede the
fulfilment of set objectives, if realised. The Company acknowledges risks and invests sustained efforts to
manage them systematically. Efficient risk management is central to ensuring the Company’s business
continuity and a well-established risk management framework constitutes the basis for business decision-
making.
NIS has set its risk management objectives and has an integrated risk management system (IRMS) in place.
The Company's objective in the field of risk management is to increase the effectiveness and efficiency of
management decisions through identification, analysis and assessment of associated risks and to ensure a
maximum effectiveness and efficiency in risk management actions during the implementation of decisions.
The IRMS is a set of phases, methodologies and instruments aimed at ensuring the efficiency and
effectiveness of the risk management process at NIS.
The Company’s risk management objectives are met through the following tasks:
Establishing a risk management culture at the Company in order to reach a common understanding of the basic risk management principles and approaches by the management and employees;
Defining and establishing a systemic approach to identifying and assessing the risks inherent in the Company’s operations, both in general and in specific business areas;
Encouraging the exchange of risk information among the corporate organisational units and a joint definition of actions to manage the risks;
Providing structured information on risks to the corporate governance bodies.

NIS Group
12
IRMS Business Process Flow at NIS
The basic principle underpinning this system entails that the responsibility for managing risks is assigned to
different management levels relative to a risk’s estimated level of impact on the Company’s operations
(financial, reputational HSE impact and legal impact). Such approach allows for identifying the areas of
responsibility for risk management and oversight at all management levels and ensuring that suitable action
plans are prepared in order to manage risks at the level of organisational units or NIS as a whole.
The parent company has set up its Section for Risk Management System Monitoring to coordinate and
continually develop this business process.
Furthermore, the integrated management system, organisational structure, business processes, standards
and other internal regulations, the Code of Corporate Governance and the Code of Business Ethics
altogether form an internal control system providing NIS guidance on how to run the business and
effectively manage associated risks.
At NIS, risks are identified and assessed by analysing data sources (internal and external databases, KRIs),
through interviews, risk sessions or similar, and are ranked by level against the Risk Matrix defined based
on propensity to risk (Key Company Risk, Key Division/Block/Function Risk, Division/Block/Function Risk).
Assessment can be carried out by means of a quantitative or qualitative method.
Analysis of the observed business process
Risk
identification
Analysis and risk
assessment
Defining strategies and
risk management
measures
Monitoring the implementation
of risk management
measures
Risk reporting

Quarterly Report for 2018 Third Quarter
13
IRMS in Business Planning Process
Key risks associated with corporate goals are identified at all levels at NIS and endorsed by the Board of
Directors through adoption of business plans. Risk assessment is an integral part of the business planning
process, while information on key risks – estimated financial effect of the risks, management strategies, risk
management actions and financial resources needed to carry out the actions – are incorporated in business
plans.
Through its operations, the Group is exposed to operational, political, market, financial and reputational
risks.
Operational Risks
RISK DESCRIPTION RISK MANAGEMENT ACTIONS
Project Risks
With respect to geological research, the goal of NIS Group is to achieve reserves growth and to increase NIS’ production. This largely depends on the outcome of geological research activities, which aim to increase the number of active wells in the country and abroad.
The main risk in oil and gas exploration and production ensues from failure to prove estimated reserves and, consequently, failure on the part of NIS to achieve its planned reserves growth.
Risk mitigation actions include the implementation of new 3D seismic surveys by applying the latest wireless technology, selecting candidates for exploratory drilling based on complex seismic and geological data interpretation, using the largest shareholder’s expertise in geological research programmes and selecting the most prospective wells along with the application of state-of-the-art exploration methods. To mitigate the risks, special attention is paid to a robust preparation of projects for implementation and advanced monitoring during geological research operations.
In order to reduce licensing risks, geological research is carried out as per a schedule defined by Geological Research Programmes and provisions of the Law on Mining and Geological Research regulating the field of exploration and production of oil and gas, among other areas.
Market Risks
RISK DESCRIPTION RISK MANAGEMENT ACTIONS
Price risk
In view of its core activity, NIS Group is exposed to risks associated with price volatility, specifically the price of crude oil and petroleum products affecting the value of inventories and refining margins, which in turn affects future cash flows.
These risks are partly offset by adjusting petroleum product selling prices against the changes in oil and petroleum product prices. The need to use some of commodity hedging instruments in the Group’s subsidiaries, including NIS j.s.c. Novi Sad as a subsidiary, is at the discretion of Gazprom Neft Group.
In addition, the following actions are undertaken to reduce a potentially negative impact of the risk:
Annual planning based on multiple scenarios, plan follow-up and timely adjustment of operating plans for crude oil procurement;
Regular sessions of NIS j.s.c. Novi Sad Committee in charge of crude oil purchase/sale to discuss all major subjects related to both crude oil purchase and sale (sale of Angola-Palanca crude oil);
Tendency to enter into long-term crude oil purchase contracts at most favourable commercial terms and with longer payment terms on an open account basis, and sales contracts which would exempt NIS j.s.c. Novi Sad, in line with current intergovernmental agreements, from paying customs duties at import, based on preferential status;

NIS Group
14
Expansion of the supplier portfolio, successful cooperation with EU-based companies, growing competitiveness in import tenders and more prominent progress regarding purchase prices;
Expansion/diversification of the crude oil basket for prospective import, provision of samples of the crude oil types that have not been used for processing at the Pančevo Oil Refinery;
Constant effort to optimise processes and achieve the most optimum economic effects and indicators;
Occasional benchmarking to survey the market and price trends and to analyse the commercial capacities of major prospective suppliers of crude oil, renowned companies which are dominant and reliable in crude oil trading.
Political Risks
RISK DESCRIPTION RISK MANAGEMENT ACTIONS
Risk of EU and US Economic Restrictions on Gazprom Neft Group
Economic restrictions imposed by the EU and the US on Gazprom Neft Group have brought about risks to the prospects for long-term development because of constraints regarding loan arrangements with commercial banks from some of the EU- and US-based bank groups.
NIS regularly follows international developments and assesses potential consequences for the company’s business. Moreover, in line with allowed exemption from the sanctions (long-term loans are possible only if intended for funding the import of goods and services from the EU), NIS’ operations are continuously being adjusted to this option by increasing the volume of imported goods and services from EU suppliers. In this way, funds are provided for financing NIS’ long-term development despite sanctions constraints.
Financial Risks
RISK DESCRIPTION RISK MANAGEMENT ACTIONS
Currency Risks
NIS Group operates in an international setting and is thus exposed to the risk of fluctuating foreign exchange rates arising from business transactions being made in different currencies, primarily USD and EUR. The risk involves future trade transactions and recognised assets and liabilities.
The risks relating to fluctuations in the national currency against the US dollar is partly neutralised through natural hedging of petroleum product selling prices, which are adjusted to these fluctuations. Risk management instruments are also used, such as forward transactions on the foreign exchange market, which help reduce the impact of foreign currency losses in the event of depreciation of the national currency against the US dollar or euro. Other actions include the balancing of the foreign exchange equilibrium in terms of adjusting the currencies in which export transactions are denominated to the currencies of foreign liabilities; managing the currency structure of the loan portfolio etc.
Interest Rate Risks
NIS Group is exposed to the risk of interest rate volatility, both in terms of its bank loans and deposits.
NIS j.s.c. Novi Sad takes out loans with commercial banks at floating or fixed interest rates depending on projections of changes of base interest rates in the monetary market. Consequently, funds in the form of intercompany loans to third parties are placed at floating or fixed interest rates, whereas funds deposited as term or demand deposits are placed at flat interest rates. Deposits are aligned with the credit limit methodologies of commercial banks (funds are reciprocally placed only with major commercial banks from which NIS j.s.c. Novi Sad takes out loans and/or credit/documentary lines). In this respect, revenues and cash flows from bank deposits are substantially independent of any changes in base interest rates, whereas for

Quarterly Report for 2018 Third Quarter
15
loans/credits granted exposure to the risk of base interest rate volatility (EURIBOR, LIBOR, etc.) is higher.
Financials risks
RISK DESCRPTION RISK MANAGEMENT ACTIONS
Accounts receivable risk
Arises in relation to cash and cash equivalents, deposits with banks and financial institutions, intercompany loans given to third parties, and exposure to wholesale and retail risks, including unrecoverable debt and assumed liabilities.
Credit risk management is established at the level of NIS Group. With respect to credit limits, banks are ranked according to adopted methodologies applicable to major and other banks, in order to determine the maximum extent of bank exposure of NIS j.s.c. Novi Sad at any given time (through deposits, documentary instruments: bank guarantees, Letters of Credit, etc. issued for the benefit of NIS j.s.c. Novi Sad).
Regarding accounts receivable, there is a credit limit methodology in place which serves to define the level of exposure in relation to individual customers, depending on their financial indicators.
Liquidity Risk
Liquidity risk denotes a risk of NIS Group encountering difficulty in meeting its liabilities. It is the risk of not having suitable sources to finance NIS Group’s business operations.
NIS Group continually monitors liquidity in order to provide sufficient cash to meet its operational, investment and financial performance requirements. To this end, it is continually contracting for and securing sufficient credit and documentary lines while maintaining the maximum allowable level of credit exposure and meeting the commitments under commercial bank arrangements (covenants).
Liquidity projections take into account the Group’s debt repayment schedules, compliance with contractual terms and internally set goals and are based on daily cash flow projections for the entire NIS Group, which form a basis for deciding on raising external loans, in which case adequate bank financing sources are secured within the allowable limits set by Gazprom Neft PJSC.
Aiming to increase liquidity and decrease dependence on external financing sources, as well as to decrease NIS Group’s costs of financing, the cash pooling system was introduced on 1 January 2014 for the purpose of liquidity management, which involves centralised management of liquidity and financing of the part of NIS Group in the Republic of Serbia10.
Since mid-September 2014, NIS j.s.c. Novi Sad has been exposed to the risk of limited external financing capacities due to the imposition of sectoral sanctions by the EU and the US on the largest Russian-owned energy companies and their subsidiaries incorporated outside the EU. The sanctions prevent NIS j.s.c. Novi Sad from borrowing from the EU or US banks for a period longer than 30 and 60 days respectively. Exemption from the EU sanctions is related to the possibility of borrowing for a period longer than 30 days from EU banks exclusively if the loan is intended for the
10NIS j.s.c. Novi Sad and subsidiaries Naftagas – Naftni servisi d.o.o. Novi Sad, Naftagas – Tehnički servisi d.o.o. Zrenjanin, Naftagas –
Transport d.o.o. Novi Sad and NTC NIS Naftagas d.o.o. Novi Sad

NIS Group
16
payment of non-sanctioned goods and services imported from the EU.
In order to acquire necessary funds for future transactions, NIS negotiated/contracted new credit lines with Serbian, Russian and Arabian banks for general purpose funding and with Serbia-based European banks for funding imports from the EU (financing for a period longer than 30 days is allowed if the subject of financing is import of goods or services from the EU), thus ensuring necessary funds for regular repayment of loans in 2018 and 2019, as well as for early repayment of loans in order to improve the loan portfolio (lowering the average cost of financing and extending the average portfolio maturity).
During 2017, the first stage of the loan portfolio restructuring process was carried out (first such restructuring since the introduction of sanctions in 2014). Loans granted under favourable terms were used to repay loans with shorter maturities and high interest rates (mainly USD loans the cost of which increased significantly due to the USD LIBOR trends), which helped to reduce the average cost of loan portfolio and extend the average maturity of the portfolio. The process of restructuring the loan portfolio continued during the first nine month of 2018 thanks to the new bank limits granted during the tender conducted in December 2017, as well as the new bank offers received in 2018. The bank limits are used in line with the exemptions provided under the sanctions regime for the import of goods and services from the EU, which will enable NIS to use liquidity surpluses from loans granted under better terms to repay less favourable loans from its portfolio before their maturity and thereby practically restructure the maturity of its loan portfolio (increase the share of long-term loans in the portfolio or extent the average loan portfolio term), along with reduced borrowing costs. Also with a smaller share of dollar-denominated loans which carry a risk of increased base rate (USD LIBOR), are being withdrawn new euro-denominated loans will be raised at more favourable interest rates (as opposed to the EU sanctions, USD loans are not possible due to the US sanctions that provide for no exemption), all within the allowed loan limits, which will unburden the company's cash flow for investments in the next three years and provide financial assets for the completion of projects (especially the Delayed Coker Unit Project).
Quarterly Report for 2018 Third Quarter
17
Business Environment
Worldwide
Oil
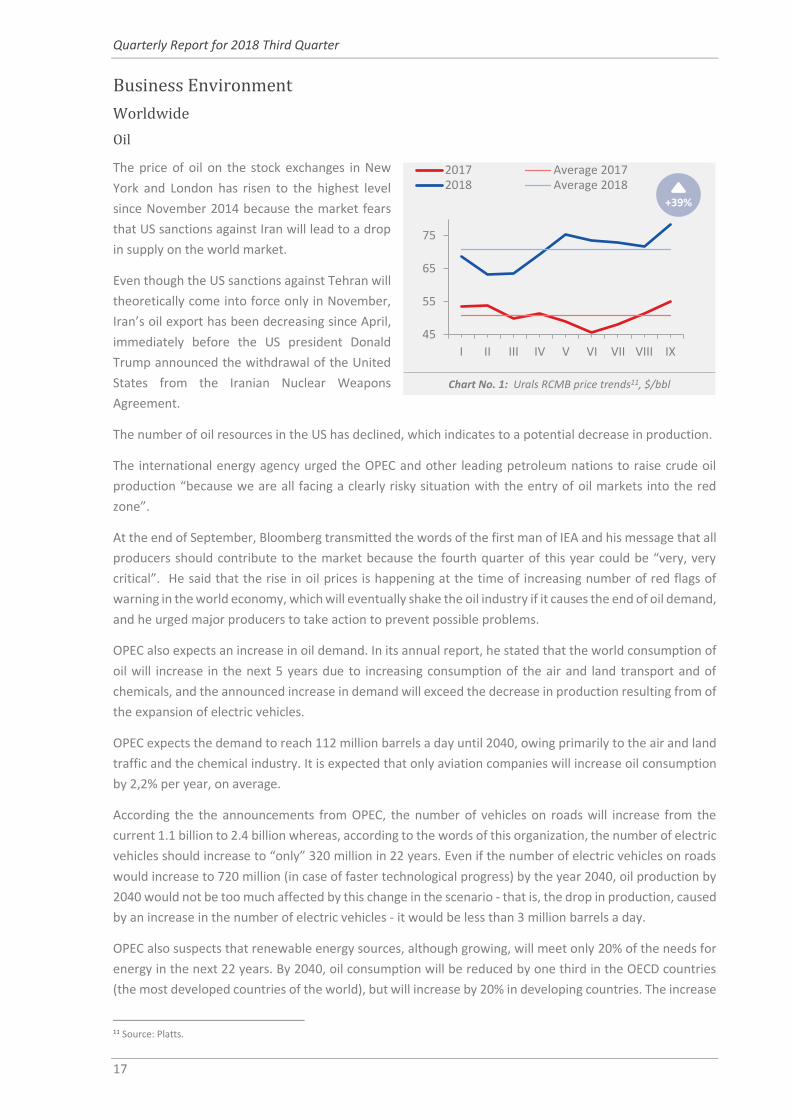
The price of oil on the stock exchanges in New
York and London has risen to the highest level
since November 2014 because the market fears
that US sanctions against Iran will lead to a drop
in supply on the world market.
Even though the US sanctions against Tehran will
theoretically come into force only in November,
Iran’s oil export has been decreasing since April,
immediately before the US president Donald
Trump announced the withdrawal of the United
States from the Iranian Nuclear Weapons
Agreement.
The number of oil resources in the US has declined, which indicates to a potential decrease in production.
The international energy agency urged the OPEC and other leading petroleum nations to raise crude oil
production “because we are all facing a clearly risky situation with the entry of oil markets into the red
zone”.
At the end of September, Bloomberg transmitted the words of the first man of IEA and his message that all
producers should contribute to the market because the fourth quarter of this year could be “very, very
critical”. He said that the rise in oil prices is happening at the time of increasing number of red flags of
warning in the world economy, which will eventually shake the oil industry if it causes the end of oil demand,
and he urged major producers to take action to prevent possible problems.
OPEC also expects an increase in oil demand. In its annual report, he stated that the world consumption of
oil will increase in the next 5 years due to increasing consumption of the air and land transport and of
chemicals, and the announced increase in demand will exceed the decrease in production resulting from of
the expansion of electric vehicles.
OPEC expects the demand to reach 112 million barrels a day until 2040, owing primarily to the air and land
traffic and the chemical industry. It is expected that only aviation companies will increase oil consumption
by 2,2% per year, on average.
According the the announcements from OPEC, the number of vehicles on roads will increase from the
current 1.1 billion to 2.4 billion whereas, according to the words of this organization, the number of electric
vehicles should increase to “only” 320 million in 22 years. Even if the number of electric vehicles on roads
would increase to 720 million (in case of faster technological progress) by the year 2040, oil production by
2040 would not be too much affected by this change in the scenario - that is, the drop in production, caused
by an increase in the number of electric vehicles - it would be less than 3 million barrels a day.
OPEC also suspects that renewable energy sources, although growing, will meet only 20% of the needs for
energy in the next 22 years. By 2040, oil consumption will be reduced by one third in the OECD countries
(the most developed countries of the world), but will increase by 20% in developing countries. The increase
11 Source: Platts.
Chart No. 1: Urals RCMB price trends11, $/bbl
45
55
65
75
I II III IV V VI VII VIII IX
2017 Average 20172018 Average 2018
+39%

NIS Group
18
in oil production comes mainly from the deposits of shale in the USA, whereas China and India will be the
main promoters of demand.
Regarding other energy sources, the question is: “whether renewable energy can outperform natural gas?
In terms of climate goals, natural gas encounters different opinions. One party claims that it reduces the
share of carbon, thus drastically reducing gas emissions which increase the heat of the atmosphere,
whereas the other notes that the increase in the use of natural gas suppresses the promising renewable
options such as the energy of wind and sun.
Changes in the energy dynamics have led to the carbon dioxide emissions being the lowest since the early
1999s. Therefore, a key question has become the following one: should the policy creators continue to
operate on the natural gas market or address the more frequent, renewable options. The fact is that both
types of energy products are in the focus of the world trade.
“The idea of natural gas as a transitory fuel to renewable sources is uncommon”, said the executive director
of the company Total SA at the World Gas Conference in Washington, to which the directors of Conoco
Phillips, BP, Equinor ASA and Qatar Petroleum agreed. The economic forces will encourage the natural gas
industry, which will also open job positions and increase wealth; in addition, this will help to reduce the gas
emissions with greenhouse effect. However, this progress must not be more important than the new and
cleaner technologies within renewable sources which also have support in political circles. In the
foreseeable future, energy products will share space and increase its importance.
Macroeconomic Trends
The International Monetary Fund continues to warn that the trade war between the US and China will make
the world “poorer and more dangerous”. It has decreased the estimates of the global economy growth for
the years 2018 and 2019, because the trade tensions and introduction of import tariffs are damaging trade
whereas, on the other hand, developing countries are facing capital outflowing.
According to the most recent report of the IMF, the global economy will grow at a rate of 3.7% in 2018 and
2019, which is lower in comparison to the previous estimate of growth of 3.9% for both years.
The latest estimates show that strong economic growth, partly encouraged by tax reduction in the USA and
a growing demand for import, begins to diminish.
The decline in projection is the consequence of a series of factors, such as: introduction of import tariffs
between the USA and China, poorer performance of the Eurozone economy, Japan and Great Britain, as
well as growing interest rates that exert pressure on some developing countries, thus causing the capital
outflow, especially in Argentina, Brazil, Turkey and South African Republic.
“Previous estimates now look ‘too optimistic’, bearing in mind that the risks resulting from “further
disruptions in trade policy” are becoming increasingly noticeable”, said the head economist of the IMF..
According to the Fund’s estimate, since the consequences of the American-Chinese tariff war will be felt
the next year, that international financial institution has reduced the estimate of the US economy’s growth
for 2019 to 2.5% from the previous 2.7%, while it cut the projection of China’s growth from 6.4% down to
6.2%.

Quarterly Report for 2018 Third Quarter
19
Serbia
The positive trend in the economic activities in Serbia continued in the first nine months of 2018. Serbia is
characterized by growing economy with low inflation rate, elimination of fiscal deficit, decline in public
debt, decrease in external imbalance and recovery of labor market. An improved structural competitiveness
has contributed to better overall macroeconomic results.
GDP has significantly exceeded expectations in the first half of the year, by a 4.9% increase (the highest
growth in the last decade) which is driven by high growth of private and state investment, and also
encouraged by consumption and double-digit export growth.
As a result of strong investment activity and recovery of labor market, the projection of GDP growth for this
year has been revised upwards from 3.5% to 4.0%. Despite the slowdown of the Euro zone, Serbia’s GDP
has accelerated the growth in the first half of 2018, as a result of domestic factors. From the aspect of
production, the growth is still diversified with a positive contribution of all sectors and contribution of
construction which is higher than expected. In addition to construction activities, the continuation of the
investment cycle is confirmed by other key indicators, such as import of equipment, inflow of foreign direct
investment (FDI) and trends in domestic sources of financing. High private and government investments,
double-digit growth of export and increased consumption will be the main promoters of GDP growth in the
following years. At this moment, the risks are asymmetrical upwards. The factors that will contribute to
sustainable medium-term growth include macroeconomic stability, better business environment (structural
reforms), investments in infrastructure and effects of previous monetary policy. Investment share in GDP
has been steadily increasing during the last 3 years and will exceed 22% in 2018. Preserved macroeconomic
stability, improvement of the total business environment, rising profitability, the process of EU accession
and external factors will act favorably on private investments in the following years. Economic growth, with
better tax collection efficiency, responsible public expenditure policy and reduction of public debt will allow
the Government to increase investments and additionally improve the country’s infrastructure.
Inflation recovered from the April minimum of 1.1% to 2.6% in August. It is driven by prices of food and
energy, and is expected to be on a similar level within a short time, with gradual nearing of the target by
2020. Inflation expectations are anchored around the central target value of 3.0%. Projection risks concern
trends in the international commodity and financial market and, to a certain degree, the growth of
regulated prices.
State budget in 2017 went into surplus (1.2% GDP) and this trend continued in the first half of 2018. (1.5%
GDP). Following a sharp decline in public debt in 2017, by more than 10% GDP, the decrease continued
from the beginning of 2018, so in the first half the public debt was below 60% GDP.
Macroeconomic stability with structural reforms created a more favorable environment for FDI which are
well diversified and contribute to export potential of the country. In the seven months of 2018, the net FDI
further increased (+0.3%) in comparison to the high level from 2017. The outflows are directed towards
export-oriented sectors. Within the processing industry, the highest outflows of FDI have been recorded in
automotive industry, production of basic metals, rubber and plastics, pharmaceutical and chemical
products. These have led to positive trends in the field of employment, production and export of the
processing industry. Coverage of the current deficit with FDI is 120.7%. Correction of the business
environment is confirmed on the Doing Business List. From 91st position, (2015), Serbia moved to 47th
(2017), and then to 43rd position (2018).

NIS Group
20
From April to September of the current year, the NBS12 kept the reference rate at 3%, taking into account
the expected inflation trends and its factors in the upcoming period, as well as the effects of the recent
mitigation of the monetary policy. Due to the uncertainty on international commodity and financial market,
the expected continuation of restrictions of the FED policy, the completion of the quantitative program of
the ECB, and the existing geopolitical and trade tensions, caution is advised in the conduct of monetary
policy. The resistance of our economy to possible negative effects from international environment is
increased thanks to better macroeconomic indicators and more favorable outlooks for the upcoming
period.
Average USD/RSD exchange rate in the first nine months of 2018 was down RSD 11.01, a decrease of 10% on the average exchange rate in the same period of 2017.
In the first nine months of 2018, the USD/RSD exchange rate rose by 2.57 RSD (3%).
During the first nine months of 2017, the USD/RSD exchange rate fell by RSD 15.81 (13%).
Chart No. 2: USD to RSD currency chart 13
12 NBS – National Bank of Serbia 13 Source: NBS
90
95
100
105
110
115
120
I II III IV V VI VII VIII IX
2017 Average 2017
2018 Average 2018-10%

Quarterly Report for 2018 Third Quarter
21
Performance Analysis
Market Share14
Consumption of motor fuels shows growth that is primarily generated by the growth of diesel fuel.
The following had a positive impact on diesel consumption: significantly more successful agricultural
season, infrastructure and construction works.
LPG consumption is decreasing due to high prices and changing the structure of the vehicle fleet. The rise
in gasoline is lower than expected due to high prices..
Serbian Market Share
Total consumption of petroleum products has a positive growth trend. The following contributed to the
aforementioned:
• growth in consumption of bitumen and coke • construction and road industry as the main driver of diesel consumption • good agricultural season
The share of NIS on the total market for petroleum products was increased due to the rise in the share of primary gasoline, diesel, liquid gas and bitumen sales.
NIS's participation in the retail market is stable. Numerous marketing projects, the expansion of fuel
portfolios and the improvement of the concept of loyalty have contributed to the preservation of high
participation.
The retail market has grown slightly.
Consumption of diesel is on the rise, while the reduction in LPG and gasoline consumption is related to price
growth and the change in the structure of the fleet of the Republic of Serbia.
14 Data sources for projections: For Serbia – Sales and Distribution internal analyses and estimates; for Bulgaria and Romania consumption
estimates – PFC and Eurostat; For Bosnia and Herzegovina – PFC and internal estimates. 15 Data for 2018 is based on estimates. 16 The sales of NIS and other competitors include motor fuels (gas, motor fuels, diesel and EL fuel oil used as motor fuel). LPG cylinders are
not included. Data for 2018 is based on estimates.
Chart No. 3: Serbian petroleum product market volume15, in thousand tonnes
Chart No. 4: Serbian motor fuel market volume16, in thousand tonnes
1,911.2(73%)
2,018(75%)
719.4(27%)
682(25%)
2,631
2,701
9M 2017
9M 2018
NIS Others
+2.7%
527(43%)
545(43%)
703(57%)
718(57%)
1,230
1,263
9M 2017
9M 2018
NIS Others
+2.7%

NIS Group
22
Market Share in Bosnia and Herzegovina, Bulgaria and Romania
Bosnia and Herzegovina
The damage in the port of Ploce, which happened after the STI Poplar tank ("Petrol terminals" in Ploce
belongs to the FB&H) had a strong impact on the supply of the B&H market. We are currently searching for
an urgent solution to put the oil terminal into operation.
"Hifa Petrol" opened a gas station in Banja Luka, which makes this network, as well as certain networks
from Republic of Srpska, improve the level of national coverage of B&H.
Fuel prices in BiH, albeit being the lowest in the region, have grown partly due to the introduction of
additional excise duties, and partly because of the rise in oil prices on the world market.
NIS has 37 petrol stations in Bosnia and Herzegovina.
NIS’s market share in the total motor fuel market is 14.4%, with a retail market share of 10.0%.
Bulgaria
Bulgaria adopted the Law on Administrative Regulation of Economic Activities Related to Oil and Petroleum
Products, introducing a collateral of BGN 500,000 for the wholesale of oil and oil products. The same
amount of collateral is also valid for storing fuel outside the tax warehouses.
The Competition Protection Committee (CPC) has penalized the BS "Tradenet Varna" chain for unfairly
attracting clients. The sanction is 0.1% of the total turnover in 2017, i.e. about BGN 175,000, was imposed
due to the sale of fuel in retail and wholesale at prices lower than the cost of production.
NIS has 35 petrol stations in Bulgaria.
NIS’s market share in the total motor fuel market is 6.0%, with a retail market share of 4.6%.
Romania
Romania adopted the draft of "Offshore" law with amendments. One of the most important amendments
shows that current fees will be charged for the production of oil in the Black Sea during the entire duration
of the oil agreements.
Austrian "OMV" invests EUR 1 billion to start production of oil and gas in the Neptune block in the Black
Sea.
"OMV Petrom" started production on the new Black Sea platform from the "Lebăda Vest" site, with a daily
production of 1,000 barrel oil equivalents. The investment is worth about 30 million.
The Swiss Clariant Group officially started the construction of a large plant for the production of cellulosic
ethanol produced from agricultural residues in Craiova. The investment is worth more than EUR 100 million.
It's the first sunliquid facility of this company.
The Competition Council in Romania will launch a tender for the development of Price Monitor price
comparison, which will include data on motor fuels. The online platform will show prices of all types of fuel
(gasoline and diesel) in the networks of OMV, Petrom, Rompetrol, Mol, Lukoil, Socar and Gazprom across
the country.
NIS has 18 petrol stations in Romania.
NIS’s market share in the total motor fuel market is 0.8%, with a retail market share of 1.2%.

Quarterly Report for 2018 Third Quarter
23
Key Performance Indicators
Q3 2018 Q3 2017 ∆17 Indicator Unit 9M 2018 9M 2017 ∆18
74.3 51.4 +45% Urals RCMB $/bbl 70.7 50.8 +39%
86.3 60.4 +43% Sales revenue19 RSD
billion 206.8 167.8 +23%
10.2 7.7 +33% Net profit RSD
billion 21.7 20.1 +8%
18.1 11.7 +54% EBITDA20 RSD
billion 42.0 34.3 +23%
23.3 20.0 +16% OCF RSD
billion 32.7 38.9 -16%
10.1 6.7 +51% CAPEX21 RSD
billion 27.3 16.6 +64%
51.31 44,45 +15% Accrued liabilities for taxes and other public revenue22
RSD billion
142.26 122.3823 +16%
657.7 671 -2% Total debt to banks24 USD
million 657.7 671 -2%
2.10 1.65 +27% LTIF25 number 2.10 1.65 +27%
17 Any deviations in percentages and aggregate values result from rounding. The change percentages shown are obtained from values not
rounded to RSD billion. 18 Any deviations in percentages and aggregate values result from rounding. The change percentages shown are obtained from values not
rounded to RSD billion. 19 Consolidated operating income. 20 EBITDA = Sales revenues (exclusive of excise duties) – costs of inventories (oil, petroleum products and other products) – Operating
Expenses (OPEX) – other costs that may be controlled by the management. 21 CAPEX amounts are exclusive of VAT. 22 Taxes, fees, charges and other public revenue calculated for the reporting period. The overview is inclusive of the liabilities of NIS for taxes
and other public revenue in Serbia and other countries of operation. 23 This data has been corrected in accordance with Note No. 70 on the page 41 24 Total debt to banks =Total debt to banks + Letters of Credit. As at 30 September 2018, this was $654.5million of total debt to banks +3.2
million USD under Letter of credit. 25 Lost Time Injury Frequency – Ratio of employee injuries with sick leaves to the total number of working hours multiplied by one million.
The indicator shown refers to NIS j.s.c. Novi Sad with its subsidiaries: Naftagas – Naftni servisi d.o.o. Novi Sad, Naftagas – Tehnički servisi
d.o.o. Zrenjanin and Naftagas – Transport d.o.o. Novi Sad. The specified indicator is calculated cumulatively, from the beginning of the year,
and the indicated data represent the current status as of 30,Septembaer, hence there is no difference between 9M and Q3

NIS Group
24
Operating Indicators
Exploration and Production
Q3 2018 Q3 2017 ∆26 Indicator Unit 9М 2018 9М 2017 ∆27
338 352 -4% Oil and gas output28 Thousand
t.o.e. 999 1,044 -4%
225 229 -2% Domestic oil output29 Thousand
tonnes 663 675 -2%
0.73 1.49 -51% LTIF30 number 0.73 1.49 -51%
10.6 6.4 +66% EBITDA RSD billion 27.7 20.8 +33%
5.0 4.4 +14% CAPEX31 RSD billion 13.2 11.4 +16%
The main task of the Exploration and Production Block in the third quarter of 2018s was to meet its
hydrocarbon production plan, implement projects and improve the efficiency of geological research and
increase production and technological efficiency by implementing operational efficiency increase
measures.
For 2018, Exploration and Production plans to increase hydrocarbon reserves by 0.6%. The efficiency of
exploration and development drilling remained at the highest level in the last three years.
In geology and reservoir engineering, the focus was placed on improving the effectiveness of all geological
and technological activities, reducing the cost of operations and testing lower-cost techniques aimed at
increasing oil output, and applying new technologies and innovative solutions.
Exploratory Drilling and Well Testing
As part of geological research operations carried out by Exploration and Production, it is planned to
complete the drilling of 11 wells and to start drilling two exploratory wells slated for completion in 2019.
The exploration drilling candidates were approved at the Technical Session held at GPN level in February
and June 2018.
In February, the drilling of Majd-X-2 was completed, the well was tested and hydrodynamic well testing is
currently under way. Two wells Is-X-7 and Is-X-2 were drilled at the Idjos structure, the wells are in the
testing phase. The drilling of wells Kiz-X-3 and Lo-X-2 was finished in May, the wells are being tested in
production. The drilling of well Čes-1X was finished in June, the well is operational. The drilling of Km-X-2
and Pć-1X and testing of Itj-1X is under way. By realizing the drilling project and testing the well Km-X-2,
commercial amounts of highly-viscose oil are expected. Due to the specific characteristics of the project,
the realization is planned in two phases. The second phase includes the drilling of a horizontal canal and
the implementation of multi-frac aimed at increasing the utilization coefficient. Until the end of the year,
the drilling of Ve-1X, Sir-24X and the initiation of drilling Majd-X-3 and Bra-Malj-1X are planned.
26 Any deviations in percentages and aggregate values result from rounding. The change percentages shown are obtained from values not
rounded to RSD billion. 27 Any deviations in percentages and aggregate values result from rounding. The change percentages shown are obtained from values not
rounded to RSD billion. 28Domestic oil output includes natural gasoline, whereas gas output takes into account commercial gas output and light condensate. 29 With natural gasoline. 30 Lost Time Injury Frequency Ratio of employee injuries with sick leaves to the total number of working hours multiplied by one million. The
specified indicator is calculated cumulatively, from the beginning of the year, and the indicated data represent the current status as of 30
September, hence there is no difference between 9M and Q3 31 Financing, exclusive of VAT.

Quarterly Report for 2018 Third Quarter
25
3D Seismic Surveys
The acquisition for the South Banat II project was finished in May, 707 km2 were recorded. The acquisition
of 3D seismic data in the area of Turija IV was initiated in June, 435km2, or 60.13% of the total project
scope, were done by 01/10/2018, a total of 723 km2 is planned to be realized by the end of the year in this
area.
The processing of 3D seismic data collected in the research area of South Banat II (707 km2) is under way.
The seismologic interpretation of 3D data collected in the research areas of South Banat I (755 km2) and
Turija III (505 km2) was finalized and defended in GPN Block Exploration and Production while the
interpretation of data from the research area Morovic (301 km2) is in its final stage.
Foreign Projects
The liquidation of three wells was finished in Hungary, in the research block Kiskunhalas, the re-cultivation
of land was initiated, and the return of the research license is planned.
In Romania, the drilling of well BVS-1000 in under way in block EX-7. The drilling of well Teremia-1001 was
initiated. The process of obtaining permits for exploratory drilling at two locations in two blocks.. The work
on obtaining permits for seismic exploratory works is continued. In addition, the design and manufacture
works for mobile complexes for oil and gas preparation are under way, within projects for oil and gas test
production in the Teremia and Jimbolia fields.
In Bosnia and Herzegovina, Block 2 in Eastern Herzegovina, the preparation for geological-exploratory works
for the period 2019-2020 is currently ongoing.
Operating Indicators
A total of 999 thousand tonnes of oil and gas equivalent was produced in the first nine months of 2018,
which is 4% less than the first 9M last year.
Chart No. 5: Oil and gas output, thousand t.o.e.
675
662,7
337
313
32
23,6
1,044
999
9M 2017
9M 2018
Domestic oil Domestic gas
Angola-4%
229
225
217
221
225
113
109
104
103
105
10
8
8
8
8
352
341
329
332
338
Q3 2017
Q4 2017
Q1 2018
Q2 2018
Q3 2018
Domestic oil Domestic gas
Angola-4%

NIS Group
26
Services
Q3 2018 Q3 2017 ∆32 Indicator Unit 9M 2018 9M 2017 ∆33
15 17 -12% Completed wells Number of wells 49 48 +2%
3.65 3.26 +12% LTIF34 % 3.65 3.26 +12%
0.3 0.6 -38% EBITDA RSD billion 1.0 1.9 -45%
0.2 0.1 +144% CAPEX35 RSD billion 0.4 0.3 +46%
In the first nine months of 2018, Services drilled 42 development wells and 7 exploratory wells. The South
Banat II 3D seismic project was successfully completed and works started on the Turija IV project in Serbia.
2018 saw a continued presence in the EU market,,the production of the 3D seismic survey and the drilling
of two exploratory wells were initiated over nine months in Romania. In the first nine months, Services
successfully continued with delivering services to Sales and Distribution, finishing the reconstruction project
for Bagrdan-Jagodina, Subotica 1 and Lazarevac filling stations.
Oilfield Services
In the first nine months in 2018, Naftagas - Naftni Servisi d.o.o. performed with six drilling rigs on average.
The drilling of 49 wells was completed for Exploration and Production. With respect to technologically
challenging wells, Маjd-x-2, Lо-x-2, Кiz-x-3, Itј-1x.were successfully completed. Two drilling units (units К-1
and Н-3) were engaged in drilling exploration wells in Romania. The implementation of the Technical Limits
Strategy continued with the aim of increasing the drilling rate and efficiency of the process.
Workover Unit performed with an average of 14 workover rigs, completing workover services at 364 wells
in the first nine months this year. In the given third quarter, the workover and exploitation of eight newly
32 Any deviations in percentages and aggregate values result from rounding. The change percentages shown are obtained from values not
rounded to RSD billion. 33 Any deviations in percentages and aggregate values result from rounding. The change percentages shown are obtained from values not
rounded to RSD billion. 34 Lost Time Injury Frequency – Ratio of employee injuries with sick leaves to the total number of working hours multiplied by one million.
The indicator shown refers to NIS j.s.c. Novi Sad with its subsidiaries: Naftagas – Naftni servisi d.o.o. Novi Sad, Naftagas – Tehnički servisi
d.o.o. Zrenjanin and Naftagas – Transport d.o.o. Novi Sad. The specified indicator is calculated cumulatively, from the beginning of the year,
and the indicated data represent the current status as of 30 Septembaer, hence there is no difference between 9M and Q3. 35 Financing, exclusive of VAT.
Chart No.6: Number of completed wells
48
49
9M 2017
9M 2018
+2%
17
13
16
18
15
Q2 2017
Q3 2017
Q1 2018
Q2 2018
Q3 2018
-12%

Quarterly Report for 2018 Third Quarter
27
drilled wells were performed. The project for procuring HRH (hydraulic rotary head) is in the final stage of
realization.
Well Services Unit performed 5,254 operations, while Cementing performed 1,201 operations. The JE116
well were washed by means of coiled tubing and SpinCat tool.
During the first nine months of 2018, 828.86 km2 of 3D seismic surveys were recorded in Serbia for projects
“South Banat 2” and “Turija 4” Over the same period, the 102.15 km 2D seismic survey project “Valcani”
was finished and a 3D seismic survey project is under way in block “EX-3”, where 199.35 km2 were covered.
Technical Services
In the first nine months of 2018, Naftagas – Tehnički servisi d.o.o. Zrenjanin completed the reconstruction
of Bagrdan-Jagodina, Subotica 1 and Lazarevac stations. Equipment repair services were provided to
Naftagas-Naftni servisi d.o.o. Novi Sad and Exploration and Production purposes, and the operations of
overhaul and rebranding for 25 sucker rods, including preventive maintenance of electrical installations and
devices.
During August and September, the overhaul was done at Oil Refinery Pancevo, the overhaul of units S-200
(Visbreaking) and S-2400 (HDS) was completed.
Transport
In support to the activities of all Blocks, Naftagas - Transport d.o.o. Novi Sad provided passenger, freight,
special-purpose, and bus transportation services. The distance travelled in the first nine months of 2018
totalled 20.71 million kilometres.
In early 2018, Naftagas-Transport d.o.o. Novi Sad was certified for public and international transportation
against amended legislation of the Republic of Serbia. So far, 33 transport rounds for the equipment and
tools of the NFS Drilling Department to the construction site in Romania were realized, which amounts to
13,874 kilometers in international transport.
Refining
Q3 2018 Q3 2017 ∆36 Indicator Unit of
measure 9M 2018 9M 2017 ∆37
1,073 968 +11% Volume of refining of crude oil and semi-finished products
Thousand tonnes
2,769 2,613 +6%
0,00 0,83 - LTIF38 % 0,00 0,83 -100%
4.4 4.5 -2% EBITDA39 RSD billion 11.02 9.5 +16%
4.4 1.5 x2 CAPEX40 RSD billion 10.9 3.6 x2
For the first nine months of 2018, Refining’s EBITDA amounted to RSD 11.02 billion. Effects from the
efficiency increase programme on EBITDA were RSD 0.7 billion.
36 Any deviations in percentages and aggregate values result from rounding. The change percentages shown are obtained from values not
rounded to RSD billion. 37 Any deviations in percentages and aggregate values result from rounding. The change percentages shown are obtained from values not
rounded to RSD billion. 38 Lost Time Injury Frequency – Ratio of employee injuries with sick leaves to the total number of working hours multiplied by one million.
The specified indicator is calculated cumulatively, from the beginning of the year, and the indicated data represent the current status as of
30,Septembaer, hence there is no difference between 9M and Q3 39 EBITDA of the Refining Block includes the Energy Plant at the Pančevo Refinery, which is eliminated at a consolidated level as the effect of
the Energy Plant is also included in the Energy Block’s EBITDA. 40 Financing, exclusive of VAT.

NIS Group
28
In the first quarter of 2018, a revamp was carried out in February by applying the latest equipment cleaning
methods.
A new type of crude oil, Iranian Heavy, began to be used testing in the refining process in May 2018. A
structure bearing two reactors was erected at the delayed coker unit construction site. It is the equipment
in which the coking processes will take place, which marks the fulfilment of one of the milestones in this
investment project. A contractor was selected for furnace installation and for the installation of electrical
equipment and instrumentation.
The concrete foundation for the coke silos has been installed. The schedule of the DCU Project is getting
busier, especially regarding construction, concrete and mechanical works, implying an increased number of
employees at the construction site.
Refining Activities and Volume
For the nine months of 2018, the production of petroleum products increased by 6% compared to the same
period of the previous year as a result of market demands (diesel, jet fuel, virgin naphtha, bitumen).
A new gas ejector was put into operation at the vacuum distillation plant. The APC system (Advanced
Process Control) was implemented at the hydrocracking unit.
A burner at the vacuum distillation plant was replaced.
The procedure for extension of the certification scope to include new road bitumen „EB 35/50“, which NIS
intends to place in the European market, has been completed.
Bottom of the Barrel Project
P&ID documents prepared for S-2550, S4300 and S4450. The status “for the execution of works” marked
the end of the installation of the S-9150 cooling tower. The construction of foundations for spherical tanks
in Block 16 completed and their installation started. A steel-concrete structure constructed for coke silos.
The construction of the foundations for Transfer Towers 2 and 4 of the coke transfer system completed and
installation of the steel structure for Transfer Tower 3 started.
The final acceptance of the construction works for MEROX S-2550 and S-4300 (MHC/DHT) units finished
and pile driving started. The installation of the main steel structure of the top platform of the pipe bridge
JA-5301 and the main structure of the compressor station completed. The installation of the steel structure
Chart No.7: Refining volume, thousand tonnes
652
659
1,768
1,901
192
209
2,613
2,769
9M 2017
9M 2018
Domestic oilImported oilSemi-finished products
+6%
218
227
221
212
226
676
692
485
628
788
73
73
81
70
58
967
993
786
909
1,073
Q3 2017
Q4 2017
Q1 2018
Q2 2018
Q3 2018
Domestic oilImported oilSemi-finished products
+11%

Quarterly Report for 2018 Third Quarter
29
for the cable bridge 23012A completed. The installation of the steel structure for the cable bridge JA-
23013A started as well as the installation of the steel structure for the purpose of reinforcing the pipe bridge
JA-23012. The mechanical works for the BA-5301 furnace completed as well as mechanical and installation
works for the FB-5301 and FB-5901 tanks. The internal elements of the columns installed. The installation
of the pipelines started at the pipe bridge ЈА-5301 and "B", "C", "D" and "E" structures as well as the
integration of the mounted equipment with the pipelines.
The installation of control panels, electrical and instrumental equipment started in the substation. 90% of
the electrical equipment installed.
Turnaround
January marked a revamp of the bitumen production plant and the reconstruction of the bitumen loading
system, without plant shutdown.
In mid-February 2018, a turnaround was conducted by applying the latest equipment cleaning methods.
During this scheduled shutdown, a section of the hydrogen unit process line was completely replaced, which
will result in a higher reliability of operation of this unit as well as other processing units. Furthermore, 14
heat exchangers and more than 20 air cooler sections were cleaned. Inspection and overhaul of four
columns were carried out and several process and technology modifications were made on process units in
order to increase the total efficiency of refining and improve operation during the summer period.
The scheduled turnaround was completed one day ahead of schedule in spite of adverse weather conditions
and all refinery units were back on-stream, with stable operation of all production plants.
The catalyst was replaced on the pyrolysis gasoline hydrodesulphurisation unit.
Revamp activities were also conducted at the secondary atmospheric distillation unit.
Revamp of Klaus (S-2450) and Visbreaking (S-200) units completed.
Regular maintenance of Diesel Dewaxing (S-2400) has started.
Supplier selection for procurement of 2019 turnaround services is in progress.
Other Projects
Implementation of the LOTO system (lock out tag out), to improve occupational safety.
The following investment projects were launched: Installation of On-Line Analysers for Measurement from
API Separator and Settling Pool Lines at RNP; Modernisation of Bitumen Loading/Unloading Installations for
Rail and Road Tanker Terminals at RNP; Application of Antireflective Coating on S-300 Furnace; Installation
of On-Line Analysers for Simulated Distillation and Cloud Point for Diesel Line from MHC/DHT; and
Modernization of Radio System at RNP.
The implementation of Digital Transformation was launched at Refining through projects for Operator
Training Simulators (OTS) and a machine learning project and operator support project (€kon$)
Feasibility study „Automated Fire Suppression and Cooling Systems for Old Units in Pančevo Oil Refinery“
developed.

NIS Group
30
The implementation phase under project „Reconstruction of Corrosion Protection System at the
Atmospheric Distillation Unit (S-2100) in Pančevo Oil Refinery“ approved at NIS Investment Committee
meeting.
Reconstruction of the dispatch building in Pančevo Oil Refinery finished.
As part of project traffic safety improvement at the road section at the entrance of Pančevo Oil Refinery,
works on horizontal and vertical signalling in front of Pančevo Oil Refinery completed in Spoljnostarčevačka
Street.
A career path project was implemented at Refining.
As part of the OMS program, management of Refining trained in regular management practices.
Sales and Distribution
Q3 2018 Q3 2017 ∆41 Indicator Unit of
measure 9M 2018 9M 2017 ∆42
1,076 958 +12% Total volume of petroleum product sales43
Thousand tonnes
2,741 2,503 +10%
104 88 +18% Sales volume–foreign assets44 Thousand
tonnes 266 233 +14%
787 709 +11% Volume of domestic petroleum product sales45
Thousand tonnes
2,045 1,911 +7%
697 599 +16% Motor fuels46 Thousand
tonnes 1,766 1,557 +13%
259 248 +5% Retail47 Thousand
tonnes 699 680 +3%
3.88 3.91 -1% Internal Sales Thousand
tonnes 12.22 11.39 +7%
1.93 1,20 +61% LTIF48 % 1.93 1,20 +61%
4.1 3.2 +29% EBITDA RSD billion 8.6 8.4 +3%
0.4 0.6 -21% CAPEX49 RSD billion 2,4 0.8 x2
Points of Sale50 and Logistics
NIS Group has over 400 active retail facilities. They are predominantly located in the Republic of Serbia (332
retail facilities). In addition to 10 internal petrol stations, NIS owns 322 public petrol stations (20 of which
are GAZPROM branded). In the countries of the region, NIS owns 37 petrol stations in Bosnia and
Herzegovina (27 in GAZPROM brand), 35 petrol stations in Bulgaria (all in GAZPROM brand) and 18 petrol
stations in Romania (all in GAZPROM brand).
41 Any potential deviations in percentages and aggregate values result from rounding. The change percentages shown have been obtained
on the basis of values not rounded to RSD billion. 42 Any potential deviations in percentages and aggregate values result from rounding. The change percentages shown have been obtained
on the basis of values not rounded to RSD billion. 43 Excluding the internal sales volume (9М 2018: thousand tonnes; 9М 2017: .thousand tonnes). 44 The sales volume of foreign assets includes sales generated by the subsidiaries of NIS abroad (retail and wholesale). 45 Domestic market sales includes sales volumes invoiced in local currency (RSD) and does not include sales volumes sold to foreign customers
and invoiced in foreign currency. 46 Total sales of motor fuels in Serbia and in foreign assets. 47 Total retail in Serbia and in foreign assets. 48 Lost Time Injury Frequency – Ratio of employee injuries with sick leaves to the total number of working hours multiplied by one million.
The specified indicator is calculated cumulatively, from the beginning of the year, and the indicated data represent the current status as of
30,Septembaer, hence there is no difference between 9M and Q3 49 Financing, exclusive of VAT. 50 As at 30 September 2018.

Quarterly Report for 2018 Third Quarter
31
In Serbia, three petrol stations were put into operation in the first nine months after rebranding: Bagrdan
(GAZPROM brand) and two petrol stations in Niš – 12. februar and Vojvode Mišića (one in GAZPROM and
the other one in NIS Petrol brand).In addition, after completion of works on total reconstruction, two more
petrol stations were opened in Serbia: ‘Subotica 1’ and ‘Lazarevac Grad’ (both in NIS brand).
Loyalty Programmes and Marketing
In the first nine months of 2018, over 85 marketing activities were carried out in Serbia with the aim of
developing consumer brands and loyalty programmes and improving fuel non-fuel sales. Additional
promotions to boost sales were run at the three new petrol stations.
The marketing campaign called ‘Instant Win’, with the biggest prize fund so far started this September. It
involves the use of the loyalty card: On the Road with Us, at all NIS Petrol and GAZPROM petrol stations
that have premium G-Drive fuels in their range of products. It has been estimated that 18,000 new users of
the loyalty card ‘On the Road with Us’ will be attracted.
Twenty three new products have been launched within our private label: G-Drive energy chewing gums -
Spearmint and Peppermint, G-Drive energy cherry, Drive Café oatmeal (4 flavors), G-Drive isotonic by Aqua
Viva (4 brands) and Drive Café bamboo jars (3 types), G-Drive energy candies (Spearmint and Peppermint),
6 types of Drive Café salads and 1 type of new Drive Café sandwich (with tuna and corn).
The loyalty programme called On the Road with Us was introduced in late 2015, with over 652 thousand
cards issued as at 30 September 2018 and a share of 56% in total sales to individuals in the third quarter of
2018.
A new payment function of the On the Road with Us card was introduced, allowing users to purchase fuel
and non-fuel products with 45 days deferred payment terms at all NIS Petrol- and GAZPROM-branded petrol
stations. Since the introduction of the new functionality, over 29,000 applications have been submitted and
over 23,000 approved.
2018 saw the continuation of the loyalty programme partnership with Tehnomanija, whereby holders of
the On the Road with Us card earn bonus points for each purchase. Bonus points can be redeemed
exclusively at NIS Petrol and GAZPROM petrol stations. In the third quarter, we started new promotional
activity in ‘Gigatron’ retail facilities, where holders of “On the Road with Us’ cards are given bonus points
for each purchasing transaction. Bonus points may be used only on NIS Petrol and GAZPROM petrol stations.
As at 30 September 2018, close to 75,731 cards were issued under the loyalty programme run in Bosnia and
Herzegovina, with the share of users of this programme in total sales to individuals reaching 46% in the
second quarter of 2018. As at 30 September 2018, over 116,338 cards were issued under the On the Road
with Us programme in Bulgaria. The share of users of this programme in total sales to individuals reached
60% in the third quarter of 2018.
The Agro Card programme, designed for farmers, was introduced in late 2013. As at 30 September 2018, a
total of 128,912 cards were issued. Efforts continued to retain the 2017 sales volume and to achieve the
level projected for 2018, and to reactivate the client base. A new product, Adblue, with pouring spout was
launched. A motivation programme was run for distributors in Serbia and the region. Another, now already
traditional, marketing campaign for promoting the NISOTEC brand called “My Car Loves NISOTEC” was also
implemented.

NIS Group
32
Operating Indicators51
The first nine months of 2018 saw an increase of 10% in sales volume compared to the first nine months of
2017, with total sales volume of 2,741 thousand tonnes.
Retail in Serbia – retail volume growth of 3% is a result of increased sales of diesel.
Wholesale in Serbia – growth of 8%, largely due to motor fuels.
Exports – growth of 20% due to growth in motor fuel exports.
Foreign assets – growth of 14% in sales volume (wholesale channel - 41%).
Chart No. 8: Volume of sales 52, thousand tonnes
Chart No. 9: Structure of sales 53,
thousand tonnes
51 Excluding internal sales volume (9М 2018: 12.22 thousand tonnes; 9M 2017: 11.39 thousand tonnes). 52 Excluding internal sales volume (9М 2018:12.22 thousand tonnes; 9М 2017: 11.39 thousand tonnes; Q3 2018: 3.88 thousand tonnes;
Q3 2017:3.91 thousand tonnes). 53 Excluding internal sales volume (9М 2018: 12.22 thousand tonnes;9М 2017: 11.39 thousand tonnes; Q3 2018:3.88 thousand tonnes;
Q3 2017: 3.91 thousand tonnes).
526
543
233
266
1,385
1,501
359
431
2,503
2,741
9M 2017
9M 2018
Retail - SerbiaForeign assetsWholesale - SerbiaExport
+10%
190
184
155
187
202
88
105
79
83
104
520
547
429
487
586
161
152
102
144
185
958
988
765
900
1,076
Q3 2017
Q4 2017
Q1 2018
Q2 2018
Q3 2018
Retail - SerbiaForeign assetsWholesale - SerbiaExport
+12%
517
529
1,986
2,212
2,503
2,741
9M 2017
9M 2018
Dark and other products
Light products and LPG +10%
202
219
131
182
215
756
769
634
718
860
958
988
765
900
1,076
Q3 2017
Q4 2017
Q1 2018
Q2 2018
Q3 2018
Darkand other products
Light products and LPG +12%
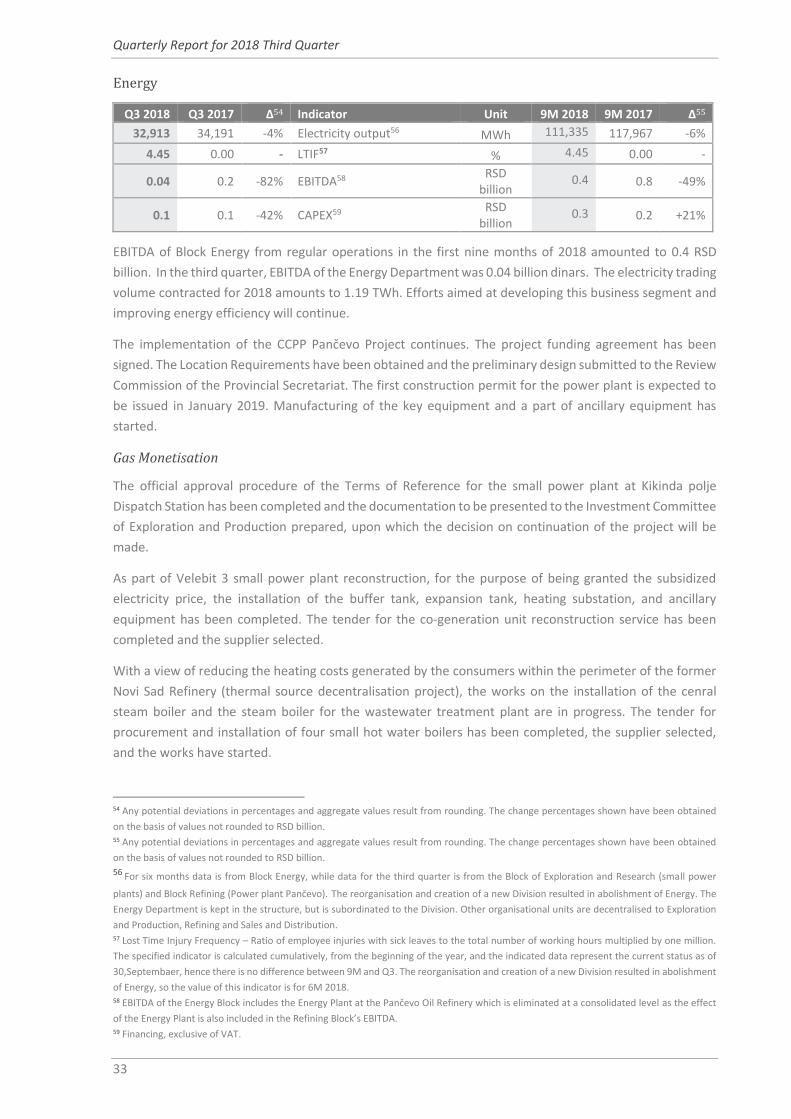
Quarterly Report for 2018 Third Quarter
33
Energy
Q3 2018 Q3 2017 ∆54 Indicator Unit 9M 2018 9M 2017 ∆55
32,913 34,191 -4% Electricity output56 MWh 111,335 117,967 -6%
4.45 0.00 - LTIF57 % 4.45 0.00 -
0.04 0.2 -82% EBITDA58 RSD
billion 0.4 0.8 -49%
0.1 0.1 -42% CAPEX59 RSD
billion 0.3 0.2 +21%
EBITDA of Block Energy from regular operations in the first nine months of 2018 amounted to 0.4 RSD
billion. In the third quarter, EBITDA of the Energy Department was 0.04 billion dinars. The electricity trading
volume contracted for 2018 amounts to 1.19 TWh. Efforts aimed at developing this business segment and
improving energy efficiency will continue.
The implementation of the CCPP Pančevo Project continues. The project funding agreement has been
signed. The Location Requirements have been obtained and the preliminary design submitted to the Review
Commission of the Provincial Secretariat. The first construction permit for the power plant is expected to
be issued in January 2019. Manufacturing of the key equipment and a part of ancillary equipment has
started.
Gas Monetisation
The official approval procedure of the Terms of Reference for the small power plant at Kikinda polje
Dispatch Station has been completed and the documentation to be presented to the Investment Committee
of Exploration and Production prepared, upon which the decision on continuation of the project will be
made.
As part of Velebit 3 small power plant reconstruction, for the purpose of being granted the subsidized
electricity price, the installation of the buffer tank, expansion tank, heating substation, and ancillary
equipment has been completed. The tender for the co-generation unit reconstruction service has been
completed and the supplier selected.
With a view of reducing the heating costs generated by the consumers within the perimeter of the former
Novi Sad Refinery (thermal source decentralisation project), the works on the installation of the cenral
steam boiler and the steam boiler for the wastewater treatment plant are in progress. The tender for
procurement and installation of four small hot water boilers has been completed, the supplier selected,
and the works have started.
54 Any potential deviations in percentages and aggregate values result from rounding. The change percentages shown have been obtained
on the basis of values not rounded to RSD billion. 55 Any potential deviations in percentages and aggregate values result from rounding. The change percentages shown have been obtained
on the basis of values not rounded to RSD billion.
56 For six months data is from Block Energy, while data for the third quarter is from the Block of Exploration and Research (small power
plants) and Block Refining (Power plant Pančevo). The reorganisation and creation of a new Division resulted in abolishment of Energy. The
Energy Department is kept in the structure, but is subordinated to the Division. Other organisational units are decentralised to Exploration
and Production, Refining and Sales and Distribution. 57 Lost Time Injury Frequency – Ratio of employee injuries with sick leaves to the total number of working hours multiplied by one million.
The specified indicator is calculated cumulatively, from the beginning of the year, and the indicated data represent the current status as of
30,Septembaer, hence there is no difference between 9M and Q3. The reorganisation and creation of a new Division resulted in abolishment
of Energy, so the value of this indicator is for 6M 2018. 58 EBITDA of the Energy Block includes the Energy Plant at the Pančevo Oil Refinery which is eliminated at a consolidated level as the effect
of the Energy Plant is also included in the Refining Block’s EBITDA. 59 Financing, exclusive of VAT.
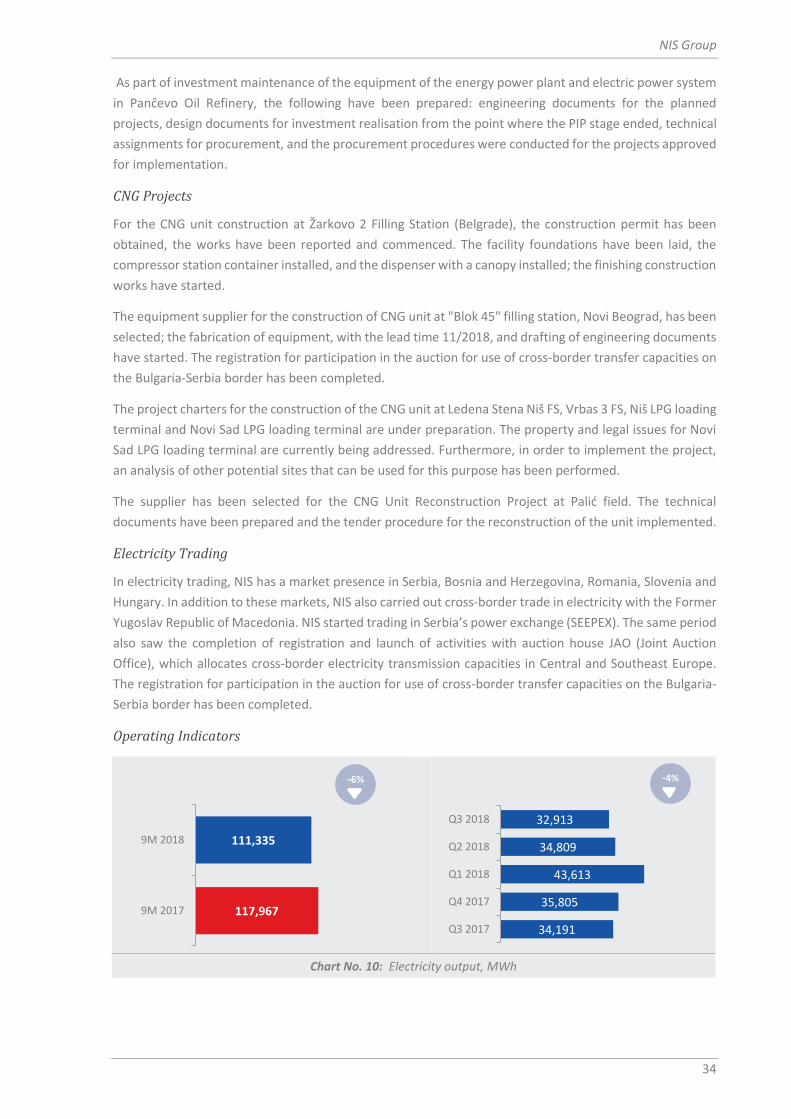
NIS Group
34
As part of investment maintenance of the equipment of the energy power plant and electric power system
in Pančevo Oil Refinery, the following have been prepared: engineering documents for the planned
projects, design documents for investment realisation from the point where the PIP stage ended, technical
assignments for procurement, and the procurement procedures were conducted for the projects approved
for implementation.
CNG Projects
For the CNG unit construction at Žarkovo 2 Filling Station (Belgrade), the construction permit has been
obtained, the works have been reported and commenced. The facility foundations have been laid, the
compressor station container installed, and the dispenser with a canopy installed; the finishing construction
works have started.
The equipment supplier for the construction of CNG unit at "Blok 45" filling station, Novi Beograd, has been
selected; the fabrication of equipment, with the lead time 11/2018, and drafting of engineering documents
have started. The registration for participation in the auction for use of cross-border transfer capacities on
the Bulgaria-Serbia border has been completed.
The project charters for the construction of the CNG unit at Ledena Stena Niš FS, Vrbas 3 FS, Niš LPG loading
terminal and Novi Sad LPG loading terminal are under preparation. The property and legal issues for Novi
Sad LPG loading terminal are currently being addressed. Furthermore, in order to implement the project,
an analysis of other potential sites that can be used for this purpose has been performed.
The supplier has been selected for the CNG Unit Reconstruction Project at Palić field. The technical
documents have been prepared and the tender procedure for the reconstruction of the unit implemented.
Electricity Trading
In electricity trading, NIS has a market presence in Serbia, Bosnia and Herzegovina, Romania, Slovenia and
Hungary. In addition to these markets, NIS also carried out cross-border trade in electricity with the Former
Yugoslav Republic of Macedonia. NIS started trading in Serbia’s power exchange (SEEPEX). The same period
also saw the completion of registration and launch of activities with auction house JAO (Joint Auction
Office), which allocates cross-border electricity transmission capacities in Central and Southeast Europe.
The registration for participation in the auction for use of cross-border transfer capacities on the Bulgaria-
Serbia border has been completed.
Operating Indicators
Chart No. 10: Electricity output, MWh
117,967
111,335
9M 2017
9M 2018
-6%
34,191
35,805
43,613
34,809
32,913
Q3 2017
Q4 2017
Q1 2018
Q2 2018
Q3 2018
-4%

Quarterly Report for 2018 Third Quarter
35
In the first nine months of 2018, total electricity output60 was 111,335 MWh. Production in the small-sized
power plants recorded a drop of 6% on the previous year due to reduced availability of gas from the
Sirakovo and Majdan fields. The production of electricity in the Pančevo Energy Plant is dependent on the
scope and structure of Refining’s steam demand. A total of 26.5 million m3 of non-commercial gas was used
to produce electricity at cogeneration units in the first nine months of 2018.
60 As of July 2018, power generation is within the competence of Exploration and Production (small power plants) and Refining (Pančevo Energy Power Plant).

NIS Group
36
Financial Indicators
Sales Revenues
During the first nine months of 2018, NIS recorded a year-over-year increase of 23% in sales revenue61. This
increase was achieved due to a greater sales volume, but also an increase in the retail prices of petrol and
diesel fuels prompted by a rise in crude oil prices globally.
Chart No. 11: Sales revenues62, RSD billion
EBITDA
EBITDA for first nine months of 2018 saw an increase of 23% on the previous year, totalling RSD 42 billion.
The main reasons include:
Impact of oil prices,
Sales volume increase
Chart No 12: EBITDA, RSD billion
61 Consolidated operating revenue. 62 Consolidated operating revenue.
167.8
206.8
9M 2017
9M 2018
+23%
60.4
66.9
52.5
68.0
86.3
Q3 2017
Q4 2017
Q1 2018
Q2 2018
Q3 2018
+43%
34.3
42.0
9M 2017
9M 2018
+23%
11.7
12.7
8.9
15.0
18.1
Q3 2017
Q4 2017
Q1 2018
Q2 2018
Q3 2018
+54%

Quarterly Report for 2018 Third Quarter
37
Net Profit
Net profit for the first nine months of 2018 was 21.7 RSD billion, a increase of 8% on the same period in
2017.
• Higher EBITDA • Higher depreciation costs • Lower financial expenses • Lower positive exchange rate differences
• Lower income tax
Chart No 13: Net profit, RSD billion
OCF
In the first nine months of 2018, operating cash flow amounted to 32.7 RSD billion, a drop of 16% on the
same period in 2017:
Increase in oil prices on the world market
In 2017. receivables from HIP have been fully collected
Higher liabilities for the import of crude oil.
Higher liabilities towards the state (taxes, excise duties)
Higher customs duties
Higher derivatives duties
Chart No 14: OCF, RSD billion
20.1
21.7
9M 2017
9M 2018
7.7
6.8
3.7
7.8
10.2
Q3 2017
Q4 2017
Q1 2018
Q2 2018
Q3 2018
+33%
38.9
32.7
9M 2017
9M 2018
20.0
20.1
4.6
4.8
23.3
Q3 2017
Q4 2017
Q1 2018
Q2 2018
Q3 2018
+16%-16%
+8%

NIS Group
38
CAPEX
In 2018, investments were mainly centred on the modernisation of refining processes. The largest
investments in Exploration and Production traditionally went to oil and gas production projects. A
substantial part of the investments was earmarked for retail network development projects in Sales and
Distribution. In addition, NIS invested into service projects modernization and a number of projects in the
corporate centre in the first nine months of 2018.
To fund the investments in the first nine months of 2018, a total of 27.3 RSD billion was allocated, 64%
more than in the same period in 2017. The increase in allocated funds on the previous year stemmed
directly from the launch of the refinery modernisation project (to increase the refining depth indicator).
Chart No. 15: CAPEX by type of project63, RSD billion Chart No. 16: Investments by segment
Organisational unit Major projects
Exploration and Production
Drilling of development wells Investments in geological and technical activities Investments in basic, development and gas infrastructure Programme for 3D seismic surveys and drilling of exploration wells in the
Republic of Serbia Investments in concession rights
Services
Projects for the Drilling Unit needs (procurement of BOP equipment) Projects of the Workover Unit (improvement of real-time well servicing and
workover monitoring system, procurement of protective equipment to increase workplace safety and HSE culture)
Implementation of projects for Cementing and Stimulation Technical services and transport projects
Refining
Refinery modernisation Investment maintenance at Refining Investments in environmental projects
63 Amounts given in RSD billion, excluding VAT.
0,40,1
14.223,4
2.2
3,30,01
16.6
27,3
9M 2017 9M 2018
48%
2%
38%
11%
1% 0,3%
Exploration and Production
Services
Refining
Sales and Distribution
Energy
Corporate Centre

Quarterly Report for 2018 Third Quarter
39
Efficiency increase projects
Sales and Distribution
Retail network development in Serbia Logistics projects (purchase of tank trucks, replacement of fuel dispensers) Other retail projects (introduction of the Drive Cafe concept at filling
stations)
Energy
Construction of Ostrovo gas gathering station Investment maintenance programme for Energy Reliability improvement projects (adaptation of low voltage units in the
substations)
Corporate Centre
Projects with IT component (purchase of software licenses)
Implementation of cSRM user environment for services (Material and Technical and Service Support and Capital Construction)
Across-the-board Digital Transformation programme
Indebtedness
Over the course of the first nine months of 2018, the debt to banks is approximately at the level of the debt
as of December 31st 2017, totalling USD 654.5 million, along with increased share of loans in EUR currency.
Additionally, debt to parent company Gazprom Neft PJSC also dropped and currently amounts to 220.9 EUR
million.
Despite sanction constraints, NIS successfully continued the second phase of its loan portfolio restructuring
in the first nine months of 2018. This is the first such restructuring under sanctions. Expected outcomes
include longer average portfolio maturity followed by a concurrent reduction in average borrowing costs.
In addition, owing to a tender conducted in December 2017 and in the first half of 2018, NIS selected its
key partner banks to provide over EUR 500 million in long-term financing sources for the implementation
of the second phase of restructuring with further optimisation of financing cost, all within the allowable
debt to EBITDA ratio band.
In this way, NIS will virtually release the free cash flow for due financing of major investment projects
(especially the strategically important Delayed Coker Unit Project and other planned investments) in the
period from 2018 to 2020.
Chart No. 17: Total bank debt trends with maturity structure, USD mn
Chart No. 18: Total bank debt structure, by currency, in %
278275
2847
27191153186
36
129
516336
418356
184507
511477
653623613646
793611
446403
455598
664662657
629625
654.5
31.12.'09
31.12.'10
31.12.'11
31.12.'12
31.12.'13
31.12.'14
31.12.'15
31.12.'16
31.12.'17
31.3.'18
30.6.'18
30.9.'18
up to 1 year
over 1 year -0.4%
67%74%
70%56%
75%85%
72%51%
28%18%10%0,6%
32%21%
25%26%
23%14%
27%48%
72%81%
89%99%
1%5%5%
18%2%1%1%1%0.5%0.50.5%0.4%
31.12.'09
31.12.'10
31.12.'11
31.12.'12
31.12.'13
31.12.'14
31.12.'15
31.12.'16
31.12.'17
31.3.'18
30.6.'18
30.9.'18
USDEUROther

NIS Group
40
Chart No. 19: Total bank indebtedness64, USD mn Chart No. 20: GPN loan, EUR mn
64 In addition to debt to banks from loans and Letters of Credit, NIS Group also holds issued bank guarantees in the amount of $32.0million,
corporate guarantees in the amount of $39.8million and Letters of Intent signed with banks in the amount of $0.2million and financial leasing
in the amount of $8.6million as at 30 September 2018.
23333
1314
3428
1234203
793611
446403
455598664662657629625654,5
1,026644
458418
489626
675666661
631625658
31.12.'09
31.12.'10
31.12.'11
31.12.'12
31.12.'13
31.12.'14
31.12.'15
31.12.'16
31.12.'17
31.3.'18
30.6.'18
30.9.'18
Letters of creditLoans -0.5%
61
210
466500488
442395
349302
256244
233221
31
.12
.'09
31
.12
.'10
31
.12
.'11
30
.09
.'12
31
.12
.'12
31
.12
.'13
31
.12
.'14
31
.12
.'15
31
.12
.'16
31
.12
.'17
31
.3.'1
8
30
.6.'1
8
30
.9.'1
9
-14%

Quarterly Report for 2018 Third Quarter
41
Taxes and Other Public Revenue65
Accrued liabilities for public revenue payable by NIS j.s.c. Novi Sad along with its subsidiaries deriving from
its organisational structure66 in Serbia totalled 126.79 RSD billion for the first nine months of 2018, an
increase of 18% on the same period in 2017.
The amount of accrued liabilities for public revenue payable by NIS Group for the first nine months of 2018
totalled 142.26 RSD billion, an increase of 16% on the same period in 2017.
NIS j.s.c. Novi Sad 9M 2018 9M 2017 ∆67
Social insurance contributions paid by employer 1.17 1.13 +3%
Corporate tax 3.03 2.85 +6%
Value-added tax 17.81 16.27 +9%
Excise duties68 96.18 78.32 +23%
Commodity reserves fee 4.63 4.37 +6%
Customs duties 0,56 0.55 +3%
Royalty 1.08 0.88 +24%
Other taxes 1.07 0.99 +8%
Total 125.54 105.37 +19%
NIS subsidiaries in Serbia 69
Social insurance contributions paid by employer 0.38 0.37 +5%
Corporate tax 0.09 0.21 -55%
Value-added tax 0.66 1.00 -33%
Excise duties 0.00 0.00 -
Customs duties 0.04 0.02 +92%
Royalty 0.00 0.00 -
Other taxes 0.06 0.06 +10%
Total 1.25 1.65 -24%
Total NIS j.s.c. Novi Sad with subsidiaries in Serbia 126.79 107.2 +18%
NIS regional subsidiaries and Angola
Social insurance contributions paid by employer 0.03 0.05 -41%
Corporate tax 0.13 1.94 -93%
Value-added tax 1.24 1.16 +7%
Excise duties 9.89 9.26 +7%
Customs duties 3.02 1.6470 +84%
Royalty 0.00 0.00 -
Other taxes 0.08 0.08 0%
Total 14.38 14.14 +1%
Deferred taxes (total for Group) 1.10 1.22 -10%
Total NIS Group 71 142.26 122..38 +16%
65 In RSD billion. 66 Naftagas – Naftni servisi d.o.o. Novi Sad, Naftagas – Tehnički servisi d.o.o. Zrenjanin, Naftagas – Transport d.o.o. Novi Sad and NTC NIS
Naftagas d.o.o. Novi Sad. 67 Any potential deviations in percentages and aggregate values result from rounding. The change percentages shown have been obtained
on the basis of values not rounded to RSD billion. 68 According to Serbian legislative excise tax is adjusted at the beginning of the year. 69 Naftagas – Naftni servisi d.o.o. Novi Sad, Naftagas – Tehnički servisi d.o.o. Zrenjanin, Naftagas – Transport d.o.o. Novi Sad and NTC NIS
Naftagas d.o.o. Novi Sad. 70This item shows exclusively the amount of customs liabilities, while earlier it indicated the entire amount of the customs debt inclusive of
taxes payable on import. 71 Including taxes and other liabilities for public revenues for subsidiaries in the region, corporate tax in Angola and deferred taxes.

NIS Group
42
Operational Efficiency Improvement
The effect of operational efficiency improvement measures on EBITDA for the first nine months of 2018
totalled 3.7 RSD billion.
Chart No. 21: Effect of operational efficiency improvement measures on EBITDA, RSD bn
2.0
0.7
0.90.4
0.3 0.1
4.3
0.8
3.7
5.1
Explorationand
Production
Services Refining Sales andDistribution
Energy CorporateCentre
NIS 2018 plan Perventeddamage
Total NIS2018 plan
6M 2018
Measures Pervented damage

Quarterly Report for 2018 Third Quarter
43
Securities
Share Capital Structure
NIS’ share capital totals RSD 81.53 billion and is split
into a total of 163,060,400 shares with a nominal value
of RSD 500.00. All issued shares are ordinary shares,
vesting their holders with the following rights:
Right to participate and vote at shareholders’ meetings, according to one-share-one vote rule; Right to dividend in compliance with applicable regulations; Right to participate in the distribution of liquidation remainder or bankrupt estate in compliance with the bankruptcy law; Pre-emption right to buy a new issue of ordinary shares and other financial instruments tradable for ordinary shares, out of new issue; Other rights in accordance with the Company Law and corporate documents.
The following table presents a list of top 10 shareholders with the largest stake in share capital:
Shareholder Number of
shares % in share capital
Gazprom Neft PJSC 91,565,887 56.15%
Republic of Serbia 48,712,094 29.87%
Societe Generale banka Srbija a.d. – custody account - fund 1,564,531 0.96%
Societe Generale banka Srbija a.d. – custody account - fund 597,407 0.37%
Global Macro Capital Opportunities 342,465 0.21%
Dunav Osiguranje a.d.o. Beograd 247,486 0.15%
Aktiv-fond d.o.o. Beograd 236,330 0.14%
Convest а.д. Нови Сад – збирни рачун 231,391 0.14%
AWLL Communications d.o.o. Beograd 227,352 0.14%
Keramika Jovanović d.o.o. Zrenjanin 203,824 0.12%
Other shareholders 19,131,633 11.73%
Total number of shareholders as at 30 September 2018: 2,093,697
Chart No. 22: Share Capital structure based on % in Share Capital
56%30%
14%
PJSC "Gazprom neft"
Republic of Serbia
Other shareholders

NIS Group
44
Share Trading and Indicators per Share
NIS j.s.c. Novi Sad shares are listed in the Prime Listing of the Belgrade Stock Exchange
Chart No. 23: Price and turnover trends
Overview of trading in NIS j.s.c. Novi Sad shares at Belgrade Stock Exchange in first nine months of 2018
Last price (28 September 2018) 679 RSD
High (29 January 2018) 750 RSD
Low (18 June 2018) 662 RSD
Total turnover 636,888,772 RSD
Total volume (number of shares) 896,826 shares
Total number of transactions 18,512 transactions
Market capitalization as at 30 September 2018 110,718,011,600 RSD
EPS 137.18 RSD
Consolidated EPS 133.24 RSD
P/E ratio 4.95
Consolidated P/E ratio 5.10
Book value as at 30 September 2018 1,560.1 RSD
Consolidated book value as at 30 September 2018 1,470.8 RSD
P/B ratio 0.43
Consolidated P/B ratio 0.46
In the first nine months of 2018, there were no acquisitions of treasury shares by the Company.
Dividends
NIS j.s.c. Novi Sad dividend policy is based on a balanced approach taking into account the necessity of
profit retention for investment funding purposes, the rate of return on invested capital and the amount for
dividend payment. The long-term dividend policy stipulates that a minimum of 15% of net profit is to be
paid to shareholders in dividends.
When deciding on profit distribution and dividend payment, the corporate management takes into account
a number of factors including financial standing, investment plans, loan repayment obligations,
macroeconomic environment and legislation. Each of these factors, either individually or combined, may
affect the proposed dividend payment if carrying sufficient weight.
640
650
660
670
680
690
700
710
720
730
740
0
1
2
3
03
.01
.
12
.01
.
23
.01
.
01
.02
.
12
.02
.
23
.02
.
06
.03
.
15
.03
.
26
.03
.
04
.04
.
17
.04
.
26
.04
.
09
.05
.
18
.05
.
29
.05
.
07
.06
.
18
.06
.
27
.06
.
06
.07
.
17
.07
.
26
.07
.
06
.08
.
15
.08
.
24
.08
.
04
.09
.
13
.09
.
24
.09
.
Turn
ove
rx
1,0
00
,00
0 R
SD
Turnover Price
Pri
ce
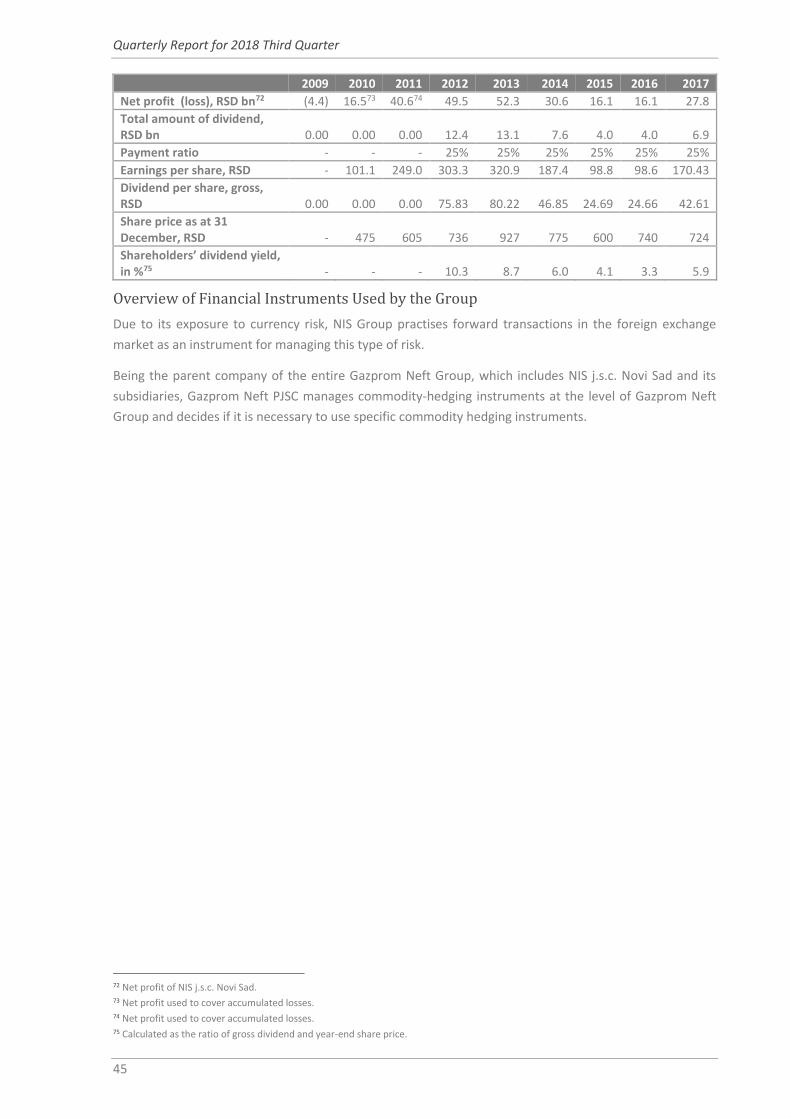
Quarterly Report for 2018 Third Quarter
45
2009 2010 2011 2012 2013 2014 2015 2016 2017
Net profit (loss), RSD bn72 (4.4) 16.573 40.674 49.5 52.3 30.6 16.1 16.1 27.8
Total amount of dividend, RSD bn 0.00 0.00 0.00 12.4 13.1 7.6 4.0 4.0 6.9
Payment ratio - - - 25% 25% 25% 25% 25% 25%
Earnings per share, RSD - 101.1 249.0 303.3 320.9 187.4 98.8 98.6 170.43
Dividend per share, gross, RSD 0.00 0.00 0.00 75.83 80.22 46.85 24.69 24.66 42.61
Share price as at 31 December, RSD - 475 605 736 927 775 600 740 724
Shareholders’ dividend yield, in %75 - - - 10.3 8.7 6.0 4.1 3.3 5.9
Overview of Financial Instruments Used by the Group
Due to its exposure to currency risk, NIS Group practises forward transactions in the foreign exchange
market as an instrument for managing this type of risk.
Being the parent company of the entire Gazprom Neft Group, which includes NIS j.s.c. Novi Sad and its
subsidiaries, Gazprom Neft PJSC manages commodity-hedging instruments at the level of Gazprom Neft
Group and decides if it is necessary to use specific commodity hedging instruments.
72 Net profit of NIS j.s.c. Novi Sad. 73 Net profit used to cover accumulated losses. 74 Net profit used to cover accumulated losses. 75 Calculated as the ratio of gross dividend and year-end share price.

NIS Group
46
Corporate Governance
Company’s Governance System
The central role in corporate governance is
performed by the Board of Directors, who are
collectively responsible for a long-term success
of the Company and the area of responsibility of
whom covers the setting of main business goals
and courses for further growth of the Company
and the determination and monitoring of the
implementation of the Company’s business
strategy.
The provisions of the Articles of Association fully
and clearly differentiate between the scope of
work of the Board of Directors and the scope of
work of the Shareholders’ Assembly, General
Director of the Company and the bodies set up
by corporate governance bodies.
Shareholders’ Assembly and Shareholders’ Rights
As the highest authority of the Company, the
Shareholders’ Assembly is made up of all
shareholders. All NIS j.s.c. Novi Sad shares are
ordinary shares that give their owners the same
rights, wherein one share carries one vote.
Board of Directors
The Board of Directors has a central role in
corporate governance. It is collectively
responsible for the long-term success of the
Company, for setting main business objectives
and identifying the company’s further courses of
development, as well as for identifying and
controlling the effectiveness of the corporate
business strategy.
The members elect the Chairperson of the Board
of Directors, while the functions of the Board of
Directors’ Chairperson and the General Director
are clearly divided.

Quarterly Report for 2018 Third Quarter
47
Members of the Board of Directors
The Board of Directors is appointed and dismissed by the Shareholders’ Assembly.
NIS’ 10th Annual General Meeting of 21 June 2018 appointed the following members of NIS Board of
Directors: Vadim Yakovlev, Kirill Tyurdenev, Danica Drašković, Alexey Yankevich, Sergei Papenko, Alexander
Krylov, Nikola Martinović, Wolfgang Ruttenstorfer, Anatoly Cherner and Olga Vysotskaia.
The Board of Directors consists of executive and non-executive directors. The Board of Directors has one
executive member while all the other members are non-executive, whereby two of the non-executive
directors are also independent members of the Board of Directors.
Members of the Board of Directors as of 30 September 2018
Vadim Yakovlev
Chairman of NIS j.s.c. Novi Sad Board of Directors
Deputy Chairman of the Executive Board of Gazprom Neft PJSC, First Deputy
CEO in charge of exploration and production, strategic planning and mergers
and acquisitions
Born in 1970.
In 1993, Mr Yakovlev graduated from the Moscow Engineering Physics
Institute, Department of Applied Nuclear Physics. Mr Yakovlev graduated
from the Faculty of Finance at the Moscow International University in 1995.
Since 1999, he has been a qualified member of the ACCA (the Association of
Chartered Certified Accountants). In 2009, he earned a degree from the British
Institute of Directors (IoD). During his employment with
PricewaterhouseCoopers from 1995 to 2000, Mr Yakovlev held various
positions, from Consultant to Audit Manager. In the period 2001 to 2002, he
served as Deputy Head of Finance and Economics Department, YUKOS EP
c.j.s.c. From 2003 to 2004, he was the CFO of Yugansk Neftegaz, NK Yukos.
From 2005 to 2006, Mr Yakovlev held the position of Deputy CEO in charge of
economics and finance at SIBUR-Russian Tyres.
From 2007 to 2010 he was Deputy CEO in charge of Economics and Finance at
Gazprom Neft PJSC. Since 2007, he has served as Deputy Chairman of the
Executive Board of Gazprom Neft PJSC. From 2010 to 2011, he was the CFO of
Gazprom Neft PJSC. Since 2011, he has served as the First Deputy CEO of
Gazprom Neft PJSC.
Mr Yakovlev was elected member of NIS j.s.c. Novi Sad Board of Directors on
10 February 2009. He was elected Chairman of NIS j.s.c. Novi Sad Board of
Directors on 31 July 2009.
Kirill Tyurdenev
Chief Executive Officer of NIS j.s.c. Novi Sad
Member of NIS j.s.c. Novi Sad Board of Directors
Born in 1977.
Graduated with honours from the School of International Relations
(Bachelor’s Degree with specialisation) and then obtained a Master’s Degree
in International Law (with specialisation) from the Moscow State Institute of
International Relations (MGIMO). Also obtained the degree of Master of Laws

NIS Group
48
(LLM) from the University of Manchester. Completed the executive education
programme at the international business school INSEAD and London Business
School. From 2000 to 2004, he worked for A.T. Kearney and Unilever. In 2004,
he joined McKinsey & Co. From 2007 to 2012, he worked as Deputy CEO for
Strategy and Corporate Development with SIBUR – Fertilisers. In 2012, he
joined JSFC Sistema as Executive Vice-President and Executive Board Member.
Before joining NIS, Mr Tyurdenev held the position of President and Chairman
of the Executive Board of United Petrochemical Company undergoing
acquisition by JSFC Sistema at the time, and Chairman of the Board of
Directors of Ufaorgsintez. In April 2016, he joined NIS for the position of First
Deputy CEO for Refining and Sales and Distribution. Mr Tyurdenev was
appointed CEO of NIS j.s.c. Novi Sad on 22 March 2017.
Mr Tyurdenev was elected member of NIS j.s.c. Novi Sad Board of Directors
on 8 December 2016.
Danica Drašković
Member of NIS j.s.c. Novi Sad Board of Directors
Born in 1945.
Graduated from the Faculty of Law, University of Belgrade, in 1968. From 1968
to 1990, she worked in finance in the banking sector, in law and commerce
within the economic sector, and as Belgrade City Magistrate. Ms Drašković is
the owner of publishing house Srpska Reč, founded in 1990. She has authored
three books written in the opinion journalism style.
Ms Danica Drašković was a member of NIS j.s.c. Novi Sad Board of Directors
from 1 April 2009 to 18 June 2013 and was re-elected on 30 June 2014.
Alexey Yankevich
Member of NIS j.s.c. Novi Sad Board of Directors
Deputy CEO for Economics and Finance at Gazprom Neft PJSC
Born in 1973.
Graduated from Saint-Petersburg State Electrical Engineering University (LETI)
in 1997, majoring in Optical Instruments and Systems. Graduated from the
LETI-Lovanium International School of Management in Saint-Petersburg. From
1998 to 2001, he was employed with consultancy firm CARANA. From 2001 to
2005, he served as Deputy Head of Planning, Budgeting and Controlling
Department at YUKOS RM o.j.s.c. (business unit responsible for logistics and
downstream operations). In 2004, he became a Certified Management
Accountant (CMA). From 2005 to 2007, he served as Deputy CFO at LLK-
International (production and sale of oils and special petroleum products; part
of the LUKOIL group). From 2007 to 2011, he held the post of Head of Planning
and Budgeting Department and of Head of Economics and Corporate Planning
Department at Gazprom Neft PJSC. Since August 2011, he has served as the
acting Deputy CEO for Economics and Finance at Gazprom Neft PJSC. Since
March 2012, he has served as a member of the Management Board of
Gazprom Neft PJSC and Deputy CEO of Gazprom Neft PJSC for Economics and
Finance.

Quarterly Report for 2018 Third Quarter
49
He was elected member of NIS j.s.c. Novi Sad Board of Directors on 18 June
2013.
Sergei Papenko
Member of NIS j.s.c. Novi Sad Board of Directors
Head of Business Efficiency and Management of Joint Ventures Department
of Gazprom Neft PJSC.
Born in 1973.
Graduated from the Kharkov State University in 1996 (in economic
cybernetics) and obtained the MBA degree from Hofstra University
(Hempstead, New York, USA) in 1999 in Finance&Banking.
From 1994 to 1996, he held the post of Kharkov Branch Manager with First
Ukrainian International Bank. From 1996 to 1998, he worked as a consultant
with TACIS Project and during 1998 as an auditor with
PricewaterhouseCoopers. From 2000 to 2007, he worked with the Moscow
branch of McKinsey and Company Inc. Russia, first as a consultant and then as
a junior partner. Since 2007, he has held the post of Head of Business
Efficiency and Management of Joint Ventures Department of Gazprom Neft
PJSC.
He was elected member of NIS j.s.c. Novi Sad Board of Directors on 21 June
2018.
Alexander Krylov
Member of NIS j.s.c. Novi Sad Board of Directors
Director of Regional Sales Department at Gazprom Neft PJSC
Born in 1971.
Graduated from LMU (Leningrad) in 1992 and the Faculty of Law of Saint
Petersburg State University in 2004 and earned an MBA degree from Moscow
International Business School MIRBIS in Strategic Management and
Entrepreneurship. From 1994 to 2005, he held managerial positions in the
field of real estate sales (Chief Executive Officer, Chairman) with the following
companies: Russian-Canadian SP Petrobild and c.j.s.c. Alpol. From 2005 to
2007, he was Deputy Head of Sales Department at Sibur Ltd. Since April 2007,
he has served as Head of Petroleum Product Supply Department, Head of
Regional Sales Department and Director of Regional Sales Department at
Gazprom Neft PJSC.
He was elected member of NIS j.s.c. Novi Sad Board of Directors on 29
November 2010.
Nikola Martinović
Member of NIS j.s.c. Novi Sad Board of Directors
Born in 1947.
Received his primary education in Feketić and secondary education in
Srbobran. He graduated from the Faculty of Economics in Subotica, where he
completed his master’s thesis titled Transformation of Tax System in Serbia by
Implementing VAT. From 1985 to 1990, he was at the helm of Subotica-based
company Solid and in the next two years, until 1992, he served as Assistant

NIS Group
50
Minister of the Interior of the Republic of Serbia. From 1992 to 2000, he held
the position of Assistant CEO of Naftna industrija Srbije in charge of finance
and of CEO of Naftagas Promet from 1996 to 2000. From 2005 to 31 August
2013, he worked as Special Advisor at NIS j.s.c. Novi Sad. From 1 September
to 15 December 2013, he served as Special Advisor to CEO of O Zone a.d.
Beograd, and from 15 December 2013 until retirement on 17 November 2014,
he performed the duties of Advisor to Director of NTC NIS Naftagas d.o.o. Novi
Sad. He has been a member of the Council of the Governor of the National
Bank of Serbia since 22 November 2011.
He was a member of the Board of Directors of Naftna industrija Srbije/NIS j.s.c.
Novi Sad from 2004 to 2008 and was re-elected on 10 February 2009.
Wolfgang Ruttenstorfer
Independent Member of NIS j.s.c. Novi Sad Board of Directors
Born in 1950.
Graduated from the Vienna University of Economics and Business in
Economics and Business Administration in 1976. Holds a PhD degree. In 1976,
he started his career in Austria-based OMV, where he joined Planning and
Control Department in 1985 and then took over responsibility for OMV
Group’s strategic development in 1989. After being appointed Marketing
Director in 1990, he became a member of the Executive Board in 1992 and
was in charge of finance and chemical products. He kept serving on OMV’s
Executive Board until early 1997, when he became Deputy Minister of
Finance. On 1 January 2000, he was re-appointed member of OMV’s Executive
Board in charge of finance until April 2002 and gas operations until December
2006. From 1 January 2002 to 31 March 2011, he was Chairman of the
Executive Board of OMV Group. Mr. Ruttenstorfer was or still is member of
the Board of Directors of companies including VIG, Roche, , Flughafen Wien AG,
RHI MAGNESITA NV,and Telekom Austria, CollPLant Holdings LLC and Erne
Fittings GmbH.
He was elected Independent Member of NIS j.s.c. Novi Sad Board of Directors
on 20 April 2012.

Quarterly Report for 2018 Third Quarter
51
Anatoly Cherner
Member of NIS j.s.c. Novi Sad Board of Directors
Deputy Chairman of the Executive Board, Deputy CEO for logistics, refining
and sales at Gazprom Neft PJSC
Born in 1954.
Graduated from Grozny Oil Institute in 1976, majoring in Oil and Gas Chemical
Engineering. From 1976 to 1993, he was employed with the Sheripov Grozny
Refinery, starting as an operator and climbing to the post of refinery director.
In 1996, he joined SlavNeft as Head of Oil and Petroleum Product Trading
Department and was later appointed Vice-Chairman of the company. In April
2006, he was appointed Vice-Chairman for Refining and Marketing at SibNeft
(Gazprom Neft JSC as of June 2006). In December 2007, he was appointed
Deputy CEO for logistics, refining and sales at Gazprom Neft PJSC.
Mr Cherner was elected member of NIS j.s.c. Novi Sad Board of Directors on
10 February 2009.
Olga Vysotskaia
Independent Member of NIS j.s.c. Novi Sad Board of Directors
Born in 1961.
Graduated cum laude from Leningrad State University’s Department of
Economic Cybernetics in 1984, with specialisation in economic mathematics.
Finished post-graduate studies in mathematical cybernetics at the Institute
of Social and Economic Studies of the USSR Academy of Science, Leningrad
division, in 1987.
She held the positions of Chair of the Board of Directors (BoD), CEO and
Director of various privately-owned companies from 1988 to 1995. From
1995 to 2003, she held various partner positions with KPMG in St Petersburg,
New York and Moscow. From 2003 to 2005, she was managing Internal Audit
Directorate of Yukos and then served as executive partner of
Deloitte&Touche from 2005 to 2008. From 2006 to 2013, she held the
positions of independent member of the BoD, Chair of the Audit Commission,
member of the Strategy Commission, member of the Remuneration
Commission of ЭМ-альянс and KIT Finance, and independent member of the
Audit Commission of Baltika PJSC. From 2012 to 2013, she was a partner in
PricewaterhouseCoopers (PwC) and from 2013 to 2014 independent
member of the BoD and Chair of the Audit Commission and Remuneration
Commission of NefteTransService CJSC.
She was elected member of NIS j.s.c. Novi Sad Board of Directors on 21 June
2018.

NIS Group
52
Total amount paid to Board of Directors members in the first nine months of 2018, net RSD
BoD Members 161,840,947
Membership in Other Companies’ Boards of Directors or Supervisory Boards
Vadim Yakovlev • Slavneft Open Joint Stock Company (Chairman of the BD)JSC SN-MNG
• LTD GPN Development (Chairman of BoD) • JSC Gazprom Neft-NNG (Chairman of BoD) • LTD Gazprom Neft-Hantos (Chairman of BoD) • LTD Gazprom Neft-NTC (Chairman of BoD) • LTD Gazprom Neft-Orenburg (Chairman of BoD) • LTD Gazprom Neft-Sahalin • Salim Petroleum Development N.V. (Supervisory Board
member) • LTD Gazprom Neft Shelf • Bazen Technological Center LLC • GPN-GEO LLC
Kirill Tyurdenev -
Alexey Yankevich • Slavneft Open Joint Stock Company JSC Gazprom Neft – Aero • LTD Gazprom Neft – SM • LTD Gazprom Neft Business-Service (Chairman of BoD) • Gazprom Neft Lubricants Italy SPA (Chairman of BoD) • LTD Gazprom Neft Marine Bunker • LTD Gazprom Neft Shelf
Sergey Papenko
• Slavneft Open Joint Stock Company JSC Artikgaz • JSC Evrotech-Yugra • CJSC Nortgas (Chairman of the BD) • LTD Slavneft-Krasnoyarskneftegaz • LTD Gazprom neft – Vostok • LTD Gazprom neft - Angara • Salym Petroleum Development N.V. (member of the SB) • LTD Gazprom Resource Nortgaz (CEO) • CJSC Messoyakhaneftegaz • JSC Tomskneft VNK (Chairman of the BD)

Quarterly Report for 2018 Third Quarter
53
Alexander Krylov • JSC Gazprom Neft-Novosibirsk (Chairman of the BoD) • PJSC Gazprom Neft-Tumen (Chairman of the BoD) 76 • JSC Gazprom Neft-Ural (Chairman of the BoD) • JSC Gazprom Neft-Yaroslavl (Chairman of the BoD) • ЈSC Gazprom Neft-Northwest (Chairman of the BoD) • LTD Gazprom Neft Asia (Chairman of the BoD) • LTD Gazprom Neft - Tajikistan (Chairman of the BoD) • LTD Gazprom Neft - Kazakhstan (Chairman of the BoD) • LTD Gazprom Neft - Centr (Chairman of the BoD) • JSC Gazprom Neft - Terminal (Chairman of the BoD) • LTD Gazprom Neft – Regional sales (Chairman of the BoD) • JSC Gazprom Neft – Transport (Chairman of the BoD) • LTD Gazprom Neft – Krasnoyarsk (Chairman of the BoD) • LTD Gazprom Neft – Corporate Sales (Chairman of the BoD) • LLC Gazprom Neft – Belnefteprodukt (Chairman of the BoD) • JSC Gazprom Neft – Alternativе Fuels (Chairman of the BoD) • LTD ITSK • LTD Gazprom Neft – Laboratory (Chairman of the BoD) • LTD “Gazprom Neft-Tumen” (Chairman of the BoD) • JSC Gazprom Neft-Novosibirsk (AZS) (Chairman of the BoD) • JSC Gazprom Neft-Novosibirsk (NB) (Chairman of the BoD) • Association Hockey Club Avangard (Chairman of the BoD)
Nikola Martinović • -
Danica Drašković • -
Wolfgang Ruttenstorfer • Flughafen Wien AG, Vienna (Member of the Supervisory Board)
• RHI MAGNESITA , NV Vienna (Member of BoD) • LTD CollPLant Holdings (Member of BoD) • “Erne Fittings“ GmbH (Member of the Supervisory Board)
Anatoly Cherner • Slavneft Open Joint Stock Company • JSC Gazprom Neft – ONPZ (Chairman of BoD) • JSC Slavneft – JANOS • JSC Gazprom Neft – MNPZ (Chairman of BoD) • JSC Gazprom Neft – Аero (Chairman of BoD) • JSC Saint-Petersburg International Mercantile Exchange • LTD Gazprom Neft – SM (Chairman of BoD) • LTD Gazprom Neft Marine Bunker (Chairman of BoD) • LTD Gazprom Neft – Logistics (Chairman of BoD) • JSC Mozirski NPZ • Gazprom Neft Lubricants Italy SPA • LTD Gazprom Neft - Catalytic Systems (Chairman of BoD) • LTD Automatica-Service (Chairman of BoD)
Olga Vysotskaia • Serebryanoe vremya non-profit organisation (Chair of the Supervisory Board, Director)
• LTD INK (independent member of the BoD, Chair of the Audit Commission)
• JSC SUEK (independent member of the BoD)
Number and Percentage of NIS j.s.c. Novi Sad Shares Owned by BoD Members
Name and surname Number of shares % in total number of shares
Nikola Martinović 224 0.0001%
76 The business company has been undergoing the liquidation process

NIS Group
54
Board of Directors Committees
With a view to ensuring efficient performance of duties, the Board of Directors have established three
standing committees (Audit Committee, Remuneration Committee and Nomination Committee) as its
advisory and expert bodies providing assistance in work, especially in considering issues within its area of
responsibility, in preparing and monitoring the enforcement of decisions and documents adopted, and in
providing expertise for the needs of the Board of Directors.
The mandate of the Audit Committee and the Compensation Committee in the previous term of office ran
until the date of the X Annual General Meeting NIS j.s.c Novi Sad, untill 21 June 2018and the Committees
had the following composition:
Audit Committee:
o Wolfgang Ruttenstorfer, Chairman, o Alexey Yankevich, member and o Nenad Mijailović, member.
Remuneration Committee:
o Stanislav Shekshnia, Chairman, o Anatoly Cherner, member and o Zoran Grujičić, member.
The Board of Directors shall appoint members of the Board of Directors Committees for the next mandate
and form other standing or ad hoc committees as needed to address issues relevant to the activities of the
Board of Directors.
Shareholders’ Assembly Board
The Shareholders’ Assembly Board for the Supervision of Operations and the Procedure for Reporting to
Shareholders (hereinafter the Shareholders’ Assembly Board) is a body of advisors and experts of the
Company’s Shareholders’ Assembly, providing assistance in its activities and consideration of issues within
its area of responsibility. Members of the Shareholders’ Assembly Board report to the Shareholders’
Assembly, which appoints them and relieves them of duty.

Quarterly Report for 2018 Third Quarter
55
Members of the Shareholders’ Assembly Board as at 30 September 2018
Nenad Mijailović
Chairman of the Shareholders’ Assembly Board for the Supervision of
Operations and Procedure for Reporting to Shareholders of NIS j.s.c. Novi
Sad
Born in 1980.
Graduated from the Faculty of Economics, University of Belgrade in 2003.
Obtained a Master’s Degree from the University of Lausanne, Switzerland in
2007. In 2010, he started his PhD studies at the Faculty of Economics,
University of Belgrade. In 2011, he obtained an international CFA licence in
finance. From 2003 to 2009, he worked as a finance and banking consultant
and manager in the following companies: Deloitte Belgrade, AVS Fund de
Compensation Geneve, JP Morgan London, and KBC Securities Corporate
Finance Belgrade. From December 2009 to August 2012, he served as Advisor
to the Minister of Economy and Regional Development, Department of
Economy and Privatisation. In August 2012, he was appointed Advisor to the
Minister of Finance of the Republic of Serbia; since August 2014 untill
September 2018, he has served as the State Secretary in the Ministry of
Finance of the Republic of Serbia. From September 2018, holds the position
of Finance Director in Galenika j.s.c. Belgrade. He served as a member of NIS
j.s.c. Novi Sad Board of Directors from 18 June 2013 to 30 June 2014.
He was appointed Chairman of the Shareholders’ Assembly Board for the
Supervision of Operations and Procedure for Reporting to Shareholders of NIS
j.s.c. Novi Sad on 30 June 2014.
Zoran Grujičić
Member of the Shareholders’ Assembly Board for the Supervision of
Operations and Procedure for Reporting to Shareholders of NIS j.s.c. Novi
Sad
Born in 1955.
Graduated from the Faculty of Mechanical Engineering, University of
Belgrade. From 1980 to 1994, he served as General Manager, Technical
Manager, Production Manager and Design Engineer in Heat Transfer
Appliances Plant Cer Čačak. From May 1994 to February 1998, he served as
Advisor to General Manager of Interkomerc, Belgrade. From February 1998 to
June 2004, he managed MNG Group d.o.o. Čačak. From June 2004 to February
2007, he managed trading company Agrostroj j.s.c. Čačak, then limited
partnership company Leonardo from Čačak, and Centar za puteve Vojvodine.
Since February 2007, he has been employed with NIS j.s.c. Novi Sad at the
positions of Deputy Director of Logistics Department of Jugopetrol; Head of
Čačak RC at Retail Department – Čačak Region; Retail Network Development
Manager at Development Department, Sales and Distribution. From 1 October
2012 to January 2016, he served as Advisor to Sales and Distribution Director
and in February 2016 he became Advisor to Director of External and
Governmental Relations. Since October 2017, he has served as Advisor to CEO.

NIS Group
56
He was appointed member of the Shareholders’ Assembly Board for the
Supervision of Operations and Procedure for Reporting to Shareholders of NIS
j.s.c. Novi Sad on 30 June 2014.
Alexey Urusov
Member of the Shareholders’ Assembly Board for the Supervision of
Operations and Procedure for Reporting to Shareholders of NIS j.s.c. Novi
Sad
Director of Economics and Corporate Planning Department at Gazprom Neft
PJSC
Born in 1974.
Graduated from the Tyumen State University (specialist in finance) and the
University of Wolverhampton in the United Kingdom (BA (Hons) Business
Administration). He holds a Master’s Degree in Sociology. From 2006 to 2008,
he served as executive vice-president for planning and performance
management at the Integra Group. From 2002 to 2006, he worked at TNK-VR.
From 2002 to 2003, he was a member of TNK BoD’s Group for Monitoring and
Control and in period from 2004 to 2006 worked as CFO at TNK-VR Ukraine.
From 2009 to 2012, he was employed with NIS j.s.c. Novi Sad as Chief Financial
Officer. Since 2012, he has served as Director of Economics and Corporate
Planning Department at Gazprom Neft PJSC.
He was appointed member of the Shareholders’ Assembly Board for the
Supervision of Operations and Procedure for Reporting to Shareholders of NIS
j.s.c. Novi Sad on 25 June 2012.
Total amount of fees paid to SAB members in the first nine months of 2018, net, in RSD
Members of SAB 12,551,536
Membership in Other Companies’ Boards of Directors or Supervisory Boards
Nenad Mijailović -
Zoran Grujičić -
Alexey Urusov • Gazprom Neft Marine Bunker Balkan S.A. (Member of BoD) • AS Baltic Marine Bunker (Member of BoD) • LTD Gazprom Neft – Catalytic Systems (Member of BoD) • LTD Gazprom Neft Energoservice (Member of BoD) • LTD Gazprom Neft Business Service (Member of BoD) • LTD ITSK (Member of BoD) • LTD Noyabrskneftegazsvyaz (Member of BoD)
Number and Percentage of NIS j.s.c. Novi Sad Shares Owned by SAB members
Name and surname Number of shares % in total number of shares
Nenad Mijailović 5 0.000003066%

Quarterly Report for 2018 Third Quarter
57
Chief Executive Officer
The Board of Directors appoints one of its executive members to serve as Chief Executive Officer. The Chief
Executive Officer coordinates the activities of executive members of the Board of Directors and organises
the Company’s operations. In addition, the Chief Executive Officer is responsible for day-to-day
management and is authorised to decide on matters outside the area of responsibility of the Shareholders’
Assembly and the Board of Directors. The Chief Executive Officer represents NIS in legal matters.
CEO Advisory Board
The CEO Advisory Board is an expert body assisting the Company CEO in his activities and in the
consideration of matters within his competence, stipulated by the Law, Articles of Association, and other
internal documents, for the purpose of making timely and efficient decisions on managing the Company’s
business operations. The composition of the Advisory Board is determined by the CEO’s Decision, and it
consists of the First Deputy CEO for Exploration and Production, First Deputy CEO – Director of Downstream
Division, Director of Refining, Director of Sales and Distribution, and Function Directors. In addition to the
issues relating to the Company’s operations (reports on operating and financial indicators; reports on
monthly business performance results and monthly financial analysis; status of the key open issues in the
Functions; reports on quarterly business performance results), the Advisory Board deals with the issues
covered by the strategy and development policy, the bases of which are laid down by the Shareholders’
Assembly and the Board of Directors of the Company.
Related-Party Transactions
In the nine month period ended 30 September 2018 and in the same period in 2017, the Group entered
into business transactions with its related parties. The most significant transactions with related parties in
the mentioned periods related to supply/delivery of crude oil, petroleum products and energy. An outline
of related-party transactions is provided in the Notes to the Financial Statements.

NIS Group
58
Human Resources
NIS’ mission is to provide people with energy to move towards progress, while considering its employees
to be the energy that drives NIS forward and holds the key to its success. To achieve this synergy, NIS builds
up a business environment in which every employee is able to realise their full potential and employee
rights are fully respected. It is essential for NIS to ensure such conditions in which the principle of no
discrimination allowed on any grounds is strictly followed. To this end, the Equality Policy has been adopted
with the aim of ensuring such an environment, but also providing employees with mechanisms to use in
the event that the Policy principles are violated.
Employee Number and Structure
30/09/2018 30/09/2017
Organizational unit Direct Leasing Total Direct Leasing Total
NIS j.s.c. Novi Sad 4,133 3,665 7,798 4,080 3,530 7,610
Exploration and Production Block 852 216 1.068 800 218 1.018 Services Block 86 23 109 87 22 109 "Downstream" Division77 2,053 2,982 5,035 Refining Block78 955 31 986 865 35 900 Sales and Distribution Block79 990 2,932 3,922 964 2,770 3,734 Energy Head Office80 48 7 55 247 25 272 the rest of the “Downstream” Division81 60 12 72 Corporate Centre 1,093 444 1,537 1,055 460 1,515 Representative Offices and Branches 49 0 49 62 0 62
Subsidiaries in Serbia 1,478 1,694 3,172 1,387 1,611 2,998
Naftagas - Oil Sevices Ltd. Novi Sad82 679 830 1,509 588 840 1,428 Naftagas – Tehnički servisi Ltd. Zrenjanin 396 499 895 395 468 863 Naftagas – Transport Ltd. Novi Sad 80 330 410 97 275 372 NTC NIS – Naftagas Ltd. Novi Sad 323 35 358 307 28 335
Subsidiaries abroad 70 1 71 85 1 86
NIS Petrol e.o.o.d Sofia (Bulgaria) 33 0 33 36 0 36 NIS Petrol s.r.l. Bucharest (Romania) 28 0 28 25 0 25 NIS Petrol Ltd. Banja Luka (Bosnia and Herzegovina) 6 0 6 19 0 19 Jadran Naftagas Ltd. Banja Luka (Bosnia and Herzegovina)
3 0 3 5 0 5
Pannon Naftagas k.f.t. Budapest (Hungary) 0 1 1 0 1 1
Other subsidiaries included in consolidation 574 114 688 565 103 668
O Zone j.s.c. Belgrade 5 114 119 5 103 108 NIS Overseas o.o.o. Moscow (Russian Federation) 113 113 117 117 NIS-Svetlost Ltd. Bujanovac 0 0 G Petrol Ltd. Sarajevo (Bosnia and Herzegovina) 456 456 443 0 443
TOTAL: 6,255 5,474 11,729 6,117 5,245 11,362
77 The transfer of employees to the new structures of the Downstream Division begins as of July 2018 and ends in September. 78The Refining Block becomes subordinate to the new Division. 79 The Sales and Distribution Block becomes subordinate to the new Division. 80 By reorganizing and creating a new Division, the Energy Block ceases to exist; only the Energy Head Office subordinate to the Division
remains, while the other parts are decentralized into the Research and Production Block, Processing Block and Sales and Distribution Block 81 The rest of the “Downstream” Division consists of: Director of Division’s Office, Department for Crude Oil, Department of Planning,
Optimization and Analysis of Production and Commercial and Department of Metrology 82 Including the employees in subsidiaries.

Quarterly Report for 2018 Third Quarter
59
Causes of Employment Termination
In the first nine months of 2018, a total of 220 employees left NIS83: 26 employees retired, 36 employees
left NIS after termination of employment by mutual agreement, while the employment of 158 people was
terminated on other grounds (involuntary termination, voluntary termination, redundancy, death etc.).
Cause of employment termination NIS j.s.c. Novi Sad84 Subsidiaries85
Retirement 15 11 Termination by mutual agreement 32 4 Other 111 47
Total 158 62
83 NIS j.s.c. Novi Sad with the subsidiaries Naftagas – Naftni servisi d.o.o. Novi Sad, Naftagas – Tehnički servisi d.o.o. Zrenjanin, Naftagas –
Transport d.o.o. Novi Sad and NTC NIS Naftagas d.o.o. Novi Sad. 84 Including Representative Offices and Branches. 85 Naftagas – Naftni servisi d.o.o. Novi Sad, Naftagas – Tehnički servisi d.o.o. Zrenjanin, Naftagas – Transport d.o.o. Novi Sad and NTC NIS
Naftagas d.o.o. Novi Sad.

NIS Group
60
Research and Development
The introduction and efficient use of new technologies is one of the priorities of NIS’ development in all
business areas, from production and refining to human resources. Equipment modernisation, innovative
approach and application of state-of-the-art technologies are prerequisite to progress, competitiveness and
regional leadership. NIS constantly modernises its oil and gas business, introduces and upgrades new oil
and gas exploitation techniques, builds new process plants, introduces automation into operations and
develops and modernises its retail network.
In research and development, NIS has in place the Policy on Planning, Execution and Control of Innovation,
Science, Research and Development and Technology Programmes at NIS j.s.c. Novi Sad. The Science and
Technology Council, which meets at a quarterly level, has been set up as part of the CEO’s Office, whereas
the Research and Development Section has been established within the Science and Technology Centre to
coordinate and deliver research and development projects.
In NIS Group, the research and development activity is centred around its subsidiary NIS Naftagas d.o.o.
Novi Sad STC, which uses the resources and technologies of its parent company in synergy with Gazprom
Neft PJSC and has a dual role:
To coordinate science and research activities, and
To execute science and research activities.

Quarterly Report for 2018 Third Quarter
61
Financial Statements
Stand-Alone Financial Statements
Statement of Financial Position
Notes 30 September 2018
(unaudited) 31 December 2017
ASSETS
Current assets Cash and cash equivalents 6 19,080,154 23,410,724
Short-term financial assets 7 15,082,173 11,507,390
Trade and other receivables 8 35,237,488 30,213,371
Inventories 9 36,756,207 33,451,244
Other current assets 10 4,923,229 4,868,561
Non-current assets held for sale 16,715 163
Total current assets 111,095,966 103,451,453
Non-current assets
Property, plant and equipment 11 252,918,304 237,108,439
Investment property 1,603,370 1,530,356
Intangible assets 2,475,492 3,082,914
Investments in associates and joint ventures 1,038,800 1,038,800
Investments in subsidiaries 13,425,586 13,425,586
Trade and other non-current receivables 2,842 2,222
Long-term financial assets 12 26,469,748 34,188,042
Deferred tax assets 1,392,350 2,487,491
Other non-current assets 13 3,086,912 3,835,469
Total non-current assets 302,413,404 296,699,319
Total assets 413,509,370 400,150,772
LIABILITIES AND SHAREHOLDER’S EQUITY
Current liabilities
Short-term debt and current portion of long-term debt 14 8,414,075 8,305,932
Trade and other payables 15 35,553,391 34,596,516
Other current liabilities 16 4,508,718 4,880,705
Current income tax payable 743,373 1,915,676
Other taxes payable 17 11,053,819 9,235,139
Provisions for liabilities and charges 2,048,704 2,837,875
Total current liabilities 62,322,080 61,771,843
Non-current liabilities
Long-term debt 18 86,919,097 89,751,052
Long-term trade and other payables 17,936 -
Provisions for liabilities and charges 9,862,096 9,660,582
Total non-current liabilities 96,799,129 99,411,634
Equity
Share capital 81,530,200 81,530,200
Reserves 20,287 17,782
Retained earnings 172,837,674 157,419,313
Total equity 254,388,161 238,967,295
Total liabilities and shareholder’s equity 413,509,370 400,150,772
All amounts are in 000 RSD, unless otherwise stated

NIS Group
62
Statement of Profit and Loss and Other Comprehensive Income
Three-month period ended
30 September Nine-month period ended
30 September
Note 2018
(unaudited) 2017
(unaudited) 2018
(unaudited) 2017
(unaudited)
Sales of petroleum products, oil and gas 75,475,148 50,159,865 179,642,312 140,336,863
Other revenues 4,245,053 5,301,472 10,809,257 13,070,575
Total revenue from sales 5 79,720,201 55,461,337 190,451,569 153,407,438
Purchases of oil, gas and petroleum products
(48,191,688)
(29,160,161)
(110,205,399)
(80,408,250)
Production and manufacturing expenses 19 (7,378,956) (8,253,648) (20,100,156) (21,776,759)
Selling, general and administrative expenses
20 (5,235,925) (5,359,192) (15,541,374) (15,193,947)
Transportation expenses (345,568) (295,863) (908,910) (791,895)
Depreciation, depletion and amortization (4,596,912) (3,543,463) (12,869,917) (10,525,965)
Taxes other than income tax (1,160,573) (998,780) (3,327,472) (3,006,015)
Exploration expenses (41,169) (3,338) (56,940) (10,790)
Total operating expenses (66,950,791) (47,614,445) (163,010,168) (131,713,621)
Other (expenses) income, net (170,973) (348,476) (138,294) (583,279)
Operating profit 12,598,437 7,498,416 27,303,107 21,110,538
Net foreign exchange gain 21 (237,240) 2,058,339 (234,701) 6,169,965
Finance income 22 389,941 435,027 1,209,825 1,059,700
Finance expenses 23 (542,979) (683,085) (1,663,485) (2,058,521)
Total other income (expense) (390,278) 1,810,281 (688,361) 5,171,144
Profit before income tax 12,208,159 9,308,697 26,614,746 26,281,682
Current income tax expense (1,508,875) (919,199) (3,149,785) (4,777,638)
Deferred tax expense (465,260) (471,385) (1,095,141) (1,220,804)
Total income tax expense (1,974,135) (1,390,584) (4,244,926) (5,998,442)
Profit for the period 10,234,024 7,918,113 22,369,820 20,283,240
Other comprehensive profit (loss):
Components of other comprehensive income that will not be reclassified to profit or loss, net of tax
Revaluation of property, plant and equipment transferred to investment property - - - 1,399
- -
- 1,399
Items that may be subsequently reclassified to profit or loss
Change in value of available-for-sale financial assets (364) 1,326 (950) 3,049
(364) 1,326 (950)
Other comprehensive profit (loss) for the period (364) 1,326 (950) 4,448
Total comprehensive income for the period 10,233,660 7,919,439 22,368,870 20,287,688
Earnings per share attributable to shareholders of Naftna Industrija Srbije
124.42
Basic earnings (RSD per share) 62.76 48.57 137.18 124.42
Weighted average number of ordinary shares in issue (in millions) 163 163 163 163
All amounts are in 000 RSD, unless otherwise stated

63
Statement of Changes in Shareholders’ Equity
Nine-month period ended 30 September 2018 and 2017
(unaudited)
Share capital Reserves Retained earnings Total
Balance as at 1 January 2017 81,530,200 14,088 133,630,354 215,174,642
Profit for the period - - 20,283,240 20,283,240
Other comprehensive income (loss)
Change in value of available-for-sale financial assets - 3,049 - 3,049
Revaluation of intangible assets, property, plant and equipment transferred to investment property - 1,399 - 1,399
Total comprehensive income (loss) for the period - 4,448 20,283,240 20,287,688
Dividend distribution - - (4,021,069) (4,021,069)
Balance as at 30 September 2017 81,530,200 18,536 149,892,525 231,441,261
Balance as at 1 January 2018 81,530,200 17,782 157,419,313 238,967,295
Profit for the period - - 22,369,820 22,369,820
Other comprehensive income (loss)
Change in value of available-for-sale financial assets - (950) - (950)
Sale of available for sale financial assets - 3,455 (3,455) -
Total comprehensive income (loss) for the period - 2,505 22,366,365 22,368,870
Dividend distribution - - (6,948,004) (6,948,004)
Balance as at 30 September 2018 81,530,200 20,287 172,837,674 254,388,161
All amounts are in 000 RSD, unless otherwise stated

NIS Group
64
Statement of Cash Flows86
Nine-month period ended
30 September
Note 2018
(unaudited) 2017
(unaudited)
CASH FLOWS FROM OPERATING ACTIVITIES
Profit before income tax 26,614,746 26,281,682
Adjustments for:
Finance expenses 23 1,663,485
2,058,521
Finance income 22 (1,209,825) (1,059,700)
Net unrealised foreign exchange (gain) losses 565,384 (5,324,247)
Depreciation, depletion and amortization 12,869,917 10,525,965
Adjustments for other provisions 345,118 478,381
Allowance for doubtful accounts (255,814) 217,828
Write off of dry holes 56,940 10,790
Payables write-off - (2,867)
Other non-cash items 115,166 200,526
Operating cash flow before changes in working capital 40,765,117 33,386,879
Changes in working capital:
Trade and other receivables (4,797,963) 15,900,505
Inventories (3,367,640) (3,417,644)
Other current assets 74,005 (1,239,968)
Trade payables and other current liabilities 1,704,643 (4.106.475)
Other taxes payable 1,818,680 (35,181)
Total effect on working capital changes (4,568,275) 7,101,237
Income taxes paid (4,328,368) (1,197,351)
Interest paid (1,625,204) (2,181,767)
Interest received 652,870 923,883
Net cash generated from operating activities 30,896,140 38,032,881
CASH FLOWS FROM INVESTING ACTIVITIES
Loans issued (2,621,606) (3,662,119)
Loan proceeds received 1,606,005 2,802,327
Capital expenditures87 (29,787,703) (17,895,126)
Proceeds from sale of property, plant and equipment 179,938 102,341
Repayment (placements) of bank deposits 5,586,458 (7,945,830)
Other inflow 32,122 156
Net cash used in investing activities (25,004,786) (26,598,251)
CASH FLOWS FROM FINANCING ACTIVITIES
Proceeds from borrowings 18 29,941,738 35,915,950
Repayment of borrowings 18 (33,253,718) (43,223,916)
Repayments of finance lease liabilities 18 (39,388) (38,189)
Dividends paid (6,948,004) (4.021.069)
Net cash used in financing activities (10,299,372) (11,367,224)
Net increase (decrease) in cash and cash equivalents (4,408,018) (67,406)
Effect of foreign exchange on cash and cash equivalents 77,448 (282,000)
Cash and cash equivalents as of the beginning of the period 23,410,724 20,053,651
Cash and cash equivalents as of the end of the period 19,080,154 19,839,057
All amounts are in 000 RSD, unless otherwise stated
86 Group policy is to present cash flow inclusive of related VAT. 87 CF from investing activities includes VAT in the amount of RSD 4.3 bn (2017: 2.1 bln RSD)

Quarterly Report for 2018 Third Quarter
65
Notes to Stand-Alone Financial Statements88
1. GENERAL INFORMATION
Open Joint Stock Company Naftna Industrija Srbije, Novi Sad (the “Company”) is a vertically integrated oil
company operating predominantly in the Republic of Serbia. The Company’s principal activities include:
Exploration, production and development of crude oil and gas,
Production of refined petroleum products,
Petroleum products and gas trading and
Electricity generation and trading.
Other activities primarily include sales of other goods, works and services.
The Company was established in accordance with the Decision of Government of Republic of Serbia on 7
July 2005. On 2 February 2009 PJSC Gazprom Neft (“Gazprom Neft”) acquired a 51% of the share capital of
Naftna Industrija Srbije which became a subsidiary of Gazprom Neft. In March 2011, under the Company’s
Share Sale and Purchase Agreement, Gazprom Neft acquired an additional 5.15% of shares, thereby
increasing its percentage of ownership to 56.15%. PJSC Gazprom, Russian Federation is the ultimate owner
of the Company.
The Company is an open joint stock company, listed on the prime market on the Belgrade Stock Exchange.
These Interim Condensed Financial Statements have been approved and authorized for issue by Chief
Executive Officer and will be presented to Board of Directors for approval.
2. SUMMARY OF SIGNIFICANT ACCOUNTING POLICIES
2.1. Basis of preparation
The Company maintains its books and records in accordance with accounting and taxation principles and
practices mandated by Serbian legislation. The accompanying Interim Condensed Financial Statements
were primarily derived from the Company’s statutory books and records with adjustments and
reclassifications made to present them in accordance with International Financial Reporting Standards
(IFRS).
The Interim Condensed Financial Statements have been prepared in accordance with International
Accounting Standard IAS 34 Interim Financial Reporting. IAS 34 for interim financial reporting does not
require all disclosures that would be necessarily required by IFRS.
The Company does not disclose information which would substantially duplicate the disclosures contained
in its audited Financial Statements for 2017, such as significant accounting policies, significant estimates
and judgements, financial risk disclosures or disclosures of financial line items, which have not changed
significantly in amount or composition. Management of the Company believes that the disclosures in these
Interim Condensed Financial Statements are adequate to make the information presented not misleading
if these Interim Condensed Financial Statements are read in conjunction with the Company’s Financial
Statements for 2017.
Subsequent events occurring after 30 September 2018 were evaluated through 29 October 2018, the date
these Interim Condensed Financial Statements were authorised for issue.
88 All amounts are in 000 RSD, unless otherwise stated

NIS Group
66
The results for the nine month period ended 30 September 2018 are not necessarily indicative of the results
expected for the full year.
The Company as a whole is not subject to significant seasonal fluctuations.
2.2. Changes in significant accounting policies
Significant accounting policies, judgements and estimates applied while preparing these Interim Condensed
Financial Statements are consistent with those applied during the preparation of Financial Statements as of
and for the year ended 31 December 2017, except for those described in the Application of new IFRS
paragraph.
3. APPLICATION OF NEW IFRS
Accounting policies applied from 1 January 2018
IFRS 9 – Financial Instruments (amended in July 2014 and effective for annual periods beginning on or
after 1 January 2018). From 1 January 2018 the Company classifies its financial assets in the following
measurement categories: those to be measured subsequently at fair value through profit or loss (FVPL),
those to be measured subsequently at fair value through other comprehensive income (FVOCI), and those
to be measured subsequently at amortized cost.
The classification of debt instruments depends on the organization's business model for managing financial
assets and whether contractual cash flows of an asset give rise to payments on specified dates that are
solely payments of principal and interest (“SPPI”).
The Company presents in OCI changes in the fair value of all its equity investments previously classified as
available-for-sale, because these investments are held as long-term strategic investments that are not
expected to be sold in the short-to-medium term.
Financial assets and liabilities previously classified in accordance with IAS 39 “Financial Instruments:
Recognition and Measurement” within categories loans and receivables, investments held to maturity and
other financial liabilities measured at amortised cost using the effective interest method, in accordance
with IFRS 9 “Financial instruments” are classified as financial assets and financial liabilities carried at
amortised cost. Measurement of cash and cash equivalents, trade and other receivables and payables, long-
term and short-term loans and investments, held-to-maturity investments has not changed and these
financial instruments are measured at amortised cost.
IFRS 15 – Revenue from Contracts with Customers (amended in April 2016 and effective for annual
periods beginning on or after 1 January 2018). The Company recognizes revenue from sales of crude oil,
petroleum products, gas and other products and services when it satisfies a performance obligation and
control over goods and services is passed. For the most contracts control over goods or services passes to
a customer at point of time and consideration is unconditional because only the passage of time is required
before the payment is due.
The transaction price excludes amounts collected on behalf of third parties such as value added tax and
sales related tax.
4. NEW ACCOUNTING STANDARDS
Certain new standards and interpretations have been issued that are mandatory for the annual periods
beginning on 1 January 2018 or later, and that the Company has not early adopted.

Quarterly Report for 2018 Third Quarter
67
IFRS 16, Leases (issued on 13 January 2016 and effective for annual periods beginning on or after 1
January 2019). The new standard sets out the principles for the recognition, measurement, presentation
and disclosure of leases. All leases result in the lessee obtaining the right to use an asset at the start of the
lease and, if lease payments are made over time, also obtaining financing. Accordingly, IFRS 16 eliminates
the classification of leases as either operating leases or finance leases as is required by IAS 17 and, instead,
introduces a single lessee accounting model. Lessees will be required to recognise: (a) assets and liabilities
for all leases with a term of more than 12 months, unless the underlying asset is of low value; and (b)
depreciation of lease assets separately from interest on lease liabilities in the statement of profit or loss
and other comprehensive income. IFRS 16 substantially carries forward the lessor accounting requirements
in IAS 17. Accordingly, a lessor continues to classify its leases as operating leases or finance leases, and to
account for those two types of leases differently. The Company is currently assessing the impact of the new
standard on its financial statements.
Unless otherwise described above, the new standards and interpretations are not expected to have
significant impact on the Company’s Interim Condensed Financial Statements.
The following other new standards and pronouncements are not expected to have any material impact on
the Company when adopted:
IFRS 17 – Insurance Contracts (issued on 18 May 2017 and effective for annual periods beginning on or
after 1 January 2021).
IFRIC 23 – Uncertainty over Income Tax Treatments (issued on 7 June 2017 and effective for annual
periods beginning on or after 1 January 2019).
Sale or Contribution of Assets between an Investor and its Associate or Joint Venture – Amendments to
IFRS 10 and IAS 28 (issued on 11 September 2014 and effective for annual periods beginning on or after
a date to be determined by the IASB).
Prepayment Features with Negative Compensation – Amendments to IFRS 9 (issued on 12 October 2017
and effective for annual periods beginning on or after 1 January 2019)
Long-term Interests in Associates and Joint Ventures – Amendments to IAS 28 (issued on 12 October
2017 and effective for annual periods beginning on or after 1 January 2019).IFRS 17 – Insurance
Contracts (issued on 18 May 2017 and effective for annual periods beginning on or after 1 January 2021).
5. SEGMENT INFORMATION
Presented below is information about the Company’s operating segments for the nine month periods ended
30 September 2018 and 2017. Operating segments are components that engage in business activities that
may earn revenues or incur expenses, whose operating results are regularly reviewed by the chief operating
decision maker (CODM), and for which discrete financial information is available.
The Company manages its operations in 2 operating segments: Upstream and Downstream.
Upstream segment (exploration and production) includes the following Company operations: exploration,
development and production of crude oil and natural gas and oil field services. Downstream segment
(refining and marketing) processes crude oil into refined products and purchases, sells and transports crude
and refined petroleum products (refining and marketing). Corporate centre and Energy business activities
are presented within the Downstream segment.

NIS Group
68
Eliminations and other adjustments section encompasses elimination of inter-segment sales and related
unrealised profits, mainly from the sale of crude oil and products, and other adjustments. Intersegment
revenues are based upon estimated market prices.
EBITDA represents the Company’s EBITDA. Management believes that EBITDA represents useful means of
assessing the performance of the Company's ongoing operating activities, as it reflects the Company's
earnings trends without showing the impact of certain charges. EBITDA is defined as earnings before
interest, income tax expense, depreciation, depletion and amortization, finance income (expenses) net and
other non-operating income (expenses). EBITDA is a supplemental non-IFRS financial measure used by
management to evaluate operations.
Reportable segment results for the nine month period ended 30 September 2018 and 2017 are shown in
the table below:
Upstream Downstream Eliminations Total
Nine month period ended 30 September 2018
Segment revenue 25,550,616 190,985,157 (26,084,204) 190,451,569
Intersegment 24,276,020 1,808,184 (26,084,204) -
External 1,274,596 189,176,973 - 190,451,569
EBITDA (Segment results) 27,739,616 12,444,127 - 40,183,743
Depreciation, depletion and amortization (6,311,286) (6,558,631) - (12,869,917)
Impairment of non-financial assets (3,471) (21,164) - (24,635)
Net foreign exchange gain (42,776) (191,925) - (234,701)
Finance income (expenses), net 10,006 (463,666) - (453,660)
Income tax (122,158) (4,122,768) - (4,244,926)
Segment profit/(loss) 21,082,559 1,287,261 - 22,369,820
Nine month period ended 30 September 2017
Segment revenue 30,884,922 153,982,555 (31,460,039) 153,407,438
Intersegment 29,797,225 1,662,814 (31,460,039) -
External 1,087,697 152,319,741 - 153,407,438
EBITDA (Segment results) 20,727,183 10,958,011 - 31,685,194
Depreciation, depletion and amortization (4,050,306) (6,475,659) - (10,525,965)
Net of impairment of non-financial assets - (23,506) - (23,506)
Net foreign exchange gain 375,228 5,794,737 - 6,169,965
Finance income (expenses), net (74,853) (923,968) - (998,821)
Income tax (1,925,216) (4,073,226) - (5,998,442)
Segment profit/(loss) 15,075,861 5,207,379 - 20,283,240
EBITDA for the nine and three month period ended 30 September 2018 and 2017 is reconciled below:
Three-month period ended 30
September Nine month period ended
30 September
2018 2017 2018 2017 Profit for the period 10,234,024 7,918,113 22,369,820 20,283,240
Income tax expenses 1,974,135 1,390,584 4,244,926 5,998,442
Finance expenses 542,979 683,085 1,663,485 2,058,521
Finance income (389,941) (435,027) (1,209,825) (1,059,700)
Depreciation, depletion and amortization 4,596,912 3,543,463 12,869,917 10,525,965
Net foreign exchange gain 237,240 (2,058,339) 234,701 (6,169,965)
Other expense, net 170,973 348,476 138,294 583,279
Other non-operating income, net (134,484) (433,881) (127,575) (534,588)
EBITDA 17,231,838 10,956,474 40,183,743 31,685,194

Quarterly Report for 2018 Third Quarter
69
Oil, gas and petroleum products sales comprise the following (based on the country of customer
incorporation):
Nine-month period ended 30 September 2018
Domestic market Export and International sales Total
Sale of crude oil - 1,056,256 1,056,256
Sale of gas 1,415,084 - 1,415,084
Through a retail network - - -
Wholesale activities 1,415,084 - 1,415,084
Sale of petroleum products 141,952,328 35,218,645 177,170,973
Through a retail network 46,145,292 - 46,145,292
Wholesale activities 95,807,036 35,218,645 131,025,681
Sale of electricity 478,885 4,466,746 4,945,631
Other sales 5,663,123 200,502 5,863,625
Total sales 149,509,420 40,942,149 190,451,569
Nine-month period ended 30 September 2017
Domestic market Export and International sales Total
Sale of crude oil - 891,183 891,183
Sale of gas 1,911,439 - 1,911,439
Through a retail network - - -
Wholesale activities 1,911,439 -
Sale of petroleum products 113,816,619 23,717,622 137,534.241
Through a retail network 40,667,665 - 40,667,665
Wholesale activities 73,148,954 23,717,622 96,866,576
Sale of electricity 343,791 7,462,832 7,806,623
Other sales 5,093,097 170,855 5,263,952
Total sales 121,164,946 32,242,492 153,407,438
Out of the amount of 131.025,681 RSD (2017: 96,866,576 RSD) revenue from sale of petroleum products
(wholesale), the amount of 19,494,776 RSD (2017: 15,198,024 RSD) are derived from a single domestic
customer HIP Petrohemija. These revenue are attributable to wholesale activities within Downstream
segment.
Sales of electricity mainly relates to trading with Gazprom Marketing & Trading Co., Ltd. in the amount of
3,988,435 RSD (2017: 7,022,733 RSD). These sales are presented within Downstream segment.
Other sales mainly relate to sales of non-fuel products at petrol stations in the amount of 4,223,980 RSD
(2017: 3,912,733 RSD).
The Company is domiciled in the Republic of Serbia. The revenue from external customers in the Republic
of Serbia is 149,509,420 RSD (2017: 121,164,947 RSD), and the total revenue from external customer from
other countries is 40,942,149 RSD (2017: 32,242,492 RSD).

NIS Group
70
The breakdown of the major component of the total revenue from external customers from other countries
is disclosed below:
Nine-month period ended 30
September
2018 2017
Sale of crude oil 1,056,256 891,183
Sale of petroleum products (retail and wholesale)
Bulgaria 8,269,231 5,331,605
Bosnia and Herzegovina 8,507,290 4,634,272
Romania 6,169,304 3,387,235
All other markets 12,272,820 10,364,510
35,218,645 23,717,622
Sale of electricity 4,466,746 7,462,832
Other sales 200,502 170,855
40,942,149 32,242,492
Revenues from the individual countries included in all other markets are not material.
6. CASH AND CASH EQUIVALENTS
30 September 2018 31 December 2017
Cash in bank and in hand 10,838,633 14,432,605
Deposits with original maturity of less than three months 7,980,000 8,670,000
Cash held on escrow account 41,966 68,765
Cash equivalents 219,555 239,354
19,080,154 23,410,724
7. SHORT-TERM FINANCIAL ASSETS
30 September 2018 31 December 2017
Short-term loans 195,774 247,524
Deposits with original maturity more than 3 months less than 1 year
4,186,570 7,645,642
Current portion of long-term investments (note 12) 10,927,755 3,838,872
Less impairment loss provision (227,926) (224,648)
15,082,173 11,507,390
As at 30 September 2018 deposits with original maturity more than three months less than 1 year
amounting to 4,186,570 RSD (31 December 2017: 7,645,642 RSD) relates to bank deposits placements with
interest rates from 4.15% to 4.65% p.a. denominated in RSD

Quarterly Report for 2018 Third Quarter
71
8. TRADE AND OTHER RECEIVABLES
30 September 2018 31 December 2017
Trade receivables:
- related parties 5,056,015 5,261,268
- third parties 32,373,986 25,991,656
- state and state owned companies 8,753,703 10,233,306
46,183,704 41,486,230
Accrued assets 187,054 185,641
46,370,758 41,671,871
Less impairment provision for trade and other receivables:
- third parties (9,372,171) (9,594,055)
- state and state owned companies (1,761,099) (1,864,445)
(11,133,270) (11,458,500)
Total trade and other receivables 35,237,488 30,213,371
The ageing of trade and other receivables is as follows:
30 September 2018 31 December 2017
Neither impaired nor past due 31,379,596 27,691,406
Past due but not impaired:
within 30 days 2,386,875 1,992,337
1 to 3 months 1,044,230 197,904
3 months to 1 year 212,700 121,577
over 1 year 214,087 210,147
Total 35,237,488 30,213,371
Company management believes that net receivables included in the ageing table above are fully
recoverable.
The carrying amounts of the Company’s trade and other receivables are denominated in the following
currencies:
30 September 2018 31 December 2017
RSD 29,247,513 21,791,608
EUR 4,711,721 7,438,322
USD 1,278,254 982,442
Other - 999
35,237,488 30,213,371

NIS Group
72
Movements on the Company’s impairment provision for of trade and other receivables are as follows:
Trade & other receivables
Third parties State and state
owned companies Total
As at 1 January 2017 9,841,314 11,563,533 21,404,847
Provision for receivables impairment 258,534 19,907 278,441
Release of provision (145,969) (19,983) (165,952)
Receivables written off during the year as uncollectible
(24,074) (24,074)
Unwiding of discount - (100,225) (100,225) Transfer from non-current part Курсне разлике - 208,808 208,808
Exchange differences (449) (323,771) (324,220)
Other (49,616) (1) (49,617)
As at 30 September 2017 9,879,740 11,348,268 21,228,008
As at 1 January 2018 9,594,055 1,864,445 11,458,500
Provision for receivables impairment 71,446 4,133 75,579
Release of provision (258,259) (85,258) (343,517)
Receivables written off during the year as uncollectible
(10,772) (3,534) (14,306)
Unwinding of discount (note 23) - (44,661) (44,661)
Exchange differences 517 1,158 1,675
Other (24,816) 24,816 -
As at 30 September 2018 9,372,171 1,761,099 11,133,270
Expenses that have been provided for or written off are included in selling, general and administrative
expenses within the Profit and Loss. Amounts charged to the allowance account are generally written off
where there is no expectation of recovering additional cash.
The maximum exposure to credit risk at the reporting date is the carrying value of each class of receivables
mentioned above. The other classes within trade and other receivables do not contain impaired assets.
9. INVENTORIES
30 September 2018 31 December 2017
Crude oil 23,001,364 22,312,814
Petroleum products 12,938,875 11,116,609
Materials and supplies 4,989,529 4,288,895
Other 656,984 680,609
Less impairment provision (4,830,545) (4,947,683)
36,756,207 33,451,244
10. OTHER CURRENT ASSETS
30 September2018 31 December 2017
Advances paid 800,510 566,382
Deferred VAT 1,814,675 1,099,407
Prepaid expenses 346,606 193,927
Prepaid custom duties 31,832 31,995
Prepaid excise 1,776,563 1,820,845
Other current assets 12,086,475 13,085,751
Less impairment provision (11,933,432) (11,929,746)
4,923,229 4,868,561

Quarterly Report for 2018 Third Quarter
73
Deferred VAT as at 30 September 2018 amounting to 1,814,675 RSD (31 December 2017: 1,099,407 RSD)
represents VAT inputs claimed on invoices received and accounted for in the current period, while the
inputs will be allowed in the following accounting period.
Prepaid excise as at 30 September 2018 amounting to 1,776,563 RSD (31 December 2017: 1,820,845 RSD)
relates to the excise paid for finished products stored in non-excise warehouse.
Other current assets mainly relate to accrued interests and claims in dispute which are impaired.
Movements on the Company’s impairment provision for other current assets are as follows:
Advances paid Other current assets Total
As at 1 January 2017 257,940 11,719,291 11,977,231
Increase of provision during the year 5,253 136,987 142,240
Release of provision (338) (55,247) (55,585)
Receivables written off during the year as uncollectible
- (36,341) (36,341)
Other 1 49,620 49,621
As at 30 September 2017 262,856 11,814,310 12,077,166
As at 1 January 2018 259,236 11,670,510 11,929,746
Increase of provision during the year 1,962 20,092 22,054
Release of provision (821) (13,611) (14,432)
Receivables written off during the year as uncollectible
- (3,936) (3,936)
As at 30 September 2018 260,377 11,673,055 11,933,432
The ageing of other current assets is as follows:
30 September 2018 31 December 2017
Neither impaired nor past due 214,103 1,214,442
Not impaired and past due in the following periods:
Less than 1 month 5,790 14,972
1 - 3 months 4,031 25,707
3 month - 1 year 57,590 30,192
Over 1 year 21,978 14,658
Total 303,492 1,299,971
Net amount of other current assets shown in ageing analysis does not include non-financial assets like VAT,
excise etc.

NIS Group
74
11. PROPERTY, PLANT AND EQUIPMENT
Oil and gas properties Refining assets Marketing and distribution assets Other assets Assets under construction Total
As at 1 January 2017 Cost 115,864,815 110,525,127 46,383,755 17,548,942 31,776,922 322,099,561 Depreciation and impairment (27,422,504) (35,174,792) (24,349,626) (8,489,733) (2,103,957) (97,540,612)
Net book value 88,442,311 75,350,335 22,034,129 9,059,209 29.672.965 224.558.949
Period ended 30 September 2017 Additions - - - - 16,595,854 16,595,854 Changes in decommissioning obligations 134,606 - - - - 134,606 Transfer from assets under construction 13,801,597 2,106,526 1,097,520 267,610 (17,273,253) - Transfer to intangible assets - - (22,698) (2,314) - (25,012) Transfer to investment property - (14,361) - (101,798) - (116,159) Impairment - - (20,874) - (8,059) (28,933) Depreciation (4,006,861) (4,255,052) (1,109,465) (415,854) - (9,787,232) Disposals and write-off (39,783) (7,610) (137,877) (4,408) (84,716) (274,394) Other transfers 1,314 (141,282) (37,372) 179,654 6,351 8,665
98,333,184 73,038,556 21,803,363 8,982,099 28,909,142 231,066,344 As at 30 June 2017 Cost 129,652,194 112,400,576 47,012,151 17,734,196 31,000,232 337,799,349 Depreciation and impairment (31,319,010) (39,362,020) (25,208,788) (8,752,097) (2,091,090) (106,733,005)
Net book value 98,333,184 73,038,556 21,803,363 8,982,099 28,909,142 231,066,344
As at 1 January 2018 Cost 135,319,517 114,239,048 47,083,673 17,694,721 32,591,816 346,928,775 Depreciation and impairment (32,675,985) (40,818,582) (25,487,659) (8,841,365) (1,996,745) (109,820,336)
Net book value 102,643,532 73,420,466 21,596,014 8,853,356 30,595,071 237,108,439
Period ended 30 September 2018 Additions - - - - 28,635,113 28,635,113 Acquisitions through business combinations - - - - 217,660 217,660 Changes in decommissioning obligations 158,576 - - - - 158,576 Transfer from assets under construction 11,549,461 1,386,171 3,560,627 140,528 (16,636,787) - Transfer to investment property - - (81,328) - - (81,328) Impairment - - (23,931) - (13,412) (37,343) Depreciation (6,269,861) (4,182,159) (1,291,547) (392,613) - (12,136,180) Disposals and write-off (52,007) (72,933) (17,725) (17,646) (794,563) (954,874) Other transfers 1,980,026 (1,400,947) 20,705 (599,720) 8,177 8,241
110,009,727 69,150,598 23,762,815 7,983,905 42,011,259 252,918,304 As at 30 September 2018 Cost 149,474,499 113,765,057 51,043,367 16,217,905 44,021,415 374,522,243 Depreciation and impairment (39,464,772) (44,614,459) (27,280,552) (8,234,000) (2,010,156) (121,603,939)
Net book value 110,009,727 69,150,598 23,762,815 7,983,905 42,011,259 252,918,304

Quarterly Report for Third Quarter of 2018
75
Oil and gas production assets
Capitalised exploration
and evaluation
expenditure
Capitalised development
expenditure
Total - asset under construction
(exploration and development expenditure)
Production assets
Other business
and corporate
assets Total
As at 1 January 2017 Cost 12,345,350 7,915,400 20,260,750 115,864,815 22,129 136,147,694 Depreciation and impairment - (876) (876) (27,422,504) (20,309) (27,443,689)
Net book amount 12,345,350 7,914,524 20,259,874 88,442,311 1,820 108,704,005
Period ended 30 September 2017
Additions 2,372,057 9,882,806 12,254,863 - - 12,254,863 Changes in decommissioning obligations
- - - 134,606 - 134,606
Transfer from asset under construction
(3,089,976) (10,701,547) (13,791,523) 13,801,597 - 10,074
Depreciation and depletion - - - (4,006,861) - (4,006,861) Disposals and write-off (63,297) (19,281) (82,578) (39,783) - (122,361) Other transfers (33,756) 33,717 (39) 1,314 - 1,275
11,530,378 7,110,219 18,640,597 98,333,184 1,820 116,975,601 As at 30 September 2017 Cost 11,530,378 7,111,095 18,641,473 129,652,194 22,129 148,315,796 Depreciation and impairment - (876) (876) (31,319,010) (20,309) (31,340,195)
Net book amount 11,530,378 7,110,219 18,640,597 98,333,184 1,820 116,975,601
As at 1 January 2018 Cost 10,805,015 6,481,469 17,286,484 135,319,517 22,129 152,628,130 Depreciation and impairment - (2,087) (2,087) (32,675,985) (20,309) (32,698,381)
Net book amount 10,805,015 6,479,382 17,284,397 102,643,532 1,820 119,929,749
Period ended 30 September 2018
Additions 3,388,986 9,426,940 12,815,926 - - 12,815,926 Changes in decommissioning obligations
- - - 158,576 - 158,576
Transfer from asset under construction
(1,940,070) (9,609,391) (11,549,461) 11,549,461 - -
Impairment - (3,471) (3,471) - - (3,471) Depreciation and depletion - - - (6,269,861) - (6,269,861) Disposals and write-off (753,455) (24,651) (778,106) (52,007) - (830,113) Other transfers 445,236 (446,609) (1,373) 1,980,026 168 1,978,821
11,945,712 5,822,200 17,767,912 110,009,727 1,988 127,779,627 As at 30 September 2018 Cost 11,945,712 5,827,758 17,773,470 149,474,499 22,300 167,270,269 Depreciation and impairment - (5,558) (5,558) (39,464,772) (20,312) (39,490,642)
Net book amount 11,945,712 5,822,200 17,767,912 110,009,727 1,988 127,779,627
12. LONG-TERM FINANCIAL ASSETS
30 September 2018 31 December 2017
Deposits with original maturity more than 1 year - 2,029,483
LT loans issued 37,272,139 35,863,153
Available for sale financial assets 173,890 187,311
Other LT placements 25,882 26,567
Less Current portion of LT loans issued (note 7) (10,927,755) (3,838,872)
Less provision of other LT placements (74,408) (79,600)
26,469,748 34,188,042
13. OTHER NON-CURRENT ASSETS
30 September 2018 31 December 2017
Advances paid for PPE 1,447,168 2,148,358 Prepaid expenses 645,073 689,450 Other assets 1,031,617 1,034,607
Less impairment provision (36,946) (36,946)

NIS Group
76
3,086,912 3,835,469
14. SHORT-TERM DEBT AND CURRENT PORTION OF LONG-TERM DEBT
30 September 2018 31 December 2017
Short-term loans 1,816,128 2,298,487 Interest liabilities 115,060 106,743 Current portion of long-term loans (note 18) 6,387,147 5,849,547 Current portion of finance lease liabilities (note 18) 95,740 51,155
8,414,075 8,305,932
15. TRADE AND OTHER PAYABLES
30 September2018 31 December 2017
Trade payables:
- related parties 10,312,649 15,429,094
- third parties 21,444,286 15,371,836
Dividends payable 3,772,308 3,772,308
Other accounts payable 24,148 23,278
35,553,391 34,596,516
As at 30 September 2018 payables to related parties amounting to 10,312,649 RSD (31 December 2017:
15,429,094 RSD) mainly relate to payables to the supplier Gazprom Neft, St Petersburg in the amount of
6,443,713 RSD mostly based on purchase of crude oil (31 December 2017: 11,727,340 RSD).
16. OTHER CURRENT LIABILITIES
30 September 2018 31 December 2017 Advances received 1,325,309 1,374,398 Payables to employees 2,716,850 3,041,616 Accruals and deferred income 456,142 435,851 Other current non-financial liabilities 10,417 28,840
4,508,718 4,880,705
17. OTHER TAXES PAYABLE
30 September 2018 31 December 2017
Mineral extraction tax 389,819 280,971 VAT 2,438,253 1,668,014 Excise tax 5,528,353 4,777,490 Contribution for buffer stocks 547,235 527,858 Custom duties 265,162 126,946 Other taxes 1,884,997 1,853,860
11,053,819 9,235,139
18. LONG-TERM DEBT
30 September2018 31 December 2017
Long-term loan - Gazprom Neft 26,162,094 30,306,970 Bank loans 66,553,926 65,097,574 Finance lease liabilities 685,964 247,210
Less Current portion (note 14) (6,482,887) (5,900,702)
86,919,097 89,751,052
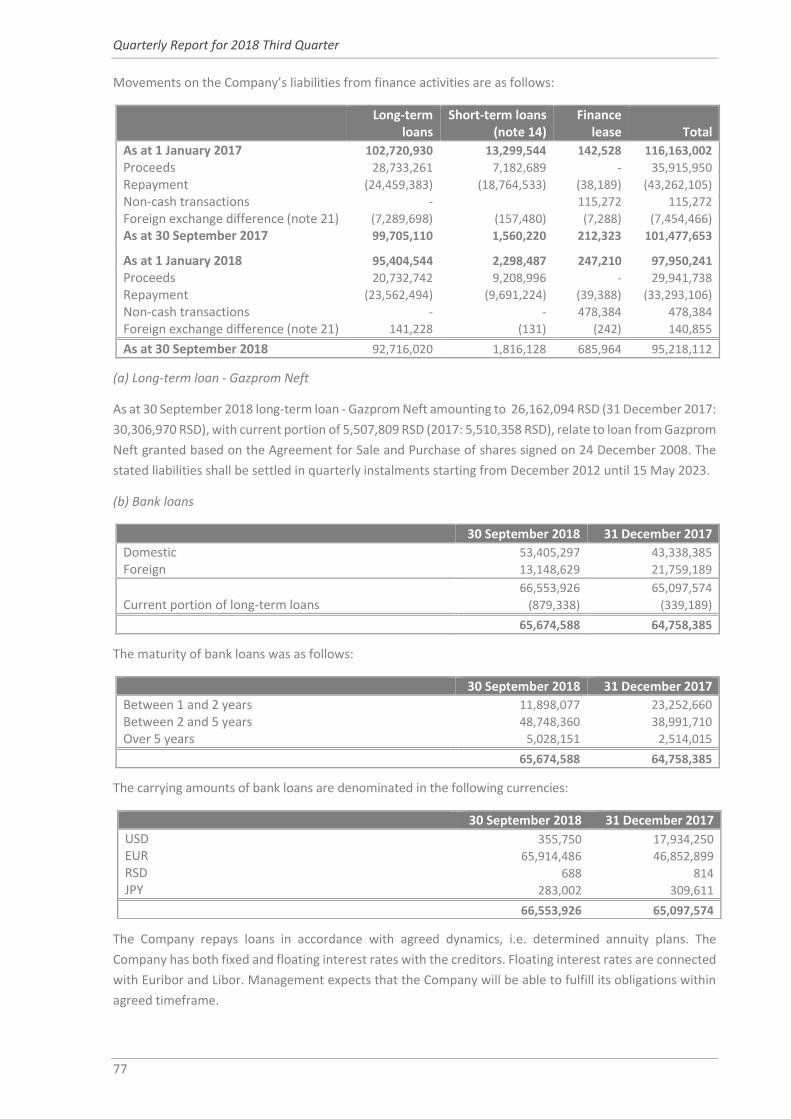
Quarterly Report for 2018 Third Quarter
77
Movements on the Company’s liabilities from finance activities are as follows:
Long-term
loans Short-term loans
(note 14) Finance
lease Total
As at 1 January 2017 102,720,930 13,299,544 142,528 116,163,002 Proceeds 28,733,261 7,182,689 - 35,915,950 Repayment (24,459,383) (18,764,533) (38,189) (43,262,105) Non-cash transactions - 115,272 115,272 Foreign exchange difference (note 21) (7,289,698) (157,480) (7,288) (7,454,466) As at 30 September 2017 99,705,110 1,560,220 212,323 101,477,653
As at 1 January 2018 95,404,544 2,298,487 247,210 97,950,241 Proceeds 20,732,742 9,208,996 - 29,941,738 Repayment (23,562,494) (9,691,224) (39,388) (33,293,106) Non-cash transactions - - 478,384 478,384 Foreign exchange difference (note 21) 141,228 (131) (242) 140,855
As at 30 September 2018 92,716,020 1,816,128 685,964 95,218,112
(a) Long-term loan - Gazprom Neft
As at 30 September 2018 long-term loan - Gazprom Neft amounting to 26,162,094 RSD (31 December 2017:
30,306,970 RSD), with current portion of 5,507,809 RSD (2017: 5,510,358 RSD), relate to loan from Gazprom
Neft granted based on the Agreement for Sale and Purchase of shares signed on 24 December 2008. The
stated liabilities shall be settled in quarterly instalments starting from December 2012 until 15 May 2023.
(b) Bank loans
30 September 2018 31 December 2017
Domestic 53,405,297 43,338,385 Foreign 13,148,629 21,759,189
66,553,926 65,097,574 Current portion of long-term loans (879,338) (339,189)
65,674,588 64,758,385
The maturity of bank loans was as follows:
30 September 2018 31 December 2017
Between 1 and 2 years 11,898,077 23,252,660 Between 2 and 5 years 48,748,360 38,991,710 Over 5 years 5,028,151 2,514,015
65,674,588 64,758,385
The carrying amounts of bank loans are denominated in the following currencies:
The Company repays loans in accordance with agreed dynamics, i.e. determined annuity plans. The
Company has both fixed and floating interest rates with the creditors. Floating interest rates are connected
with Euribor and Libor. Management expects that the Company will be able to fulfill its obligations within
agreed timeframe.
30 September 2018 31 December 2017
USD 355,750 17,934,250 EUR 65,914,486 46,852,899 RSD 688 814 JPY 283,002 309,611
66,553,926 65,097,574

NIS Group
78
The loan agreements contain financial covenants that require the Company's ratio of Indebtedness to
EBITDA. Management believes the Company is in compliance with these covenants as of 30 September
2018 and 31 December 2017, respectively
19. PRODUCTION AND MANUFACTURING EXPENSES
Three-month period ended
30 September Nine-month period ended
30 September
2018 2017 2018 2017
Employee costs 847,637 760,660 2,525,340 2,293,789 Materials and supplies (other than purchased oil, petroleum products and gas)
185,225 226,261 558,469 669,476
Repair and maintenance services 968,013 1,023,678 3,015,198 2,793,300 Electricity for resale 1,876,257 3,198,279 4,495,713 7,392,331 Electricity and utilities 581,066 414,463 1,538,780 1,155,469 Safety and security expense 133,364 91,209 361,828 235,259 Insurance services 68,018 70,755 206,272 211,900 Transportation services for production 490,428 440,506 1,449,303 1,281,143 Other 2,228,948 2,027,837 5,949,253 5,744,092
7,378,956 8,253,648 20,100,156 21,776,759
20. SELLING, GENERAL AND ADMINISTRATIVE EXPENSES
Three-month period ended
30 September Nine-month period ended
30 September
2018 2017 2018 2017
Employee costs 2,460,715 2,363,255 7,400,661 7,009,847
Legal, audit and consulting services 399,579 455,083 1,030,197 1,141,840
Rent expense 30,545 28,629 96,766 93,551
Business trips expense 75,308 85,085 221,119 226,237
Safety and security expense 111,560 112,438 343,152 343,656
Insurance expense 29,473 23,804 81,861 73,179
Transportation and storage 87,366 85,513 255,842 256,120
Allowance for doubtful accounts (183,557) 125,011 (317,036) 78,453
Other 2,224,936 2,080,374 6,428,812 5,971,064
5,235,925 5,359,192 15,541,374 15,193,947
21. NET FOREIGN EXCHANGE GAIN (LOSS)
Three-month period ended
30 September Nine-month period ended
30 September
2018 2017 2018 2017
Foreign exchange gain (loss) on financing activities including: - foreign exchange gain (note 18) 825,425 2,425,796 1,479,949 8,038,567 - foreign exchange loss (note 18) (1,144,083) (136,353) (1,620,804) (584,101) Net foreign exchange gain (loss) on operating activities 81,418 (231,104) (93,846) (1,284,501)
(237,240) 2,058,339 (234,701) 6,169,965

Quarterly Report for 2018 Third Quarter
79
22. FINANCE INCOME
Three-month period ended
30 September Nine month period ended
30 Septembeer
2018 2017 2018 2017
Interest on bank deposits 138,616 206,539 520,435 372,424 Interest income on loans issued 226,194 228,332 664,259 687,120
25,131 156 25,131 156
389,941 435,027 1,209,825 1,059,700
23. FINANCE EXPENSES
Three-month period ended 30
September Six-month period ended 30
September
2018 2017 2018 2017
Interest expense 552,269 727,263 1,725,140 2,316,193
Decommissioning provision: unwinding of the present value discount
23,154 35,942 66,839 103,429
Trade receivables: unwinding of discount
- (63,922) (44,661) (315,289)
Less: interest expense capitalised on qualifying assets
(32,444) (16,198) (83,833) (45,812)
542,979 683,085 1,663,485 2,058,521
24. FAIR VALUE MEASUREMENT
The following assets are measured at fair value in the Interim Condensed Financial Statements: investment
properties and financial investments classified as available for sale. The valuation techniques and inputs
used in fair value measurements are on the same basis as disclosed in the Financial Statements as of 31
December 2017. There were no transfers between the levels of the fair value hierarchy during the interim
period.
As of 30 September 2018 the carrying value of financial assets approximates their fair value. In 2018, the
Company acquired one petrol station in Serbia.
25. BUSINESS COMBINATIONS
The total consideration paid for acquisition amounted to 205,722 RSD. The fair value of net identifiable
asset acquired amounted to 217,660 RSD and remaining amount was recognised as gain on bargain
purchase. The acquisition agreements includes only acquisition of petrol station and do not contain any
contingent consideration.
26. CONTINGENCIES AND COMMITMENTS
Environmental protection
Based on an internal assessment of compliance with the Republic of Serbia environmental legislation as at
the reporting date, the Company’s management recognised an environmental provision in the amount of
649,277 RSD (31 December 2017: 681,162 RSD).
The Company’s Management believes that cash outflows related to provision will not be significantly higher
than the ones already provided for. However, it is possible that these costs will increase significantly in the
future, should the legislation become more restrictive.
Taxes
Tax laws are subject to different interpretations and frequent amendments. Tax authorities’ interpretation
of Tax laws may differ to those made by the Company’s management. As result, some transactions may be

NIS Group
80
disputed by tax authorities and the Company may have to pay additional taxes, penalties and interests. Tax
liability due date is five years. Tax authorities have rights to determine unpaid liabilities within five years
since the transaction date. Management has assessed that the Company has paid all tax liabilities as of 30
September 2018.
Capital commitments
As of 30 September 2018 the Company has entered into contracts to purchase property, plant and
equipment for 10,877,666 RSD (31 December 2017: 11,347,097 RSD).
There were no other material contingencies and commitments of the Company.
27. RELATED PARTY TRANSACTIONS
For the purpose of these Interim Condensed Financial Statements parties are considered to be related if
one party has the ability to control the other party or exercise significant influence over the party in making
financial and operational decision as defined by IAS 24 Related Party disclosure. Related parties may enter
into transactions which unrelated parties might not, and transactions between related parties may not be
effected on the same terms, conditions and amounts as transactions between unrelated parties.
In the nine month period ended 30 September 2018 and in the same period in 2017, the Company entered
into business transactions with its related parties. The most significant transactions with related parties in
the mentioned periods related to supply/delivery of crude oil, petroleum products and energy.
As at 30 September 2018 and 31 December 2017 the outstanding balances with related parties were as
follows:
As at 30 September 2018 Subsidiaries Parent
company
Parent's subsidiaries and
associates
Short-term financial assets 11,072,882 - - Trade and other receivables 4,195,727 - 614,966 Other current assets 16,590 - 76,020 Investments in subsidiaries, associates and joint ventures 13,425,586 - 1,038,800 Long-term financial assets 26,344,384 - - Other non-current assets 11,915 - - Trade and other payables (3,226,205) (6,443,713) (642,731) Other current liabilities (1,057) - (120) Short-term debt and current portion of long-term debt (1,820,339) (5,507,809) - Long-term debt - (20,654,285) -
50,019,483 (32,605,807) 1,086,935
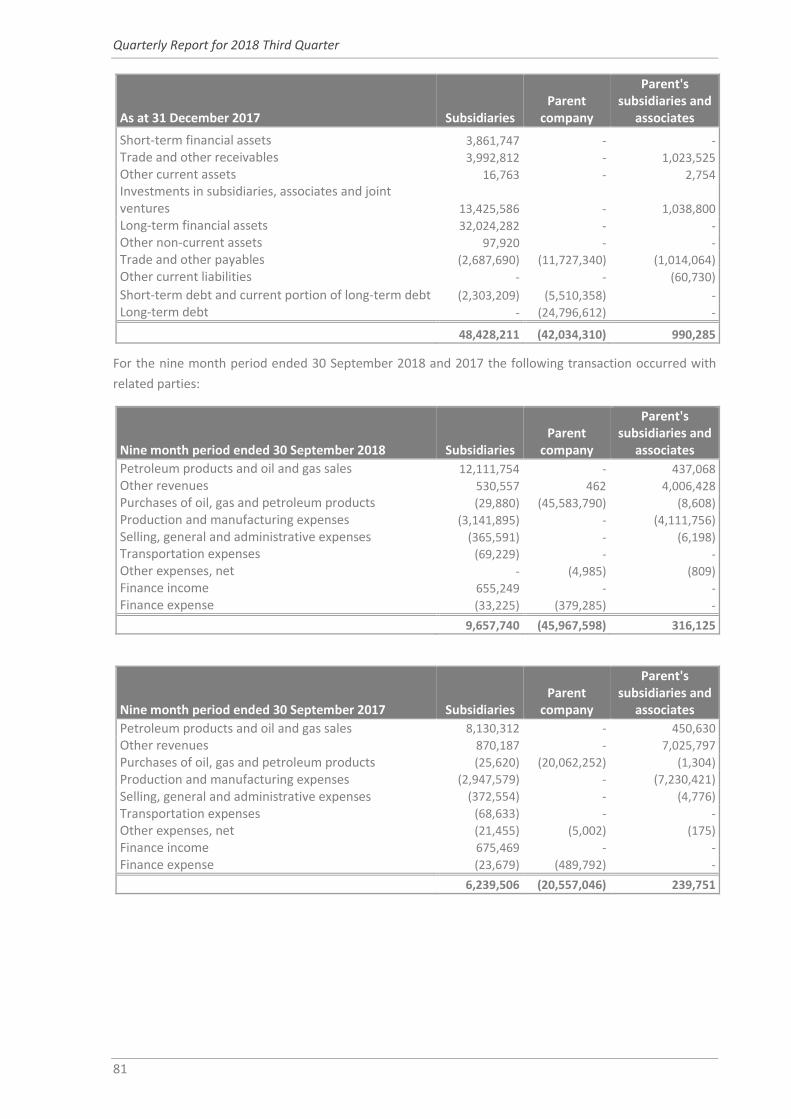
Quarterly Report for 2018 Third Quarter
81
As at 31 December 2017 Subsidiaries Parent
company
Parent's subsidiaries and
associates
Short-term financial assets 3,861,747 - - Trade and other receivables 3,992,812 - 1,023,525 Other current assets 16,763 - 2,754 Investments in subsidiaries, associates and joint ventures 13,425,586 - 1,038,800 Long-term financial assets 32,024,282 - - Other non-current assets 97,920 - - Trade and other payables (2,687,690) (11,727,340) (1,014,064) Other current liabilities - - (60,730)
Short-term debt and current portion of long-term debt (2,303,209) (5,510,358) - Long-term debt - (24,796,612) -
48,428,211 (42,034,310) 990,285
For the nine month period ended 30 September 2018 and 2017 the following transaction occurred with
related parties:
Nine month period ended 30 September 2018 Subsidiaries Parent
company
Parent's subsidiaries and
associates
Petroleum products and oil and gas sales 12,111,754 - 437,068 Other revenues 530,557 462 4,006,428 Purchases of oil, gas and petroleum products (29,880) (45,583,790) (8,608) Production and manufacturing expenses (3,141,895) - (4,111,756) Selling, general and administrative expenses (365,591) - (6,198) Transportation expenses (69,229) - - Other expenses, net - (4,985) (809) Finance income 655,249 - - Finance expense (33,225) (379,285) -
9,657,740 (45,967,598) 316,125
Nine month period ended 30 September 2017 Subsidiaries Parent
company
Parent's subsidiaries and
associates
Petroleum products and oil and gas sales 8,130,312 - 450,630
Other revenues 870,187 - 7,025,797
Purchases of oil, gas and petroleum products (25,620) (20,062,252) (1,304)
Production and manufacturing expenses (2,947,579) - (7,230,421)
Selling, general and administrative expenses (372,554) - (4,776)
Transportation expenses (68,633) - -
Other expenses, net (21,455) (5,002) (175)
Finance income 675,469 - -
Finance expense (23,679) (489,792) -
6,239,506 (20,557,046) 239,751

NIS Group
82
Main balances and transactions with state and state owned companies are shown below:
Parent's subsidiaries and associates Other
As at 30 September 2018
Trade and other receivables (gross)
HIP Petrohemija 2,128,202 -
Srbijagas - 67,288
Other state owned companies - 6,558,213
Trade and other payables
HIP Petrohemija (1,592,636) -
Srbijagas - (95,325)
Other current liabilities
HIP Petrohemija (1,370) -
534,196 6,530,176
As at 31 December 2017
Trade and other receivables (gross)
HIP Petrohemija 1,446,685 -
Srbijagas - 109,748
Republika Srbija - 3,740,763
Other state owned companies - 4,936,110
Trade and other payables
HIP Petrohemija (1,252,736) -
Srbijagas - (77,059)
Other current liabilities
HIP Petrohemija (13,646) -
180,303 8,709,562
Parent's subsidiaries and associates Other
Nine month period ended 30 September 2018 Operating income
HIP Petrohemija 19,494,776 -
Srbijagas - 632,949
Operating expenses
HIP Petrohemija (159,824) -
Srbijagas - (655,684)
19,334,952 (22,735)
Nine month period ended 30 September 2017
Operating income
HIP Petrohemija 15,198,024 -
Srbijagas - 677,478
Operating expenses
HIP Petrohemija (138,725) -
Srbijagas - (691,367)
15,059,299 (13,889)
Transactions with state and state owned companies controlled entities mainly relates to sales of petroleum
products based on the price lists in force and terms that would be available to third parties.

Quarterly Report for 2018 Third Quarter
83
Transactions with Key Management Personnel
For the nine month period ended on 30 September 2018 and 2017 the Company recognized 740,326 RSD
and 743,813 RSD, respectively, as compensation for key management personnel (Chief Executive Officer,
members of the Board of Directors and Advisory Board and Corporate Secretary). Key management
remuneration includes salaries, bonuses and other contributions...

NIS Group
84
Consolidated Financial Statements
Consolidated Statement of Financial Position
Notes 30 September 2018
(unaudited) 31 December 2017
ASSETS
Current assets Cash and cash equivalents 6 23,786,039 27,075,370
Short-term financial assets 7 4,246,448 7,666,968
Trade and other receivables 8 33,285,574 28,671,743
Inventories 9 40,290,065 36,916,942
Other current assets 10 6,008,499 5,806,515
Non-current assets held for sale 163 163
Total current assets 107,616,788 106,137,701
Non-current assets
Property, plant and equipment 11 280,065,933 264,049,497
Investment property 1,603,370 1,530,356
Goodwill and other intangible assets 4,841,294 5,561,145
Investments in associates and joint ventures 2,047,021 2,047,021
Trade and other non-current receivables 73,998 73,411
Long-term financial assets 12 125,364 2,163,760
Deferred tax assets 1,098,808 2,197,910
Other non-current assets 13 3,093,291 3,792,519
Total non-current assets 292,949,079 281,415,619
Total assets 400,565,867 387,553,320
LIABILITIES AND SHAREHOLDER’S EQUITY
Current liabilities
Short-term debt and current portion of long-term debt 14 7,062,792 6,279,124
Trade and other payables 15 35,595,470 35,300,763
Other current liabilities 16 5,430,897 5,589,872
Current income tax payable 810,339 1,952,025
Other taxes payable 17 12,276,416 10,270,700
Provisions for liabilities and charges 2,054,377 2,847,147
Total current liabilities 63,230,291 62,239,631
Non-current liabilities
Long-term debt 18 87,490,723 90,495,878
Long-term trade and other payables 17,936 -
Provisions for liabilities and charges 9,999,051 9,766,303
Total non-current liabilities 97,507,710 100,262,181
Equity
Share capital 81,530,200 81,530,200
Reserves 54,954 40,453
Retained earnings 158,487,802 143,713,351
Equity attributable to the Company’s owners 240,072,956 225,284,004
Non-controlling interest (245,090) (232,496)
Total equity 239,827,866 225,051,508
Total liabilities and shareholder’s equity 400,565,867 387,553,320
All amounts are in 000 RSD, unless otherwise stated

Quarterly Report for 2018 Third Quarter
85
Consolidated Statement of Profit and Loss and Other Comprehensive Income
Three-month period
ended 30 September Nine-month period ended
30 September
Note 2018
(unaudited) 2017
(unaudited) 2018
(unaudited) 2017
(unaudited)
Sales of petroleum products, oil and gas 81,179,259 54,256,212 193,679,540 152,482,858
Other revenues 5,156,921 6,153,370 13,092,222 15,295,658
Total revenue from sales 5 86,336,180 60,409,582 206,771,762 167,778,516
Purchases of oil, gas and petroleum products (52,926,869) (32,397,423) (122,053,855) (90,399,231)
Production and manufacturing expenses 19 (7,838,803) (8,590,678) (20,777,821) (21,676,685)
Selling, general and administrative expenses 20 (5,648,019) (5,770,744) (16,971,996) (16,527,886)
Transportation expenses (347,183) (299,511) (911,648) (796,620)
Depreciation, depletion and amortization (5,131,646) (4,102,384) (14,482,335) (12,209,378)
Taxes other than income tax (1,349,403) (1,184,600) (3,887,590) (3,560,012)
Exploration expenses (41,169) (3,338) (56,940) (10,790)
Total operating expenses (73,283,092) (52,348,678) (179,142,185) (145,180,602)
Other expenses, net (162,377) (362,263) (139,616) (590,994)
Operating profit 12,890,711 7,698,641 27,489,961 22,006,920
Net foreign exchange gain 21 (256,160) 1,967,723 (253,234) 6,081,472
Finance income 22 167,301 210,296 555,237 386,530
Finance expenses 23 (563,828) (706,090) (1,725,828) (2,132,338)
Total other income (expense) (652,687) 1,471,929 (1,423,825) 4,335,664
Profit before income tax 12,238,024 9,170,570 26,066,136 26,342,584
Current income tax expense (1,549,845) (992,805) (3,253,795) (5,005,146)
Deferred tax expense (469,602) (478,259) (1,099,120) (1,221,552)
Total income tax expense (2,019,447) (1,471,064) (4,352,915) (6,226,698)
Profit for the period 10,218,577 7,699,506 21,713,221 20,115,886
Other comprehensive profit (loss):
Components of other comprehensive income that will not be reclassified to profit or loss, net of tax
Revaluation of property, plant and equipment transferred to investment property
- - - 1,399
- - - 1,399
Items that may be subsequently reclassified to profit or loss
Change in value of available-for-sale financial assets (364) 1,326 (950) 3,049
Currency translation differences (30,339) 178,745 12,091 466,103
(30,703) 180,071 11,141 469,152
Other comprehensive profit (loss) for the period (30,703) 180,071 11,141
Total comprehensive income for the period 10,187,874 7,879,577 21,724,362 20,586,437
Profit attributable to:
- Shareholders of Naftna Industrija Srbije 10,222,821 7,704,413 21,725,910 20,131,285
- Non-controlling interest (4,244) (4,907) (12,689) (15,399)
Profit for the period 10,218,577 7,699,506 21,713,221 20,115,886
Total comprehensive income (loss) attributable to:
- Shareholders of Naftna Industrija Srbije 10,192,877 7,881,687 21,736,956 20,593,956
- Non-controlling interest (5,003) (2,110) (12,594) (7,519)
Total comprehensive income for the period 10,187,874 7,879,577 21,724,362 20,586,437

NIS Group
86
Earnings per share attributable to shareholders of Naftna Industrija Srbije
Basic earnings (RSD per share) 62.69 47.25 133.24 123.46
Weighted average number of ordinary shares in issue (in millions) 163 163 163 163
All amounts are in 000 RSD, unless otherwise stated

Quarterly Report for Third Quarter of 2018
87
Consolidated Statement of Changes in Shareholders’ Equity
Nine-month period ended 30 September 2018 and 2017
(unaudited)
Equity attributable to Company’s owners Non-controlling
interest Total equity
Share capital Reserves
Retained earnings Total
Balance as at 1 January 2017 81,530,200 (567,083) 120,731,166 201,694,283 (213,773) 201,480,510
Profit (loss) for the period - - 20,131,285 20,131,285 (15,399) 20,115,886
Other comprehensive income (loss)
Change in value of available-for-sale financial assets - 3,049 - 3,049 - 3,049
Revaluation of intangible assets, property, plant and equipment transferred to investment property - 1,399 - 1,399 - 1,399 Currency translation differences - 458,223 - 458,223 7,880 466,103
Total comprehensive income (loss) for the period - 462,671 20,131,285 20,593,956 (7,519) 20,586,437
Dividend distribution - - (4,021,069) (4,021,069) - (4,021,069)
Total transaction with owners, recorded in equity - - (4,021,069) (4,021,069) - (4,021,069)
Balance as at 30 September 2017 81,530,200 (104,412) 136,841,382 218,267,170 (221,292) 218,045,878
Balance as at 1 January 2018 81,530,200 40,453 143,713,351 225,284,004 (232,496) 225,051,508
Profit (loss) for the period - - 21,725,910 21,725,910 (12,689) 21,713,221
Other comprehensive income (loss)
Change in value of available-for-sale financial assets - (950) - (950) - (950) Sale of available-for-sale financial assets - 3,455 (3,455) - - - Currency translation differences - 11,996 - 11,996 95 12,091
Total comprehensive income (loss) for the period - 14,501 21,722,455 21,736,956 (12,594) 21,724,362
Dividend distribution - - (6,948,004) (6,948,004) - (6,948,004)
Total transaction with owners, recorded in equity - - (6,948,004) (6,948,004) - (6,948,004)
Balance as at 30 September 2018 81,530,200 54,954 158,487,802 240,072,956 (245,090) 239,827,866
All amounts are in 000 RSD, unless otherwise stated

NIS Group
88
Consolidated Statement of Cash Flows89
Nine-month period ended
30 September
Note 2018
(unaudited) 2017
(unaudited)
CASH FLOWS FROM OPERATING ACTIVITIES
Profit before income tax 26,066,136 26,342,584
Adjustments for:
Finance expenses 23 1,725,828 2,132,338
Finance income 22 (555,237) (386,530)
Net unrealised foreign exchange (gain) losses 479,028 (6,229,993)
Depreciation, depletion and amortization 14,482,335 12,209,378 Write-off dry holes 56,940 10,790
Adjustments for other provisions 382,849 335,027
Allowance for doubtful accounts (239,281) 219,210 Payables write-offs (3,266) (3,040)
Other non-cash items 139,174 231,926
Operating cash flow before changes in working capital 42,534,506 34,861,690
Changes in working capital:
Trade and other receivables (4,390,999) 15,954,800
Inventories (3,461,446) (3,435,738)
Other current assets (40,490) (1,410,312)
Trade payables and other current liabilities 1,704,200 (4,204,264)
Other taxes payable 2,016,794 182,148
Total effect on working capital changes (4,171,941) 7,086,634
Income taxes paid (4,471,125) (1,236,163)
Interest paid (1,591,469) (2,161,896)
Interest received 352,071 382,314
Net cash generated from operating activities 32,652,042 38,932,579
CASH FLOWS FROM INVESTING ACTIVITIES
Loans issued (47,250) - Loan proceeds received - 129,779
Capital expenditures90 (31,875,783) (18,872,419)
Proceeds from sale of property, plant and equipment 188,289 116,766
Repayment (placements) of bank deposits 5,602,430 (7,982,453) Other (outflow)/inflow (26,988) (49,321)
Net cash used in investing activities (26,159,302) (26,657,648)
CASH FLOWS FROM FINANCING ACTIVITIES
Proceeds from borrowings 18 20,732,743 28,733,261
Repayment of borrowings 18 (23,562,365) (36,491,816) Repayments of finance lease liabilities (75,894) (74,859) Dividends paid 18 (6,948,004) (4,021,069)
Net cash used in financing activities (9,853,520) (11,854,483)
Net increase (decrease) in cash and cash equivalents (3,360,780) 420,448
Effect of foreign exchange on cash and cash equivalents 71,449 (335,495)
Cash and cash equivalents as of the beginning of the period 27,075,370 22,899,342
Cash and cash equivalents as of the end of the period 23,786,039 22,984,295
All amounts are in 000 RSD, unless otherwise stated
89 Group policy is to present cash flow inclusive of related VAT 90 CF from investments includes VAT in the amount of RSD 3.2 bn (2017: RSD 1.4 bn)

Quarterly Report for 2018 Third Quarter
89
Notes to Consolidated Financial Statements91
1. GENERAL INFORMATION
Open Joint Stock Company Naftna Industrija Srbije, Novi Sad (the “Company”) and its subsidiaries (together
refer to as the “Group”) is a vertically integrated oil company operating predominantly in the Republic of
Serbia. The Group’s principal activities include:
Exploration, production and development of crude oil and gas,
Production of refined petroleum products,
Petroleum products and gas trading and
Electricity generation and trading.
Other activities primarily include sales of other goods, works and services.
The was established in accordance with the Decision of Government of Republic of Serbia on 7 July 2005.
On 2 February 2009 PJSC Gazprom Neft (“Gazprom Neft”) acquired a 51% of the share capital of Naftna
Industrija Srbije which became a subsidiary of Gazprom Neft. In March 2011, under the Company’s Share
Sale and Purchase Agreement, Gazprom Neft acquired an additional 5.15% of shares, thereby increasing its
percentage of ownership to 56.15%. PJSC Gazprom, Russian Federation is the ultimate owner of the Group.
The Company is an open joint stock company, listed on the prime market on the Belgrade Stock Exchange.
These Interim Condensed Consolidated Financial Statements have been approved and authorized for issue
by Chief Executive Officer and will be presented to Board of Directors for approval.
2. SUMMARY OF SIGNIFICANT ACCOUNTING POLICIES
2.1. Basis of preparation
The Group maintains its books and records in accordance with accounting and taxation principles and
practices mandated by legislation in the countries in which it operates (primarily Serbian). The
accompanying Interim Condensed Consolidated Financial Statements were primarily derived from the
Group’s statutory books and records with adjustments and reclassifications made to present them in
accordance with International Financial Reporting Standards (IFRS).
The Interim Condensed Consolidated Financial Statements have been prepared in accordance with
International Accounting Standard IAS 34 Interim Financial Reporting. IAS 34 for interim financial reporting
does not require all disclosures that would be necessarily required by IFRS.
The Group does not disclose information which would substantially duplicate the disclosures contained in
its audited Consolidated Financial Statements for 2017, such as significant accounting policies, significant
estimates and judgements, financial risk disclosures or disclosures of financial line items, which have not
changed significantly in amount or composition. Management of the Group believes that the disclosures in
these Interim Condensed Consolidated Financial Statements are adequate to make the information
presented not misleading if these Interim Condensed Consolidated Financial Statements are read in
conjunction with the Group’s Consolidated Financial Statements for 2017.
Subsequent events occurring after 30 September 2018 were evaluated through 29 October 2018, the date
these Interim Condensed Consolidated Financial Statements were authorised for issue.
91 All amounts are in 000 RSD, unless otherwise stated

NIS Group
90
The results for the Nine month period ended 30 September 2018 are not necessarily indicative of the results
expected for the full year.
The Group as a whole is not subject to significant seasonal fluctuations.
2.2. Changes in significant accounting policies
Significant accounting policies, judgements and estimates applied while preparing these Interim Condensed
Consolidated Financial Statements are consistent with those applied during the preparation of Consolidated
Financial Statements as of and for the year ended 31 December 2017, except for those described in the
Application of new IFRS paragraph.
3. APPLICATION OF NEW IFRS
Accounting policies applied from 1 January 2018
IFRS 9 – Financial Instruments (amended in July 2014 and effective for annual periods beginning on or
after 1 January 2018). From 1 January 2018 the Group classifies its financial assets in the following
measurement categories: those to be measured subsequently at fair value through profit or loss (FVPL),
those to be measured subsequently at fair value through other comprehensive income (FVOCI), and those
to be measured subsequently at amortized cost.
The classification of debt instruments depends on the organization's business model for managing financial
assets and whether contractual cash flows of an asset give rise to payments on specified dates that are
solely payments of principal and interest (“SPPI”).
The Group presents in OCI changes in the fair value of all its equity investments previously classified as
available-for-sale, because these investments are held as long-term strategic investments that are not
expected to be sold in the short-to-medium term.
Financial assets and liabilities previously classified in accordance with IAS 39 “Financial Instruments:
Recognition and Measurement” within categories loans and receivables, investments held to maturity and
other financial liabilities measured at amortised cost using the effective interest method, in accordance
with IFRS 9 “Financial instruments” are classified as financial assets and financial liabilities carried at
amortised cost. Measurement of cash and cash equivalents, trade and other receivables and payables, long-
term and short-term loans and investments, held-to-maturity investments has not changed and these
financial instruments are measured at amortised cost.
IFRS 15 – Revenue from Contracts with Customers (amended in April 2016 and effective for annual
periods beginning on or after 1 January 2018). The Group recognizes revenue from sales of crude oil,
petroleum products, gas and other products and services when it satisfies a performance obligation and
control over goods and services is passed. For the most contracts control over goods or services passes to
a customer at point of time and consideration is unconditional because only the passage of time is required
before the payment is due.
The transaction price excludes amounts collected on behalf of third parties such as value added tax and
sales related tax.
4. NEW ACCOUNTING STANDARDS
Certain new standards and interpretations have been issued that are mandatory for the annual periods
beginning on 1 January 2018 or later, and that the Group has not early adopted.
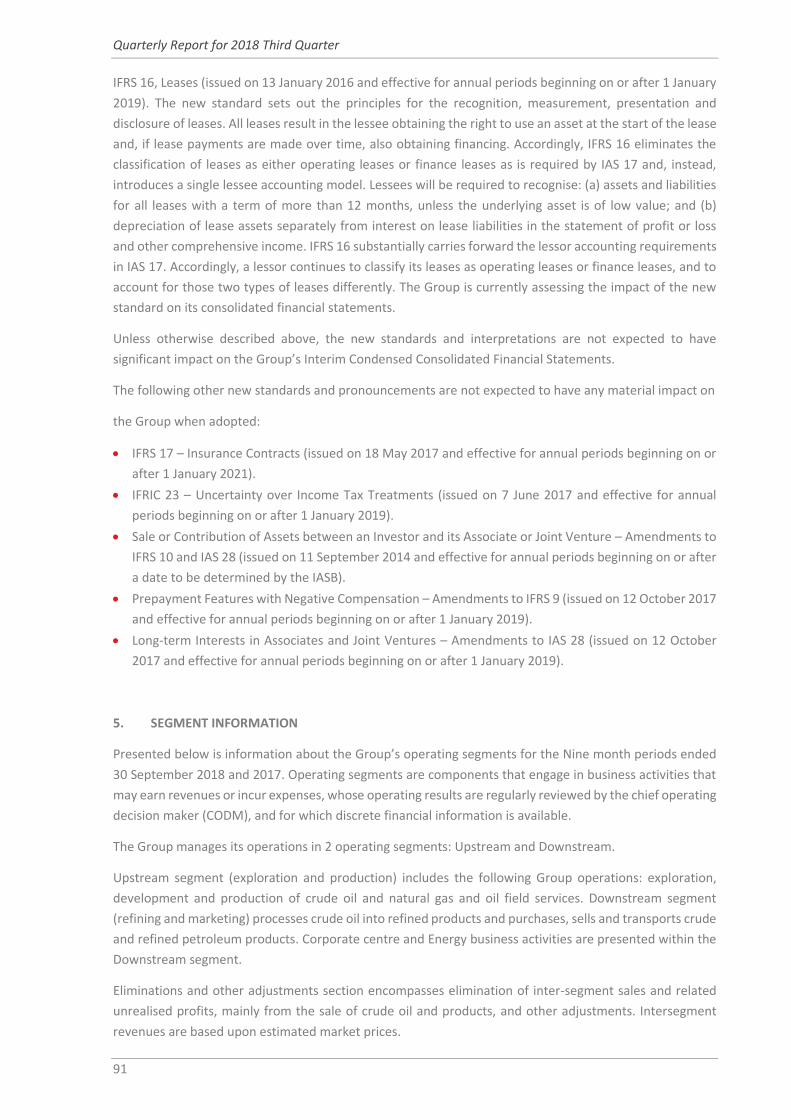
Quarterly Report for 2018 Third Quarter
91
IFRS 16, Leases (issued on 13 January 2016 and effective for annual periods beginning on or after 1 January
2019). The new standard sets out the principles for the recognition, measurement, presentation and
disclosure of leases. All leases result in the lessee obtaining the right to use an asset at the start of the lease
and, if lease payments are made over time, also obtaining financing. Accordingly, IFRS 16 eliminates the
classification of leases as either operating leases or finance leases as is required by IAS 17 and, instead,
introduces a single lessee accounting model. Lessees will be required to recognise: (a) assets and liabilities
for all leases with a term of more than 12 months, unless the underlying asset is of low value; and (b)
depreciation of lease assets separately from interest on lease liabilities in the statement of profit or loss
and other comprehensive income. IFRS 16 substantially carries forward the lessor accounting requirements
in IAS 17. Accordingly, a lessor continues to classify its leases as operating leases or finance leases, and to
account for those two types of leases differently. The Group is currently assessing the impact of the new
standard on its consolidated financial statements.
Unless otherwise described above, the new standards and interpretations are not expected to have
significant impact on the Group’s Interim Condensed Consolidated Financial Statements.
The following other new standards and pronouncements are not expected to have any material impact on
the Group when adopted:
IFRS 17 – Insurance Contracts (issued on 18 May 2017 and effective for annual periods beginning on or
after 1 January 2021).
IFRIC 23 – Uncertainty over Income Tax Treatments (issued on 7 June 2017 and effective for annual
periods beginning on or after 1 January 2019).
Sale or Contribution of Assets between an Investor and its Associate or Joint Venture – Amendments to
IFRS 10 and IAS 28 (issued on 11 September 2014 and effective for annual periods beginning on or after
a date to be determined by the IASB).
Prepayment Features with Negative Compensation – Amendments to IFRS 9 (issued on 12 October 2017
and effective for annual periods beginning on or after 1 January 2019).
Long-term Interests in Associates and Joint Ventures – Amendments to IAS 28 (issued on 12 October
2017 and effective for annual periods beginning on or after 1 January 2019).
5. SEGMENT INFORMATION
Presented below is information about the Group’s operating segments for the Nine month periods ended
30 September 2018 and 2017. Operating segments are components that engage in business activities that
may earn revenues or incur expenses, whose operating results are regularly reviewed by the chief operating
decision maker (CODM), and for which discrete financial information is available.
The Group manages its operations in 2 operating segments: Upstream and Downstream.
Upstream segment (exploration and production) includes the following Group operations: exploration,
development and production of crude oil and natural gas and oil field services. Downstream segment
(refining and marketing) processes crude oil into refined products and purchases, sells and transports crude
and refined petroleum products. Corporate centre and Energy business activities are presented within the
Downstream segment.
Eliminations and other adjustments section encompasses elimination of inter-segment sales and related
unrealised profits, mainly from the sale of crude oil and products, and other adjustments. Intersegment
revenues are based upon estimated market prices.

NIS Group
92
EBITDA represents the Group’s EBITDA. Management believes that EBITDA represents useful means of
assessing the performance of the Group's ongoing operating activities, as it reflects the Group's earnings
trends without showing the impact of certain charges. EBITDA is defined as earnings before interest, income
tax expense, depreciation, depletion and amortization, finance income (expenses) net and other non-
operating income (expenses). EBITDA is a supplemental non-IFRS financial measure used by management
to evaluate operations.
Reportable segment results for the Nine month period ended 30 September 2018 and 2017 are shown in
the table below:
Upstream Downstream Eliminations Total
Nine month period ended 30 September 2018
Segment revenue 38,739,966 207,302,660 (39,270,864) 206,771,762
Intersegment 37,576,442 1,694,422 (39,270,864) -
External 1,163,524 205,608,238 - 206,771,762
EBITDA (Segment results) 28,766,037 13,253,230 - 42,019,267
Depreciation, depletion and amortization (7,296,139) (7,186,196) - (14,482,335
)
Impairment of non-financial assets (3,477) (21,164) - (24,641)
Net foreign exchange gain (loss) (53,776) (199,458) - (253,234)
Finance income (expenses), net (6,205) (1,164,386) - (1,170,591)
Income tax (216,557) (4,136,358) - (4,352,915)
Segment profit/(loss) 21,075,219 638,001 - 21,713,220
Nine month period ended 30 September 2017
Segment revenue 31,433,942 169,103,459 (32,758,885) 167,778,516
Intersegment 30,439,235 2,319,650 (32,758,885) -
External 994,707 166,783,809 - 167,778,516
EBITDA (Segment results) 22,709,283 11,549,299 - 34,258,582
Depreciation, depletion and amortization (5,035,652) (7,173,726) - (12,209,378
)
Impairment of non-financial assets - (23,506) - (23,506)
Net foreign exchange gain 315,538 5,765,934 - 6,081,472
Finance income (expenses), net (89,487) (1,656,321) - (1,745,808)
Income tax (2,136,528) (4,090,170) - (6,226,698)
Segment profit/(loss) 15,639,263 4,476,623 - 20,115,886
EBITDA for the nine month period ended 30 September 2018 and 2017 is reconciled below:
Three-month period ended
30 September Six month period ended
30 September
2018 2017 2018 2017 Profit for the period 10,218,577 7,699,506 21,713,221 20,115,886
Income tax expenses 2,019,447 1,471,064 4,352,915 6,226,698
Finance expenses 563,828 706,090 1,725,828 2,132,338
Finance income (167,301) (210,296) (555,237) (386,530)
Depreciation, depletion and amortization
5,131,646 4,102,384 14,482,335 12,209,378
Net foreign exchange gain 256,160 (1,967,723) 253,234 (6,081,472)
Other expense, net 162,377 362,263 139,616 590,994
Other non-operating income, net (121,590) (445,783) (92,645) (548,710)
EBITDA 18,063,144 11,717,505 42,019,267 34,258,582

Quarterly Report for 2018 Third Quarter
93
Oil, gas and petroleum products sales comprise the following (based on the country of customer
incorporation):
Nine month period ended 30 September 2018
Domestic market Export and International sales Total
Sale of crude oil - 1,056,256 1,056,256
Sale of gas 1,410,169 - 1,410,169
Through a retail network - - -
Wholesale activities 1,410,169 - 1,410,169
Sale of petroleum products 141,366,475 49,846,641 191,213,116
Through a retail network 46,145,292 12,847,141 58,992,433 Wholesale activities 95,221,183 36,999,500 132,220,683
Sale of electricity 478,885 4,453,682 4,932,567
Other sales 5,464,714 2,694,940 8,159,654
Total sales 148,720,243 58,051,519 206,771,762
Nine-month period ended 30 September 2017
Domestic market Export and International sales Total
Sale of crude oil - 891,183 891,183
Sale of gas 1,906,477 - 1,906,477 Through a retail network - - - Wholesale activities 1,906,477 - 1,906,477
Sale of petroleum products 113,816,619 35,868,579 149,685,198 Through a retail network 40,667,665 11,951,100 52,618,765 Wholesale activities 73,148,954 23,917,479 97,066,433
Sale of electricity 343,791 7,545,629 7,889,420 Other sales 4,869,878 2,536,360 7,406,238
Total sales 120,936,765 46,841,751 167,778,516
Out of the amount of 132,220,683 RSD (2017: 97,066,433 RSD) revenue from sale of petroleum products
(wholesale), the amount of 19,494,776 RSD (2017: 15,198,024 RSD) are derived from a single domestic
customer HIP Petrohemija. These revenue are attributable to wholesale activities within Downstream
segment.
Sales of electricity mainly relates to trading with Gazprom Marketing & Trading Co., Ltd. in the amount of
3,988,435 RSD (2017: 7,022,733 RSD). These sales are presented within Downstream segment.
Other sales mainly relate to sales of non-fuel products at petrol stations in the amount of 6,256,032 RSD
(2017: 5,799,782 RSD).
The Group is domiciled in the Republic of Serbia. The revenue from external customers in the Republic of
Serbia is 148,720,243 RSD (2017: 120,936,765 RSD), and the total revenue from external customer from
other countries is 58,051,519 RSD (2017: 46,841,751 RSD).
The breakdown of the major component of the total revenue from external customers from other countries
is disclosed below:

NIS Group
94
The breakdown of the major component of the total revenue from external customers from other countries
is disclosed below:
Nine-month period ended 30
September
2018 2017
Sale of crude oil 1,056,256 891,183
Sale of petroleum products (retail and wholesale)
Bulgaria 13,471,675 9,761,132
Bosnia and Herzegovina 13,059,904 8,897,726
Romania 10,827,763 7,606,850
All other markets 12,487,298 9,602,871
49,846,641 35,868,579
Sale of electricity 4,453,682 7,545,629
Other sales 2,694,940 2,536,360
58,051,519 46,841,751
Revenues from the individual countries included in all other markets are not material.
Non-current assets, other than financial instruments and deferred income tax assets (there are no
employment benefit assets and rights arising under insurance contracts), by country:
30 September 2018 31 December 2017
Serbia 263,952,692 249,437,031 Bulgaria 7,151,373 7,334,652 Bosnia and Herzegovina 7,194,839 7,401,758 Romania 8,211,693 6,967,529 Hungary - 28
286,510,597 271,140,998
6. CASH AND CASH EQUIVALENTS
30 September 2018 31 December 2017
Cash in bank and in hand 13,219,134 15,897,022 Deposits with original maturity of less than three months 8,912,666 9,417,753 Cash held on escrow account 1,434,684 1,521,241 Cash equivalents 219,555 239,354
23,786,039 27,075,370
Cash held on escrow accounts as of 30 September 2018 amounting to 1,434,684 RSD (31 December 2017:
1,521,241 RSD) mostly relates to deposited funds in accordance with the interest in a joint venture through
which the operation of future wind farm ‘’Plandiste’’ will be managed. According to the Agreement, the
Group can withdraw cash at any time.
7. SHORT-TERM FINANCIAL ASSETS
30 September 2018 31 December 2017
Short-term loans 50,838 2,210 Deposits with original maturity more than 3 months less than 1 year 4,186,617 7,645,689 Other short-term financial assets 11,249 21,325 Less impairment loss provision (2,256) (2,256)
4,246,448 7,666,968
As at 30 September 2018 deposits with original maturity more than 3 months less than 1 year amounting
to 4,141,943 RSD (31 December 2017: 7,645,689 RSD) relates to bank deposits placements with interest

Quarterly Report for 2018 Third Quarter
95
rates from 4,15% to 4,65% p.a. denominated in RSD.
8. TRADE AND OTHER RECEIVABLES
30 September 2018 31 December 2017
Trade receivables:
- related parties 616,118 1,024,133
- third parties 34,383,911 28,265,729
- state and state owned companies 8,753,703 10,233,306
43,753,732 39,523,168
Other receivables – related parties 328,358 269,242
Accrued assets 246,337 227,630
44,328,427 40,020,040
Less impairment provision for trade and other receivables:
- third parties (9,281,754) (9,483,852)
- state and state owned companies (1,761,099) (1,864,445)
(11,042,853) (11,348,297)
Total trade and other receivables 33,285,574 28,671,743
The ageing of trade and other receivables is as follows:
30 September 2018 31 December 2017
Neither impaired nor past due 29,214,472 25,624,198 Past due but not impaired:
within 30 days 2,264,275 2,156,358 1 to 3 months 1,021,392 237,143 3 months to 1 year 230,413 146,553
over 1 year 555,022 507,491
Total 33,285,574 28,671,743
Group management believes that net receivables included in the ageing table above are fully recoverable.
The carrying amounts of the Group’s trade and other receivables are denominated in the following
currencies:
30 September 2018 31 December 2017
RSD 29,139,096 21,681,702 EUR 1,090,651 4,283,546 USD 1,264,235 982,442 Other 1,791,592 1,724,053
33,285,574 28,671,743

NIS Group
96
Movements on the Group’s impairment provision for of trade and other receivables are as follows:
Trade & other receivables
Third parties State and state
owned companies Total
As at 1 January 2017 9,728,531 11,563,533 21,292,064
Provision for receivables impairment 264,701 19,907 284,608
Release of provision (147,255) (19,983) (167,238)
Receivables written off during the year as uncollectible (24,074) - (24,074) Unwinding of discount (note 23) - (100,225) (100,225) Transfer from non-curent part - 208,808 208,808
Exchange differences (449) (323,771) (324,220)
Other (53,098) (1) (53,099)
As at 30 September 2017 9,768,356 11,348,268 21,116,624
As at 1 January 2018 9,483,852 1,864,445 11,348,297
Provision for receivables impairment 93,119 4,133 97,252
Release of provision (260,024) (85,258) (345,282)
Receivables written off during the year as uncollectible (10,772) (3,534) (14,306)
Unwinding of discount (note 23) - (44,661) (44,661)
Exchange differences 1,676 - 1,676
Other (26,097) 25,974 (123)
As at 30 September2018 9,281,754 1,761,099 11,042,853
Expenses that have been provided for or written off are included in selling, general and administrative
expenses within the Consolidated Profit and Loss. Amounts charged to the allowance account are generally
written off where there is no expectation of recovering additional cash.
The maximum exposure to credit risk at the reporting date is the carrying value of each class of receivables
mentioned above. The other classes within trade and other receivables do not contain impaired assets.
9. INVENTORIES
30 September 2018 31 December 2017
Crude oil 23,001,364 22,312,814 Petroleum products 13,632,972 12,708,119 Materials and supplies 7,628,839 5,918,849 Other 999,012 1,085,655
Less impairment provision (4,972,122) (5,108,495)
40,290,065 36,916,942
10. OTHER CURRENT ASSETS
30 September 2018 31 December 2017
Advances paid 889,625 666,931 VAT receivables 458,142 286,562
Deferred VAT 2,103,930 1,419,963 Prepaid expenses 394,688 236,846 Prepaid custom duties 32,204 32,368 Prepaid excise 1,844,017 1,898,628 Other current assets 12,238,129 13,213,771
Less impairment provision (11,952,236) (11,948,554)
6,008,499 5,806,515

Quarterly Report for 2018 Third Quarter
97
Deferred VAT as at 30 September 2018 amounting to 2,103,930 RSD (31 December 2017: 1,419,963 RSD)
represents VAT inputs claimed on invoices received and accounted for in the current period, while the
inputs will be allowed in the following accounting period.
Prepaid excise as at 30 September 2018 amounting to 1,844,017 RSD (31 December 2017: 1,898,628 RSD)
relates to the excise paid for finished products stored in non-excise warehouse.
Other current assets mainly relate to accrued interests and claims in dispute which are impaired.
Movements on the Group’s impairment provision for of other current assets are as follows:
Advances paid Other current assets Total
As at 1 January 2017 261,983 11,736,780 11,998,763 Increase of provision during the year 5,253 135,855 141,108 Release of provision (340) (55,253) (55,593) Receivables written off during the year as uncollectible - (36,339) (36,339) Other - 50,324 50,324
As at 30 September 2017 266,896 11,831,367 12,098,263
As at 1 January 2018 261,100 11,687,454 11,948,554 Increase of provision during the year 1,962 16,719 18,681 Release of provision (822) (13,612) (14,434) Receivables written off during the year as uncollectible - (3,936) (3,936) Other - 3,371 3,371
As at 30 September 2018 262,240 11,689,996 11,952,236
The ageing of other current assets is as follows:
30 September 2018 31 December 2017
Neither impaired nor past due 249,008 1,294,564
Not impaired and past due in the following periods: Less than 1 month 6,528 11,365
1 - 3 months 5,588 7,147 3 month - 1 year 64,281 36,055 Over 1 year 80,357 41,710
Total 405,762 1,390,841
Net amount of other current assets shown in ageing analysis does not include non-financial assets like
VAT, excise etc.

NIS Group
98
11. PROPERTY, PLANT AND EQUIPMENT
Oil and gas properties Refining assets Marketing and distribution assets Other assets Assets under construction Total
As at 1 January 2017 Cost 127,806,623 110,525,127 65,310,661 20,170,463 34,864,554 358,677,428 Depreciation and impairment (30,936,760) (35,174,792) (27,816,298) (9,600,428) (1,388,883) (104,917,161)
Net book value 96,869,863 75,350,335 37,494,363 10,570,035 33,475,671 253,760,267
Period ended 30September2017 Additions - - 405 626 16,666,535 16,667,566 Changes in decommissioning obligations 134,606 - - - - 134,606 Transfer from assets under construction 13,995,221 2,106,526 1,138,318 266,715 (17,506,780) - Transfer to investment property - - (22,698) (2,313) - (25,011) Transfer to non-current assets held for sale - (14,361) - (101,798) - (116,159) Impairment - - (20,874) - (8,059) (28,933) Depreciation (4,724,287) (4,255,052) (1,750,299) (593,011) (3,689) (11,326,338) Disposals and write-off (19,258) (7,610) (139,870) (4,561) (93,706) (265,005) Other transfers (41,023) (141,282) (37,370) 178,313 43,149 1,787 Translation differences 18 - (539,176) 2,317 (231,818) (768,659)
106,215,140 73,038,556 36,122,799 10,316,323 32,341,303 258,034,121 As at 30 September 2017 Cost 141,743,684 112,400,575 65,304,481 20,356,786 34,461,379 374,266,905 Depreciation and impairment (35,528,544) (39,362,019) (29,181,682) (10,040,463) (2,120,076) (116,232,784)
Net book value 106,215,140 73,038,556 36,122,799 10,316,323 32,341,303 258,034,121
As at 1 January 2018 Cost 147,452,224 114,239,048 65,305,683 20,338,124 36,549,810 383,884,889 Depreciation and impairment (37,114,232) (40,818,582) (29,653,958) (10,189,787) (2,058,833) (119,835,392)
Net book value 110,337,992 73,420,466 35,651,725 10,148,337 34,490,977 264,049,497
Period ended 30 September 2018 Additions - - 1 996 30,321,808 30,322,805 Acquisitions through business combinations - - - - 217,660 217,660 Changes in decommissioning obligations 158,576 - - - - 158,576 Transfer from assets under construction 12,017,033 1,386,171 3,610,329 286,764 (17,300,297) - Transfer to investment property - - (81,328) - - (81,328) Impairment - - (23,931) - (13,419) (37,350) Depreciation (6,980,077) (4,182,159) (1,880,370) (576,370) (3,606) (13,622,582) Disposals and write-off (36,445) (72,932) (17,725) (11,919) (780,408) (919,429) Other transfers 1,980,026 (1,400,947) 20,705 (610,504) 4,423 (6,297) Translation differences (3) (1) (9,519) 64 (6,160) (15,619)
117,477,102 69,150,598 37,269,887 9,237,368 46,930,978 280,065,933 As at 30 September 2018 Cost 162,078,885 113,765,056 69,303,362 18,998,144 49,006,803 413,152,250 Depreciation and impairment (44,601,783) (44,614,458) (32,033,475) (9,760,776) (2,075,825) (133,086,317)
Net book value 117,477,102 69,150,598 37,269,887 9,237,368 46,930,978 280,065,933

NIS Group
99
Oil and gas production assets
Capitalised exploration
and evaluation
expenditure
Capitalised development
expenditure
Total - asset under construction
(exploration and development expenditure)
Production assets
Other business
and corporate
assets Total
As at 1 January 2017 Cost 20,139,905 4,274,452 24,414,357 127,806,623 31,406 152,252,386
Depreciation and impairment (26,494) (876) (27,370) (30,936,760) (20,312)
(30,984,442)
Net book amount 20,113,411 4,273,576 24,386,987 96,869,863 11,094 121,267,944
Period ended 30 September 2017
Additions 3,701,099 9,228,980 12,930,079 - - 12,930,079 Changes in decommissioning obligations
- - - 134,606 - 134,606
Transfer from asset under construction
(3,089,976) (10,904,350) (13,994,326) 13,995,221 (895) -
Other transfers (856,887) 831,107 (25,780) (41,023) 975 (65,828) Depreciation and depletion (3,689) - (3,689) (4,724,287) (38) (4,728,014) Disposals and write-off (71,897) (18,913) (90,810) (19,258) - (110,068) Translation differences (222,796) - (222,796) 18 (4) (222,782)
19,569,265 3,410,400 22,979,665 106,215,140 11,132 129,205,937 As at 30 September 2017 Cost 19,595,020 3,411,276 23,006,296 141,743,684 32,342 164,782,322 Depreciation and impairment (25,755) (876) (26,631) (35,528,544) (21,210) (35,576,385)
Net book amount 19,569,265 3,410,400 22,979,665 106,215,140 11,132 129,205,937
As at 1 January 2018 Cost 19,004,026 2,929,684 21,933,710 147,452,224 32,323 169,418,257 Depreciation and impairment (58,882) (2,087) (60,969) (37,114,232) (21,223) (37,196,424)
Net book amount 18,945,144 2,927,597 21,872,741 110,337,992 11,100 132,221,833
Period ended 30 September 2018
Additions 3,930,570 10,009,004 13,939,574 - - 13,939,574 Changes in decommissioning obligations
- - - 158,576 - 158,576
Transfer from asset under construction
(1,942,257) (10,074,776) (12,017,033) 12,017,033 - -
Other transfers 445,236 (448,796) (3,560) 1,980,026 140 1,976,606 Impairment - (3,477) (3,477) - - (3,477) Depreciation and depletion (3,606) - (3,606) (6,980,077) - (6,983,683) Disposals and write-off (748,521) (15,507) (764,028) (36,445) (2) (800,475) Translation differences (7,001) - (7,001) (3) - (7,004)
20,619,565 2,394,045 23,013,610 117,477,102 11,238 140,501,950 As at 30 September 2018 Cost 20,682,022 2,399,609 23,081,631 162,078,885 31,549 185,192,065 Depreciation and impairment (62,457) (5,564) (68,021) (44,601,783) (20,311) (44,690,115)
Net book amount 20,619,565 2,394,045 23,013,610 117,477,102 11,238 140,501,950
20,619,565 2,394,045 23,013,610 117,477,102 11,238 140,501,950
12. LONG-TERM FINANCIAL ASSETS
30 September 2018 31 December 2017
Deposits with original maturity more than 1 year - 2,029,483
Available for sale financial assets 173,890 187,310
Other LT placements 25,882 26,567
Less provision of available for sale financial assets (61,848) (67,392)
Less provision of other LT placements (12,560) (12,208)
125,364 2,163,760
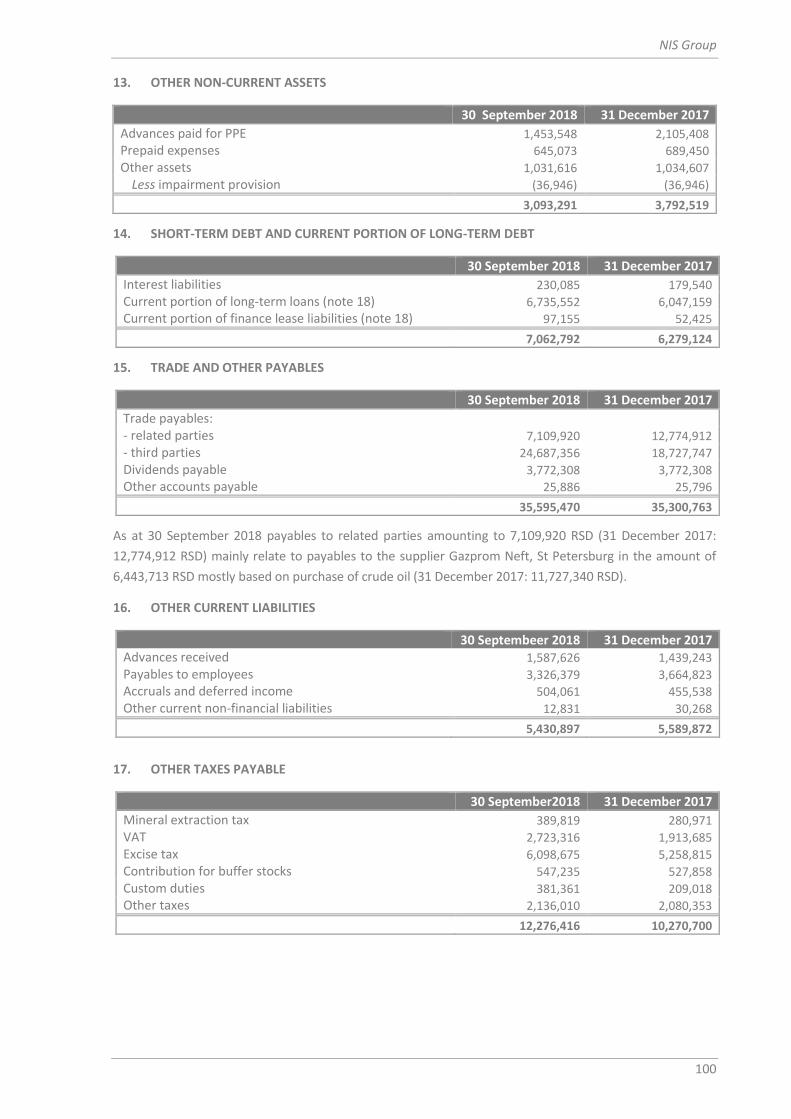
NIS Group
100
13. OTHER NON-CURRENT ASSETS
30 September 2018 31 December 2017
Advances paid for PPE 1,453,548 2,105,408 Prepaid expenses 645,073 689,450 Other assets 1,031,616 1,034,607
Less impairment provision (36,946) (36,946)
3,093,291 3,792,519
14. SHORT-TERM DEBT AND CURRENT PORTION OF LONG-TERM DEBT
30 September 2018 31 December 2017
Interest liabilities 230,085 179,540 Current portion of long-term loans (note 18) 6,735,552 6,047,159 Current portion of finance lease liabilities (note 18) 97,155 52,425
7,062,792 6,279,124
15. TRADE AND OTHER PAYABLES
30 September 2018 31 December 2017
Trade payables:
- related parties 7,109,920 12,774,912
- third parties 24,687,356 18,727,747
Dividends payable 3,772,308 3,772,308
Other accounts payable 25,886 25,796
35,595,470 35,300,763
As at 30 September 2018 payables to related parties amounting to 7,109,920 RSD (31 December 2017:
12,774,912 RSD) mainly relate to payables to the supplier Gazprom Neft, St Petersburg in the amount of
6,443,713 RSD mostly based on purchase of crude oil (31 December 2017: 11,727,340 RSD).
16. OTHER CURRENT LIABILITIES
30 Septembeer 2018 31 December 2017 Advances received 1,587,626 1,439,243 Payables to employees 3,326,379 3,664,823 Accruals and deferred income 504,061 455,538 Other current non-financial liabilities 12,831 30,268
5,430,897 5,589,872
17. OTHER TAXES PAYABLE
30 September2018 31 December 2017
Mineral extraction tax 389,819 280,971 VAT 2,723,316 1,913,685 Excise tax 6,098,675 5,258,815 Contribution for buffer stocks 547,235 527,858 Custom duties 381,361 209,018 Other taxes 2,136,010 2,080,353
12,276,416 10,270,700

Quarterly Report for 2018 Third Quarter
101
18. LONG-TERM DEBT
30 September 2018 31 December 2017
Long-term loan - Gazprom Neft 26,162,094 30,306,970 Bank and other long term loans 67,252,504 65,796,475 Finance lease liabilities 870,149 432,562 Other long-term borrowings 38,683 59,455
Less Current portion (note 14) (6,832,707) (6,099,584)
87,490,723 90,495,878
Movements on the Group’s liabilities from finance activities are as follows:
Long-term
loans Short-term loans
(note 14) Finance
lease Total
As at 1 January 2017 103,449,326 12,189,945 343,080 115,982,351 Proceeds 28,733,261 - - 28,733,261 Repayment (24,459,383) (12,032,433) (74,859) (36,566,675) Non-cash transactions - - 141,992 141,992 Foreign exchange difference (note 21) (7,313,924) (157,512) (7,272) (7,478,708) As at 30 September 2017 100,409,280 - 402,941 100,812,221
As at 1 January 2018 96,103,445 - 432,562 96,536,007 Proceeds 20,732,743 - - 20,732,743 Repayment (23,562,365) - (75,894) (23,638,259) Non-cash transactions - - 513,916 513,916 Foreign exchange difference (note 21) 140,775 - (435) 140,340
As at 30 September 2018 93,414,598 - 870,149 94,284,747
(a) Long-term loan - Gazprom Neft
As at 30 September 2018 long-term loan - Gazprom Neft amounting to 26,162,094 RSD (31 December 2017:
30,306,970 RSD), with current portion of 5,507,809 RSD (2017: 5,510,358 RSD), relate to loan from Gazprom
Neft granted based on the Agreement for Sale and Purchase of shares signed on 24 December 2008. The
stated liabilities shall be settled in quarterly instalments starting from December 2012 until 15 May 2023.
(b) Bank and other long-term loans
30 September 2018 31 December 2017
Domestic 53,405,297 43,338,384 Foreign 13,847,207 22,458,091
67,252,504 65,796,475 Current portion of long-term loans (1,227,744) (536,801)
66,024,760 65,259,674
The maturity of bank and other long term loans was as follows:
30 September 2018 31 December 2017
Between 1 and 2 years 12,096,484 23,403,612 Between 2 and 5 years 48,900,441 39,342,047 Over 5 years 5,027,835 2,514,015
66,024,760 65,259,674
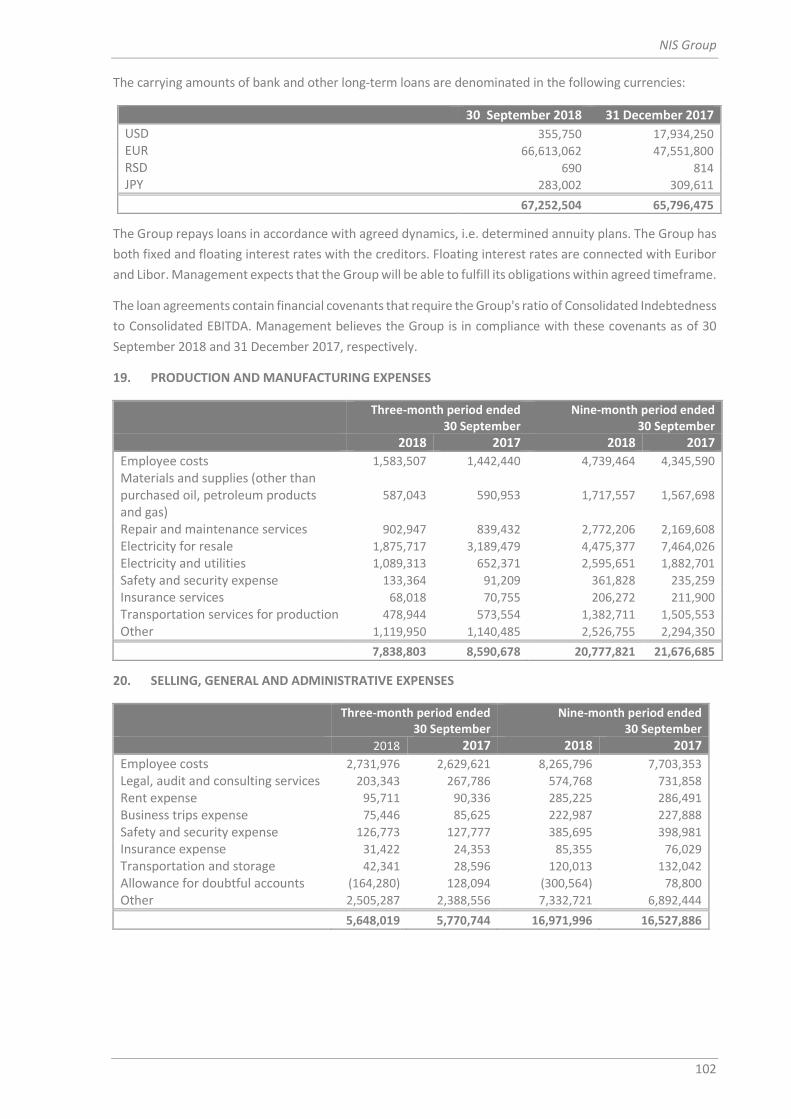
NIS Group
102
The carrying amounts of bank and other long-term loans are denominated in the following currencies:
The Group repays loans in accordance with agreed dynamics, i.e. determined annuity plans. The Group has
both fixed and floating interest rates with the creditors. Floating interest rates are connected with Euribor
and Libor. Management expects that the Group will be able to fulfill its obligations within agreed timeframe.
The loan agreements contain financial covenants that require the Group's ratio of Consolidated Indebtedness
to Consolidated EBITDA. Management believes the Group is in compliance with these covenants as of 30
September 2018 and 31 December 2017, respectively.
19. PRODUCTION AND MANUFACTURING EXPENSES
Three-month period ended
30 September Nine-month period ended
30 September
2018 2017 2018 2017
Employee costs 1,583,507 1,442,440 4,739,464 4,345,590 Materials and supplies (other than purchased oil, petroleum products and gas)
587,043 590,953 1,717,557 1,567,698
Repair and maintenance services 902,947 839,432 2,772,206 2,169,608 Electricity for resale 1,875,717 3,189,479 4,475,377 7,464,026 Electricity and utilities 1,089,313 652,371 2,595,651 1,882,701 Safety and security expense 133,364 91,209 361,828 235,259 Insurance services 68,018 70,755 206,272 211,900 Transportation services for production 478,944 573,554 1,382,711 1,505,553 Other 1,119,950 1,140,485 2,526,755 2,294,350
7,838,803 8,590,678 20,777,821 21,676,685
20. SELLING, GENERAL AND ADMINISTRATIVE EXPENSES
Three-month period ended
30 September Nine-month period ended
30 September
2018 2017 2018 2017
Employee costs 2,731,976 2,629,621 8,265,796 7,703,353 Legal, audit and consulting services 203,343 267,786 574,768 731,858 Rent expense 95,711 90,336 285,225 286,491 Business trips expense 75,446 85,625 222,987 227,888 Safety and security expense 126,773 127,777 385,695 398,981 Insurance expense 31,422 24,353 85,355 76,029 Transportation and storage 42,341 28,596 120,013 132,042 Allowance for doubtful accounts (164,280) 128,094 (300,564) 78,800 Other 2,505,287 2,388,556 7,332,721 6,892,444
5,648,019 5,770,744 16,971,996 16,527,886
30 September 2018 31 December 2017
USD 355,750 17,934,250 EUR 66,613,062 47,551,800 RSD 690 814 JPY 283,002 309,611
67,252,504 65,796,475

Quarterly Report for 2018 Third Quarter
103
21. NET FOREIGN EXCHANGE GAIN (LOSS)
Three-month period ended
30 September Nine-month period ended
30 September
2018 2017 2018 2017
Foreign exchange gain (loss) on financing activities including: - foreign exchange gain 860,120 (4,713,661) 1,579,410 8,188,507
- foreign exchange loss (1,181,303) 7,011,838 (1,719,750) (709,799)
Net foreign exchange gain (loss) on operating activities 65,023 (330,454) (112,894) (1,397,236)
(256,160) 1,967,723 (253,234) 6,081,472
22. FINANCE INCOME
Three-month period ended 30
September Nine-month period ended
30 September
2018 2017 2018 2017
Interest on bank deposits 138,833 207,357 521,096 374,723
Приходи од камата на дате кредите 3,337 2,783 9,010 11,651
Приходи од дивиденде 25,131 156 25,131 156
167,301 210,296 555,237 386,530
23. FINANCE EXPENSES
Three-month period ended
30 September Nine-month period ended
30 September
2018 2017 2018 2017
Interest expense 575,288 752,472 1,793,988 2,396,781
Decommissioning provision: unwinding of the present value discount 23,155 35,941 66,839 103,429 Trade receivables: unwinding of discount - (63,922) (44,661) (315,289)
Less: interest expense capitalised on qualifying assets (34,615) (18,401) (90,338) (52,583)
563,828 706,090 1,725,828 2,132,338
24. FAIR VALUE MEASUREMENT
The following assets are measured at fair value in the Interim Condensed Consolidated Financial
Statements: investment properties and financial investments classified as available for sale. The valuation
techniques and inputs used in fair value measurements are on the same basis as disclosed in the
Consolidated Financial Statements as of 31 December 2017. There were no transfers between the levels of
the fair value hierarchy during the interim period.
As of 30 June 2018 the carrying value of financial assets approximates their fair value.
25. BUSINESS COMBINATIONS
In 2018, the Group acquired one petrol station in Serbia. The total consideration paid for acquisition
amounted to 205,722 RSD. The fair value of net identifiable asset acquired amounted to 217,660 RSD and
remaining amount was recognised as gain on bargain purchase. The acquisition agreement includes only
acquisition of petrol station and do not contain any contingent consideration.

NIS Group
104
26. CONTINGENCIES AND COMMITMENTS
Environmental protection
Based on an internal assessment of compliance with the Republic of Serbia environmental legislation as at
the reporting date, the Group’s management recognised an environmental provision in the amount of
673,277 RSD (31 December 2017: 681,162 RSD).
The Group’s Management believes that cash outflows related to provision will not be significantly higher
than the ones already provided for. However, it is possible that these costs will increase significantly in the
future, should the legislation become more restrictive.
Taxes
Tax laws are subject to different interpretations and frequent amendments. Tax authorities’ interpretation of Tax laws may differ to those made by the Group’s management. As result, some transactions may be disputed by tax authorities and the Group may have to pay additional taxes, penalties and interests. Tax liability due date is five years. Tax authorities have rights to determine unpaid liabilities within five years since the transaction date. Management has assessed that the Group has paid all tax liabilities as of 30 September 2018.
Capital commitments
As of 30 September 2018 the Group has entered into contracts to purchase property, plant and equipment
for 10,877,666 RSD (31 December 2017: 11,347,097 RSD) and drilling and exploration works estimated to
76.50 USD million (31 December 2017: 58.17 USD million).
There were no other material contingencies and commitments of the Group.
27. RELATED PARTY TRANSACTIONS
For the purpose of these Interim Condensed Consolidated Financial Statements parties are considered to
be related if one party has the ability to control the other party or exercise significant influence over the
party in making financial and operational decision as defined by IAS 24 Related Party disclosure. Related
parties may enter into transactions which unrelated parties might not, and transactions between related
parties may not be effected on the same terms, conditions and amounts as transactions between unrelated
parties.
In the nine month period ended 30 September 2018 and in the same period in 2017, the Group entered
into business transactions with its related parties. The most significant transactions with related parties in
the mentioned periods related to supply/delivery of crude oil, petroleum products and energy.
As at 30 September 2018 and 31 December 2017 the outstanding balances with related parties were as
follows:
As at 30 September 2018 Parent
Company
Parent's subsidiaries and
associates Joint venture Trade and other receivables - 606,586 337,890 Investments in joint venture and associates - - 2,047,021 Trade and other payables - 76,020 - Other current liabilities (6,443,713) (664,058) (2,149) Short-term debt and current portion of long-term debt - (2) (118) Long-term debt (5,507,809) - -
(20,654,285) - -
(32,605,807) (57,474) 2,382,644

Quarterly Report for 2018 Third Quarter
105
As at 31 December 2017 Parent
Company
Parent's subsidiaries and
associates Joint venture
Trade and other receivables - 1,024,133 269,242 Investments in joint venture and associates - - 2,047,021 Other current assets - 2,754 - Trade and other payables (11,727,340) (1,047,572) -
Other current liabilities - (60,730) -
Short-term debt and current portion of long-term debt (5,510,358) - -
Long-term debt (24,796,612) - -
(42,034,310) (81,415) 2,316,263
For the nine month period ended 30 September 2018 and 2017 the following transaction occurred with
related parties:
Nine month period ended 30 September 2018 Parent
Company
Parent's subsidiaries and
associates Joint venture
Petroleum products and oil and gas sales - 436,604 464
Other revenues 462 3,988,432 18,605
Purchases of oil, gas and petroleum products (45,583,790) (8,608) -
Production and manufacturing expenses - (4,136,345) -
Selling, general and administrative expenses - (6,198) -
Other expenses, net (4,985) (809) -
Finance expense (379,285) - -
(45,967,598) 273,076 19,069
Six month period ended 30 September2017 Parent
Company
Parent's subsidiaries and
associates Joint venture
Petroleum products and oil and gas sales - 450,590 -
Other revenues - 7,026,197 -
Purchases of oil, gas and petroleum products (20,062,252) (451,894) -
Production and manufacturing expenses - (7,269,422) -
Selling, general and administrative expenses - (4,776) -
Other expenses, net (5,002) (175) -
Finance expense (489,792) - -
(20,557,046) (249,480) -

NIS Group
106
Main balances and transactions with state and state owned companies are shown below:
Parent's subsidiaries and associates Other
As at 30 September 2018 Trade and other receivables (gross)
HIP Petrohemija 2,128,202 -
Srbijagas - 67,288
Other state owned companies - 6,558,213
Trade and other payables
HIP Petrohemija (1,592,636) -
Srbijagas - (95,325)
Other current liabilities
HIP Petrohemija (1,370) -
534,196 6,530,176
As at 31 December 2017
Trade and other receivables (gross)
HIP Petrohemija 1,446,685 -
Srbijagas - 109,748
Republika Srbija - 3,740,763
Other state owned companies - 4,936,110
Trade and other payables
HIP Petrohemija (1,252,736) -
Srbijagas - (77,059)
Other current liabilities
HIP Petrohemija (13,646) -
180,303 8,709,562
Parent's subsidiaries and associates Other
Nine month period ended 30 September 2018 Operating income
HIP Petrohemija 19,494,776 - Srbijagas - 632,949 Operating expenses
HIP Petrohemija (159,824) - Srbijagas - (655,684)
19,334,952 (22,735) Nine month period ended 30 September 2017 Operating income
HIP Petrohemija 15,198,024 - Srbijagas - 677,478 Operating expenses
HIP Petrohemija (138,725) - Srbijagas - (691,367)
15,059,299 (13,889)
Transactions with state and state owned companies mainly relates to sales of petroleum products based
on the price lists in force and terms that would be available to third parties.
Transactions with Key Management Personnel
For the nine month period ended on 30 September 2018 and 2017 the Group recognized 740,326 RSD and
743,813 RSD, respectively, as compensation for key management personnel (Chief Executive Officer,
members of the Board of Directors and Advisory Board and Corporate Secretary). Key management
remuneration includes salaries, bonuses and other contributions.

Quarterly Report for 2018 Third Quarter
107
Statement of Individuals Responsible for the Preparation of Financial Statements
We hereby state and represent that, to the best of our knowledge, the interim Financial Statements are
compiled against applicable International Financial Reporting Standards and in compliance with the Law on
Accounting of the Republic of Serbia (Official Gazette of the Republic of Serbia no. 62/2013), which requires
financial statements to be prepared in compliance with all IFRS and regulations issued by the Ministry of
Finance of the Republic of Serbia92 and to present accurate and objective information on the assets,
liabilities, profit, losses, financial standing and performance of the Group, including the subsidiaries
encompassed by the consolidated statements.
Anton Fyodorov
(L.S.)
Branko Mitrović
Deputy CEO, Director of Finance, Economics, Planning
and Accounting NIS j.s.c. Novi Sad
Director of Accounting Department of Finance, Economics, Planning and
Accounting NIS j.s.c. Novi Sad
92 Due to the differences between the two regulations, these condensed interim financial statements depart from the IFRS in the following:
The Company compiled the Financial Statements in the format prescribed by the Ministry of Finance of the Republic of Serbia, which
deviates from the requirements of IAS 1 – Presentation of Financial Statements.
Off-Balance Sheet Assets and Liabilities are presented on the Balance Sheet Template. As defined by the IFRS, these items are neither
assets nor liabilities.

NIS Group
108
Contact
NIS j.s.c. Novi Sad
E-mail: [email protected]
12, Narodnog fronta St.
21000 Novi Sad, Serbia
(+381 21) 481 1111
1, Milentija Popovića St.
11000 Belgrade, Serbia
(+381 11) 311 3311
Investor Relations
E-mail: [email protected]
12, Narodnog fronta St.
21000 Novi Sad, Serbia
Sector for Transactions with Minority Shareholders
E-mail: [email protected]
12, Narodnog fronta St.
21000 Novi Sad, Serbia
Info Service: (+381 11) 22 000 55
Quarterly Report for 2018 Third Quarter
109
The Report contains statements on uncertain future events. The statements on uncertain future events
include statements which do not represent historical facts, statements with regard to NIS Group's
intentions, beliefs or current expectations related to, inter alia, NIS Group's business performance, financial
standing and liquidity, outlook, growth, strategies and industrial sectors in which NIS Group operates. Given
the fact that they relate to events and depend on the circumstances which may or may not be present in
the future, the statements on uncertain future events inherently involve risks and uncertainty, including,
but without limitation to risks and uncertainties identified by NIS Group in other publicly available
documents. NIS Group hereby warns that there are no guarantees that the statements on uncertain future
events will be realised in the future and that actual business performance, financial standing and liquidity
and the development of the industrial sector in which NIS Group operates may considerably differ from the
ones presented or assumed in the statements on uncertain future events. Furthermore, even in the event
that NIS Group's business performance, financial standing and liquidity and the development of the
industrial sector in which NIS Group operates equal those in the statements on uncertain future events
contained herein, such performance and development are not indicative of the performance and
development going forward. The information contained herein is presented as at the date of the Report
and may be subject to change without prior announcement.