ran16.0 capacity monitoring guide(bsc6910-based)(01)(pdf)-en
DESCRIPTION
RAN 16 capacity monitoring guilde 3g huaweiTRANSCRIPT
RAN16.0
Capacity Monitoring Guide (BSC6910-based)
Issue 01
Date 2014-04-29
HUAWEI TECHNOLOGIES CO., LTD.
Issue 01 (2014-04-29) Huawei Proprietary and Confidential
Copyright © Huawei Technologies Co., Ltd.
i
Copyright © Huawei Technologies Co., Ltd. 2014. All rights reserved.
No part of this document may be reproduced or transmitted in any form or by any means without
prior written consent of Huawei Technologies Co., Ltd.
Trademarks and Permissions
and other Huawei trademarks are trademarks of Huawei Technologies Co., Ltd.
All other trademarks and trade names mentioned in this document are the property of their respective
holders.
Notice
The purchased products, services and features are stipulated by the contract made between Huawei and
the customer. All or part of the products, services and features described in this document may not
be within the purchase scope or the usage scope. Unless otherwise specified in the contract, all
statements, information, and recommendations in this document are provided "AS IS" without warranties,
guarantees or representations of any kind, either express or implied.
The information in this document is subject to change without notice. Every effort has been made in the
preparation of this document to ensure accuracy of the contents, but all statements, information, and
recommendations in this document do not constitute a warranty of any kind, express or implied.
Huawei Technologies Co., Ltd. Address: Huawei Industrial Base
Bantian, Longgang
Shenzhen 518129
People's Republic of China
Website: http://www.huawei.com
Email: [email protected]
RAN16.0 Capacity Monitoring Guide (BSC6910-based) About This Document
Issue 01 (2014-04-29) Huawei Proprietary and Confidential
Copyright © Huawei Technologies Co., Ltd.
ii
About This Document
1.1 Purpose
Growing traffic in mobile networks, especially in newly deployed networks, requires more
and more network resources, such as radio and transmission resources. Lack of network
resources will affect user experience. Therefore, monitoring network resources, locating
bottlenecks, and performing capacity expansion in real time are critical to the provision of
high quality services.
This document describes how to monitor the usage of various network resources and locate
network resource bottlenecks.
This document applies to BSC6910s and 3900 series base stations.
Radio Network Controllers (RNCs) mentioned in this document refer to Huawei BSC6910s.
For details about the MML commands, parameters, alarms, and performance counters, see section
"Operation and Maintenance" in BSC6910 UMTS Product Documentation or 3900 Series WCDMA
NodeB Product Documentation.
For details about flow control, see Flow Control Feature Parameter Description in the RAN
Feature Documentation.
1.2 Organization
This document is organized as follows:
Chapter Description
1 Overview Introduces network resources and monitoring methods.
2 Network Resource
Monitoring
Provides capacity monitoring principles, monitoring
methods, and optimization suggestions.
3 Network Resource
Troubleshooting
Provides methods for analyzing and locating network
congestion and overload problems.
4 Metrics Definitions Provides a table that includes all metrics currently in use.
5 Reference Documents Lists the documents referenced within the text and provides
the document name, document package, and document
package download path at http://support.huawei.com.

RAN16.0 Capacity Monitoring Guide (BSC6910-based) About This Document
Issue 01 (2014-04-29) Huawei Proprietary and Confidential
Copyright © Huawei Technologies Co., Ltd.
iii
Change History
The latest document issue contains all changes made in previous issues.
01 (2014-04-29)
This issue includes the following changes:
Change Type Change Description
Function change None.
Editorial change The figures are optimized.
Draft A (2014-01-27)
Compared with the 06 (2014-01-20) of RAN15.0, issue draft A of RAN16.0 includes the following changes:
Change Type Change Description
Function change Add new monitoring counters in sections 2.5.2.
Editorial change None.

RAN16.0 Capacity Monitoring Guide (BSC6910-based) Contents
Issue 01 (2014-04-29) Huawei Proprietary and Confidential
Copyright © Huawei Technologies Co., Ltd.
iv
Contents
About This Document .................................................................................................................... ii
1.1 Purpose ............................................................................................................................................................. ii
1.2 Organization ..................................................................................................................................................... ii
1 Overview ......................................................................................................................................... 5
1.1 Network Resources .......................................................................................................................................... 5
1.2 Monitoring Methods ......................................................................................................................................... 7
2 Network Resource Monitoring ................................................................................................... 8
2.1 Monitoring Metrics and Procedure ................................................................................................................... 8
2.2 CP/UP CPU Load ........................................................................................................................................... 12
2.3 RMP CPU Load ............................................................................................................................................. 13
2.4 Interface Board CPU Load ............................................................................................................................. 14
2.5 SCU CPU Load .............................................................................................................................................. 15
2.6 Common Channel Usage ................................................................................................................................ 16
2.7 Downlink Load ............................................................................................................................................... 18
2.8 Uplink Load ................................................................................................................................................... 20
2.9 OVSF Code Usage ......................................................................................................................................... 23
2.10 CE Usage ...................................................................................................................................................... 25
2.11 Iub Bandwidth Usage ................................................................................................................................... 28
2.12 NodeB CNBAP Load ................................................................................................................................... 34
2.13 HSPA Users .................................................................................................................................................. 35
3 Network Resource Troubleshooting ....................................................................................... 36
3.1 Possible Block and Failure Points in the Basic Call Flow.............................................................................. 36
3.2 Counters Related to Call Congestion ............................................................................................................. 38
3.3 Resource Usage Analysis ............................................................................................................................... 40
4 Metrics Definitions ..................................................................................................................... 51
5 Reference Documents................................................................................................................. 57
RAN16.0 Capacity Monitoring Guide (BSC6910-based) 1 Overview
Issue 01 (2014-04-29) Huawei Proprietary and Confidential
Copyright © Huawei Technologies Co., Ltd.
5
1 Overview
1.1 Network Resources
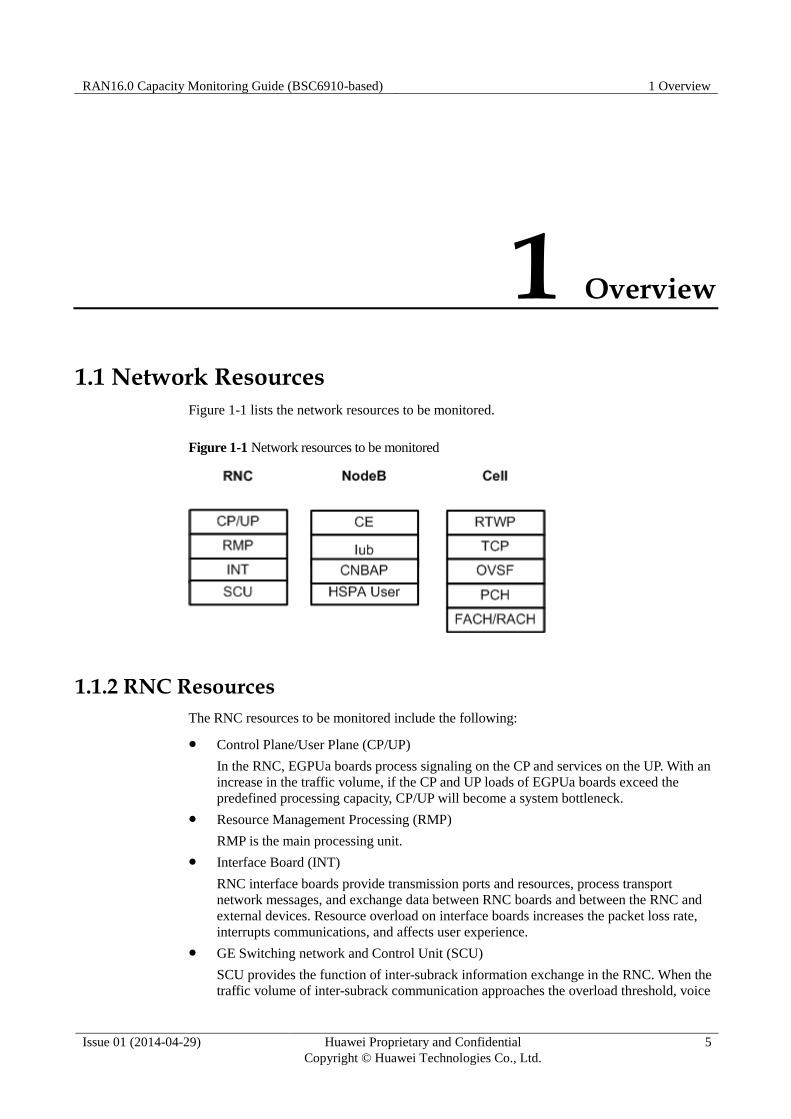
Figure 1-1 lists the network resources to be monitored.
Figure 1-1 Network resources to be monitored
1.1.2 RNC Resources
The RNC resources to be monitored include the following:
Control Plane/User Plane (CP/UP)
In the RNC, EGPUa boards process signaling on the CP and services on the UP. With an
increase in the traffic volume, if the CP and UP loads of EGPUa boards exceed the
predefined processing capacity, CP/UP will become a system bottleneck.
Resource Management Processing (RMP)
RMP is the main processing unit.
Interface Board (INT)
RNC interface boards provide transmission ports and resources, process transport
network messages, and exchange data between RNC boards and between the RNC and
external devices. Resource overload on interface boards increases the packet loss rate,
interrupts communications, and affects user experience.
GE Switching network and Control Unit (SCU)
SCU provides the function of inter-subrack information exchange in the RNC. When the traffic volume of inter-subrack communication approaches the overload threshold, voice
RAN16.0 Capacity Monitoring Guide (BSC6910-based) 1 Overview
Issue 01 (2014-04-29) Huawei Proprietary and Confidential
Copyright © Huawei Technologies Co., Ltd.
6
service quality, data service quality, and network KPIs deteriorate, causing the system to
become unstable.
1.1.3 NodeB Resources
The NodeB resources to be monitored include the following:
Channel Element (CE)
CEs are baseband processing resources. Generally, CEs are most likely to be congested
on a network. In the early phase of network deployment, traffic volume is often small.
Operators only need to purchase a small number of CEs, which reduces their capital
expenditure (CAPEX).
Iub interface bandwidth
The Iub interface exists between the NodeB and RNC. The interface uses asynchronous
transfer mode (ATM) or IP transmission depending on the transmission medium.
Insufficient Iub interface bandwidth leads to admission failures, transmission KPI
deterioration (such as delay, jitter, and packet loss rate), and UMTS service quality
degradation.
Common NodeB Application Part (CNBAP)
CNBAP load is used to assess the NodeB processing capacity. CNBAP overload lowers
the NodeB processing capacity, which then affects KPIs related to the NodeB.
HSPA users
HSPA services are mainly carried on the WBBP boards in a NodeB. Therefore, the
number of HSPA users determines WBBP board loads. If WBBP boards are
overloaded with HSPA users, new users may fail to access the network.
1.1.4 Cell Resources
The cell resources to be monitored include the following:
Received Total Wideband Power (RTWP)
RTWP includes receiver noise, external radio interference, and uplink power. RTWP is
used to monitor uplink load.
Transmitted Carrier Power (TCP)
TCP refers to the full-carrier power transmitted by a cell. It is used to monitor downlink
load. The TCP value is limited by the maximum transmit power of the power amplifier in
a NodeB and the maximum transmit power configured for a cell.
Orthogonal Variable Spreading Factor (OVSF)
Insufficient downlink OVSFs affect UEs' access to the network.
Paging Channel (PCH)
PCH usage is affected by the location area and routing area planning. PCH overload
decreases the paging success rate.
Random Access Channel (RACH) and Forward Access Channel (FACH)
RACH and FACH carry signaling and a small amount of user-plane data. RACH or
FACH overload decreases the network access success rate and affects user experience.
RAN16.0 Capacity Monitoring Guide (BSC6910-based) 1 Overview
Issue 01 (2014-04-29) Huawei Proprietary and Confidential
Copyright © Huawei Technologies Co., Ltd.
7
1.2 Monitoring Methods
Network resources can be monitored using the following two methods:
Proactive monitoring: This is a method for monitoring various network resources
simultaneously. When resource consumption is consistently greater than its upper threshold,
perform capacity expansion to relieve resource congestion. This method is easy to implement
and suitable for daily resource monitoring. For details, see chapter 2 "Network Resource
Monitoring."
Problem-driven analysis: This analysis finds system bottlenecks by locating problems. As an
example, capacity analysis is triggered by issues such as call blocks. This method requires
enhanced troubleshooting skills but makes full use of network resources and eliminates the
need for an immediate network expansion. For details, see chapter 3 "Network Resource
Troubleshooting."
RAN16.0 Capacity Monitoring Guide (BSC6910-based) 2 Network Resource Monitoring
Issue 01 (2014-04-29) Huawei Proprietary and Confidential
Copyright © Huawei Technologies Co., Ltd.
8
2 Network Resource Monitoring
2.1 Monitoring Metrics and Procedure
2.1.1 Monitoring Metrics
Metrics are defined to monitor the usage or load of UTRAN resources. Resource thresholds
are also recommended based on specific criteria.
Defining peak hours is important for monitoring metrics. There are different ways to define
peak hours, but you are advised to simply use the hours during which the corresponding
resource usage is the highest as peak hours.
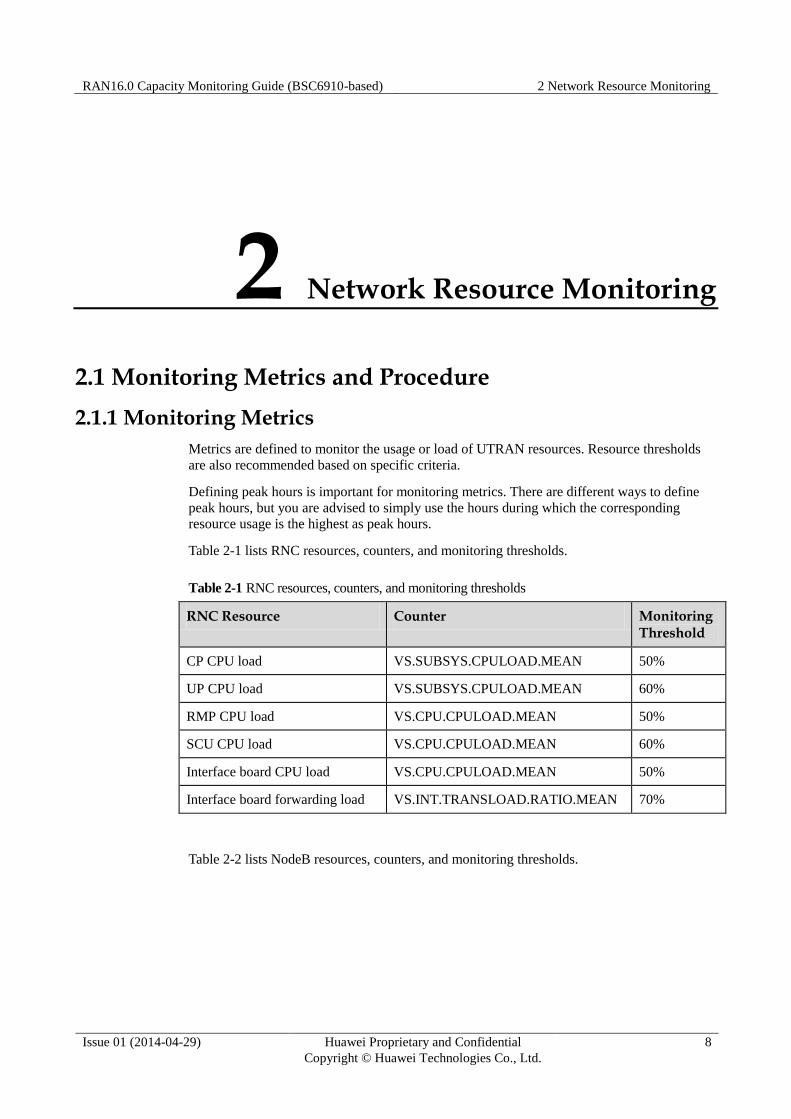
Table 2-1 lists RNC resources, counters, and monitoring thresholds.
Table 2-1 RNC resources, counters, and monitoring thresholds
RNC Resource Counter Monitoring Threshold
CP CPU load VS.SUBSYS.CPULOAD.MEAN 50%
UP CPU load VS.SUBSYS.CPULOAD.MEAN 60%
RMP CPU load VS.CPU.CPULOAD.MEAN 50%
SCU CPU load VS.CPU.CPULOAD.MEAN 60%
Interface board CPU load VS.CPU.CPULOAD.MEAN 50%
Interface board forwarding load VS.INT.TRANSLOAD.RATIO.MEAN 70%
Table 2-2 lists NodeB resources, counters, and monitoring thresholds.
RAN16.0 Capacity Monitoring Guide (BSC6910-based) 2 Network Resource Monitoring
Issue 01 (2014-04-29) Huawei Proprietary and Confidential
Copyright © Huawei Technologies Co., Ltd.
9
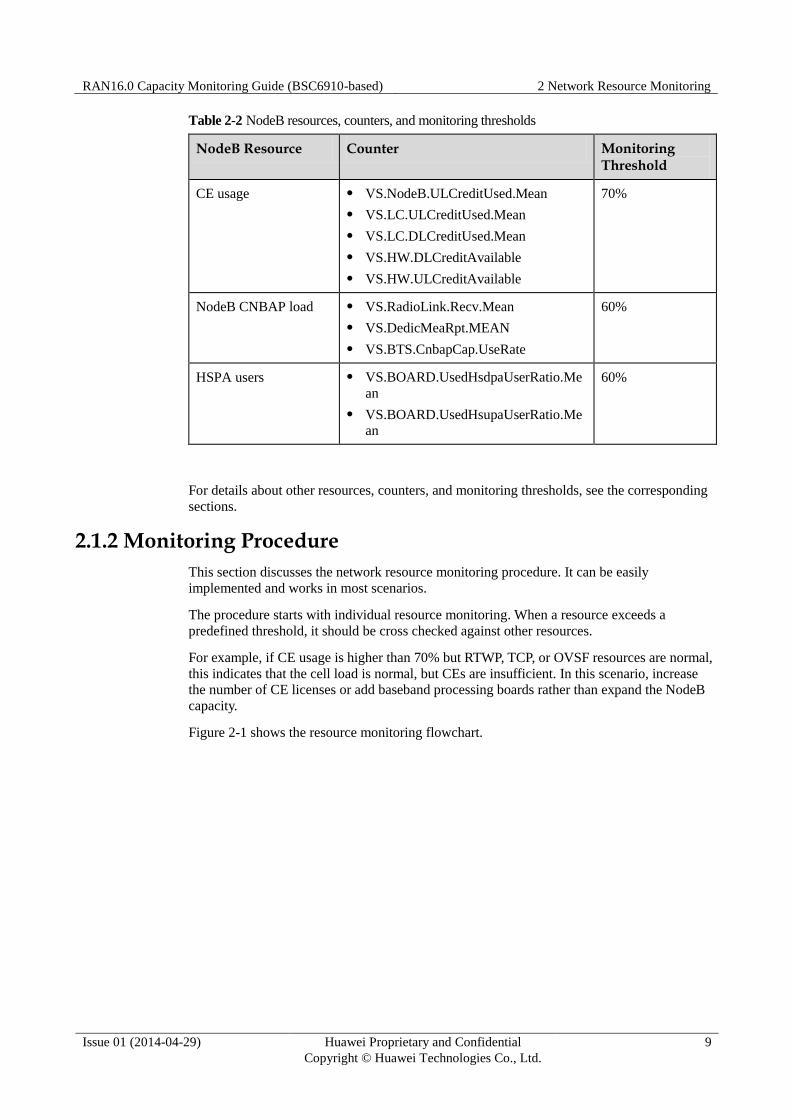
Table 2-2 NodeB resources, counters, and monitoring thresholds
NodeB Resource Counter Monitoring Threshold
CE usage VS.NodeB.ULCreditUsed.Mean
VS.LC.ULCreditUsed.Mean
VS.LC.DLCreditUsed.Mean
VS.HW.DLCreditAvailable
VS.HW.ULCreditAvailable
70%
NodeB CNBAP load VS.RadioLink.Recv.Mean
VS.DedicMeaRpt.MEAN
VS.BTS.CnbapCap.UseRate
60%
HSPA users VS.BOARD.UsedHsdpaUserRatio.Me
an
VS.BOARD.UsedHsupaUserRatio.Me
an
60%
For details about other resources, counters, and monitoring thresholds, see the corresponding
sections.
2.1.2 Monitoring Procedure
This section discusses the network resource monitoring procedure. It can be easily
implemented and works in most scenarios.
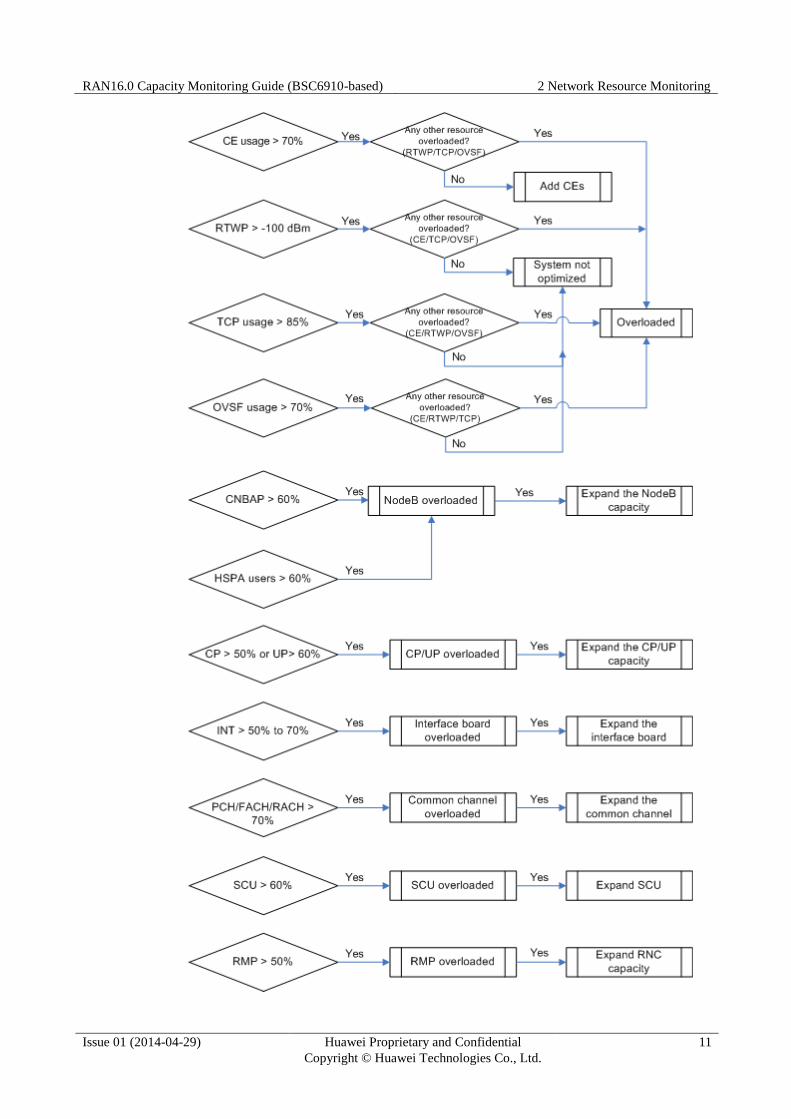
The procedure starts with individual resource monitoring. When a resource exceeds a
predefined threshold, it should be cross checked against other resources.
For example, if CE usage is higher than 70% but RTWP, TCP, or OVSF resources are normal,
this indicates that the cell load is normal, but CEs are insufficient. In this scenario, increase
the number of CE licenses or add baseband processing boards rather than expand the NodeB
capacity.
Figure 2-1 shows the resource monitoring flowchart.
RAN16.0 Capacity Monitoring Guide (BSC6910-based) 2 Network Resource Monitoring
Issue 01 (2014-04-29) Huawei Proprietary and Confidential
Copyright © Huawei Technologies Co., Ltd.
10
Figure 2-1 Resource monitoring flowchart
RAN16.0 Capacity Monitoring Guide (BSC6910-based) 2 Network Resource Monitoring
Issue 01 (2014-04-29) Huawei Proprietary and Confidential
Copyright © Huawei Technologies Co., Ltd.
11
RAN16.0 Capacity Monitoring Guide (BSC6910-based) 2 Network Resource Monitoring
Issue 01 (2014-04-29) Huawei Proprietary and Confidential
Copyright © Huawei Technologies Co., Ltd.
12
This procedure applies to most resource monitoring scenarios, but sometimes the system may
be overloaded because of other abnormalities instead of traffic increases. Some of these
abnormalities can be discovered by resource cross-checking. If more extensive resource
cross-checking is unsuccessful, more advanced troubleshooting is required. Chapter 3
"Network Resource Troubleshooting" addresses the more advanced troubleshooting
procedures.
For the sake of simplicity, it is assumed that there are no other abnormalities on the network
during the proactive monitoring process described in chapter 2 "Network Resource
Monitoring."
2.2 CP/UP CPU Load
2.2.1 Monitoring Principles
CP is used to process Uu interface signaling and transmit control-plane signaling. CP is easily
overloaded on networks that are vulnerable to signaling storms. If CP is overloaded, new
messages are discarded. That is, new call requests are rejected, which significantly affects
user experience.
UP is used to process and distribute user-plane data flows. If UP is overloaded, user-plane
data is partially discarded. This causes voice and data service quality to deteriorate.
EGPUa boards process services on the RNC user plane and control plane. The CPs and UPs
of all EGPUa boards in the RNC form a CP pool and a UP pool, respectively. The RNC can
adjust the multi-core digital signal processors (DSPs) allocated to the CPs and UPs based on
service requirements in order to balance the load between the CPs and UPs.
Run the ADD BRD command to set the logical function type of an EGPUa board. If the
Logical function type parameter is set to UCUP, the EGPUa board is used for "UMTS RNC
control-plane and user-plane processing." The following is an example:
ADD BRD: SRN=0, BRDCLASS=GPU, BRDTYPE=EGPUa, LGCAPPTYPE=UCUP,
SN=10;
Slots 8 and 9 of subrack 0 in the RNC permanently hold EGPUa boards whose logical
function type is RMP, which are used only for resource management. Other slots can hold
EGPUa boards whose logical function type is UCUP, which are used for UMTS RNC
control-plane and user-plane processing.
If the subsystem number is "2xxx", this subsystem processes CP services. If the subsystem
number is "8xxx", this subsystem processes UP services. CP CPU load and UP CPU load are
monitored in CP and UP pools, respectively, without considering the board in which the
subsystem is located.
CP and UP subsystems can be flexibly deployed using the SET UCPUPFLEXCFG
command. In this command, the FlexCfgMode parameter specifies the mode for adjusting the
CP and UP subsystems, and the CPProportionInTotal parameter specifies the percentage of
CPU usage for the CP in the total CPU usage. You can use these two parameters to manually
configure the ratio of CPs to UPs in order to distinguish CP and UP subsystems.
RAN16.0 Capacity Monitoring Guide (BSC6910-based) 2 Network Resource Monitoring
Issue 01 (2014-04-29) Huawei Proprietary and Confidential
Copyright © Huawei Technologies Co., Ltd.
13
2.2.2 Monitoring Methods
The VS.SUBSYS.CPULOAD.MEAN counter provides the mean CPU usage of a subsystem
in the measurement period. It indicates the load and operating performance of the CPU on the
subsystem in the measurement period.
The CP CPU load is calculated using the following formula:
CP CPU load = AVG(VS.SUBSYS.CPULOAD.MEAN)
The UP CPU load is calculated using the following formula:
UP CPU load = AVG(VS.SUBSYS.CPULOAD.MEAN)
2.2.3 Optimization Suggestions
If the CP CPU load is greater than 50% during peak hours for three consecutive days in
a week, prepare for capacity expansion. If the CP CPU load is greater than 60% during peak
hours for three consecutive days in a week, perform capacity expansion immediately.
If the UP CPU load is greater than 60% during peak hours for three consecutive days in
a week, prepare for capacity expansion. If the UP CPU load is greater than 70% during peak
hours for three consecutive days in a week, perform capacity expansion immediately.
Perform capacity expansion as follows:
When the FlexCfgMode parameter is set to ManulMode or FrozenMode, adjust the
ratio of CPs to UPs or change the FlexCfgMode parameter to AutoMode if the CP pool
or UP pool is overloaded.
If the current CP/UP resources cannot meet the requirements of the traffic model, add
EGPUa boards.
2.3 RMP CPU Load
2.3.1 Monitoring Principles
RMP is the main processing unit of an EGPUa board. It allocates RNC resources to each call,
including CP, UP, and interface board resources. Slots 8 and 9 of subrack 0 in the RNC
permanently hold EGPUa boards whose logical function type is RMP, which are used only for
resource management. The EGPUa boards in slots 8 and 9 work in active/standby mode.
2.3.2 Monitoring Methods
Use the VS.CPU.CPULOAD.MEAN counter to measure the mean CPU usage of an RMP in
the measurement period. It indicates the load and operating performance of the CPU on the
RMP in the measurement period.
The VS.CPU.CPULOAD.MEAN counter measures the CPU load on each RMP subsystem.
2.3.3 Optimization Suggestions
If the RMP CPU load is greater than 50% during peak hours for three consecutive days in
a week, a prewarning is required. If the RMP CPU load is greater than 60% during peak hours
for three consecutive days in a week, contact Huawei for technical support.
RAN16.0 Capacity Monitoring Guide (BSC6910-based) 2 Network Resource Monitoring
Issue 01 (2014-04-29) Huawei Proprietary and Confidential
Copyright © Huawei Technologies Co., Ltd.
14
2.4 Interface Board CPU Load
2.4.1 Monitoring Principles
RNC interface boards provide transmission ports and resources, process transport network
messages, and exchange data between RNC boards and between the RNC and external
devices.
These boards forward and process data for the Iub, Iu, and Iur interfaces. If one of the
interface boards is overloaded, the packet loss rate increases. This affects communications and
deteriorates user experience.
NOTE In effective mode, run the MML command LST BRD to query information about a specific board,
for example, whether the board is an interface board.
In ineffective mode, find the MML command ADD BRD in the RNC configuration file. If the value
of the BRDCLASS parameter is INT, the board is an interface board. You can obtain information
about this interface board using this command.
2.4.2 Monitoring Methods
To obtain the interface board CPU load, monitor the control-plane CPU load and user-plane
forwarding load.
The counters used to monitor the interface board CPU load are as follows:
VS.CPU.CPULOAD.MEAN: Average CPU Usage of the CPU
VS.INT.TRANSLOAD.RATIO.MEAN: Average Forwarding Ratio of Interface Boards
The forwarding load is expressed by the ratio of actual forwarding data rate to maximum
forwarding data rate configured for the interface board. The forwarding load indicates the
operating load and performance of the interface board.
When the RNC detects that the CPU load on an interface board exceeds a specified threshold,
ALM-20256 CPU Overload is reported.
If CIDs, UDPs, or TEIDs are overloaded on all interface boards of a certain type (for example,
Iub interface boards), services cannot be established over the interface. To obtain the usages
of CIDs, UDPs, or TEIDs, observe the following counters:
VS.INT.TRM.FLOW.UDP.MEAN: Average Number of Occupied UDP Ports of Interface
Boards
VS.INT.TRM.FLOW.CID.MEAN: Average Number of Occupied CIDs of Interface
Boards
VS.INT.TRM.FLOW.TEID.MEAN: Average Number of Occupied TEIDs of Interface
Boards
VS.INT.TRM.FLOW.UDP.RESUSAGE.MEAN: Average Usage of UDP Ports of
Interface Boards
VS.INT.TRM.FLOW.CID.RESUSAGE.MEAN: Average Usage of CID of Interface
Boards
VS.INT.TRM.FLOW.TEID.RESUSAGE.MEAN: Average Number of Occupied TEIDs
of Interface Boards
NOTE
UDP: User Datagram Protocol
RAN16.0 Capacity Monitoring Guide (BSC6910-based) 2 Network Resource Monitoring
Issue 01 (2014-04-29) Huawei Proprietary and Confidential
Copyright © Huawei Technologies Co., Ltd.
15
CID: Channel Identifier
TEID: Tunnel Endpoint ID
2.4.3 Optimization Suggestions
Perform capacity expansion in the following scenarios:
When the average CPU load on interface boards reaches 50%, prepare for capacity
expansion. When the average CPU load on interface boards reaches 60%, perform
capacity expansion immediately.
When the average forwarding load on interface boards reaches 70%, prepare for capacity
expansion. When the average forwarding load on interface boards reaches 80%, perform
capacity expansion immediately.
When the average usage of CIDs, UDPs, or TEIDs on all interface boards of a certain
type exceeds 70%, prepare for capacity expansion. When the average usage of CIDs,
UDPs, or TEIDs on all interface boards of a certain type exceeds 85%, perform capacity
expansion immediately.
Perform capacity expansion as follows:
In non-transmission resource pool networking scenarios, assess the capacity of each
interface board. For loads between interface boards of the same type, adjust the number
of links carried on each interface board to balance loads between them. If loads are not
balanced after the adjustment, add interface boards of the same type.
In transmission resource pool networking scenarios, if the load on an interface board in
the resource pool exceeds the load threshold, add interface boards of the same type.
If the average CIDs, UDPs, or TEIDs on all interface boards of a certain type are
overloaded, add interface boards of the same type. You do not need to consider whether
the scenario is transmission resource pool networking or non-transmission resource pool
networking.
NOTE
For details about the Transmission Resource Pool in RNC feature, see Transmission Resource Pool in
RNC Feature Parameter Description in the RAN feature documentation.
2.5 SCU CPU Load
2.5.1 Monitoring Principles
Two SCU boards are installed each subrack. SCUb boards are permanently installed in slots
20 and 21 of each subrack. Two SCU boards in the same subrack work in active/standby
mode.
Ports on an SCU board form a trunk group that connects the MPS to the EPS. Restricted by
their switching capacities, SCU boards are likely to be congested when configurations are
unbalanced between subracks and when the inter-subrack traffic is heavy. When the traffic
volume of inter-subrack communication approaches the overload threshold, voice service
quality, data service quality, and network KPIs deteriorate, causing the system to become
unstable. Therefore, the SCU CPU load and inter-subrack bandwidth need to be monitored for
SCU boards.
RAN16.0 Capacity Monitoring Guide (BSC6910-based) 2 Network Resource Monitoring
Issue 01 (2014-04-29) Huawei Proprietary and Confidential
Copyright © Huawei Technologies Co., Ltd.
16
2.5.2 Monitoring Methods
Monitoring of SCU CPU Load
The VS.CPU.CPULOAD.MEAN counter monitors the SCU CPU load.
When the RNC detects that the CPU load of an SCU subsystem exceeds a specified overload
threshold, ALM-20256 CPU Overload is reported. You can query the overload threshold by
running the LST CPUTHD command.
Monitoring of Inter-Subrack Bandwidth
The counters used to monitor the inter-subrack bandwidth are as follows:
VS.Frame.Flux.Mean.TxRate: Average Inter-Subrack Transmitting Traffic
Frame Mean Usage: Average utility rate of inter-subrack traffic
The Frame Mean Usage is calculated using the following formula:
Frame Mean Usage = VS.Frame.Flux.Mean.TxRate/Inter-subrack bandwidth x 100%
When a pair of active and standby SCUb boards are configured, the inter-subrack bandwidth
is 40 Gbit/s. If either the active or standby SCUb board becomes faulty, the inter-subrack
bandwidth is reduced by half.
2.5.3 Optimization Suggestions
When the SCU CPU load reaches 60%, contact Huawei for technical support.
If the value of Frame Mean Usage exceeds 40%, contact Huawei for technical support.
2.6 Common Channel Usage
2.6.1 Monitoring Principles
Common channels include paging channels (PCHs), forward access channels (FACHs), and
random access channels (RACHs).
PCHs are downlink channels used to transmit paging messages. If the PCH usage is high,
paging messages may be lost.
FACHs are downlink transmission channels and RACHs are uplink transmission channels.
FACHs and RACHs transmit signaling and a small amount of user data. RACH
insufficiency will decrease the network access success rate and deteriorate user experience.
FACH insufficiency will cause a large number of state transitions for PS services, occurrence
of RRC signaling storms, and loss of signaling messages or user data.
2.6.2 Monitoring Methods
Based on the RNC's default parameter settings, the usages of PCHs, FACHs, and RACHs are
calculated using the following formulas:
1. PCH usage
PCH usage = VS.UTRAN.AttPaging1/(<SP> x 60 x 5/0.01)
RAN16.0 Capacity Monitoring Guide (BSC6910-based) 2 Network Resource Monitoring
Issue 01 (2014-04-29) Huawei Proprietary and Confidential
Copyright © Huawei Technologies Co., Ltd.
17
NOTE
<SP> indicates the measurement period expressed in minutes.
2. FACH usage
− If a secondary common control physical channel (SCCPCH) carries both a FACH and
a PCH, the FACH usage is calculated using the following formula:
Usage of an FACH carried on a non-standalone SCCPCH =
VS.CRNCIubBytesFACH.Tx x 8/[(60 x <SP> x 168 x 1/0.01) x
VS.PCH.Bandwidth.UsageRate x 6/7] + [(60 x <SP> x 360 x 1/0.01) x (1 -
VS.PCH.Bandwidth.UsageRate x 6/7)]
where
VS.PCH.Bandwidth.UsageRate =
<VS.CRNCIubBytesPCH.Tx>/(<VS.CRNC.IUB.PCH.Bandwidth> x <SP> x 60)
− If an SCCPCH only carries a FACH, the FACH usage is calculated using the
following formula:
FACH Usage = ((VS.SRBNum.FACH - VS.OneSRBTTINum.FACH)/2 +
VS.OneSRBTTINum.FACH + VS.IndepTRBNum.FACH)/(<SP> x 60/0.01)
3. RACH usage
Each cell has only one RACH. When signaling and user data coexist on the RACH, the
RACH usage is calculated using the following formula:
RACH Usage = ((VS.CRNCIubBytesRACH.Rx - VS.TRBNum.RACH x 360/8) x
8/168)/(<SP> x 60 x 4/0.02) + VS.TRBNum.RACH/(<SP> x 60 x 4/0.02)
2.6.3 Optimization Suggestions
It is recommended that you take the following measures to address PCH, FACH, and RACH
overload:
PCH overload
Inappropriate LA planning will cause PCH overload because paging messages are
broadcast across the entire LA.
− If paging messages are not retransmitted, the paging message loss rate is 5% when
the PCH usage reaches 60%. In this scenario, analyze the cause of paging message
loss or replan the LAs.
− If paging messages are retransmitted once or twice, the paging message loss rate is
1% when the PCH usage reaches 70%. In this scenario, analyze the cause of paging
message loss or replan the LAs.
FACH overload
If the FACH usage reaches 70% during peak hours for three consecutive days in a week,
the following measures are recommended:
− If the network is configured with only one SCCPCH, add a second SCCPCH to carry
FACHs.
− If SCCPCHs cannot be added, add carriers, NodeBs, or micro NodeBs.
RACH overload
If the RACH usage reaches 70% during peak hours for three consecutive days in a week,
add carriers.
RAN16.0 Capacity Monitoring Guide (BSC6910-based) 2 Network Resource Monitoring
Issue 01 (2014-04-29) Huawei Proprietary and Confidential
Copyright © Huawei Technologies Co., Ltd.
18
2.7 Downlink Load
2.7.1 Monitoring Principles
The downlink capacity of a cell is limited by its total available transmit power, which is
determined by the NodeB power amplifier's capability and the power configured for the cell.
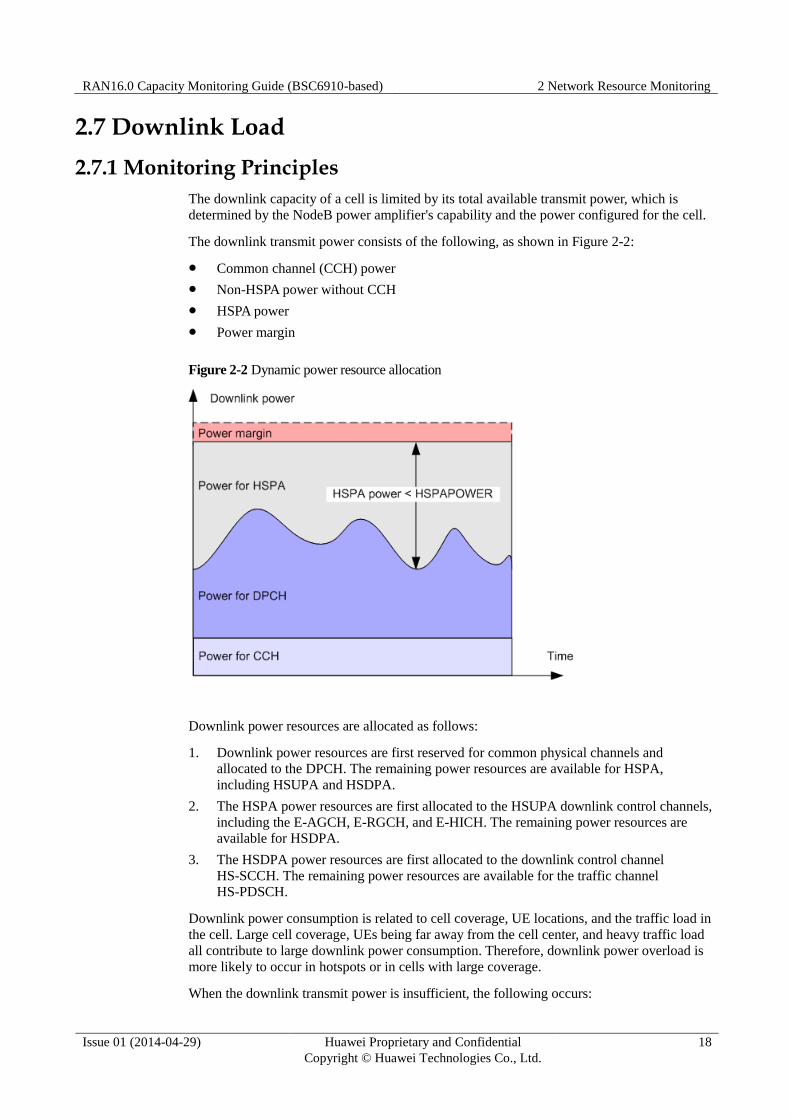
The downlink transmit power consists of the following, as shown in Figure 2-2:
Common channel (CCH) power
Non-HSPA power without CCH
HSPA power
Power margin
Figure 2-2 Dynamic power resource allocation
Downlink power resources are allocated as follows:
1. Downlink power resources are first reserved for common physical channels and
allocated to the DPCH. The remaining power resources are available for HSPA,
including HSUPA and HSDPA.
2. The HSPA power resources are first allocated to the HSUPA downlink control channels,
including the E-AGCH, E-RGCH, and E-HICH. The remaining power resources are
available for HSDPA.
3. The HSDPA power resources are first allocated to the downlink control channel
HS-SCCH. The remaining power resources are available for the traffic channel
HS-PDSCH.
Downlink power consumption is related to cell coverage, UE locations, and the traffic load in
the cell. Large cell coverage, UEs being far away from the cell center, and heavy traffic load
all contribute to large downlink power consumption. Therefore, downlink power overload is
more likely to occur in hotspots or in cells with large coverage.
When the downlink transmit power is insufficient, the following occurs:
RAN16.0 Capacity Monitoring Guide (BSC6910-based) 2 Network Resource Monitoring
Issue 01 (2014-04-29) Huawei Proprietary and Confidential
Copyright © Huawei Technologies Co., Ltd.
19
The cell coverage shrinks.
The data throughput decreases.
The service quality declines.
New service requests are likely to be rejected.
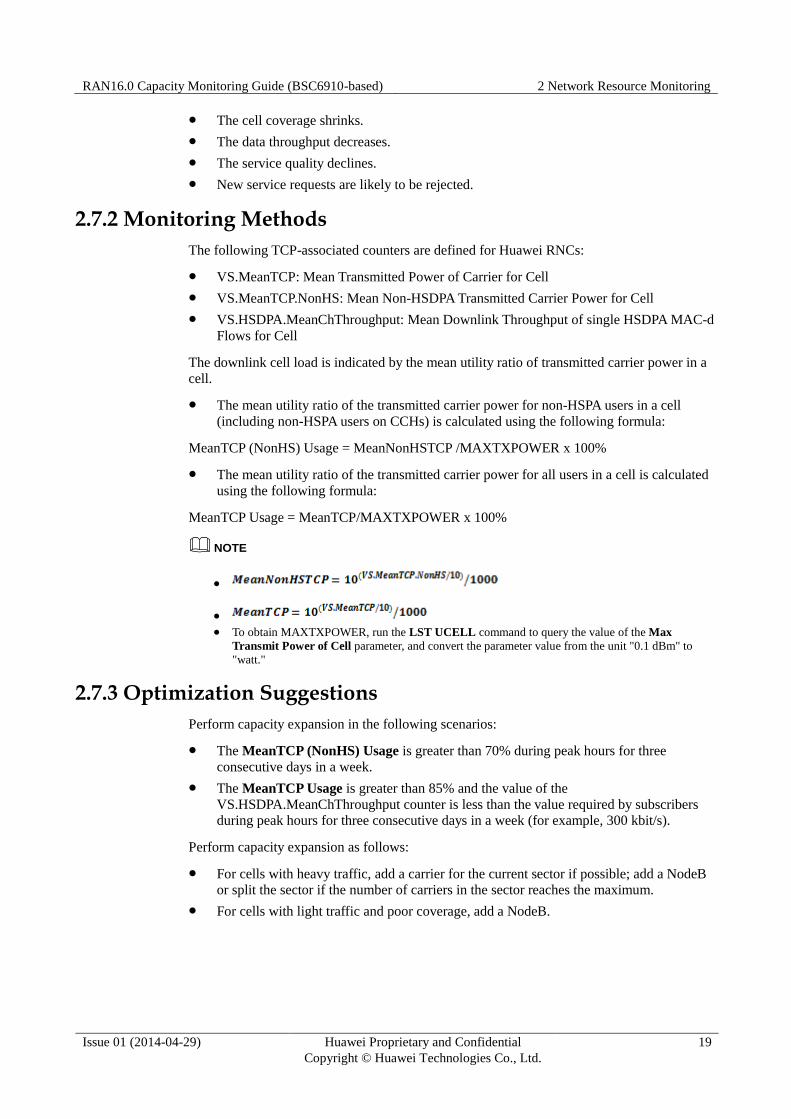
2.7.2 Monitoring Methods
The following TCP-associated counters are defined for Huawei RNCs:
VS.MeanTCP: Mean Transmitted Power of Carrier for Cell
VS.MeanTCP.NonHS: Mean Non-HSDPA Transmitted Carrier Power for Cell
VS.HSDPA.MeanChThroughput: Mean Downlink Throughput of single HSDPA MAC-d
Flows for Cell
The downlink cell load is indicated by the mean utility ratio of transmitted carrier power in a
cell.
The mean utility ratio of the transmitted carrier power for non-HSPA users in a cell
(including non-HSPA users on CCHs) is calculated using the following formula:
MeanTCP (NonHS) Usage = MeanNonHSTCP /MAXTXPOWER x 100%
The mean utility ratio of the transmitted carrier power for all users in a cell is calculated
using the following formula:
MeanTCP Usage = MeanTCP/MAXTXPOWER x 100%
NOTE
To obtain MAXTXPOWER, run the LST UCELL command to query the value of the Max
Transmit Power of Cell parameter, and convert the parameter value from the unit "0.1 dBm" to
"watt."
2.7.3 Optimization Suggestions
Perform capacity expansion in the following scenarios:
The MeanTCP (NonHS) Usage is greater than 70% during peak hours for three
consecutive days in a week.
The MeanTCP Usage is greater than 85% and the value of the
VS.HSDPA.MeanChThroughput counter is less than the value required by subscribers
during peak hours for three consecutive days in a week (for example, 300 kbit/s).
Perform capacity expansion as follows:
For cells with heavy traffic, add a carrier for the current sector if possible; add a NodeB
or split the sector if the number of carriers in the sector reaches the maximum.
For cells with light traffic and poor coverage, add a NodeB.
RAN16.0 Capacity Monitoring Guide (BSC6910-based) 2 Network Resource Monitoring
Issue 01 (2014-04-29) Huawei Proprietary and Confidential
Copyright © Huawei Technologies Co., Ltd.
20
2.8 Uplink Load
2.8.1 Monitoring Principles
RTWP measures the uplink cell capability on WCDMA networks.
RTWP includes the following:
Background noise
Intra-system interference, including uplink signals sent by the UEs in the serving and
neighboring cells
RF interference, including RF interference from an external source (for example, RF
interference from another RAT or from equipment other than communication equipment)
and intra-system RF interference (for example, intermodulation interference produced by
hardware components)
The NodeB measures the RTWP on each receive channel in each cell. The cell RTWP
obtained by the RNC is the linear average of the RTWPs measured on all receive channels in
a cell under the NodeB. The RTWP indicates the interference to a NodeB and the signal
strength on the RX port on the RF module.
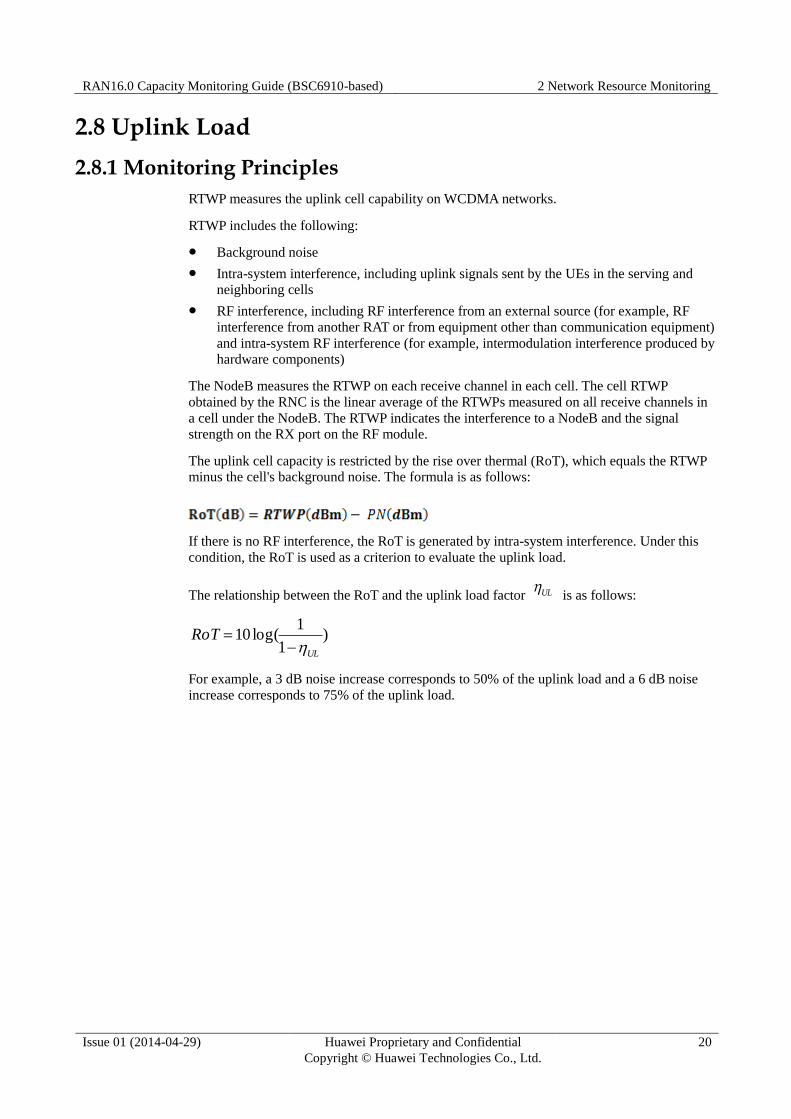
The uplink cell capacity is restricted by the rise over thermal (RoT), which equals the RTWP
minus the cell's background noise. The formula is as follows:
If there is no RF interference, the RoT is generated by intra-system interference. Under this
condition, the RoT is used as a criterion to evaluate the uplink load.
The relationship between the RoT and the uplink load factor UL is as follows:
)1
1log(10
UL
RoT
For example, a 3 dB noise increase corresponds to 50% of the uplink load and a 6 dB noise
increase corresponds to 75% of the uplink load.

RAN16.0 Capacity Monitoring Guide (BSC6910-based) 2 Network Resource Monitoring
Issue 01 (2014-04-29) Huawei Proprietary and Confidential
Copyright © Huawei Technologies Co., Ltd.
21
Figure 2-3 Relationship between RTWP, noise increase, and uplink load
A large RTWP value in a cell is caused by traffic overflow, hardware faults (for example, poor
quality of antennas or feeder connectors), or external interference. If the RTWP value is too
large, the cell coverage shrinks, the quality of admitted services declines, or new service
requests are rejected.
2.8.2 Monitoring Methods
The RTWP and Equivalent Number of Users (ENU) are indicated by the following counters:
VS.MeanRTWP: Mean Power of Totally Received Bandwidth for Cell
VS.MinRTWP: Minimum Power of Totally Received Bandwidth for Cell
VS.RAC.UL.EqvUserNum: Mean Number of UL Equivalent Voice UEs in CELL_DCH
State for Cell
UlTotalEqUserNum: total number of equivalent users in the uplink, which can be
queried using the RNC MML command LST UCELLCAC.
The UL ENU Ratio is calculated using the following formula:
UL ENU Ratio = VS.RAC.UL.EqvUserNum/UlTotalEqUserNum
In some areas, the background noise increases to -106 dBm or above due to external
interference or hardware faults. If this occurs, the value of the VS.MinRTWP counter (the
RTWP value obtained when the cell carries no traffic) is considered the background noise.
The RTWP of a cell is considered high when the value of the VS.MeanRTWP counter is
greater than -100 dBm during off-peak hours or greater than -90 dBm during peak hours for
two or three consecutive days in a week.
A cell is considered heavily loaded if the UL ENU Ratio exceeds 75% during peak hours for
two or three consecutive days in a week.
RAN16.0 Capacity Monitoring Guide (BSC6910-based) 2 Network Resource Monitoring
Issue 01 (2014-04-29) Huawei Proprietary and Confidential
Copyright © Huawei Technologies Co., Ltd.
22
2.8.3 Optimization Suggestions
Perform capacity expansion in the following scenarios:
If the value of the VS.MinRTWP counter is greater than -100 dBm or less than -110 dBm
during off-peak hours for three consecutive days in a week, there may be hardware faults
or external interference. Locate and rectify the faults and attempt to eliminate the
interference.
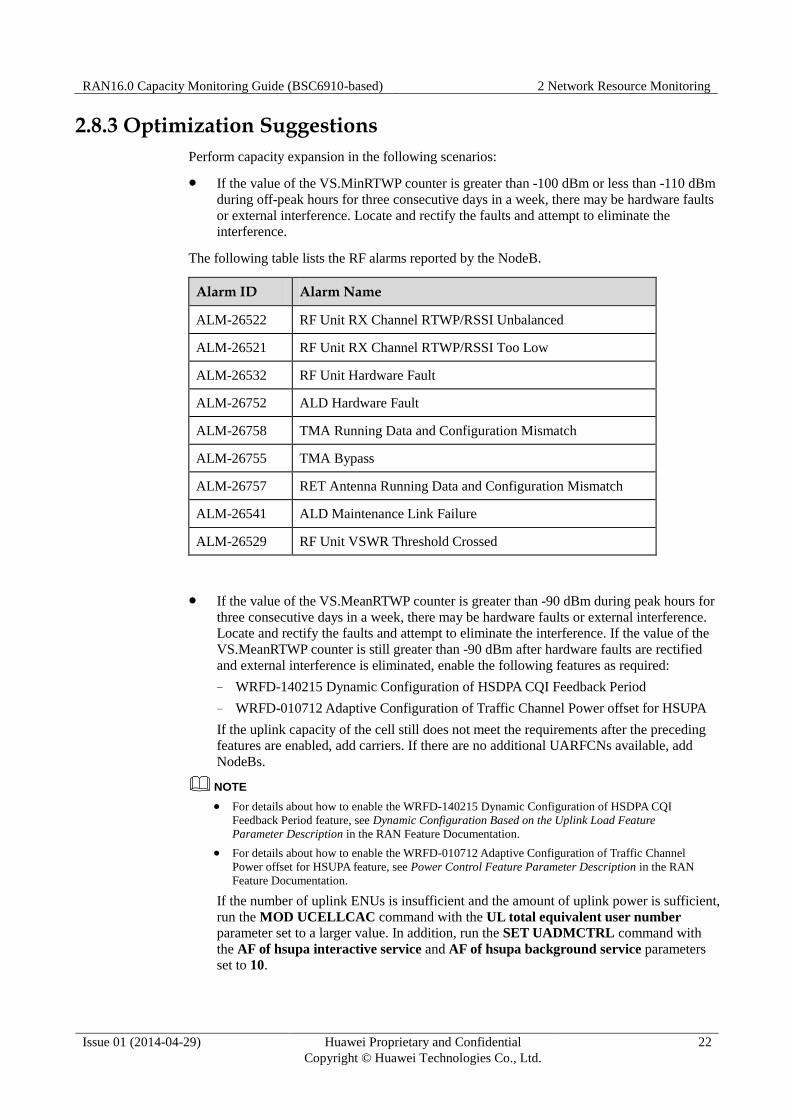
The following table lists the RF alarms reported by the NodeB.
Alarm ID Alarm Name
ALM-26522 RF Unit RX Channel RTWP/RSSI Unbalanced
ALM-26521 RF Unit RX Channel RTWP/RSSI Too Low
ALM-26532 RF Unit Hardware Fault
ALM-26752 ALD Hardware Fault
ALM-26758 TMA Running Data and Configuration Mismatch
ALM-26755 TMA Bypass
ALM-26757 RET Antenna Running Data and Configuration Mismatch
ALM-26541 ALD Maintenance Link Failure
ALM-26529 RF Unit VSWR Threshold Crossed
If the value of the VS.MeanRTWP counter is greater than -90 dBm during peak hours for
three consecutive days in a week, there may be hardware faults or external interference.
Locate and rectify the faults and attempt to eliminate the interference. If the value of the
VS.MeanRTWP counter is still greater than -90 dBm after hardware faults are rectified
and external interference is eliminated, enable the following features as required:
− WRFD-140215 Dynamic Configuration of HSDPA CQI Feedback Period
− WRFD-010712 Adaptive Configuration of Traffic Channel Power offset for HSUPA
If the uplink capacity of the cell still does not meet the requirements after the preceding
features are enabled, add carriers. If there are no additional UARFCNs available, add
NodeBs.
NOTE
For details about how to enable the WRFD-140215 Dynamic Configuration of HSDPA CQI
Feedback Period feature, see Dynamic Configuration Based on the Uplink Load Feature
Parameter Description in the RAN Feature Documentation.
For details about how to enable the WRFD-010712 Adaptive Configuration of Traffic Channel
Power offset for HSUPA feature, see Power Control Feature Parameter Description in the RAN
Feature Documentation.
If the number of uplink ENUs is insufficient and the amount of uplink power is sufficient,
run the MOD UCELLCAC command with the UL total equivalent user number
parameter set to a larger value. In addition, run the SET UADMCTRL command with
the AF of hsupa interactive service and AF of hsupa background service parameters
set to 10.
RAN16.0 Capacity Monitoring Guide (BSC6910-based) 2 Network Resource Monitoring
Issue 01 (2014-04-29) Huawei Proprietary and Confidential
Copyright © Huawei Technologies Co., Ltd.
23
2.9 OVSF Code Usage
2.9.1 Monitoring Principles
In a WCDMA system, channels are identified by codes. Two types of codes are used for each
channel. One is the scrambling code and the other is the Orthogonal Variable Spreading
Factor (OVSF) code.
In the uplink, each UE is allocated a unique scrambling code. In the downlink, each cell is
allocated a unique scrambling code; all UEs in a cell use the same scrambling code but each
of them is allocated a unique OVSF code. Therefore, OVSF codes distinguish the downlink
physical channels of different UEs in a cell.
In a WCDMA cell, different user data is distinguished by the CDMA technique, and all user
data is transmitted over the same central frequency almost at the same time. OVSF codes
provide perfect orthogonality, minimizing interference between different users.
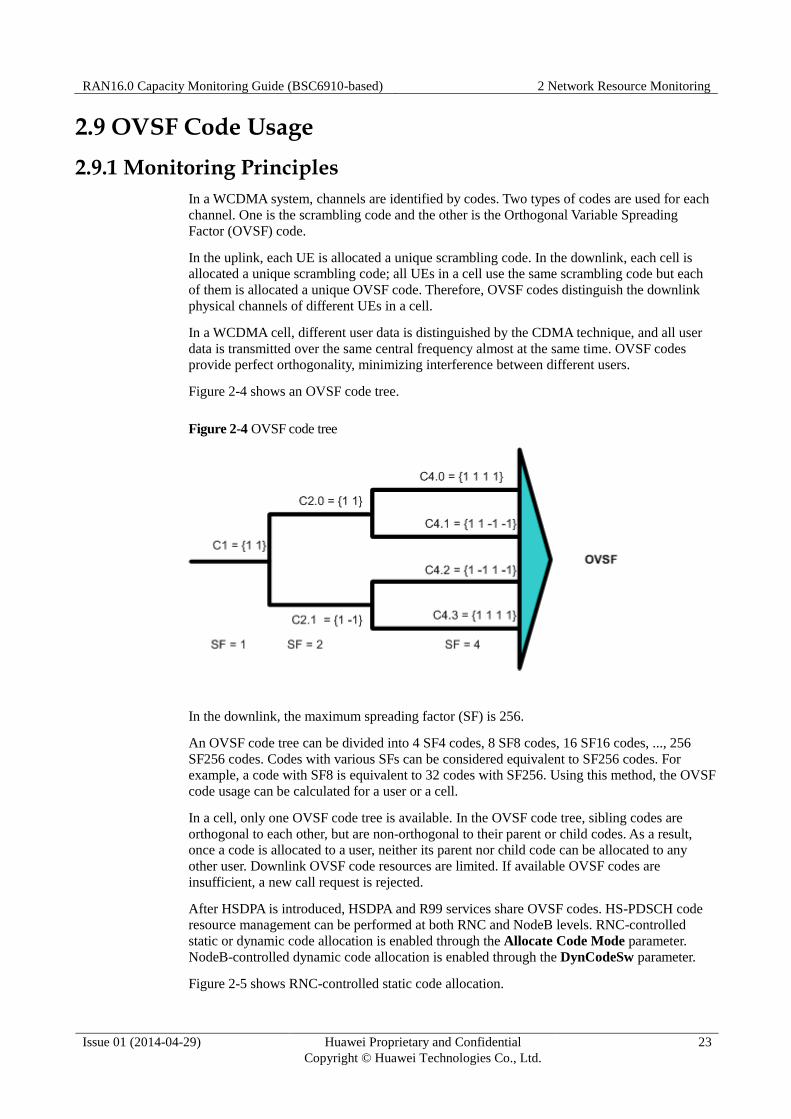
Figure 2-4 shows an OVSF code tree.
Figure 2-4 OVSF code tree
In the downlink, the maximum spreading factor (SF) is 256.
An OVSF code tree can be divided into 4 SF4 codes, 8 SF8 codes, 16 SF16 codes, ..., 256
SF256 codes. Codes with various SFs can be considered equivalent to SF256 codes. For
example, a code with SF8 is equivalent to 32 codes with SF256. Using this method, the OVSF
code usage can be calculated for a user or a cell.
In a cell, only one OVSF code tree is available. In the OVSF code tree, sibling codes are
orthogonal to each other, but are non-orthogonal to their parent or child codes. As a result,
once a code is allocated to a user, neither its parent nor child code can be allocated to any
other user. Downlink OVSF code resources are limited. If available OVSF codes are
insufficient, a new call request is rejected.
After HSDPA is introduced, HSDPA and R99 services share OVSF codes. HS-PDSCH code
resource management can be performed at both RNC and NodeB levels. RNC-controlled
static or dynamic code allocation is enabled through the Allocate Code Mode parameter.
NodeB-controlled dynamic code allocation is enabled through the DynCodeSw parameter.
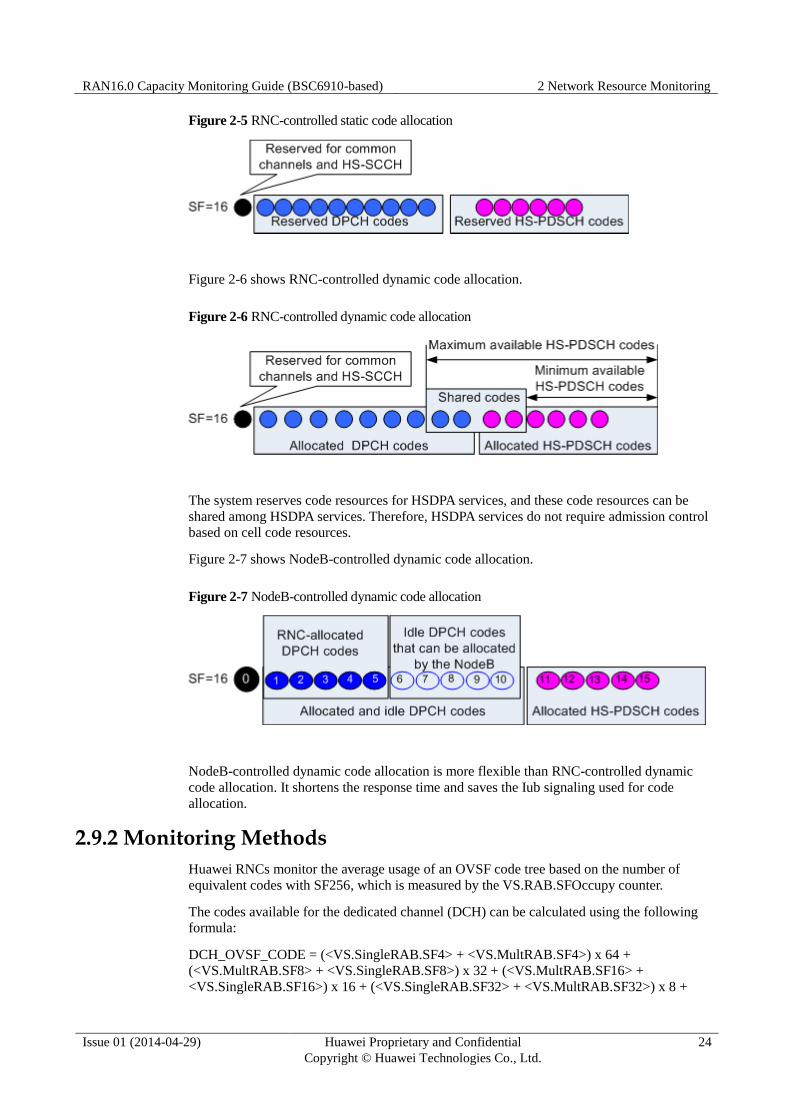
Figure 2-5 shows RNC-controlled static code allocation.
RAN16.0 Capacity Monitoring Guide (BSC6910-based) 2 Network Resource Monitoring
Issue 01 (2014-04-29) Huawei Proprietary and Confidential
Copyright © Huawei Technologies Co., Ltd.
24
Figure 2-5 RNC-controlled static code allocation
Figure 2-6 shows RNC-controlled dynamic code allocation.
Figure 2-6 RNC-controlled dynamic code allocation
The system reserves code resources for HSDPA services, and these code resources can be
shared among HSDPA services. Therefore, HSDPA services do not require admission control
based on cell code resources.
Figure 2-7 shows NodeB-controlled dynamic code allocation.
Figure 2-7 NodeB-controlled dynamic code allocation
NodeB-controlled dynamic code allocation is more flexible than RNC-controlled dynamic
code allocation. It shortens the response time and saves the Iub signaling used for code
allocation.
2.9.2 Monitoring Methods
Huawei RNCs monitor the average usage of an OVSF code tree based on the number of
equivalent codes with SF256, which is measured by the VS.RAB.SFOccupy counter.
The codes available for the dedicated channel (DCH) can be calculated using the following
formula:
DCH_OVSF_CODE = (<VS.SingleRAB.SF4> + <VS.MultRAB.SF4>) x 64 +
(<VS.MultRAB.SF8> + <VS.SingleRAB.SF8>) x 32 + (<VS.MultRAB.SF16> +
<VS.SingleRAB.SF16>) x 16 + (<VS.SingleRAB.SF32> + <VS.MultRAB.SF32>) x 8 +

RAN16.0 Capacity Monitoring Guide (BSC6910-based) 2 Network Resource Monitoring
Issue 01 (2014-04-29) Huawei Proprietary and Confidential
Copyright © Huawei Technologies Co., Ltd.
25
(<VS.MultRAB.SF64> + <VS.SingleRAB.SF64>) x 4 + (<VS.SingleRAB.SF128> +
<VS.MultRAB.SF128>) x 2 + (<VS.SingleRAB.SF256> + <VS.MultRAB.SF256>)
The maximum number of codes available for the DCH can be calculated using the following
formula:
DCH_OVSF_CODE_Ava = 256 - (Codes occupied by CCHs + Codes occupied by E-AGCHs
+ Codes occupied by E-RGCHs and E-HICHs + Codes reserved for HS-PDSCHs +
HS-SCCH codes)
For example, if the following conditions are met:
A cell that supports HSPA is configured with one SCCPCH, one E-AGCH, one
E-RGCH/E-HICH, and two HS-SCCHs.
At least one code is reserved for HSDPA services.
Then, DCH_OVSF_CODE_Ava = 256 - (8 + 1 + 2 + 16 + 4) = 225.
OVSF code usages are calculated as follows:
OVSF Usage= VS.RAB.SFOccupy/256 x 100%
DCH OVSF Usage = DCH_OVSF_CODE/DCH_OVSF_CODE_Ava
2.9.3 Optimization Suggestions
If the value of a cell's DCH OVSF Usage is greater than 70% during peak hours for three
consecutive days in a week, the cell runs out of OVSF codes.
Perform capacity expansion as follows:
Enable the WRFD-010631 Dynamic Code Allocation Based on NodeB feature if this
feature has not been enabled. Preferentially allocate idle codes to HSDPA UEs to
improve the HSDPA UE throughput.
Add a carrier or split the sector.
Enable the WRFD-010653 96 HSDPA Users per Cell feature if it is not enabled.
NOTE
For details about how to enable the WRFD-010631 Dynamic Code Allocation Based on NodeB feature
and the WRFD-010653 96 HSDPA Users per Cell feature, see HSDPA Feature Parameter Description in
the RAN Feature Documentation.
2.10 CE Usage
2.10.1 Monitoring Principles
CE resources are baseband processing resources in a NodeB. The more CEs a NodeB supports,
the stronger the NodeB's service processing capability. If a new call arrives but there are not
enough CEs (not enough baseband processing resources), the call will be blocked.
Uplink CE resources can be shared in an uplink resource group, but not between uplink
resource groups. Downlink CE resources are associated with the baseband processing
boards where a cell is set up. CE resources allocated by licenses are shared among services on
the NodeB. (CE resources are shared on a per operator basis in MOCN scenarios.)
The NodeB sends the RNC a response message that carries its CE capability. The NodeB's CE
capability is limited by both the installed hardware and the configured software licenses.
RAN16.0 Capacity Monitoring Guide (BSC6910-based) 2 Network Resource Monitoring
Issue 01 (2014-04-29) Huawei Proprietary and Confidential
Copyright © Huawei Technologies Co., Ltd.
26
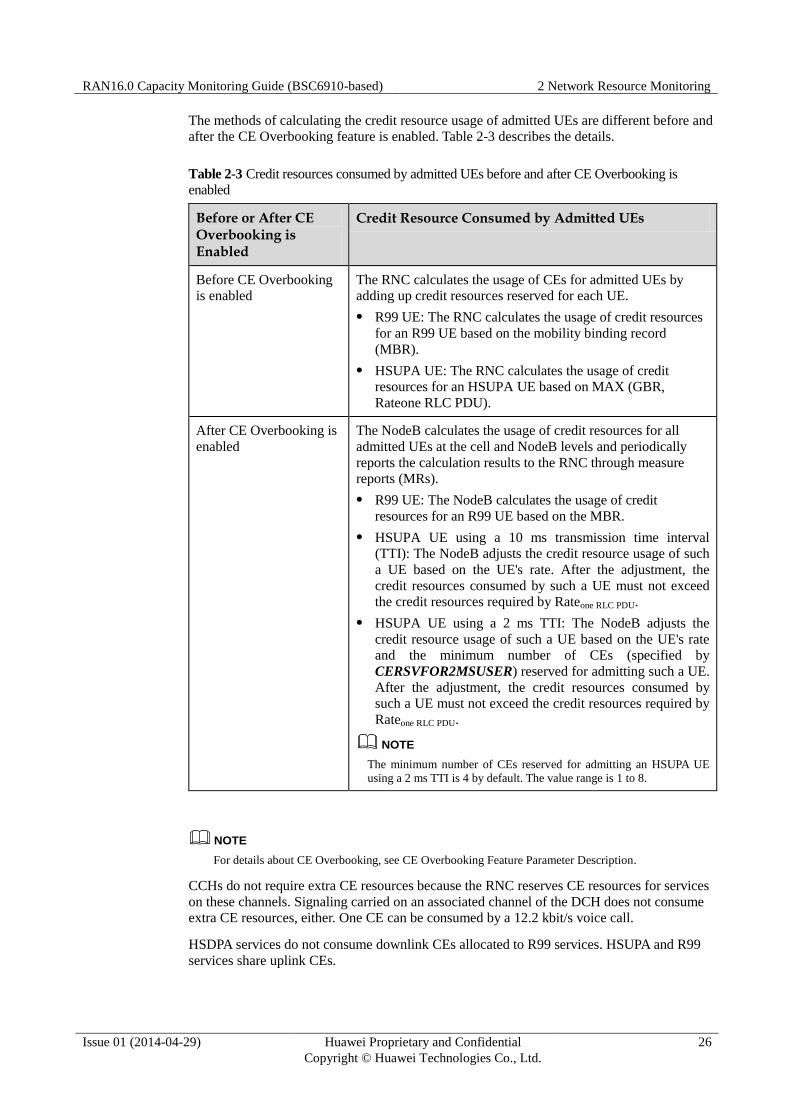
The methods of calculating the credit resource usage of admitted UEs are different before and
after the CE Overbooking feature is enabled. Table 2-3 describes the details.
Table 2-3 Credit resources consumed by admitted UEs before and after CE Overbooking is
enabled
Before or After CE Overbooking is Enabled
Credit Resource Consumed by Admitted UEs
Before CE Overbooking
is enabled
The RNC calculates the usage of CEs for admitted UEs by
adding up credit resources reserved for each UE.
R99 UE: The RNC calculates the usage of credit resources
for an R99 UE based on the mobility binding record
(MBR).
HSUPA UE: The RNC calculates the usage of credit
resources for an HSUPA UE based on MAX (GBR,
Rateone RLC PDU).
After CE Overbooking is
enabled
The NodeB calculates the usage of credit resources for all
admitted UEs at the cell and NodeB levels and periodically
reports the calculation results to the RNC through measure
reports (MRs).
R99 UE: The NodeB calculates the usage of credit
resources for an R99 UE based on the MBR.
HSUPA UE using a 10 ms transmission time interval
(TTI): The NodeB adjusts the credit resource usage of such
a UE based on the UE's rate. After the adjustment, the
credit resources consumed by such a UE must not exceed
the credit resources required by Rateone RLC PDU.
HSUPA UE using a 2 ms TTI: The NodeB adjusts the
credit resource usage of such a UE based on the UE's rate
and the minimum number of CEs (specified by
CERSVFOR2MSUSER) reserved for admitting such a UE.
After the adjustment, the credit resources consumed by
such a UE must not exceed the credit resources required by
Rateone RLC PDU.
NOTE
The minimum number of CEs reserved for admitting an HSUPA UE
using a 2 ms TTI is 4 by default. The value range is 1 to 8.
NOTE
For details about CE Overbooking, see CE Overbooking Feature Parameter Description.
CCHs do not require extra CE resources because the RNC reserves CE resources for services
on these channels. Signaling carried on an associated channel of the DCH does not consume
extra CE resources, either. One CE can be consumed by a 12.2 kbit/s voice call.
HSDPA services do not consume downlink CEs allocated to R99 services. HSUPA and R99
services share uplink CEs.
RAN16.0 Capacity Monitoring Guide (BSC6910-based) 2 Network Resource Monitoring
Issue 01 (2014-04-29) Huawei Proprietary and Confidential
Copyright © Huawei Technologies Co., Ltd.
27
For details about CE number consumed by different services, see CE Resource Management Feature Parameter Description.
2.10.2 Monitoring Methods
The following RNC counters are used to monitor CE usage:
VS.NodeB.ULCreditUsed.Mean: Average NodeB Uplink Credit Usage When CE
Overbooking Is Enabled for NodeB
VS.LC.ULCreditUsed.Mean: Mean Usage of UL Credit for Cell
VS.LC.DLCreditUsed.Mean: Mean Usage of DL Credit for Cell
The NodeB uses separate baseband processing units in the uplink and downlink. Therefore,
the NodeB manages uplink and downlink CE resources separately. The uplink and downlink
CE resource usages are calculated as follows:
License-based uplink CE usage
License-based uplink CE usage = UL NodeB Mean CE Used Number/UL License CE
Number
If the value of the VS.NodeB.ULCreditUsed.Mean counter is greater than 0, the CE
Overbooking feature has taken effect, and the following formula is true:
UL NodeB Mean CE Used Number = VS.NodeB.ULCreditUsed.Mean/2
Otherwise, the following formula is true:
UL NodeB Mean CE Used Number =
Sum_AllCells_of_NodeB(VS.LC.ULCreditUsed.Mean/2)
where
"VS.LC.ULCreditUsed.Mean/2" indicates the number of uplink CEs because the number
of uplink credit resources is twice the number of uplink CEs, whereas the number of
downlink credit resources is equal to the number of downlink CEs.
UL License CE Number = UL NodeB License CE Cfg Number
License-based downlink CE usage
License-based downlink CE usage = DL NodeB Mean CE Used Number/DL License CE
Number
DL NodeB Mean CE Used Number =
Sum_AllCells_of_NodeB(VS.LC.DLCreditUsed.Mean)
DL License CE Number = DL NodeB License CE Cfg Number
Hardware-based uplink CE usage
Hardware-based uplink CE usage = UL NodeB Mean CE Used Number/UL CE Capacity
Number
The value of UL NodeB Mean CE Used Number equals that used for calculating the
license-based uplink CE usage.
UL CE Capacity Number = VS.HW.ULCreditAvailable
Hardware-based downlink CE usage
Hardware-based downlink CE usage = DL NodeB Mean CE Used Number/DL CE
Capacity Number
The value of DL NodeB Mean CE Used Number equals that used for calculating the
license-based downlink CE usage.
DL CE Capacity Number = VS.HW.DLCreditAvailable

RAN16.0 Capacity Monitoring Guide (BSC6910-based) 2 Network Resource Monitoring
Issue 01 (2014-04-29) Huawei Proprietary and Confidential
Copyright © Huawei Technologies Co., Ltd.
28
The CE resource usage can be monitored by alarms. If the CE hardware capacity is exceeded,
ALM-28230 Base Station Service Overload is reported.
2.10.3 Optimization Suggestions
If the uplink/downlink license- or hardware-based CE usage is consistently greater than 70%
during peak hours for three consecutive days in a week, perform capacity expansion as
follows:
If the license-based CE usage exceeds its capacity expansion threshold, CE resources are
limited by the license. In this situation, upgrade the license file.
If the hardware-based CE usage exceeds the capacity expansion threshold, CE resources
are limited by the hardware capacity. In this situation, add WBBP boards.
If capacity expansion is inapplicable, perform the following operations:
Run the RNC MML command SET UCORRMALGOSWITCH. In this step, select
the DRA_DCCC_SWITCH
and DRA_BASE_ADM_CE_BE_TTI_RECFG_SWITCH check boxes under
the Dynamic Resource Allocation Switch parameter to enable the DCCC algorithm and
the TTI dynamic adjustment algorithm for admission CE-based BE services,
respectively.
Run the RNC MML command SET UUSERGBR with the Uplink GBR for BE service
parameter set to D32.
Newly added CE resources can share the traffic in hotspots and relieve CE congestion caused
by traffic overflow.
2.11 Iub Bandwidth Usage
2.11.1 Monitoring Principles
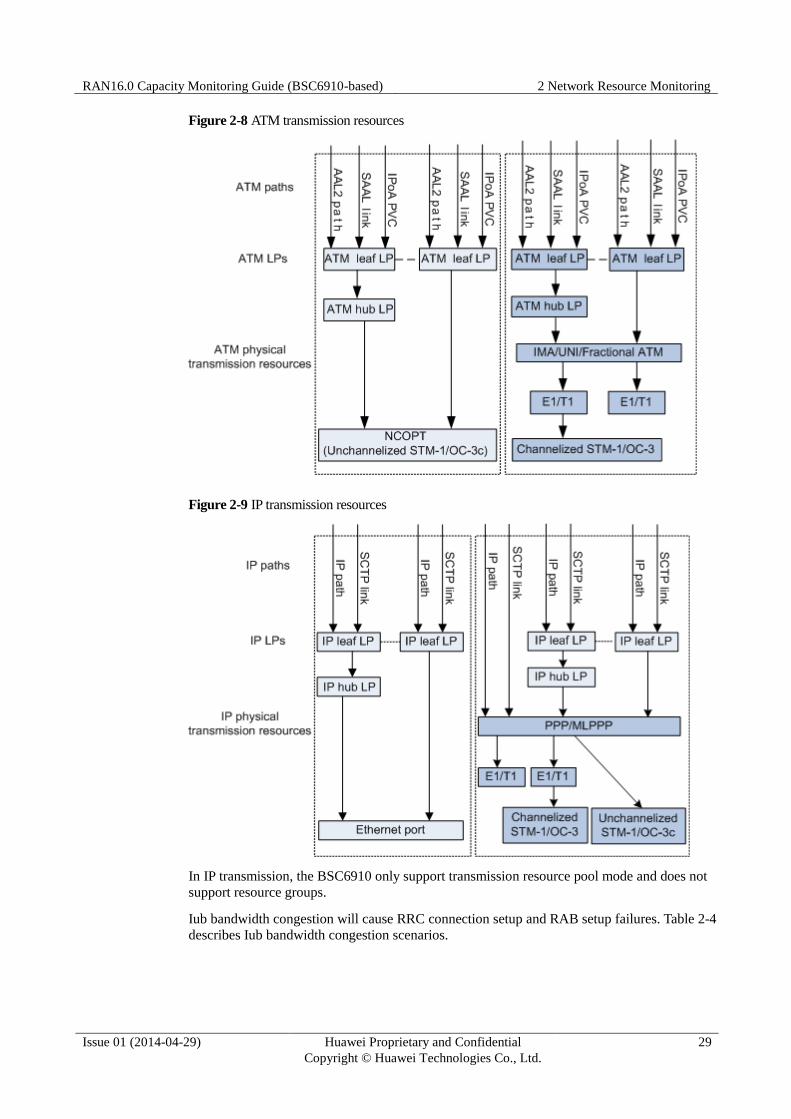
The Iub interface exists between the NodeB and RNC. The interface uses ATM or IP
transmission depending on the transmission medium.
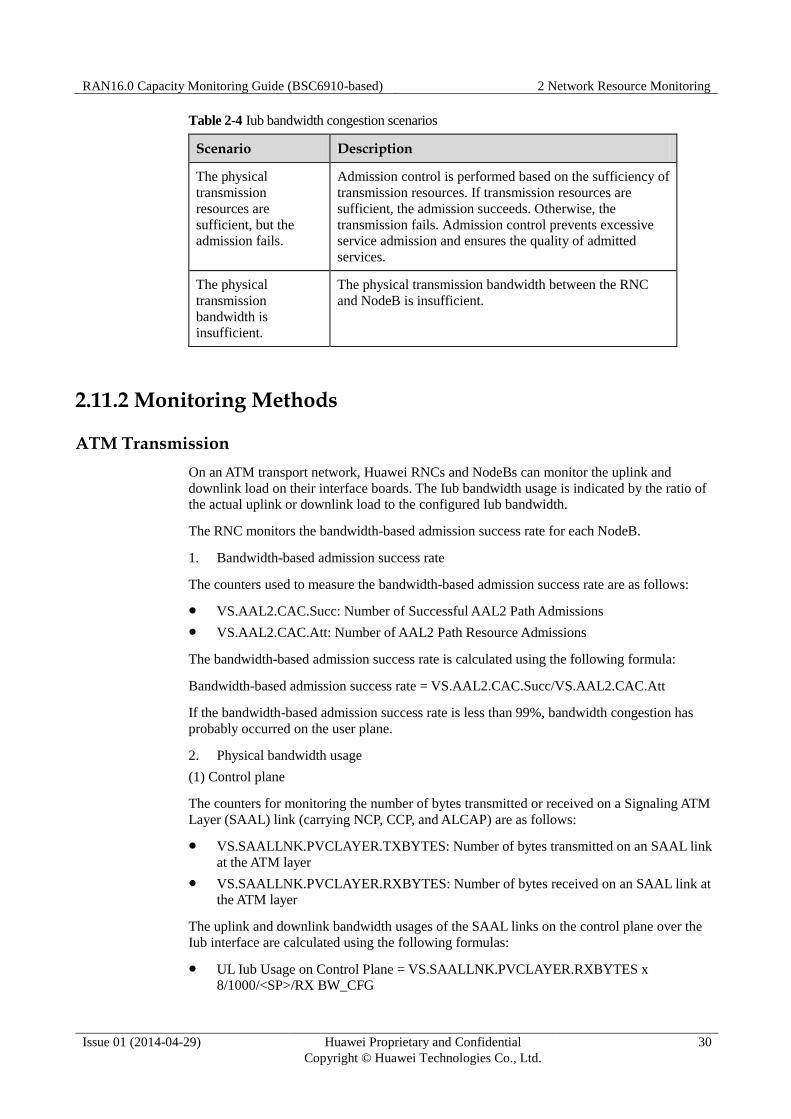
ATM and IP transmission resources can be classified into physical resources, logical port (LP)
resources, resource groups, and link resources, as shown in Figure 2-8 and Figure 2-9.
RAN16.0 Capacity Monitoring Guide (BSC6910-based) 2 Network Resource Monitoring
Issue 01 (2014-04-29) Huawei Proprietary and Confidential
Copyright © Huawei Technologies Co., Ltd.
29
Figure 2-8 ATM transmission resources
Figure 2-9 IP transmission resources
In IP transmission, the BSC6910 only support transmission resource pool mode and does not
support resource groups.
Iub bandwidth congestion will cause RRC connection setup and RAB setup failures. Table 2-4
describes Iub bandwidth congestion scenarios.
RAN16.0 Capacity Monitoring Guide (BSC6910-based) 2 Network Resource Monitoring
Issue 01 (2014-04-29) Huawei Proprietary and Confidential
Copyright © Huawei Technologies Co., Ltd.
30
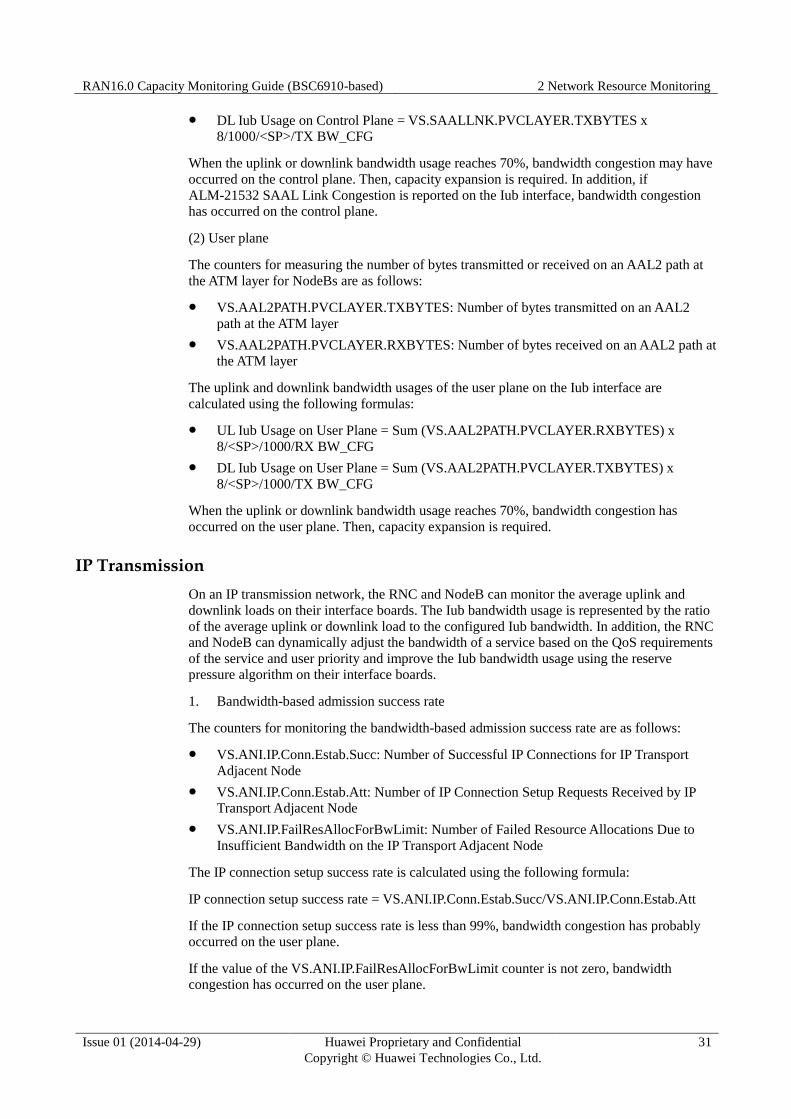
Table 2-4 Iub bandwidth congestion scenarios
Scenario Description
The physical
transmission
resources are
sufficient, but the
admission fails.
Admission control is performed based on the sufficiency of
transmission resources. If transmission resources are
sufficient, the admission succeeds. Otherwise, the
transmission fails. Admission control prevents excessive
service admission and ensures the quality of admitted
services.
The physical
transmission
bandwidth is
insufficient.
The physical transmission bandwidth between the RNC
and NodeB is insufficient.
2.11.2 Monitoring Methods
ATM Transmission
On an ATM transport network, Huawei RNCs and NodeBs can monitor the uplink and
downlink load on their interface boards. The Iub bandwidth usage is indicated by the ratio of
the actual uplink or downlink load to the configured Iub bandwidth.
The RNC monitors the bandwidth-based admission success rate for each NodeB.
1. Bandwidth-based admission success rate
The counters used to measure the bandwidth-based admission success rate are as follows:
VS.AAL2.CAC.Succ: Number of Successful AAL2 Path Admissions
VS.AAL2.CAC.Att: Number of AAL2 Path Resource Admissions
The bandwidth-based admission success rate is calculated using the following formula:
Bandwidth-based admission success rate = VS.AAL2.CAC.Succ/VS.AAL2.CAC.Att
If the bandwidth-based admission success rate is less than 99%, bandwidth congestion has
probably occurred on the user plane.
2. Physical bandwidth usage
(1) Control plane
The counters for monitoring the number of bytes transmitted or received on a Signaling ATM
Layer (SAAL) link (carrying NCP, CCP, and ALCAP) are as follows:
VS.SAALLNK.PVCLAYER.TXBYTES: Number of bytes transmitted on an SAAL link
at the ATM layer
VS.SAALLNK.PVCLAYER.RXBYTES: Number of bytes received on an SAAL link at
the ATM layer
The uplink and downlink bandwidth usages of the SAAL links on the control plane over the
Iub interface are calculated using the following formulas:
UL Iub Usage on Control Plane = VS.SAALLNK.PVCLAYER.RXBYTES x 8/1000/<SP>/RX BW_CFG
RAN16.0 Capacity Monitoring Guide (BSC6910-based) 2 Network Resource Monitoring
Issue 01 (2014-04-29) Huawei Proprietary and Confidential
Copyright © Huawei Technologies Co., Ltd.
31
DL Iub Usage on Control Plane = VS.SAALLNK.PVCLAYER.TXBYTES x
8/1000/<SP>/TX BW_CFG
When the uplink or downlink bandwidth usage reaches 70%, bandwidth congestion may have
occurred on the control plane. Then, capacity expansion is required. In addition, if
ALM-21532 SAAL Link Congestion is reported on the Iub interface, bandwidth congestion
has occurred on the control plane.
(2) User plane
The counters for measuring the number of bytes transmitted or received on an AAL2 path at
the ATM layer for NodeBs are as follows:
VS.AAL2PATH.PVCLAYER.TXBYTES: Number of bytes transmitted on an AAL2
path at the ATM layer
VS.AAL2PATH.PVCLAYER.RXBYTES: Number of bytes received on an AAL2 path at
the ATM layer
The uplink and downlink bandwidth usages of the user plane on the Iub interface are
calculated using the following formulas:
UL Iub Usage on User Plane = Sum (VS.AAL2PATH.PVCLAYER.RXBYTES) x
8/<SP>/1000/RX BW_CFG
DL Iub Usage on User Plane = Sum (VS.AAL2PATH.PVCLAYER.TXBYTES) x
8/<SP>/1000/TX BW_CFG
When the uplink or downlink bandwidth usage reaches 70%, bandwidth congestion has
occurred on the user plane. Then, capacity expansion is required.
IP Transmission
On an IP transmission network, the RNC and NodeB can monitor the average uplink and
downlink loads on their interface boards. The Iub bandwidth usage is represented by the ratio
of the average uplink or downlink load to the configured Iub bandwidth. In addition, the RNC
and NodeB can dynamically adjust the bandwidth of a service based on the QoS requirements
of the service and user priority and improve the Iub bandwidth usage using the reserve
pressure algorithm on their interface boards.
1. Bandwidth-based admission success rate
The counters for monitoring the bandwidth-based admission success rate are as follows:
VS.ANI.IP.Conn.Estab.Succ: Number of Successful IP Connections for IP Transport
Adjacent Node
VS.ANI.IP.Conn.Estab.Att: Number of IP Connection Setup Requests Received by IP
Transport Adjacent Node
VS.ANI.IP.FailResAllocForBwLimit: Number of Failed Resource Allocations Due to
Insufficient Bandwidth on the IP Transport Adjacent Node
The IP connection setup success rate is calculated using the following formula:
IP connection setup success rate = VS.ANI.IP.Conn.Estab.Succ/VS.ANI.IP.Conn.Estab.Att
If the IP connection setup success rate is less than 99%, bandwidth congestion has probably
occurred on the user plane.
If the value of the VS.ANI.IP.FailResAllocForBwLimit counter is not zero, bandwidth congestion has occurred on the user plane.
RAN16.0 Capacity Monitoring Guide (BSC6910-based) 2 Network Resource Monitoring
Issue 01 (2014-04-29) Huawei Proprietary and Confidential
Copyright © Huawei Technologies Co., Ltd.
32
2. Physical bandwidth usage
(1) Control plane
The counters for monitoring the number of bytes transmitted or received on an SCTP link
(carrying NCP, CCP, and ALCAP) are as follows:
VS.SCTP.TX.BYTES: Number of IP bytes transmitted on an SCTP link
VS.SCTP.RX.BYTES: Number of IP bytes received on an SCTP link
The uplink and downlink traffic volumes of the SCTP links on the control plane over the Iub
interface are calculated using the following formulas:
SCTP UL KBPS = VS.SCTP.RX.BYTES x 8/<SP>/1000
SCTP DL KBPS = VS.SCTP.TX.BYTES x 8/<SP>/1000
If ALM-21542 SCTP Link Congestion is reported on the Iub interface, bandwidth congestion
has occurred on the control plane.
(2) User plane
In transmission resource pool networking, the number of IP bytes transmitted or received on
the user plane by each adjacent node is measured by the following counters:
VS.IPPOOL.ANI.IPLAYER.TXBYTES: Number of IP bytes transmitted on the user
plane of an adjacent node
VS.IPPOOL.ANI.IPLAYER.RXBYTES: Number of IP bytes received on the user plane
of an adjacent node
The Iub bandwidth usage of a transmission resource pool is calculated using the following
formulas:
UL Iub Usage on User Plane = VS.IPPOOL.ANI.IPLAYER.RXBYTES x
8/<SP>/1000/RX BW_CFG
DL Iub Usage on User Plane = VS.IPPOOL.ANI.IPLAYER.TXBYTES x
8/<SP>/1000/TX BW_CFG
If the uplink or downlink bandwidth usage of the user plane on the Iub interface reaches 70%,
bandwidth congestion has occurred on the user plane. Then, capacity expansion is required.
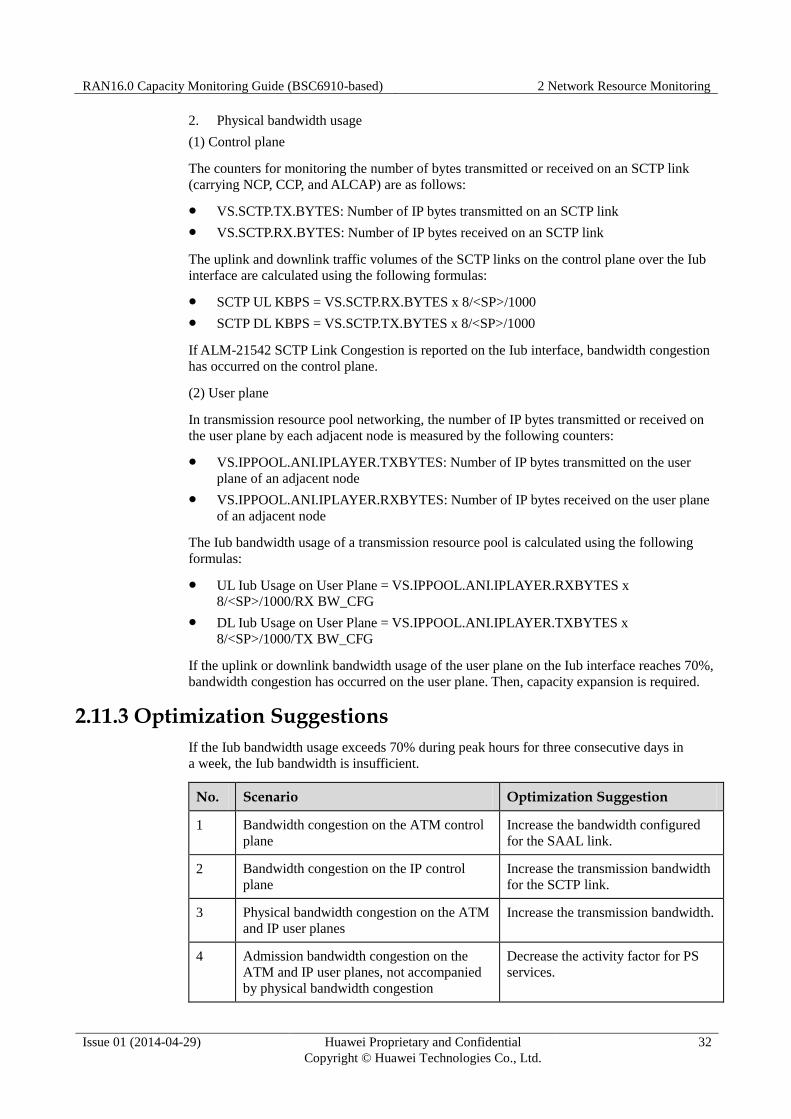
2.11.3 Optimization Suggestions
If the Iub bandwidth usage exceeds 70% during peak hours for three consecutive days in
a week, the Iub bandwidth is insufficient.
No. Scenario Optimization Suggestion
1 Bandwidth congestion on the ATM control
plane
Increase the bandwidth configured
for the SAAL link.
2 Bandwidth congestion on the IP control
plane
Increase the transmission bandwidth
for the SCTP link.
3 Physical bandwidth congestion on the ATM
and IP user planes
Increase the transmission bandwidth.
4 Admission bandwidth congestion on the
ATM and IP user planes, not accompanied
by physical bandwidth congestion
Decrease the activity factor for PS
services.
RAN16.0 Capacity Monitoring Guide (BSC6910-based) 2 Network Resource Monitoring
Issue 01 (2014-04-29) Huawei Proprietary and Confidential
Copyright © Huawei Technologies Co., Ltd.
33
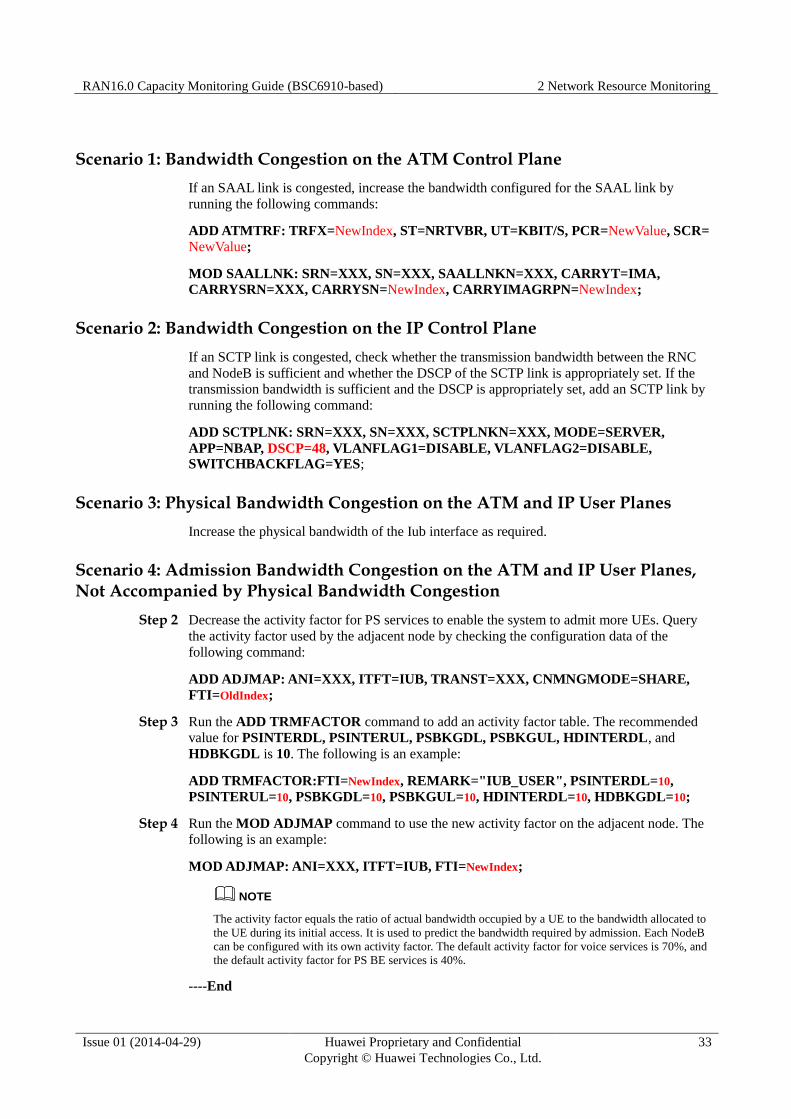
Scenario 1: Bandwidth Congestion on the ATM Control Plane
If an SAAL link is congested, increase the bandwidth configured for the SAAL link by
running the following commands:
ADD ATMTRF: TRFX=NewIndex, ST=NRTVBR, UT=KBIT/S, PCR=NewValue, SCR=
NewValue;
MOD SAALLNK: SRN=XXX, SN=XXX, SAALLNKN=XXX, CARRYT=IMA,
CARRYSRN=XXX, CARRYSN=NewIndex, CARRYIMAGRPN=NewIndex;
Scenario 2: Bandwidth Congestion on the IP Control Plane
If an SCTP link is congested, check whether the transmission bandwidth between the RNC
and NodeB is sufficient and whether the DSCP of the SCTP link is appropriately set. If the
transmission bandwidth is sufficient and the DSCP is appropriately set, add an SCTP link by
running the following command:
ADD SCTPLNK: SRN=XXX, SN=XXX, SCTPLNKN=XXX, MODE=SERVER,
APP=NBAP, DSCP=48, VLANFLAG1=DISABLE, VLANFLAG2=DISABLE, SWITCHBACKFLAG=YES;
Scenario 3: Physical Bandwidth Congestion on the ATM and IP User Planes
Increase the physical bandwidth of the Iub interface as required.
Scenario 4: Admission Bandwidth Congestion on the ATM and IP User Planes, Not Accompanied by Physical Bandwidth Congestion
Step 2 Decrease the activity factor for PS services to enable the system to admit more UEs. Query
the activity factor used by the adjacent node by checking the configuration data of the
following command:
ADD ADJMAP: ANI=XXX, ITFT=IUB, TRANST=XXX, CNMNGMODE=SHARE,
FTI=OldIndex;
Step 3 Run the ADD TRMFACTOR command to add an activity factor table. The recommended
value for PSINTERDL, PSINTERUL, PSBKGDL, PSBKGUL, HDINTERDL, and
HDBKGDL is 10. The following is an example:
ADD TRMFACTOR:FTI=NewIndex, REMARK="IUB_USER", PSINTERDL=10,
PSINTERUL=10, PSBKGDL=10, PSBKGUL=10, HDINTERDL=10, HDBKGDL=10;
Step 4 Run the MOD ADJMAP command to use the new activity factor on the adjacent node. The
following is an example:
MOD ADJMAP: ANI=XXX, ITFT=IUB, FTI=NewIndex;
NOTE
The activity factor equals the ratio of actual bandwidth occupied by a UE to the bandwidth allocated to
the UE during its initial access. It is used to predict the bandwidth required by admission. Each NodeB
can be configured with its own activity factor. The default activity factor for voice services is 70%, and
the default activity factor for PS BE services is 40%.
----End
RAN16.0 Capacity Monitoring Guide (BSC6910-based) 2 Network Resource Monitoring
Issue 01 (2014-04-29) Huawei Proprietary and Confidential
Copyright © Huawei Technologies Co., Ltd.
34
2.12 NodeB CNBAP Load
2.12.1 Monitoring Principles
CNBAP load is used to assess a NodeB's processing capability. CNBAP overload will cause a
radio link setup failure, thereby decreasing the RRC connection setup and RAB setup success
rates.
2.12.2 Monitoring Methods
The following NodeB counters are used to monitor the CNBAP load:
VS.RadioLink.Recv.Mean: average number of wireless connection receptions per second
VS.DedicMeaRpt.MEAN: average number of Dedicated Measurement Reporting per
second
VS.BTS.CnbapCap.UseRate: Average CNBAP ratio of the NodeB
The CNBAP load on a NodeB is limited by the license and hardware capacity. The license-
and hardware-based CNBAP usages are calculated using the following formulas:
License-based CNBAP Usage = (VS.RadioLink.Recv.Mean +
VS.DedicMeaRpt.MEAN/12)/License CNBAP
where License CNBAP = NodeB License CNBAP Cfg Number
Hardware-based CNBAP Usage = VS.BTS.CnbapCap.UseRate
CNBAP resource usage can be monitored by alarms. If the CNBAP hardware capacity is
exceeded, ALM-28230 Base Station Service Overload is reported.
2.12.3 Optimization Suggestions
If the license- or hardware-based CNBAP usage on the NodeB is greater than 60% during
peak hours for three consecutive days in a week, the NodeB is considered overloaded.
Perform capacity expansion as follows:
Enable the WRFD-010202 UE State in Connected Mode (CELL_DCH, CELL_PCH,
URA_PCH, CELL_FACH) and WRFD-020500 Enhanced Fast Dormancy features.
If the license-based CNBAP usage exceeds its capacity expansion threshold, CNBAP
resources are limited by the license. In this situation, upgrade the license file.
If the hardware-based CNBAP usage exceeds its capacity expansion threshold, CNBAP
resources are limited by the hardware. In this situation, replace the WMPT board with
the UMPT board, add baseband processing boards, or replace baseband processing
boards with those of higher specifications.
Split the NodeB or add a NodeB if the CNBAP overload problem cannot be solved by
upgrading the license file or by adding or replacing boards.
RAN16.0 Capacity Monitoring Guide (BSC6910-based) 2 Network Resource Monitoring
Issue 01 (2014-04-29) Huawei Proprietary and Confidential
Copyright © Huawei Technologies Co., Ltd.
35
NOTE For details about how to enable the WRFD-010202 UE State in Connected Mode (CELL_DCH,
CELL_PCH, URA_PCH, CELL_FACH) feature, see State Transition Feature
Parameter Description in the RAN Feature Documentation.
For details about how to enable the WRFD-020500 Enhanced Fast Dormancy feature, see Enhanced
Fast Dormancy Feature Parameter Description in the RAN Feature Documentation.
The maximum CNBAP capability of a NodeB is 1500. When the CNBAP capability configured for a
NodeB is less than 1500, replace boards to expand the capacity if CNBAP overload occurs. For the
CNBAP capabilities of the WBBP boards, see 3900 Series Base Station Technical Description.
2.13 HSPA Users
2.13.1 Monitoring Principles
HSPA services are mainly carried on the WBBP or UBBP boards in a NodeB. Therefore, the
number of HSPA users determines WBBP board loads. If WBBP boards are overloaded with
HSPA users, new users may fail to access the network.
2.13.2 Monitoring Methods
The following NodeB counters are used to monitor the percentage of the number of HSPA
users on a WBBP or UBBP board to the configured number of HSPA users:
VS.BOARD.UsedHsdpaUserRatio.Mean: average ratio of HSDPA users on a board
VS.BOARD.UsedHsupaUserRatio.Mean: average ratio of HSUPA users on a board
2.13.3 Optimization Suggestions
If the percentage of the number of HSDPA/HSUPA users on a WBBP or UBBP board to the
configured number of HSDPA/HSUPA users is greater than 60% during peak hours for three
consecutive days in a week, perform capacity expansion as follows:
Enable the WRFD-150242 HSDPA Scheduler Pool feature if
VS.BOARD.UsedHsdpaUserRatio.Mean is greater than 60% only on individual WBBP
boards.
Add WBBP boards or replace the existing WBBP or UBBP boards with those of higher
specifications.
Split the NodeB or add a NodeB if no more WBBP or UBBP boards can be added.
NOTE
For details about how to enable the WRFD-150242 HSDPA Scheduler Pool feature, see HSDPA
Scheduler Pool Feature Parameter Description in the RAN feature documentation.
The number of HSPA users supported by a WBBP or UBBP board varies according to the board type.
For detailed numbers of HSPA users supported by different WBBP boards, see 3900 Series Base
Station Technical Description.

RAN16.0 Capacity Monitoring Guide (BSC6910-based) 3 Network Resource Troubleshooting
Issue 01 (2014-04-29) Huawei Proprietary and Confidential
Copyright © Huawei Technologies Co., Ltd.
36
3 Network Resource Troubleshooting
The monitoring method described in chapter 2 "Network Resource Monitoring" is effective in
most scenarios. However, other scenarios may require more detailed troubleshooting to
determine if high resource occupancy is caused by traffic increases or other abnormalities.
This chapter describes how to locate network resource problems that require more detailed
troubleshooting and is intended for personnel who:
Have a deep understanding of WCDMA networks
Are familiar with the signaling procedure
Are familiar with the operation and maintenance of Huawei products
3.1 Possible Block and Failure Points in the Basic Call Flow
When network resources are insufficient, accessibility-related KPIs are likely to be affected
first.
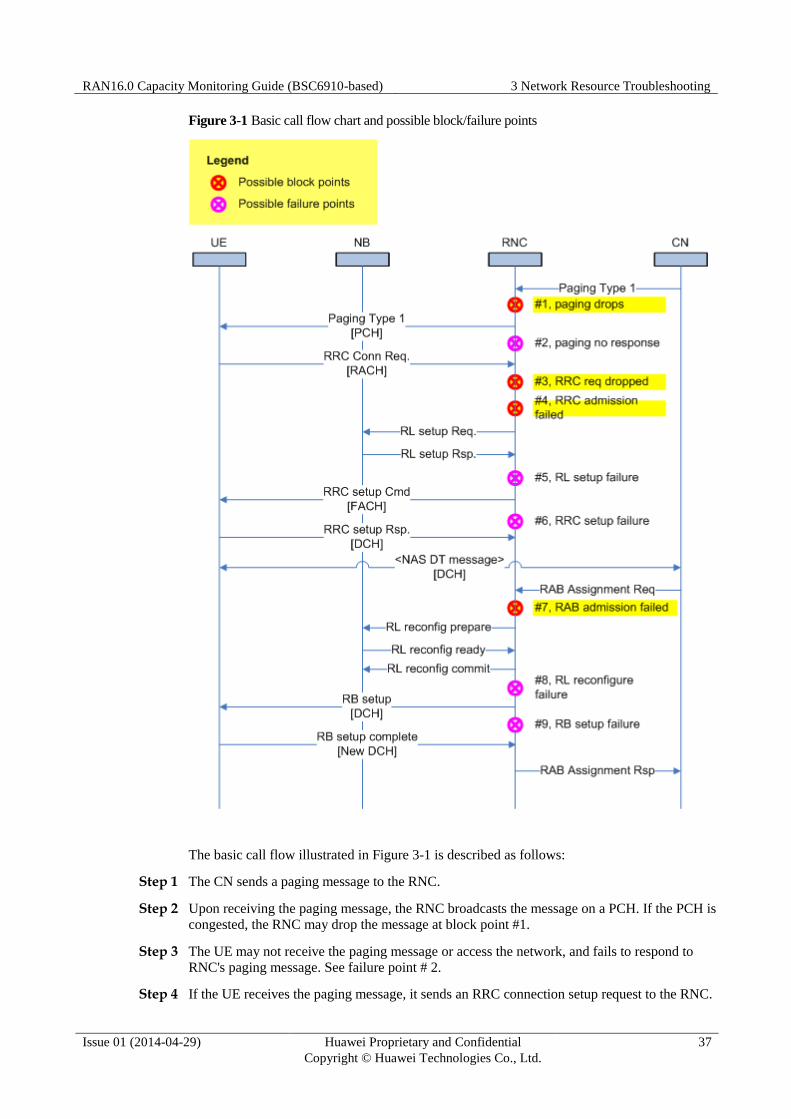
Figure 3-1 uses a mobile terminated call (MTC) as an example to illustrate the basic call
flow, with possible block/failure points indicated. For details about the basic call process, see
3GPP TS 25.931.
RAN16.0 Capacity Monitoring Guide (BSC6910-based) 3 Network Resource Troubleshooting
Issue 01 (2014-04-29) Huawei Proprietary and Confidential
Copyright © Huawei Technologies Co., Ltd.
37
Figure 3-1 Basic call flow chart and possible block/failure points
The basic call flow illustrated in Figure 3-1 is described as follows:
Step 1 The CN sends a paging message to the RNC.
Step 2 Upon receiving the paging message, the RNC broadcasts the message on a PCH. If the PCH is
congested, the RNC may drop the message at block point #1.
Step 3 The UE may not receive the paging message or access the network, and fails to respond to
RNC's paging message. See failure point # 2.
Step 4 If the UE receives the paging message, it sends an RRC connection setup request to the RNC.
RAN16.0 Capacity Monitoring Guide (BSC6910-based) 3 Network Resource Troubleshooting
Issue 01 (2014-04-29) Huawei Proprietary and Confidential
Copyright © Huawei Technologies Co., Ltd.
38
Step 5 If the RNC is congested when receiving the RRC connection setup request, the RNC may
drop the request message. See block point #3.
Step 6 If the RNC receives the RRC connection setup request and does not discard it, the RNC
determines whether to accept or reject the request. The request may be rejected due to
insufficient resources, as shown in block point #4.
Step 7 If the RNC accepts the request, the RNC instructs the UE to set up an RRC connection. The
UE may not receive RNC's response message or may find that the configuration does not
support RRC connection setup. See failure points #5 and #6.
Step 8 After the RRC connection is set up, the UE sends NAS messages to negotiate with the CN
about service setup. If the CN determines to set up a service, the CN sends an RAB
assignment request to the RNC.
Step 9 The RNC accepts or rejects the RAB assignment request based on the resource usage of RAN.
See block point #7.
Step 10 If the RNC accepts the RAB assignment request, it initiates an RB setup process. During the
process, the RNC sets up radio links (RLs) to the NodeB over the Iub interface and sends an
RB setup message to the UE over the Uu interface. The RL or RB setup process may incur
failures. See failure points #8 and #9.
----End
3.2 Counters Related to Call Congestion
As shown in Figure 3-1, call congestion may occur during paging, RRC connection setup, or
RAB setup. This section describes counters related to call congestion. For details about these
counters, see Chapter 4 "Metrics Definitions."
3.2.1 Paging Loss
The counters measuring RNC- and cell-level paging loss are as follows:
RNC-level paging loss
The counters measuring paging loss caused by Iu-interface flow control, CPU overload,
or RNC-level PCH congestion are as follows:
− VS.RANAP.CsPaging.Loss: number of failed responses after the RNC receives CS
paging messages from the CN
− VS.RANAP.PsPaging.Loss: number of failed responses after the RNC receives PS
paging messages from the CN
− VS.RANAP.CsPaging.Att: number of CS paging messages received by the RNC from
the CN
− VS.RANAP.PsPaging.Att: number of PS paging messages received by the RNC from
the CN
Calculation formula:
IU Paging Congestion Ratio (RNC) = [(VS.RANAP.CsPaging.Loss +
VS.RANAP.PsPaging.Loss)/(VS.RANAP.CsPaging.Att + VS.RANAP.PsPaging.Att)] x
100%
Cell-level paging loss
The counters measuring paging loss caused by cell-level PCH congestion are as follows:

RAN16.0 Capacity Monitoring Guide (BSC6910-based) 3 Network Resource Troubleshooting
Issue 01 (2014-04-29) Huawei Proprietary and Confidential
Copyright © Huawei Technologies Co., Ltd.
39
− VS.RRC.Paging1.Loss.PCHCong.Cell: number of discarded paging messages due to
PCH congestion in a cell
− VS.UTRAN.AttPaging1: number of paging messages of paging type 1 sent by the
RNC in a cell
Calculation formula:
Iu-interface paging loss ratio (cell) =
(VS.RRC.Paging1.Loss.PCHCong.Cell/VS.UTRAN.AttPaging1) x 100%
3.2.2 RRC Congestion
The following table describes the mapping between reasons of RRC connection setup
rejections and corresponding counters.
Rejection Reason Counter
Uplink power
congestion
VS.RRC.Rej.ULPower.Cong: Number of RRC Connection
Rejects for Cell (UL Power Congestion)
Downlink power
congestion
VS.RRC.Rej.DLPower.Cong: Number of RRC Connection
Rejects for Cell (DL Power Congestion)
Uplink CE resource
congestion
VS.RRC.Rej.ULCE.Cong: Number of RRC Connection Rejects
for Cell (UL CE Resource Congestion)
Downlink CE resource
congestion
VS.RRC.Rej.DLCE.Cong: Number of RRC Connection Rejects
for Cell (DL CE Resource Congestion)
Uplink Iub bandwidth
resource congestion
VS.RRC.Rej.ULIUBBand.Cong: Number of RRC Connection
Rejects for Cell (UL Iub Bandwidth Congestion)
Downlink Iub
bandwidth resource
congestion
VS.RRC.Rej.DLIUBBand.Cong: Number of RRC Connection
Rejects for Cell (DL Iub Bandwidth Congestion)
Downlink code
resource congestion
VS.RRC.Rej.Code.Cong: Number of RRC Connection Rejects
for Cell (Code Resource Congestion)
The RRC block rate is calculated using the following formula:
Vs.RRC.Block.Rate =Total RRC Rej/ VS.RRC.AttConnEstab.Sum x 100%
where
Total RRC Rej = < VS.RRC.Rej.ULPower.Cong > + < VS.RRC.Rej.DLPower.Cong > +
< VS.RRC.Rej.ULCE.Cong > + < VS.RRC.Rej.DLCE.Cong > + <
VS.RRC.Rej.ULIUBBand.Cong > + < VS.RRC.Rej.DLIUBBand.Cong > + <
VS.RRC.Rej.Code.Cong >
VS.RRC.AttConnEstab.Sum: Number of Processed RRC Connection Requests for Cell
3.2.3 RAB Congestion
The following table describes the mapping between reasons of RAB setup rejections and
corresponding counters.
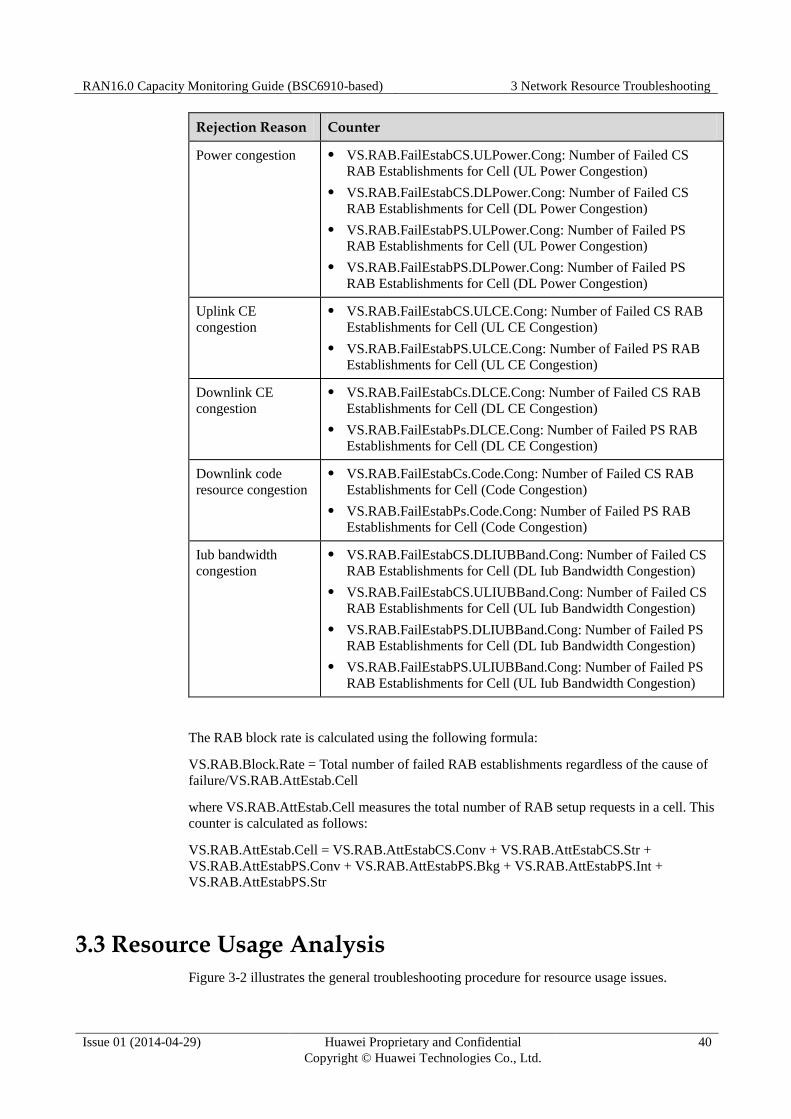
RAN16.0 Capacity Monitoring Guide (BSC6910-based) 3 Network Resource Troubleshooting
Issue 01 (2014-04-29) Huawei Proprietary and Confidential
Copyright © Huawei Technologies Co., Ltd.
40
Rejection Reason Counter
Power congestion VS.RAB.FailEstabCS.ULPower.Cong: Number of Failed CS
RAB Establishments for Cell (UL Power Congestion)
VS.RAB.FailEstabCS.DLPower.Cong: Number of Failed CS
RAB Establishments for Cell (DL Power Congestion)
VS.RAB.FailEstabPS.ULPower.Cong: Number of Failed PS
RAB Establishments for Cell (UL Power Congestion)
VS.RAB.FailEstabPS.DLPower.Cong: Number of Failed PS
RAB Establishments for Cell (DL Power Congestion)
Uplink CE
congestion
VS.RAB.FailEstabCS.ULCE.Cong: Number of Failed CS RAB
Establishments for Cell (UL CE Congestion)
VS.RAB.FailEstabPS.ULCE.Cong: Number of Failed PS RAB
Establishments for Cell (UL CE Congestion)
Downlink CE
congestion
VS.RAB.FailEstabCs.DLCE.Cong: Number of Failed CS RAB
Establishments for Cell (DL CE Congestion)
VS.RAB.FailEstabPs.DLCE.Cong: Number of Failed PS RAB
Establishments for Cell (DL CE Congestion)
Downlink code
resource congestion
VS.RAB.FailEstabCs.Code.Cong: Number of Failed CS RAB
Establishments for Cell (Code Congestion)
VS.RAB.FailEstabPs.Code.Cong: Number of Failed PS RAB
Establishments for Cell (Code Congestion)
Iub bandwidth
congestion
VS.RAB.FailEstabCS.DLIUBBand.Cong: Number of Failed CS
RAB Establishments for Cell (DL Iub Bandwidth Congestion)
VS.RAB.FailEstabCS.ULIUBBand.Cong: Number of Failed CS
RAB Establishments for Cell (UL Iub Bandwidth Congestion)
VS.RAB.FailEstabPS.DLIUBBand.Cong: Number of Failed PS
RAB Establishments for Cell (DL Iub Bandwidth Congestion)
VS.RAB.FailEstabPS.ULIUBBand.Cong: Number of Failed PS
RAB Establishments for Cell (UL Iub Bandwidth Congestion)
The RAB block rate is calculated using the following formula:
VS.RAB.Block.Rate = Total number of failed RAB establishments regardless of the cause of
failure/VS.RAB.AttEstab.Cell
where VS.RAB.AttEstab.Cell measures the total number of RAB setup requests in a cell. This
counter is calculated as follows:
VS.RAB.AttEstab.Cell = VS.RAB.AttEstabCS.Conv + VS.RAB.AttEstabCS.Str +
VS.RAB.AttEstabPS.Conv + VS.RAB.AttEstabPS.Bkg + VS.RAB.AttEstabPS.Int +
VS.RAB.AttEstabPS.Str
3.3 Resource Usage Analysis
Figure 3-2 illustrates the general troubleshooting procedure for resource usage issues.
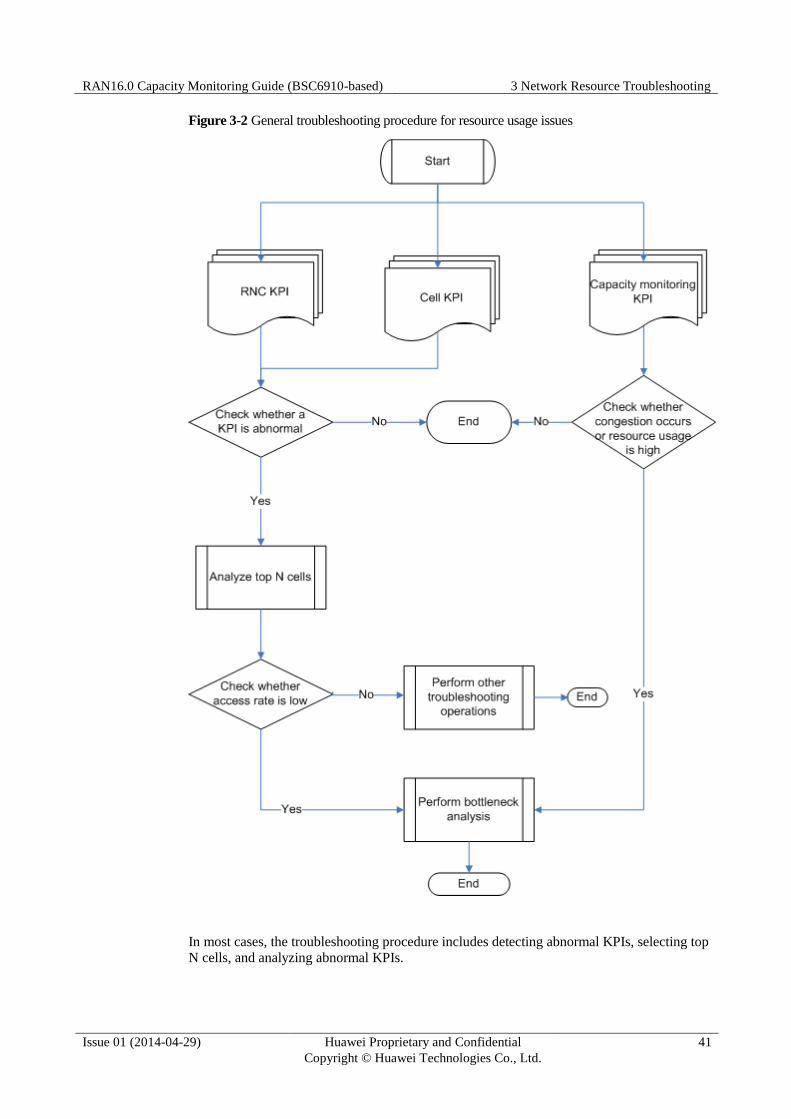
RAN16.0 Capacity Monitoring Guide (BSC6910-based) 3 Network Resource Troubleshooting
Issue 01 (2014-04-29) Huawei Proprietary and Confidential
Copyright © Huawei Technologies Co., Ltd.
41
Figure 3-2 General troubleshooting procedure for resource usage issues
In most cases, the troubleshooting procedure includes detecting abnormal KPIs, selecting top
N cells, and analyzing abnormal KPIs.
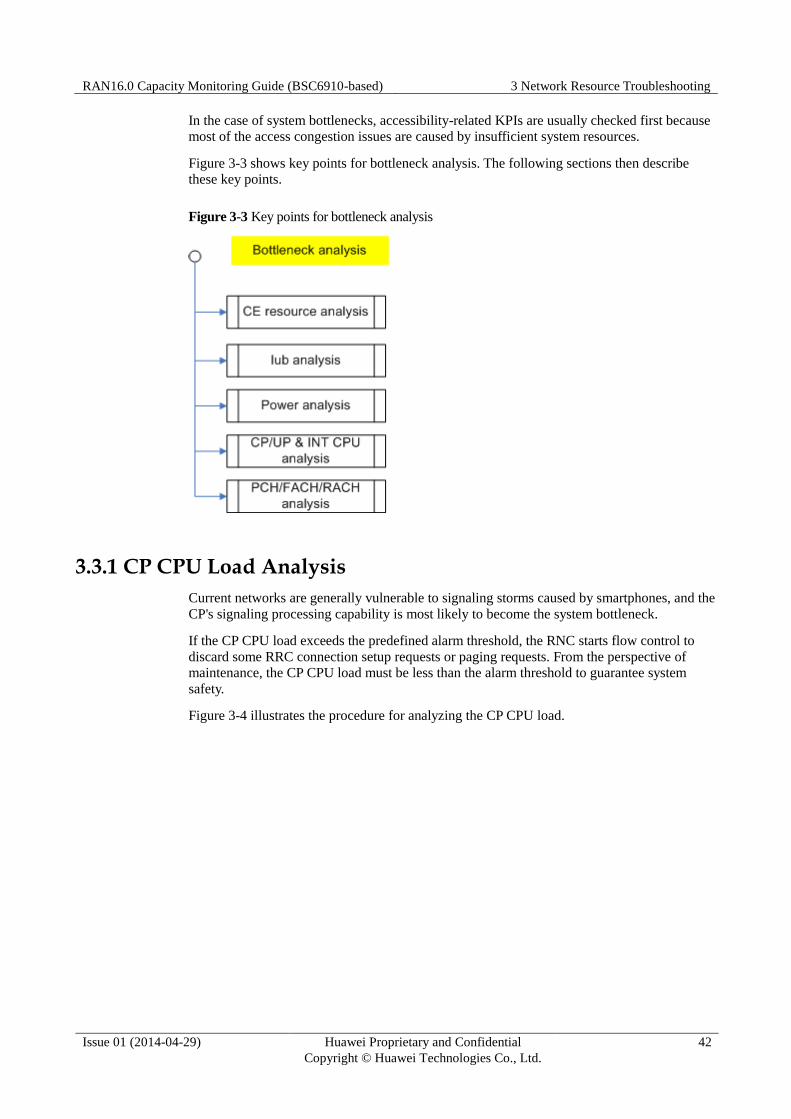
RAN16.0 Capacity Monitoring Guide (BSC6910-based) 3 Network Resource Troubleshooting
Issue 01 (2014-04-29) Huawei Proprietary and Confidential
Copyright © Huawei Technologies Co., Ltd.
42
In the case of system bottlenecks, accessibility-related KPIs are usually checked first because
most of the access congestion issues are caused by insufficient system resources.
Figure 3-3 shows key points for bottleneck analysis. The following sections then describe
these key points.
Figure 3-3 Key points for bottleneck analysis
3.3.1 CP CPU Load Analysis
Current networks are generally vulnerable to signaling storms caused by smartphones, and the
CP's signaling processing capability is most likely to become the system bottleneck.
If the CP CPU load exceeds the predefined alarm threshold, the RNC starts flow control to
discard some RRC connection setup requests or paging requests. From the perspective of
maintenance, the CP CPU load must be less than the alarm threshold to guarantee system
safety.
Figure 3-4 illustrates the procedure for analyzing the CP CPU load.
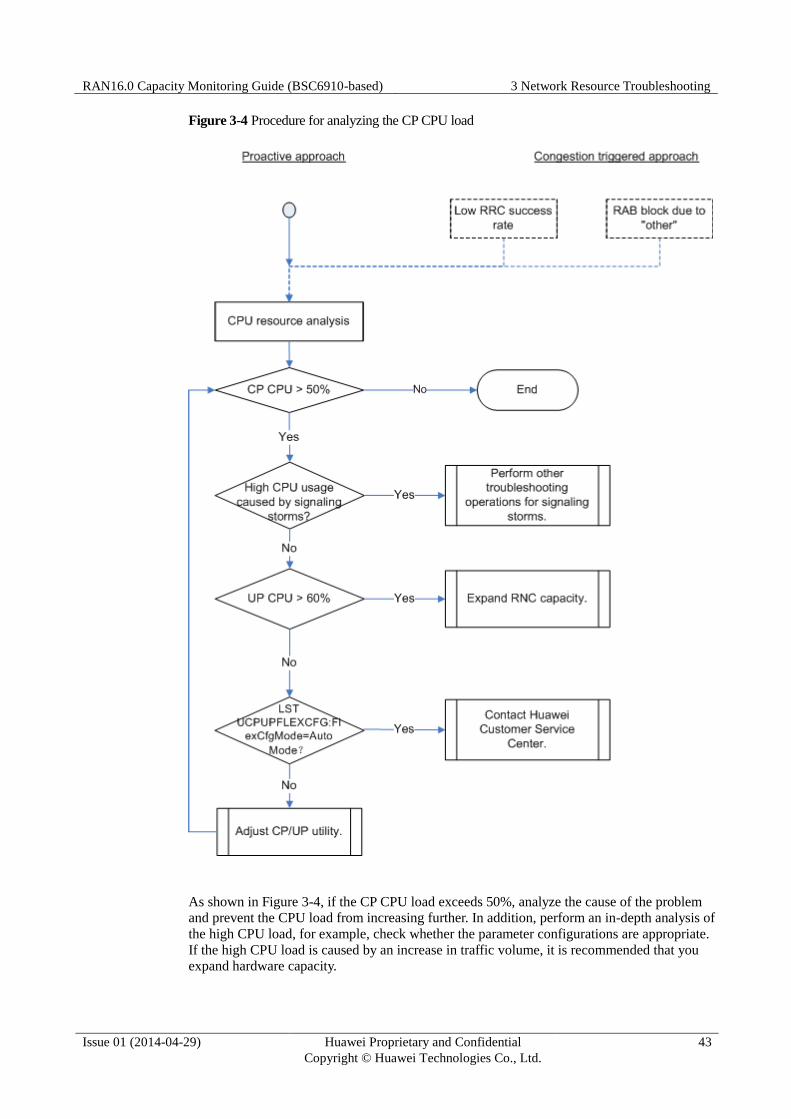
RAN16.0 Capacity Monitoring Guide (BSC6910-based) 3 Network Resource Troubleshooting
Issue 01 (2014-04-29) Huawei Proprietary and Confidential
Copyright © Huawei Technologies Co., Ltd.
43
Figure 3-4 Procedure for analyzing the CP CPU load
As shown in Figure 3-4, if the CP CPU load exceeds 50%, analyze the cause of the problem
and prevent the CPU load from increasing further. In addition, perform an in-depth analysis of
the high CPU load, for example, check whether the parameter configurations are appropriate.
If the high CPU load is caused by an increase in traffic volume, it is recommended that you
expand hardware capacity.
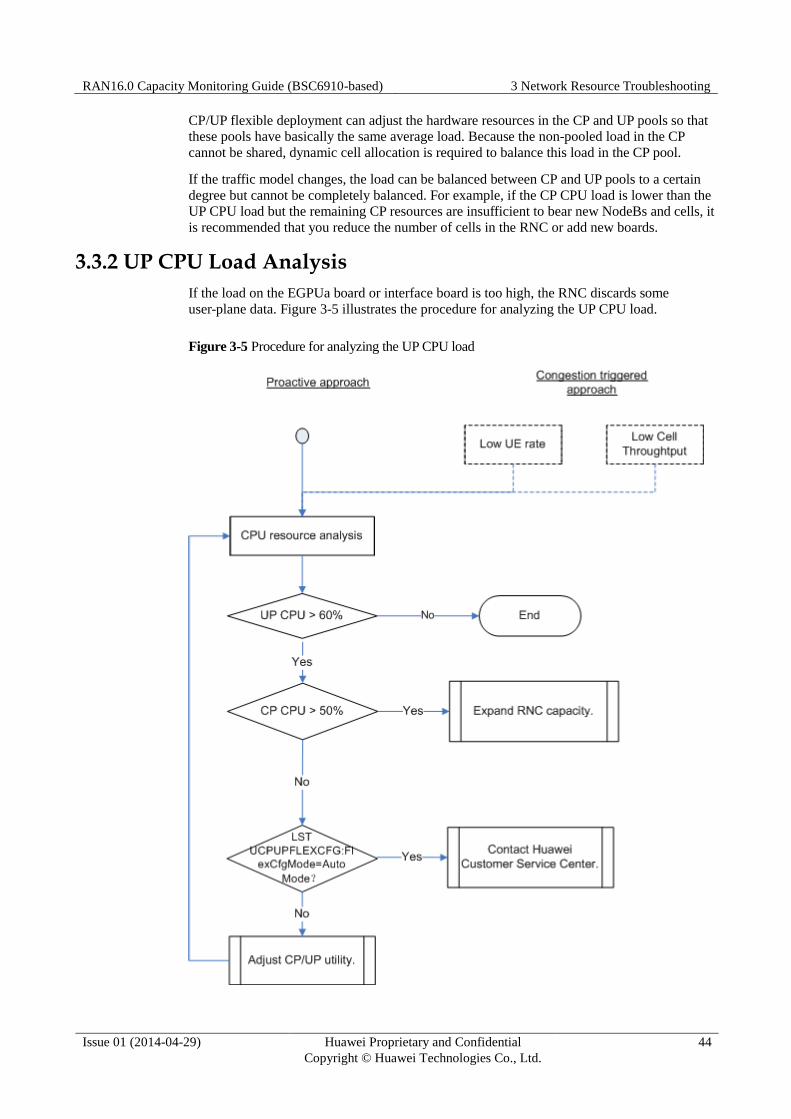
RAN16.0 Capacity Monitoring Guide (BSC6910-based) 3 Network Resource Troubleshooting
Issue 01 (2014-04-29) Huawei Proprietary and Confidential
Copyright © Huawei Technologies Co., Ltd.
44
CP/UP flexible deployment can adjust the hardware resources in the CP and UP pools so that
these pools have basically the same average load. Because the non-pooled load in the CP
cannot be shared, dynamic cell allocation is required to balance this load in the CP pool.
If the traffic model changes, the load can be balanced between CP and UP pools to a certain
degree but cannot be completely balanced. For example, if the CP CPU load is lower than the
UP CPU load but the remaining CP resources are insufficient to bear new NodeBs and cells, it
is recommended that you reduce the number of cells in the RNC or add new boards.
3.3.2 UP CPU Load Analysis
If the load on the EGPUa board or interface board is too high, the RNC discards some
user-plane data. Figure 3-5 illustrates the procedure for analyzing the UP CPU load.
Figure 3-5 Procedure for analyzing the UP CPU load
RAN16.0 Capacity Monitoring Guide (BSC6910-based) 3 Network Resource Troubleshooting
Issue 01 (2014-04-29) Huawei Proprietary and Confidential
Copyright © Huawei Technologies Co., Ltd.
45
If the UP CPU load exceeds 60%, analyze the cause of the problem and prevent the CPU load
from increasing further. If the high CPU load is caused by an increase in traffic volume, it is
recommended that you expand hardware capacity.
3.3.3 CE Resource Analysis
Both CE congestion and CE resource monitoring require CE resource analysis. If CE usage
remains greater than the preset overload threshold or if CE congestion occurs, CE resources
are insufficient and must be increased to ensure system stability.
Figure 3-6 illustrates the procedure for analyzing CE congestion.
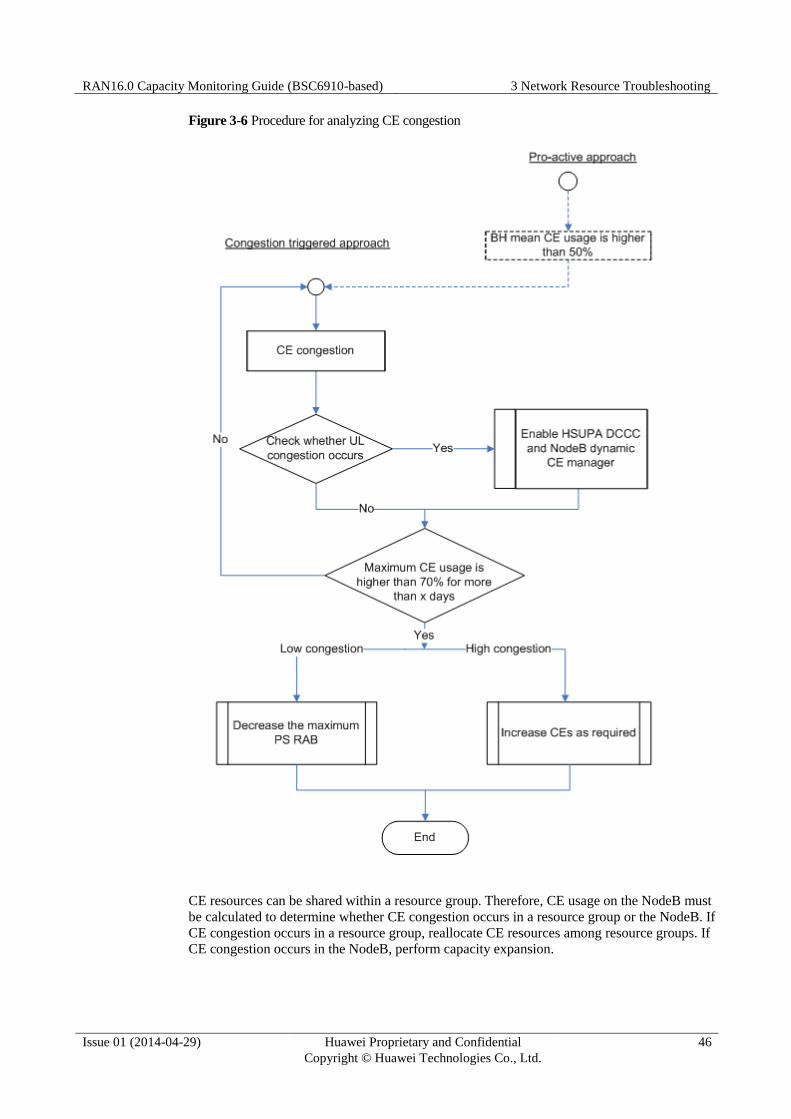
RAN16.0 Capacity Monitoring Guide (BSC6910-based) 3 Network Resource Troubleshooting
Issue 01 (2014-04-29) Huawei Proprietary and Confidential
Copyright © Huawei Technologies Co., Ltd.
46
Figure 3-6 Procedure for analyzing CE congestion
CE resources can be shared within a resource group. Therefore, CE usage on the NodeB must
be calculated to determine whether CE congestion occurs in a resource group or the NodeB. If
CE congestion occurs in a resource group, reallocate CE resources among resource groups. If
CE congestion occurs in the NodeB, perform capacity expansion.
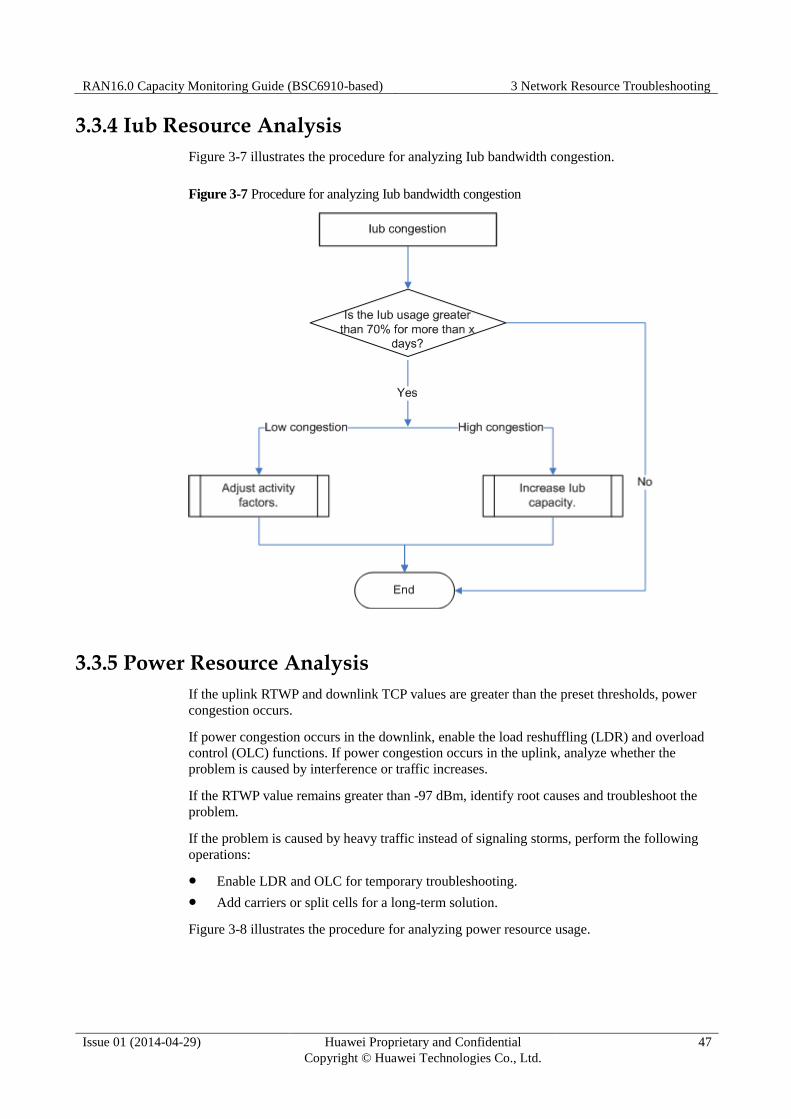
RAN16.0 Capacity Monitoring Guide (BSC6910-based) 3 Network Resource Troubleshooting
Issue 01 (2014-04-29) Huawei Proprietary and Confidential
Copyright © Huawei Technologies Co., Ltd.
47
3.3.4 Iub Resource Analysis
Figure 3-7 illustrates the procedure for analyzing Iub bandwidth congestion.
Figure 3-7 Procedure for analyzing Iub bandwidth congestion
3.3.5 Power Resource Analysis
If the uplink RTWP and downlink TCP values are greater than the preset thresholds, power
congestion occurs.
If power congestion occurs in the downlink, enable the load reshuffling (LDR) and overload
control (OLC) functions. If power congestion occurs in the uplink, analyze whether the
problem is caused by interference or traffic increases.
If the RTWP value remains greater than -97 dBm, identify root causes and troubleshoot the
problem.
If the problem is caused by heavy traffic instead of signaling storms, perform the following
operations:
Enable LDR and OLC for temporary troubleshooting.
Add carriers or split cells for a long-term solution.
Figure 3-8 illustrates the procedure for analyzing power resource usage.
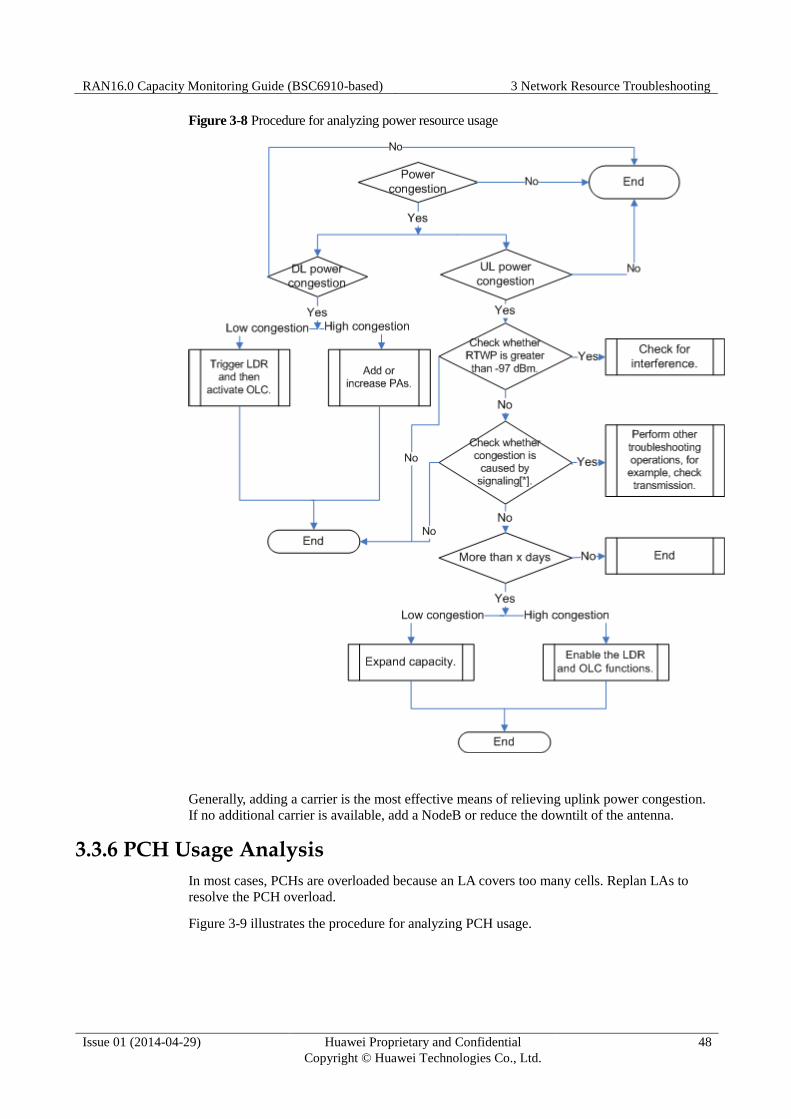
RAN16.0 Capacity Monitoring Guide (BSC6910-based) 3 Network Resource Troubleshooting
Issue 01 (2014-04-29) Huawei Proprietary and Confidential
Copyright © Huawei Technologies Co., Ltd.
48
Figure 3-8 Procedure for analyzing power resource usage
Generally, adding a carrier is the most effective means of relieving uplink power congestion.
If no additional carrier is available, add a NodeB or reduce the downtilt of the antenna.
3.3.6 PCH Usage Analysis
In most cases, PCHs are overloaded because an LA covers too many cells. Replan LAs to
resolve the PCH overload.
Figure 3-9 illustrates the procedure for analyzing PCH usage.
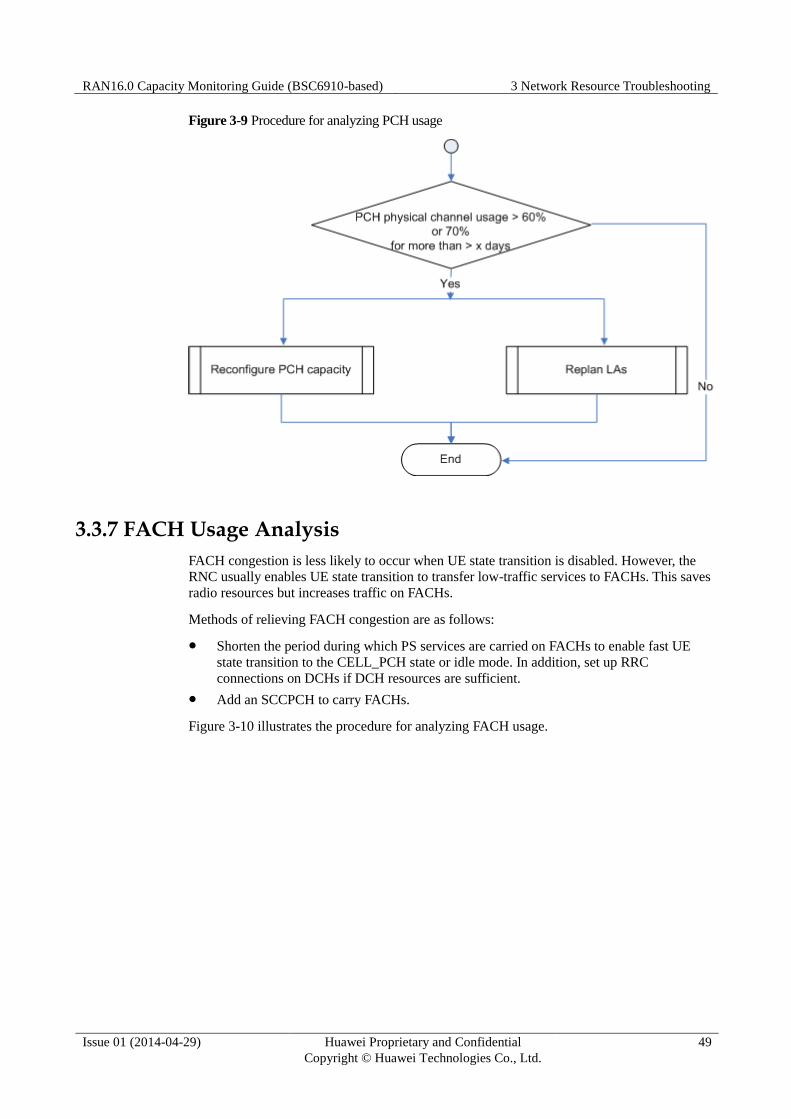
RAN16.0 Capacity Monitoring Guide (BSC6910-based) 3 Network Resource Troubleshooting
Issue 01 (2014-04-29) Huawei Proprietary and Confidential
Copyright © Huawei Technologies Co., Ltd.
49
Figure 3-9 Procedure for analyzing PCH usage
3.3.7 FACH Usage Analysis
FACH congestion is less likely to occur when UE state transition is disabled. However, the
RNC usually enables UE state transition to transfer low-traffic services to FACHs. This saves
radio resources but increases traffic on FACHs.
Methods of relieving FACH congestion are as follows:
Shorten the period during which PS services are carried on FACHs to enable fast UE
state transition to the CELL_PCH state or idle mode. In addition, set up RRC
connections on DCHs if DCH resources are sufficient.
Add an SCCPCH to carry FACHs.
Figure 3-10 illustrates the procedure for analyzing FACH usage.
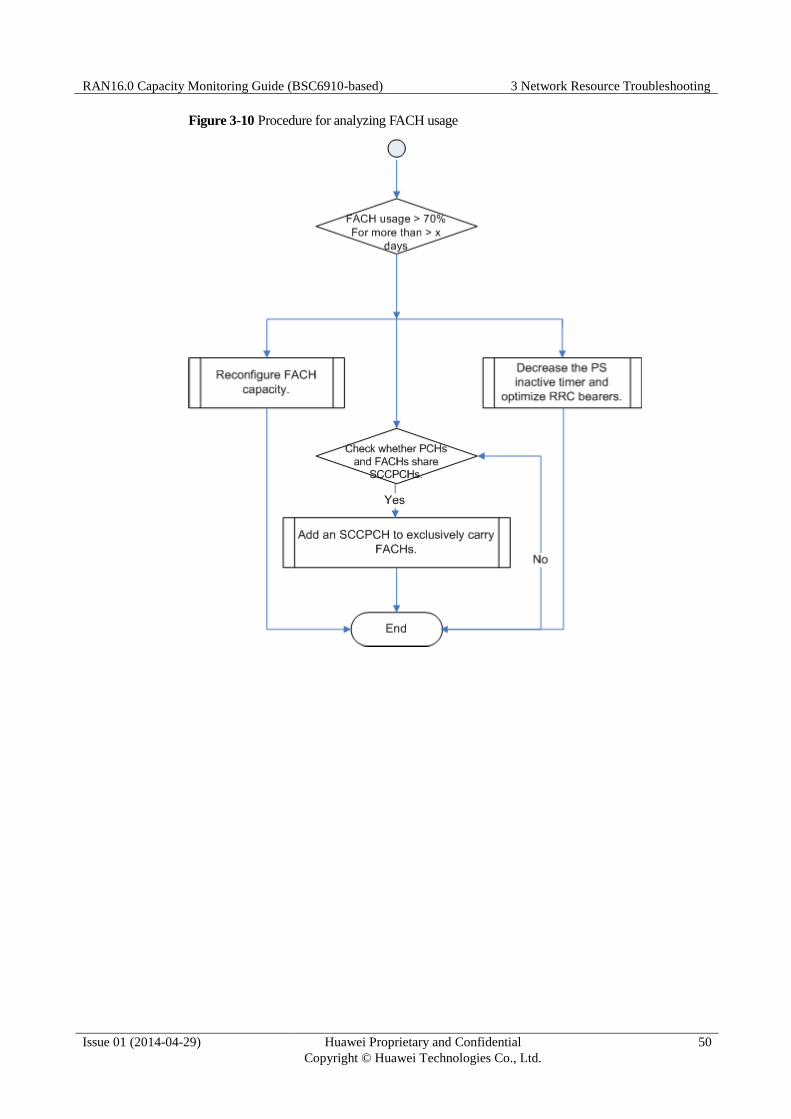
RAN16.0 Capacity Monitoring Guide (BSC6910-based) 3 Network Resource Troubleshooting
Issue 01 (2014-04-29) Huawei Proprietary and Confidential
Copyright © Huawei Technologies Co., Ltd.
50
Figure 3-10 Procedure for analyzing FACH usage
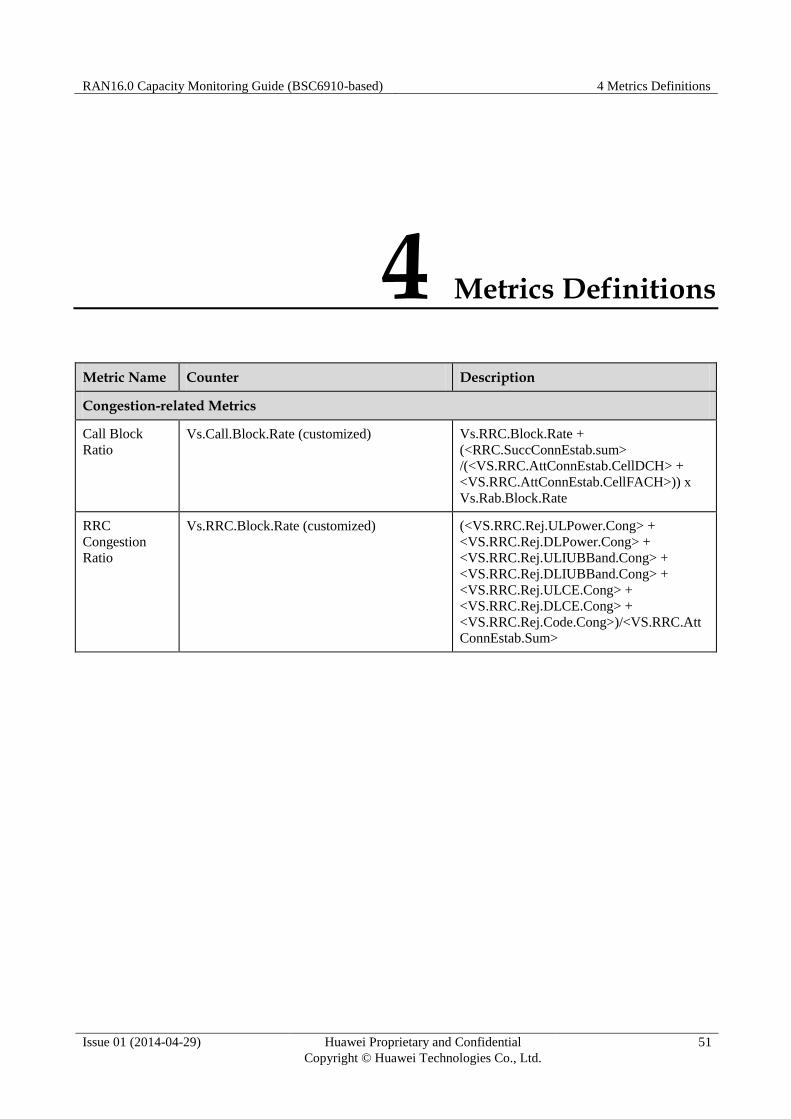
RAN16.0 Capacity Monitoring Guide (BSC6910-based) 4 Metrics Definitions
Issue 01 (2014-04-29) Huawei Proprietary and Confidential
Copyright © Huawei Technologies Co., Ltd.
51
4 Metrics Definitions
Metric Name Counter Description
Congestion-related Metrics
Call Block
Ratio
Vs.Call.Block.Rate (customized) Vs.RRC.Block.Rate +
(<RRC.SuccConnEstab.sum>
/(<VS.RRC.AttConnEstab.CellDCH> +
<VS.RRC.AttConnEstab.CellFACH>)) x
Vs.Rab.Block.Rate
RRC
Congestion
Ratio
Vs.RRC.Block.Rate (customized) (<VS.RRC.Rej.ULPower.Cong> +
<VS.RRC.Rej.DLPower.Cong> +
<VS.RRC.Rej.ULIUBBand.Cong> +
<VS.RRC.Rej.DLIUBBand.Cong> +
<VS.RRC.Rej.ULCE.Cong> +
<VS.RRC.Rej.DLCE.Cong> +
<VS.RRC.Rej.Code.Cong>)/<VS.RRC.Att
ConnEstab.Sum>
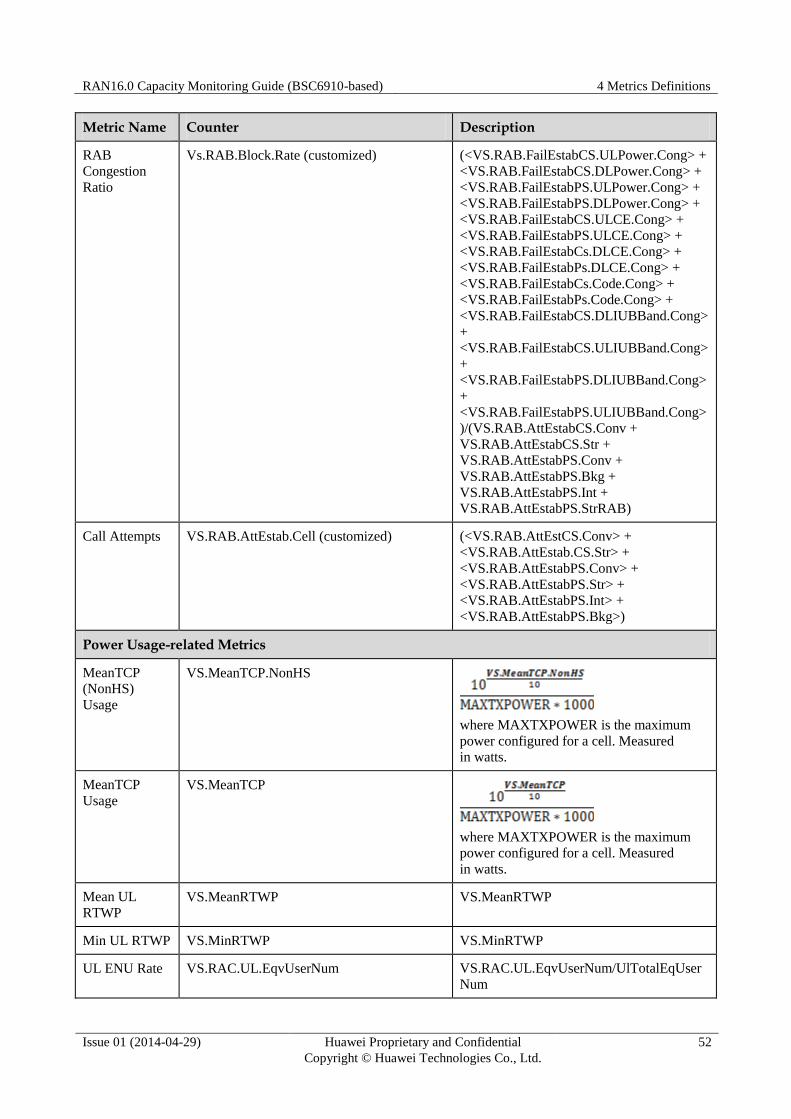
RAN16.0 Capacity Monitoring Guide (BSC6910-based) 4 Metrics Definitions
Issue 01 (2014-04-29) Huawei Proprietary and Confidential
Copyright © Huawei Technologies Co., Ltd.
52
Metric Name Counter Description
RAB
Congestion
Ratio
Vs.RAB.Block.Rate (customized) (<VS.RAB.FailEstabCS.ULPower.Cong> +
<VS.RAB.FailEstabCS.DLPower.Cong> +
<VS.RAB.FailEstabPS.ULPower.Cong> +
<VS.RAB.FailEstabPS.DLPower.Cong> +
<VS.RAB.FailEstabCS.ULCE.Cong> +
<VS.RAB.FailEstabPS.ULCE.Cong> +
<VS.RAB.FailEstabCs.DLCE.Cong> +
<VS.RAB.FailEstabPs.DLCE.Cong> +
<VS.RAB.FailEstabCs.Code.Cong> +
<VS.RAB.FailEstabPs.Code.Cong> +
<VS.RAB.FailEstabCS.DLIUBBand.Cong>
+
<VS.RAB.FailEstabCS.ULIUBBand.Cong>
+
<VS.RAB.FailEstabPS.DLIUBBand.Cong>
+
<VS.RAB.FailEstabPS.ULIUBBand.Cong>
)/(VS.RAB.AttEstabCS.Conv +
VS.RAB.AttEstabCS.Str +
VS.RAB.AttEstabPS.Conv +
VS.RAB.AttEstabPS.Bkg +
VS.RAB.AttEstabPS.Int +
VS.RAB.AttEstabPS.StrRAB)
Call Attempts VS.RAB.AttEstab.Cell (customized) (<VS.RAB.AttEstCS.Conv> +
<VS.RAB.AttEstab.CS.Str> +
<VS.RAB.AttEstabPS.Conv> +
<VS.RAB.AttEstabPS.Str> +
<VS.RAB.AttEstabPS.Int> +
<VS.RAB.AttEstabPS.Bkg>)
Power Usage-related Metrics
MeanTCP
(NonHS)
Usage
VS.MeanTCP.NonHS
where MAXTXPOWER is the maximum
power configured for a cell. Measured
in watts.
MeanTCP
Usage
VS.MeanTCP
where MAXTXPOWER is the maximum
power configured for a cell. Measured
in watts.
Mean UL
RTWP
VS.MeanRTWP VS.MeanRTWP
Min UL RTWP VS.MinRTWP VS.MinRTWP
UL ENU Rate VS.RAC.UL.EqvUserNum VS.RAC.UL.EqvUserNum/UlTotalEqUser
Num
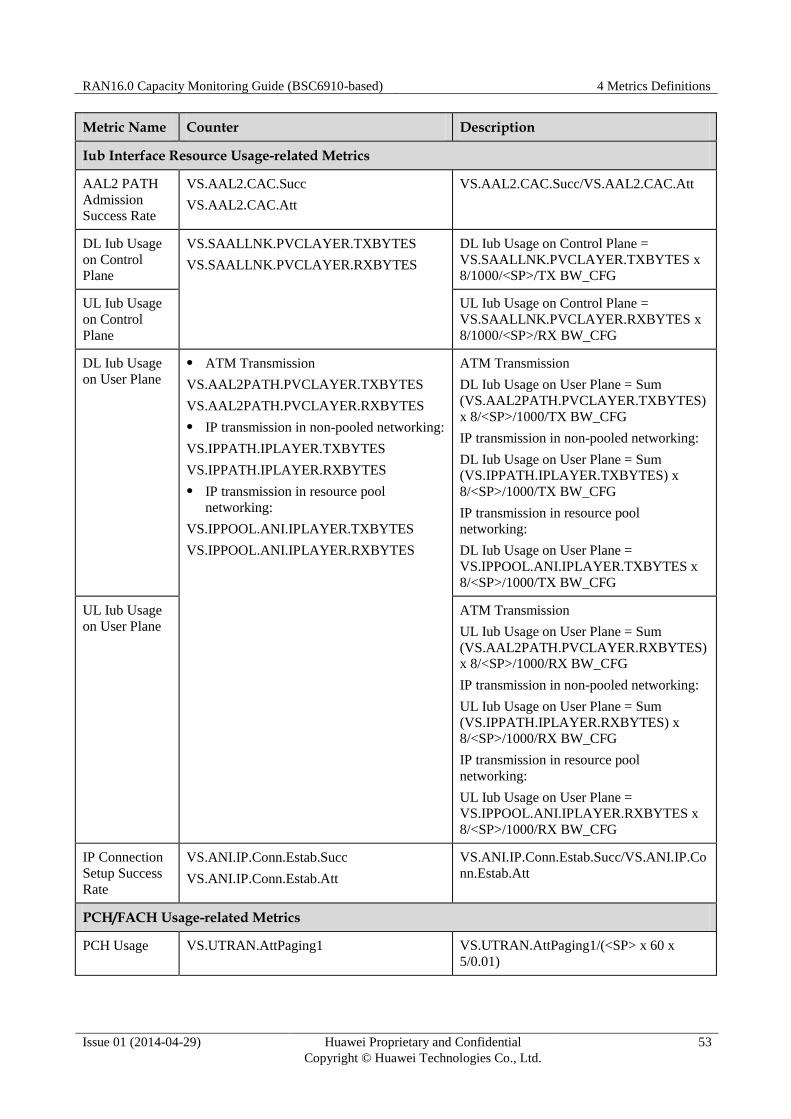
RAN16.0 Capacity Monitoring Guide (BSC6910-based) 4 Metrics Definitions
Issue 01 (2014-04-29) Huawei Proprietary and Confidential
Copyright © Huawei Technologies Co., Ltd.
53
Metric Name Counter Description
Iub Interface Resource Usage-related Metrics
AAL2 PATH
Admission
Success Rate
VS.AAL2.CAC.Succ
VS.AAL2.CAC.Att
VS.AAL2.CAC.Succ/VS.AAL2.CAC.Att
DL Iub Usage
on Control
Plane
VS.SAALLNK.PVCLAYER.TXBYTES
VS.SAALLNK.PVCLAYER.RXBYTES
DL Iub Usage on Control Plane =
VS.SAALLNK.PVCLAYER.TXBYTES x
8/1000/<SP>/TX BW_CFG
UL Iub Usage
on Control
Plane
UL Iub Usage on Control Plane =
VS.SAALLNK.PVCLAYER.RXBYTES x
8/1000/<SP>/RX BW_CFG
DL Iub Usage
on User Plane
ATM Transmission
VS.AAL2PATH.PVCLAYER.TXBYTES
VS.AAL2PATH.PVCLAYER.RXBYTES
IP transmission in non-pooled networking:
VS.IPPATH.IPLAYER.TXBYTES
VS.IPPATH.IPLAYER.RXBYTES
IP transmission in resource pool
networking:
VS.IPPOOL.ANI.IPLAYER.TXBYTES
VS.IPPOOL.ANI.IPLAYER.RXBYTES
ATM Transmission
DL Iub Usage on User Plane = Sum
(VS.AAL2PATH.PVCLAYER.TXBYTES)
x 8/<SP>/1000/TX BW_CFG
IP transmission in non-pooled networking:
DL Iub Usage on User Plane = Sum
(VS.IPPATH.IPLAYER.TXBYTES) x
8/<SP>/1000/TX BW_CFG
IP transmission in resource pool
networking:
DL Iub Usage on User Plane =
VS.IPPOOL.ANI.IPLAYER.TXBYTES x
8/<SP>/1000/TX BW_CFG
UL Iub Usage
on User Plane
ATM Transmission
UL Iub Usage on User Plane = Sum
(VS.AAL2PATH.PVCLAYER.RXBYTES)
x 8/<SP>/1000/RX BW_CFG
IP transmission in non-pooled networking:
UL Iub Usage on User Plane = Sum
(VS.IPPATH.IPLAYER.RXBYTES) x
8/<SP>/1000/RX BW_CFG
IP transmission in resource pool
networking:
UL Iub Usage on User Plane =
VS.IPPOOL.ANI.IPLAYER.RXBYTES x
8/<SP>/1000/RX BW_CFG
IP Connection
Setup Success
Rate
VS.ANI.IP.Conn.Estab.Succ
VS.ANI.IP.Conn.Estab.Att
VS.ANI.IP.Conn.Estab.Succ/VS.ANI.IP.Co
nn.Estab.Att
PCH/FACH Usage-related Metrics
PCH Usage VS.UTRAN.AttPaging1 VS.UTRAN.AttPaging1/(<SP> x 60 x
5/0.01)
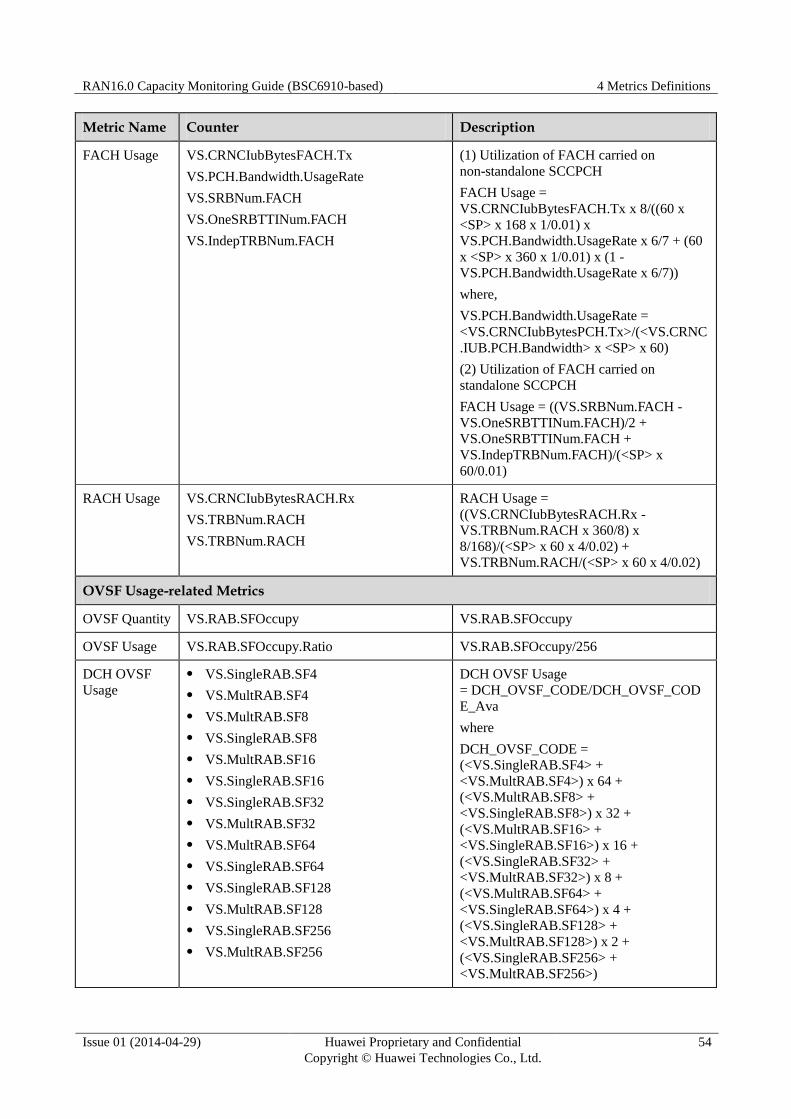
RAN16.0 Capacity Monitoring Guide (BSC6910-based) 4 Metrics Definitions
Issue 01 (2014-04-29) Huawei Proprietary and Confidential
Copyright © Huawei Technologies Co., Ltd.
54
Metric Name Counter Description
FACH Usage VS.CRNCIubBytesFACH.Tx
VS.PCH.Bandwidth.UsageRate
VS.SRBNum.FACH
VS.OneSRBTTINum.FACH
VS.IndepTRBNum.FACH
(1) Utilization of FACH carried on
non-standalone SCCPCH
FACH Usage =
VS.CRNCIubBytesFACH.Tx x 8/((60 x
<SP> x 168 x 1/0.01) x
VS.PCH.Bandwidth.UsageRate x 6/7 + (60
x <SP> x 360 x 1/0.01) x (1 -
VS.PCH.Bandwidth.UsageRate x 6/7))
where,
VS.PCH.Bandwidth.UsageRate =
<VS.CRNCIubBytesPCH.Tx>/(<VS.CRNC
.IUB.PCH.Bandwidth> x <SP> x 60)
(2) Utilization of FACH carried on
standalone SCCPCH
FACH Usage = ((VS.SRBNum.FACH -
VS.OneSRBTTINum.FACH)/2 +
VS.OneSRBTTINum.FACH +
VS.IndepTRBNum.FACH)/(<SP> x
60/0.01)
RACH Usage VS.CRNCIubBytesRACH.Rx
VS.TRBNum.RACH
VS.TRBNum.RACH
RACH Usage =
((VS.CRNCIubBytesRACH.Rx -
VS.TRBNum.RACH x 360/8) x
8/168)/(<SP> x 60 x 4/0.02) +
VS.TRBNum.RACH/(<SP> x 60 x 4/0.02)
OVSF Usage-related Metrics
OVSF Quantity VS.RAB.SFOccupy VS.RAB.SFOccupy
OVSF Usage VS.RAB.SFOccupy.Ratio VS.RAB.SFOccupy/256
DCH OVSF
Usage
VS.SingleRAB.SF4
VS.MultRAB.SF4
VS.MultRAB.SF8
VS.SingleRAB.SF8
VS.MultRAB.SF16
VS.SingleRAB.SF16
VS.SingleRAB.SF32
VS.MultRAB.SF32
VS.MultRAB.SF64
VS.SingleRAB.SF64
VS.SingleRAB.SF128
VS.MultRAB.SF128
VS.SingleRAB.SF256
VS.MultRAB.SF256
DCH OVSF Usage
= DCH_OVSF_CODE/DCH_OVSF_COD
E_Ava
where
DCH_OVSF_CODE =
(<VS.SingleRAB.SF4> +
<VS.MultRAB.SF4>) x 64 +
(<VS.MultRAB.SF8> +
<VS.SingleRAB.SF8>) x 32 +
(<VS.MultRAB.SF16> +
<VS.SingleRAB.SF16>) x 16 +
(<VS.SingleRAB.SF32> +
<VS.MultRAB.SF32>) x 8 +
(<VS.MultRAB.SF64> +
<VS.SingleRAB.SF64>) x 4 +
(<VS.SingleRAB.SF128> +
<VS.MultRAB.SF128>) x 2 +
(<VS.SingleRAB.SF256> +
<VS.MultRAB.SF256>)
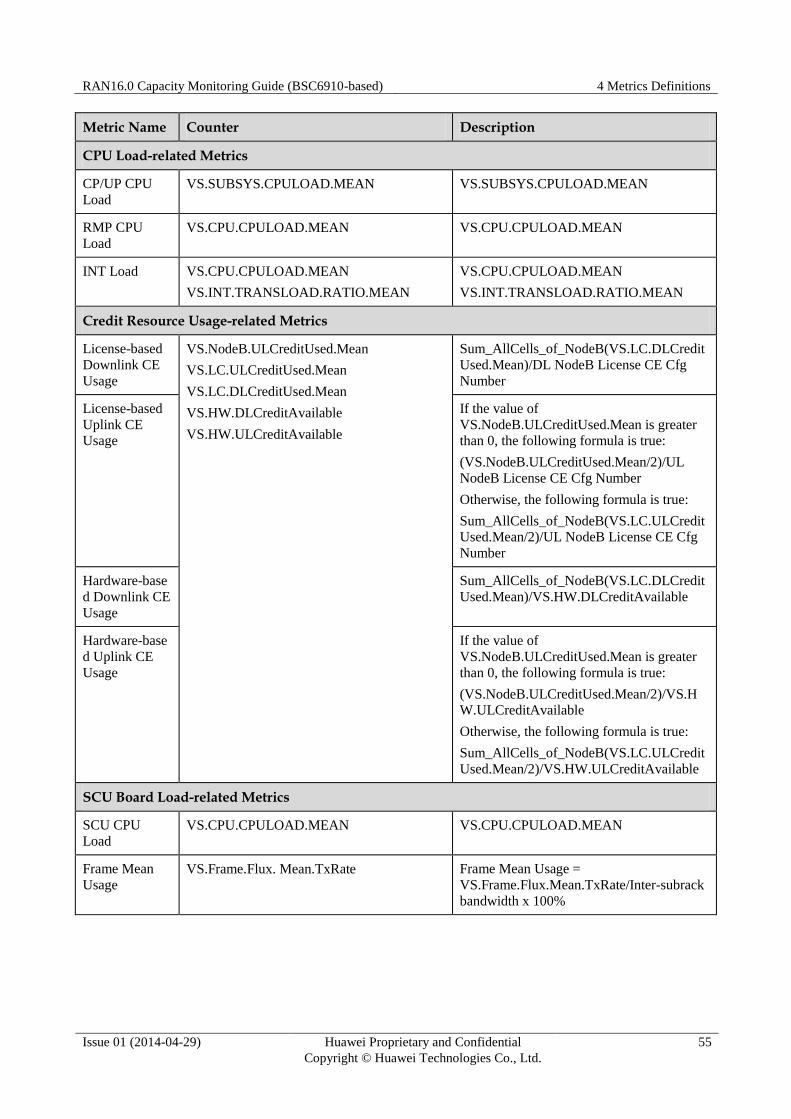
RAN16.0 Capacity Monitoring Guide (BSC6910-based) 4 Metrics Definitions
Issue 01 (2014-04-29) Huawei Proprietary and Confidential
Copyright © Huawei Technologies Co., Ltd.
55
Metric Name Counter Description
CPU Load-related Metrics
CP/UP CPU
Load
VS.SUBSYS.CPULOAD.MEAN VS.SUBSYS.CPULOAD.MEAN
RMP CPU
Load
VS.CPU.CPULOAD.MEAN VS.CPU.CPULOAD.MEAN
INT Load VS.CPU.CPULOAD.MEAN
VS.INT.TRANSLOAD.RATIO.MEAN
VS.CPU.CPULOAD.MEAN
VS.INT.TRANSLOAD.RATIO.MEAN
Credit Resource Usage-related Metrics
License-based
Downlink CE
Usage
VS.NodeB.ULCreditUsed.Mean
VS.LC.ULCreditUsed.Mean
VS.LC.DLCreditUsed.Mean
VS.HW.DLCreditAvailable
VS.HW.ULCreditAvailable
Sum_AllCells_of_NodeB(VS.LC.DLCredit
Used.Mean)/DL NodeB License CE Cfg
Number
License-based
Uplink CE
Usage
If the value of
VS.NodeB.ULCreditUsed.Mean is greater
than 0, the following formula is true:
(VS.NodeB.ULCreditUsed.Mean/2)/UL
NodeB License CE Cfg Number
Otherwise, the following formula is true:
Sum_AllCells_of_NodeB(VS.LC.ULCredit
Used.Mean/2)/UL NodeB License CE Cfg
Number
Hardware-base
d Downlink CE
Usage
Sum_AllCells_of_NodeB(VS.LC.DLCredit
Used.Mean)/VS.HW.DLCreditAvailable
Hardware-base
d Uplink CE
Usage
If the value of
VS.NodeB.ULCreditUsed.Mean is greater
than 0, the following formula is true:
(VS.NodeB.ULCreditUsed.Mean/2)/VS.H
W.ULCreditAvailable
Otherwise, the following formula is true:
Sum_AllCells_of_NodeB(VS.LC.ULCredit
Used.Mean/2)/VS.HW.ULCreditAvailable
SCU Board Load-related Metrics
SCU CPU
Load
VS.CPU.CPULOAD.MEAN VS.CPU.CPULOAD.MEAN
Frame Mean
Usage
VS.Frame.Flux. Mean.TxRate Frame Mean Usage =
VS.Frame.Flux.Mean.TxRate/Inter-subrack
bandwidth x 100%
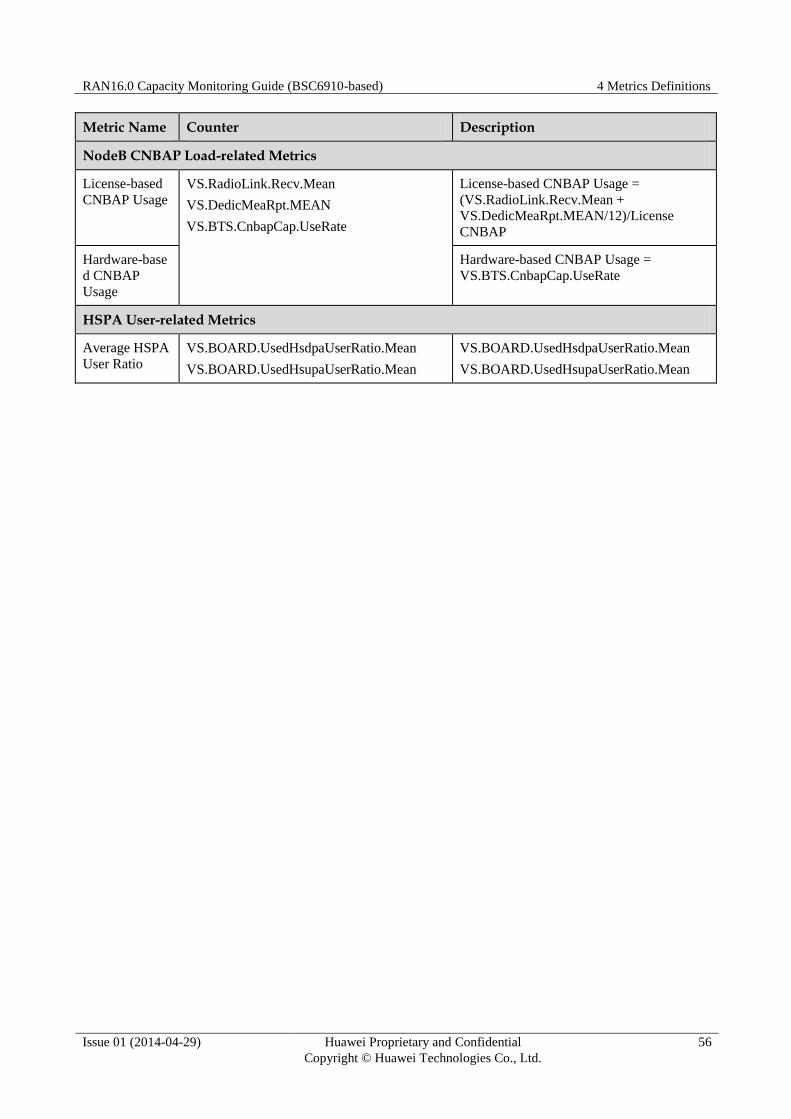
RAN16.0 Capacity Monitoring Guide (BSC6910-based) 4 Metrics Definitions
Issue 01 (2014-04-29) Huawei Proprietary and Confidential
Copyright © Huawei Technologies Co., Ltd.
56
Metric Name Counter Description
NodeB CNBAP Load-related Metrics
License-based
CNBAP Usage
VS.RadioLink.Recv.Mean
VS.DedicMeaRpt.MEAN
VS.BTS.CnbapCap.UseRate
License-based CNBAP Usage =
(VS.RadioLink.Recv.Mean +
VS.DedicMeaRpt.MEAN/12)/License
CNBAP
Hardware-base
d CNBAP
Usage
Hardware-based CNBAP Usage =
VS.BTS.CnbapCap.UseRate
HSPA User-related Metrics
Average HSPA
User Ratio
VS.BOARD.UsedHsdpaUserRatio.Mean
VS.BOARD.UsedHsupaUserRatio.Mean
VS.BOARD.UsedHsdpaUserRatio.Mean
VS.BOARD.UsedHsupaUserRatio.Mean
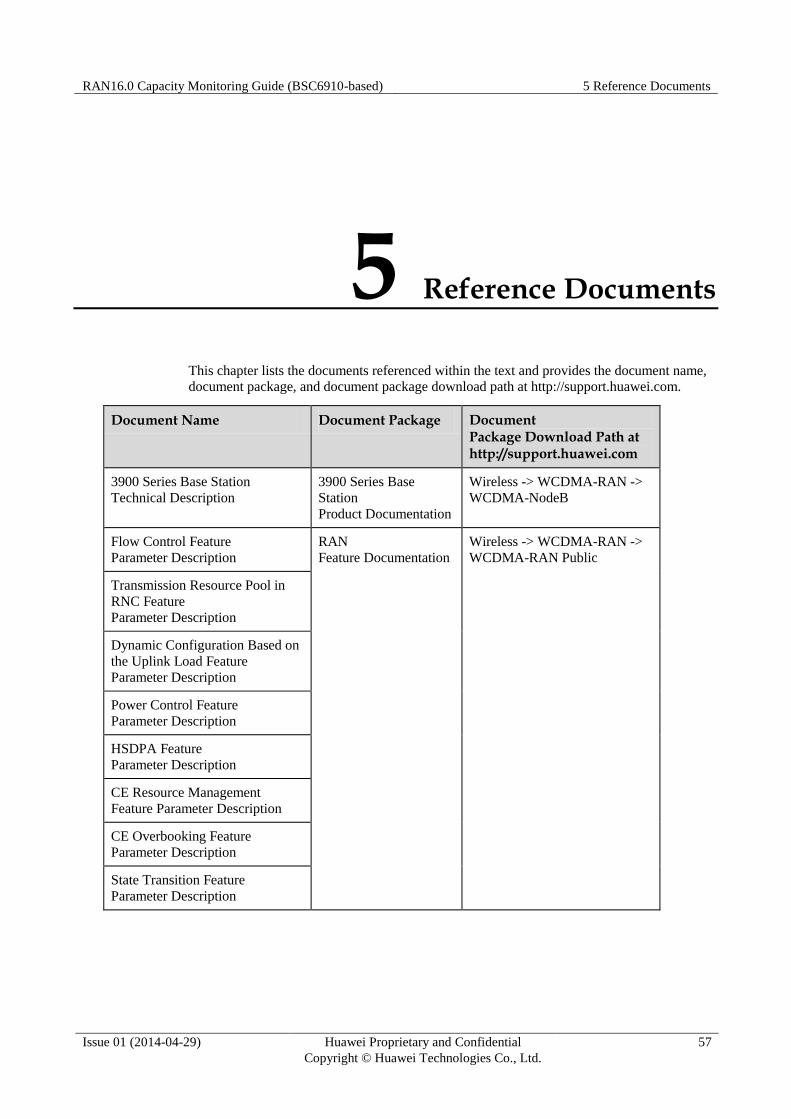
RAN16.0 Capacity Monitoring Guide (BSC6910-based) 5 Reference Documents
Issue 01 (2014-04-29) Huawei Proprietary and Confidential
Copyright © Huawei Technologies Co., Ltd.
57
5 Reference Documents
This chapter lists the documents referenced within the text and provides the document name,
document package, and document package download path at http://support.huawei.com.
Document Name Document Package Document Package Download Path at http://support.huawei.com
3900 Series Base Station
Technical Description
3900 Series Base
Station
Product Documentation
Wireless -> WCDMA-RAN ->
WCDMA-NodeB
Flow Control Feature
Parameter Description
RAN
Feature Documentation
Wireless -> WCDMA-RAN ->
WCDMA-RAN Public
Transmission Resource Pool in
RNC Feature
Parameter Description
Dynamic Configuration Based on
the Uplink Load Feature
Parameter Description
Power Control Feature
Parameter Description
HSDPA Feature
Parameter Description
CE Resource Management
Feature Parameter Description
CE Overbooking Feature
Parameter Description
State Transition Feature
Parameter Description