rapid method to determine intracellular drug...
TRANSCRIPT
1521-009X/44/3/356–364$25.00 http://dx.doi.org/10.1124/dmd.115.066647DRUG METABOLISM AND DISPOSITION Drug Metab Dispos 44:356–364, March 2016Copyright ª 2016 by The American Society for Pharmacology and Experimental Therapeutics
Rapid Method To Determine Intracellular Drug Concentrations inCellular Uptake Assays: Application to Metformin in Organic CationTransporter 1–Transfected Human Embryonic Kidney 293 Cells s
Huan-Chieh Chien, Arik A. Zur, Tristan S. Maurer, Sook Wah Yee, John Tolsma, Paul Jasper,Dennis O. Scott, and Kathleen M. Giacomini
Department of Bioengineering and Therapeutic Sciences, Schools of Pharmacy and Medicine, University of California SanFrancisco, San Francisco, California (H.C.C., A.A.Z., S.W.Y., K.M.G.); Systems Modeling and Simulation (T.S.M.) and
Cardiovascular and Metabolic Disease Research Unit (D.O.S.), Department of Pharmacokinetics, Dynamics and Metabolism, PfizerWorldwide Research and Development, Cambridge, Massachusetts; RES Group, Inc. (J.T., P.J.) Needham, Massachusetts
Received August 11, 2015; accepted December 22, 2015
ABSTRACT
Because of the importance of intracellular unbound drug concen-trations in the prediction of in vivo concentrations that are determi-nants of drug efficacy and toxicity, a number of assays have beendeveloped to assess in vitro unbound concentrations of drugs. Herewe present a rapid method to determine the intracellular unbounddrug concentrations in cultured cells, and we apply the methodalong with a mechanistic model to predict concentrations ofmetformin in subcellular compartments of stably transfected humanembryonic kidney 293 (HEK293) cells. Intracellular space (ICS) wascalculated by subtracting the [3H]-inulin distribution volume (extra-cellular space, ECS) from the [14C]-urea distribution volume (totalwater space, TWS). Values obtained for intracellular space (mean6
S.E.M.; ml/106 cells) of monolayers of HEK cells (HEK-empty vector[EV]) and cells overexpressing human organic cation transporter 1
(HEK-OCT1), 1.216 0.07 and 1.2560.06, respectively, were used todetermine the intracellular metformin concentrations. After incuba-tion of the cells with 5 mMmetformin, the intracellular concentrationswere 26.4 6 7.8 mM and 268 6 11.0 mM, respectively, in HEK-EV andHEK-OCT1. In addition, intracellular metformin concentrations werelower in high K+ buffer (140 mMKCl) compared with normal K+ buffer(5.4 mM KCl) in HEK-OCT1 cells (54.86 3.8 mM and 198.16 11.2 mM,respectively;P < 0.05). Ourmechanisticmodel suggests that, depend-ing on the credible rangeof assumedphysiologic values, the positivelycharged metformin accumulates to particularly high levels in endo-plasmic reticulumand/ormitochondria. Thismethod togetherwith thecomputational model can be used to determine intracellular unboundconcentrations and to predict subcellular accumulation of drugs inother complex systems such as primary cells.
Introduction
Intracellular unbound drug concentrations are critical determinants ofdrug interactions with targets and enzymes because most drug metab-olizing enzymes and drug targets are located inside cells (Overingtonet al., 2006; Dollery, 2013). In general, because intracellular unboundconcentrations of drugs cannot be measured in vivo, extracellular drugconcentrations are used as a proxy and are most often measured inplasma, with or without correction for plasma protein binding. In-creasingly it is being recognized that because of active transport proteinsthat mediate drugs across cellular membranes, intracellular drugconcentrations may be different from their levels in the extracellularenvironment.Because of the difficulty in measuring intracellular concentrations, a
number of methods have been developed to estimate unbound in-tracellular concentrations of drugs (Chu et al., 2013). However, many of
these methods are complicated and costly. Measurement of intracellularconcentrations in vivo is especially difficult. Recently, new technologybased on mass spectrometry imaging techniques (matrix-associatedlaser desorption/ionization, secondary ion mass spectrometry (SIMS)and nanoSIMS has been used to determine intracellular drug levels invivo (Dollery, 2013); however, use of this technology is limited becauseof the need for special equipment and the high costs associated withthese imaging methods. Thus, in silico methods to predict intracellulardrug concentrations in vivo represent a better alternative; however, insilico methods require information from in vitro assays to accuratelyestimate in vivo concentrations.For many drugs to reach their intracellular target, passage through the
lipoprotein bilayer of the cell membrane is facilitated by membranetransporters (Giacomini et al., 2010). For a compound that is a substrateof a particular transporter, the number of transporter proteins on the cellsurface and the Km of the compound for the transporter are majordeterminants of its rate of influx. Once in the cell, some moleculesbecome highly concentrated in organelles, such as lysosomes (Dollery,2013) or mitochondria (Durazo et al., 2011). Thus, knowledge of thedrug concentration within cells is becoming increasingly important indrug development to determine the effect of new compounds at the siteof action, binding to targets, and hence drug activity. For example, the
This work was supported by Pfizer funding A109685, the Pfizer EmergingScience Fund, and the California Institute for Quantitative Biosciences, QB3, forsponsoring the granting program.
dx.doi.org/10.1124/dmd.115.066647.s This article has supplemental material available at dmd.aspetjournals.org.
ABBREVIATIONS: ECS, extracellular space; ER, endoplasmic reticulum; EV, empty vector; HBSS, Hank’s balanced salt solution; HEK, humanembryonic kidney 293 cells; ICS, intracellular space; OCT1, organic cation transporter 1; RED, rapid equilibrium dialysis; TWS, total water space.
356
http://dmd.aspetjournals.org/content/suppl/2015/12/23/dmd.115.066647.DC1Supplemental material to this article can be found at:
at ASPE
T Journals on June 7, 2018
dmd.aspetjournals.org
Dow
nloaded from
IC50 values for cytotoxicity of adefovir and cidofovir, anti-humanimmunodeficiency (HIV) drugs, substrates of organic anion transporters(OATs), is significantly influenced by the intracellular concentrations ofthese drugs (Zhang et al., 2013, 2015).Metformin, one of the world’s most widely prescribed antidiabetic
drugs, requires membrane transporters such as organic cation transporter1 (OCT1) to gain access to intracellular targets (Wang et al., 2002;Tzvetkov et al., 2009; Li et al., 2013; Chen et al., 2014). We developed amethod to measure the intracellular concentrations of metformin in vitroin cells expressing OCT1 to assess whether the drug accumulates insubcellular compartments. We applied this method to measure thebinding and accumulation of metformin, aminoguanidine, and guanidinein cultured human embryonic kidney 293 cells (HEK293). Our simplestep-by-step procedure coupled with the mechanistic model provides anovel method for predicting the subcellular compartment accumulationof drugs. This method can be applied to in vitro/in vivo modeling topredict intracellular drug levels and pharmacologic responses.
Materials and Methods
Cell Culture. The cells were generated and cultured as previously describedelsewhere (Shu et al., 2007). HEK293 Flp-In-293 cells were transfected withpcDNA5/FRT vector (Invitrogen, Invitrogen, Carlsbad, CA) containing theOCT1 cDNA insert (HEK-OCT1) or vector only (HEK-EV [empty vector])using Lipofectamine 2000 (Invitrogen) following the manufacturer’s protocols.The cells were maintained in Dulbecco’s modified Eagle’s medium of highglucose supplemented with 10% FBS, 100 U/ml penicillin and 100 mg/mlstreptomycin, and 75 mg/ml hygromycin B, at 37�C in a humidified 5% CO2
atmosphere.Chemicals and Uptake Buffers. Uptake was performed in Hank’s balanced
salt solution (HBSS), 5.4 mM KCl, and 140 mM KCl buffers. The HBSS bufferwas purchased from Life Technologies (Carlsbad, CA). Potassium buffers weremade as described elsewhere (Klapperstück et al., 2009). Briefly, the buffercomposition was 5.4 mM KCl buffer containing 1 mM CaCl2, 1 mM MgCl2,10 mMHEPES, 140 mMNaCl, 5.4 mMKCl, and 10 mM glucose. The 140 mMKCl buffer was identical to the 5.4 mM KCl buffer with the exception of thesodium and potassium being iso-osmotically adjusted (the sum was 145.4 mM).We purchased 14C-metformin (ARC1738) and 14C-urea (ARC0150A) AmericanRadiolabeled Chemicals (St. Louis, MO). The 14C-aminoguanidine (MC215)and 14C-guanidine (MC145) were purchased from Moravek Biochemicals andRadiochemicals (Brea, CA). 3H-Inulin (NET086L001MC) was purchased fromPerkinElmer Life and Analytical Sciences (Waltham, MA).
Distribution Spaces of Individual Markers in Monolayers. HEK-EV andHEK-OCT1 cells were grown in six-well plates. The monolayers were rinsedwith HBSS and then equilibrated at 37�C for 10 minutes. After removal of thebuffer, 950ml of radioactively labeled total water space (TWS)marker (14C-urea,final concentration 1.0 mCi/ml) was added to the cells at time zero, 50 ml of themarker for extracellular space (ECS) (3H-inulin, final concentration 1.0 mCi/ml)was added after 15 minutes, and the incubations were terminated after 20 minutes(Vasquez et al., 1982).
At the indicated times, the incubation of the cells with the marker wasterminated by placing the plate on ice. Triplicate aliquots (25 ml) of incubatedsolution (IS) were removed to determine total radioactivity (DPM 1); then thecells were rinsed twice rapidly with 1.0 ml of ice-cold HBSS per rinse. Afteraspiration of the final rinse, cells were digested for 2 hours at room temperaturewith 2.0 ml lysis buffer (0.1 N NaOH, 0.1% SDS). A 1.0-ml aliquot of cell digestfrom each well was used to measure radioactivity (DPM 2). The distributionvolume of the radioactive marker (ml/106 cells) was calculated as follows:
Volume
�uL
106 cells
�¼ 2: DPM2
mL cell digest.�DPM1uL IS
:Number of Cells:102 6
well
�ð1Þ
In this equation, Volume represents the marker distribution volume. DPM1 andDPM2 represent radioactivity of incubated solution (IS), and cell digest after
lysis, respectively. The protein concentration from each well was measured bythe BCA Protein Assay Kit (Thermo Fisher Scientific, Waltham, MA) andconverted into cell number using a standard curve as described herein.
Standard Curve of Cell Number. To simplify cell number calculations, weconstructed a standard curve of cell number versus protein amount. Variousnumbers of cells (10,000;200,000) were seeded in a 48-well plate. Cells fromhalf of a plate were lysed and measured for protein concentration with the BCAProtein Assay Kit (Thermo Scientific); the other half plate of cells weretrypsinized and the number of cells were counted by the TC20 cell counter (Bio-Rad Laboratories, Hercules, CA). Three replicates for each condition were usedto plot the standard curve.
Measurement of Drug Binding. Compound binding to HEK cells wasmeasured through equilibrium dialysis as previously described elsewhere(Mateus et al., 2013). The cells were harvested from a six-well plate using0.05% trypsin, then centrifuged at 500g for 5 minutes. Cells were washed oncewith HBSS, counted using a TC20 cell counter (Bio-Rad Laboratories), andcentrifuged again at 500g for 5 minutes. The pellet of HEK293 cells wassuspended in buffer, and the buffer was adjusted to a concentration of10 � 106 cells/ml. We incubated 14C-metformin with the homogenate at aconcentration of 5 mM for 30 minutes at 37�C.
Samples were dialyzed using a rapid equilibrium dialysis (RED) device(Thermo Fisher Scientific) by transferring 200 ml of compound-spiked cellsuspension to one chamber of the dialysis unit (cell chamber) and 350 ml ofHBSS to the other chamber (buffer chamber). The dialysis unit was incubated at37�C and 900 rpm on an orbital shaker for 4 hours. At the end of the incubation,triplicated aliquots (25ml) of each sample from the buffer and cell chambers weretaken to determine radioactivity.
The unbound fraction of metformin in the cells was calculated as Cbuffer/Ccell,where Cbuffer is the metformin concentration in the buffer chamber and Ccell is themetformin concentration in the cell chamber. The unbound fractions of guanidineand aminoguanidine were measured and calculated using same procedure.
Osmolarity Study. To determine whether the uptake of metforminwas due tointracellular accumulation or binding to membranes, a method that relies onassessing uptake under conditions of varying osmolarity was applied (Gisclonet al., 1987). In short, uptake of metformin was determined at 1 hour in thepresence of varying concentrations of the impermeable solute, sucrose (0.2 mMto 0.8 mM). Uptake of 5 mMmetformin was determined in HEK-EV and HEK-OCT1 cells at varying osmolarities. Theoretically, at infinite sucrose osmolarity,intracellular space volume is negligible because the cells shrink, and metforminassociated with the cells represents membrane bound. Thus, the intercept of alinear plot of metformin uptake versus inverse sucrose osmolarity, divided bymetformin uptake in the absence of sucrose, represents the fraction of metforminbound to the cellular membranes.
Statistical Analysis. In general, triplicate data points were generated in eachexperiment and experiments were repeated three times unless otherwise stated.Data are presented as mean 6 S.E.M. Statistical inference was calculated usingStudent’s t test.
Mathematical Modeling. A model similar to that published previouslyelsewhere was used to characterize the uptake of metformin into HEK-EV cells(Trapp and Horobin, 2005; Trapp et al., 2008; Ghosh et al., 2014). Briefly, theflux of metformin across a cell membrane, JA → B is assumed to follow theelectrochemical potential of a monoprotic base (eq. 2):
JA → B ¼ Pn:SA:�f An :C
Au 2 f Bn :C
Bu
�2Pi:SA:
z:FF
RT
"�f Bi :C
Bu:e
z:FFRT 2 f Ai :C
Au
�ez:FFRT 2 1
#
ð2Þ
where Pn and Pi represent intrinsic permeability of the neutral and ionizedspecies of metformin; SA, z,F, Δf,R, and T represent the membrane surface area,molecular charge, Faraday’s constant, electric potential, gas constant, andabsolute temperature; and fn, fi, and Cu are the neutral fraction, ionized fraction,and unbound concentration on either side of the membrane, respectively.The fractional ionization was calculated using the Henderson-Hasselbalchequation according to the pH and an assumed metformin pKa of 12.4(DrugBank: (http://www.drugbank.ca).
As previously described, this conceptualization of flux was incorporated intoa physiologic cell model containing representations of media, cytosol, nucleus,
Rapid Method to Determine Intracellular Concentrations 357
at ASPE
T Journals on June 7, 2018
dmd.aspetjournals.org
Dow
nloaded from
lysosomes, endoplasmic reticulum (ER), and mitochondria. Concentrations foreach compartment were characterized by accounting for the volumes and fluxesbetween compartments as shown for the cytosol (eq. 3).
VcytosoldCcytosol
dt¼ Jmedia → cytosol 2 Jcytosol → media
þ +organelles
ðJorg → cytosol 2 JCytosol → orgÞ ð3Þ
The HEK cell volume was assumed to be 1.23 pl, with 40, 10, 0.7, 9.3, and 40%being represented by cytosol, mitochondria, lysosome, ER, and nucleus,respectively. Under 5.4 mM extracellular KCl conditions, values for Δf wereassumed to be220,2180, 18.6, and29.2 mV (Trapp and Horobin, 2005; Trappet al., 2008; Ghosh et al., 2014) for the outer membrane, mitochondria, lysosome,and nucleus, respectively.
Due to uncertainty in the appropriateΔf values for the ER, data were modeledunder an assumed value of 280 mV and 0 mV to cover a range consistent withreported values (Somlyo et al., 1981; Tang et al., 1989; Burdakov et al., 2005;Qin et al., 2011). The value assumed for the outer membrane is within the rangeof internal electrophysiologic measures on these cells (219 to227 mV, data notshown) and independent literature (Søgaard et al., 2001). Under 140 mM KClconditions, Δf was assumed to be 0 mV for the cell membrane (Søgaard et al.,2001; Yamada et al., 2001). Values for pH were assumed to be 7.4, 7.2, 8.0,4.7, 7.2, and 7.2 for the media, cytosol, mitochondria, lysosome, ER, andnucleus, respectively (Trapp and Horobin, 2005; Trapp et al., 2008; Ghoshet al., 2014). Under these assumptions, the Pn and Pi values of metformin wereestimated from the time course of cellular uptake in HEK-EV cells under lowand high extracellular KCl conditions by the maximum likelihood method.
Consistent with a mechanism of equilibrative, saturable transport according toelectrochemical potential, the kinetics of metformin uptake in OCT1 transfectedcells were characterized by incorporating a bidirectional saturable effect on theionized permeability of metformin (eq. 4):
JA → B ¼ Pn:SA:ð f An :CAu 2 f Bn :C
Bu Þ
2Pi:SA:z:FF
RT
"�OCT1B → A f Bi :e
z:FFRT 2OCT1A → B f Ai
�ez:FFRT 2 1
#ð4Þ
where
OCT1A → B ¼ ðCBu Þga
ðKmÞg þ ðCBu Þg
and
OCT1B → A ¼ ðCAu Þg × b
ðKmÞg þ ðCAu Þg
The effect of OCT1 on flux was only applied to the outer cell membrane. Allother physiologic parameters of the HEK-OCT1 cells were assumed to beequivalent to that previously stated for HEK-EV cells, except the time course forthe model was 20 minutes for the HEK-EV and 60 minutes for the HEK-OCT1.
Exposure to the 140 mMKCl solution resulted in poor viability of the HEK-EVcells compared with the HEK-OCT1 cells. In addition, the Pn and Pi values formetformin were assumed to be the same as estimated in HEK-EV cells, and thevalue of g was fixed to 1.12. Under these assumptions, the values of a, b, and Km
were estimated from the time course of cellular uptake in HEK-OCT1 cells underlow and high extracellular KCl conditions by the maximum likelihood method.
Results
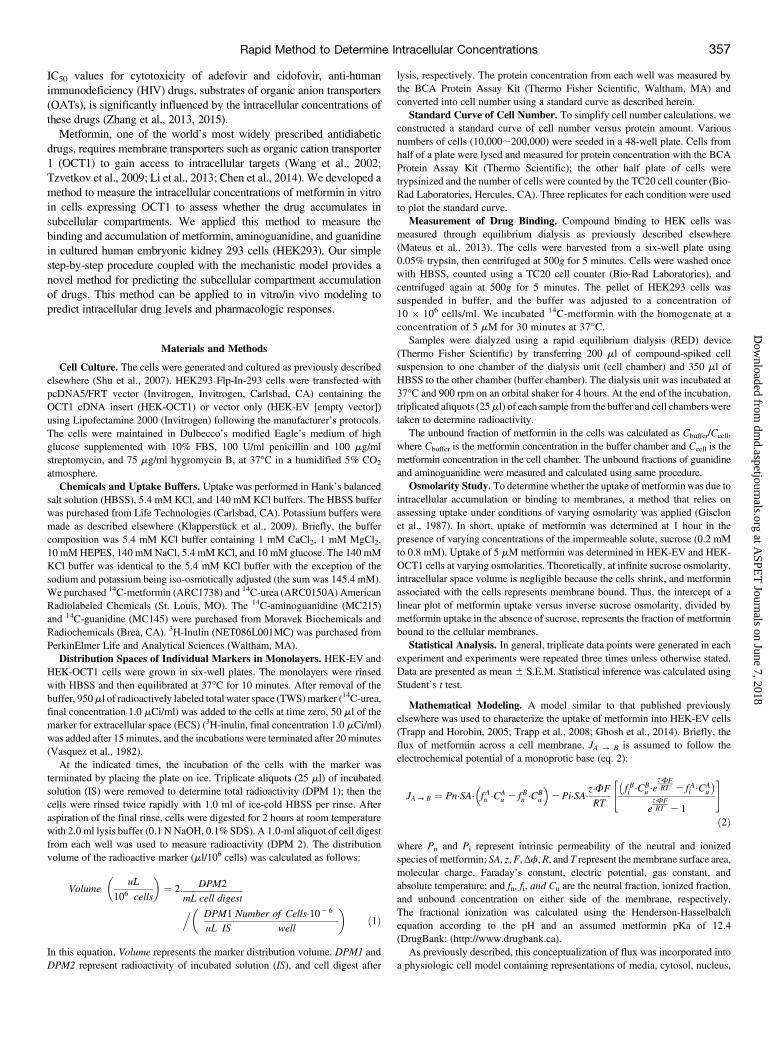
Intracellular Space Measurement. Total water space (TWS: thesum of ECS and intracellular space [ICS]) was estimated by theequilibrium distribution volume of 14C-urea, which reached a steadystate in 20 minutes and was independent of the urea concentration(Fig. 1A,modified fromVasquez et al., 1982). The TWS ofHEK-EV andHEK-OCT1 was 2.866 0.12 ml/106 cells and 2.736 0.01 ml/106
cells, respectively (Fig. 2A). The ECS distribution volume of HEK-EV was 1.646 0.23 ml/106 cells and was 1.48 6 0.04 mL/106 cells
for HEK-OCT1. Thus, the total intracellular space of HEK-EV andHEK-OCT1was calculated to be 1.216 0.07ml/106 cells and 1.25 6 0.06ml/106
cells, respectively.In addition, we measured cell diameter using a cell sorter (Supple-
mental Table 1). The cell volume of HEK-EV and HEK-OCT1 wascalculated to be 2.286 0.68 ml/106 cells and 2.336 0.71 ml/106 cells,respectively. We also tested the effect of different cell densities, rangingfrom 1.5 � 106 to 4.0 � 106/well and we found that the ICS wassmaller when the cells were present at higher densities, such as ICS was0.70ml/106 cells when cell densitywas 4� 106/well (Fig. 2B). The smallerICS associatedwith high-cell density is a result of many cells squeezed intoa limited surface area resulting in a smaller intracellular volume per cell.Thus, cell density is an important determinant of intracellular volume.Measurement of Unbound Drug Fraction. Measurements of drug
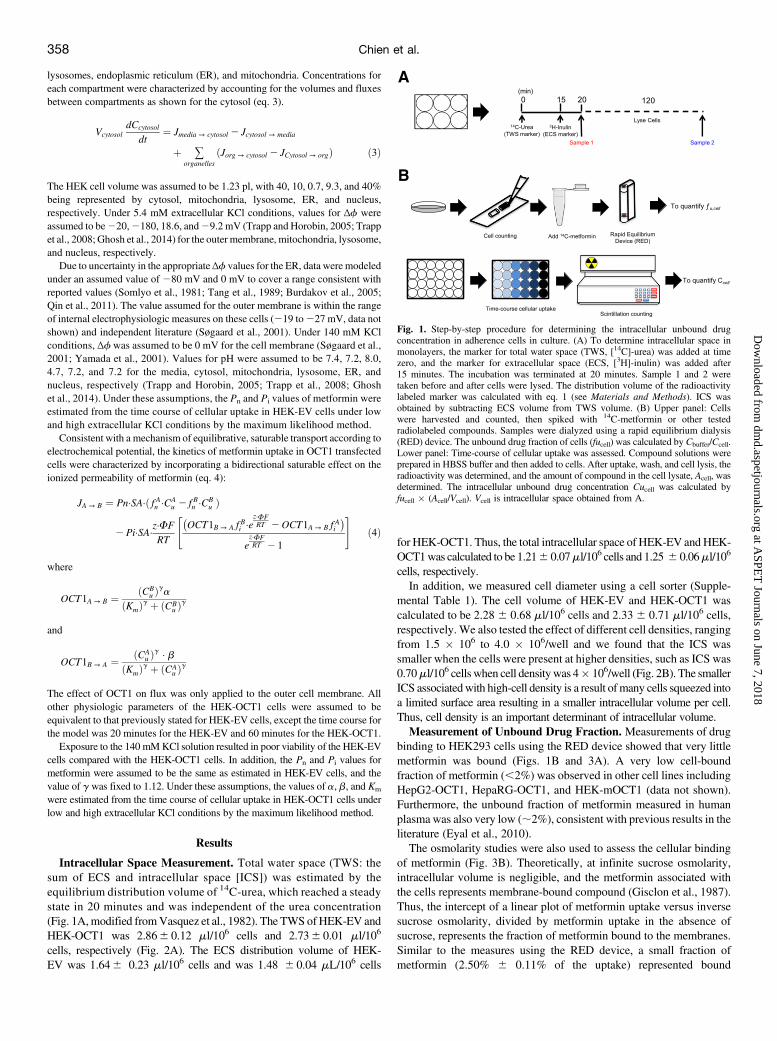
binding to HEK293 cells using the RED device showed that very littlemetformin was bound (Figs. 1B and 3A). A very low cell-boundfraction of metformin (,2%) was observed in other cell lines includingHepG2-OCT1, HepaRG-OCT1, and HEK-mOCT1 (data not shown).Furthermore, the unbound fraction of metformin measured in humanplasma was also very low (;2%), consistent with previous results in theliterature (Eyal et al., 2010).The osmolarity studies were also used to assess the cellular binding
of metformin (Fig. 3B). Theoretically, at infinite sucrose osmolarity,intracellular volume is negligible, and the metformin associated withthe cells represents membrane-bound compound (Gisclon et al., 1987).Thus, the intercept of a linear plot of metformin uptake versus inversesucrose osmolarity, divided by metformin uptake in the absence ofsucrose, represents the fraction of metformin bound to the membranes.Similar to the measures using the RED device, a small fraction ofmetformin (2.50% 6 0.11% of the uptake) represented bound
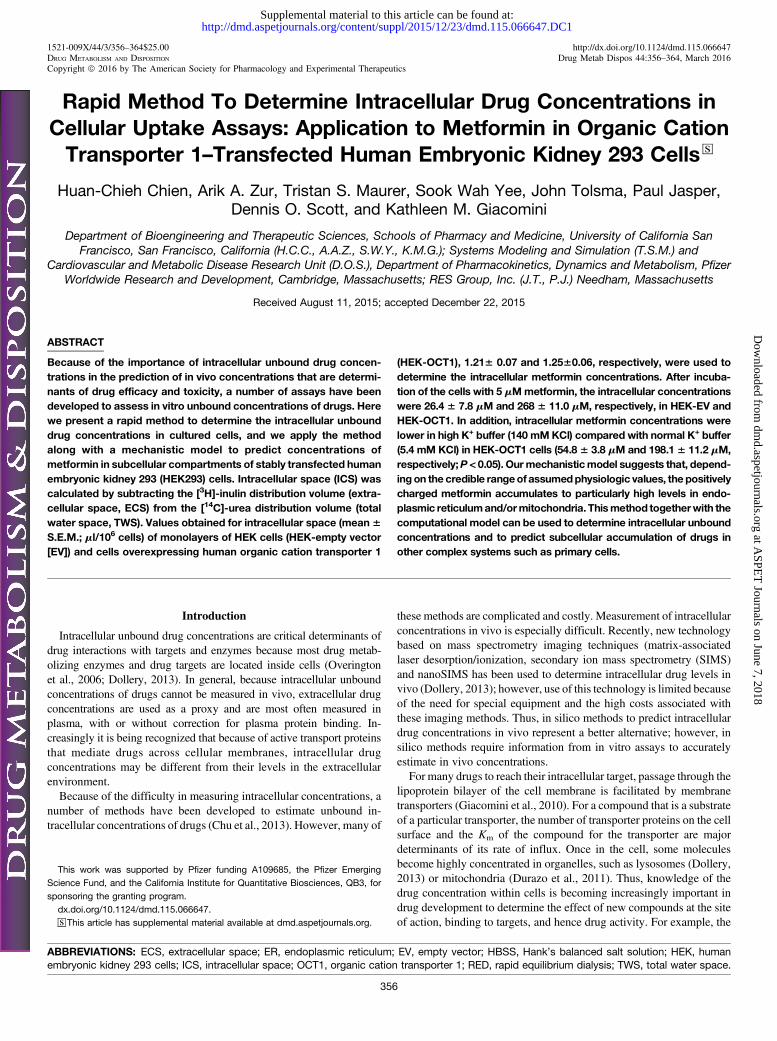
Fig. 1. Step-by-step procedure for determining the intracellular unbound drugconcentration in adherence cells in culture. (A) To determine intracellular space inmonolayers, the marker for total water space (TWS, [14C]-urea) was added at timezero, and the marker for extracellular space (ECS, [3H]-inulin) was added after15 minutes. The incubation was terminated at 20 minutes. Sample 1 and 2 weretaken before and after cells were lysed. The distribution volume of the radioactivitylabeled marker was calculated with eq. 1 (see Materials and Methods). ICS wasobtained by subtracting ECS volume from TWS volume. (B) Upper panel: Cellswere harvested and counted, then spiked with 14C-metformin or other testedradiolabeled compounds. Samples were dialyzed using a rapid equilibrium dialysis(RED) device. The unbound drug fraction of cells (fucell) was calculated by Cbuffer/Ccell.Lower panel: Time-course of cellular uptake was assessed. Compound solutions wereprepared in HBSS buffer and then added to cells. After uptake, wash, and cell lysis, theradioactivity was determined, and the amount of compound in the cell lysate, Acell, wasdetermined. The intracellular unbound drug concentration Cucell was calculated byfucell � (Acell/Vcell). Vcell is intracellular space obtained from A.
358 Chien et al.
at ASPE
T Journals on June 7, 2018
dmd.aspetjournals.org
Dow
nloaded from
metformin. Both methods showed metformin exhibits low cell binding,and its binding is negligible in comparison with its intracellularconcentrations.Intracellular Concentrations of Guanidine Compounds. We
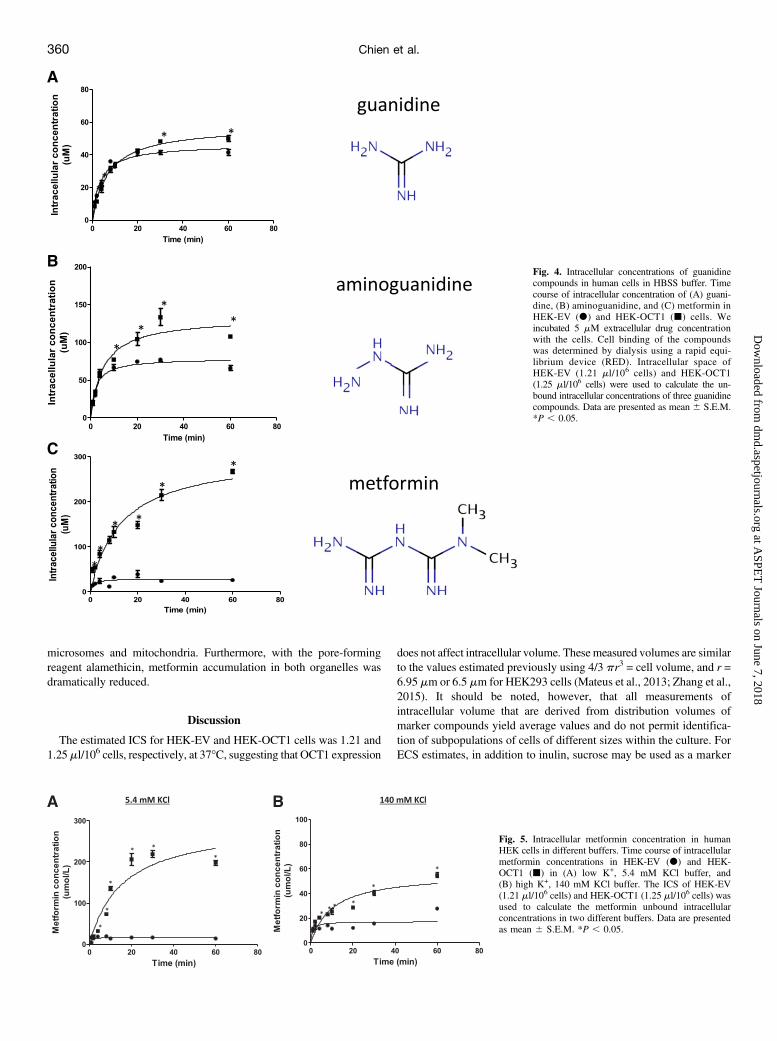
compared unbound intracellular concentrations of a series of guanidinecompounds including guanidine, aminoguanidine, andmetformin (dimeth-ylbiguanidine). Intracellular guanidine concentrations were very similar inHEK-EV and HEK-OCT1 cells, consistent with the compound not being asubstrate of OCT1 (Fig. 4A). In contrast, intracellular aminoguanidineconcentration in HEK-OCT1 was 2-fold higher than in HEK-EV cells(Fig. 4B), and the intracellular metformin concentration in HEK-OCT1was 10-fold higher than in HEK-EV cells (Fig. 4C). Interestingly, themetformin accumulation was greater than the accumulation of guanidineand aminoguanidine, consistentwith the drug being a substrate for OCT1.We then compared the unbound drug accumulation ratio (Kpuu),
defined as the intracellular concentration divided by the mediumconcentration, for unbound guanidine, aminoguanidine, and metforminusing 5mMcompound concentrations in HBSS uptake buffer. Guanidineexhibited the lowest Kpuu (10), and metformin had the highest ratio(53.6).Intracellular Concentration of Metformin in Buffers Containing
KCl. The effect of membrane potential on intracellular accumulation ofmetformin was studied using lowK+ (5.4 mMKCl) and high K+ buffers(140 mM KCl). Similar intracellular concentrations of metformin wereobserved between the standard HBSS uptake buffer (K+ concentration =5.4 mM) (Fig. 4C) and the low K+ buffer (Fig. 5A), reflecting thesimilar K+ concentrations and the similar membrane potential differ-ence between in the cells incubated in the prepared low K+ buffer andthe standard HBSS buffer. In contrast, intracellular metformin concen-trations were much lower in HEK-OCT1 in high K+ buffer (Fig. 5B),consistent with an electrical potential sensitive accumulation of the druginto the cells.Mathematical Modeling. The proposed mechanistic model cap-
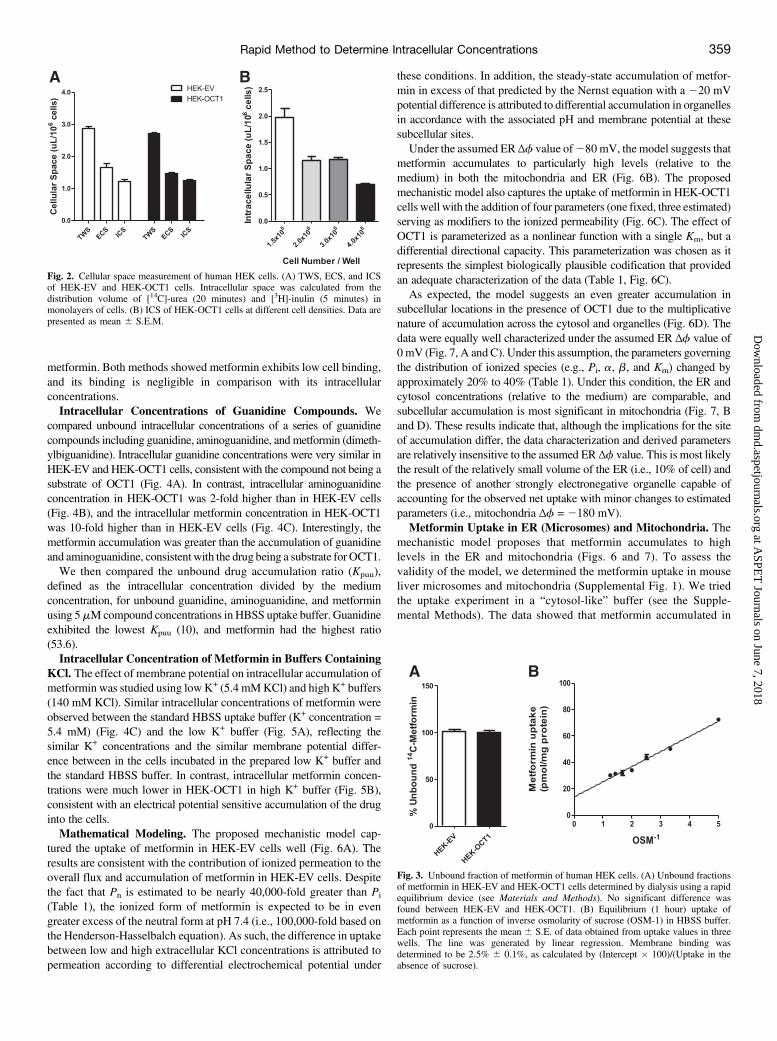
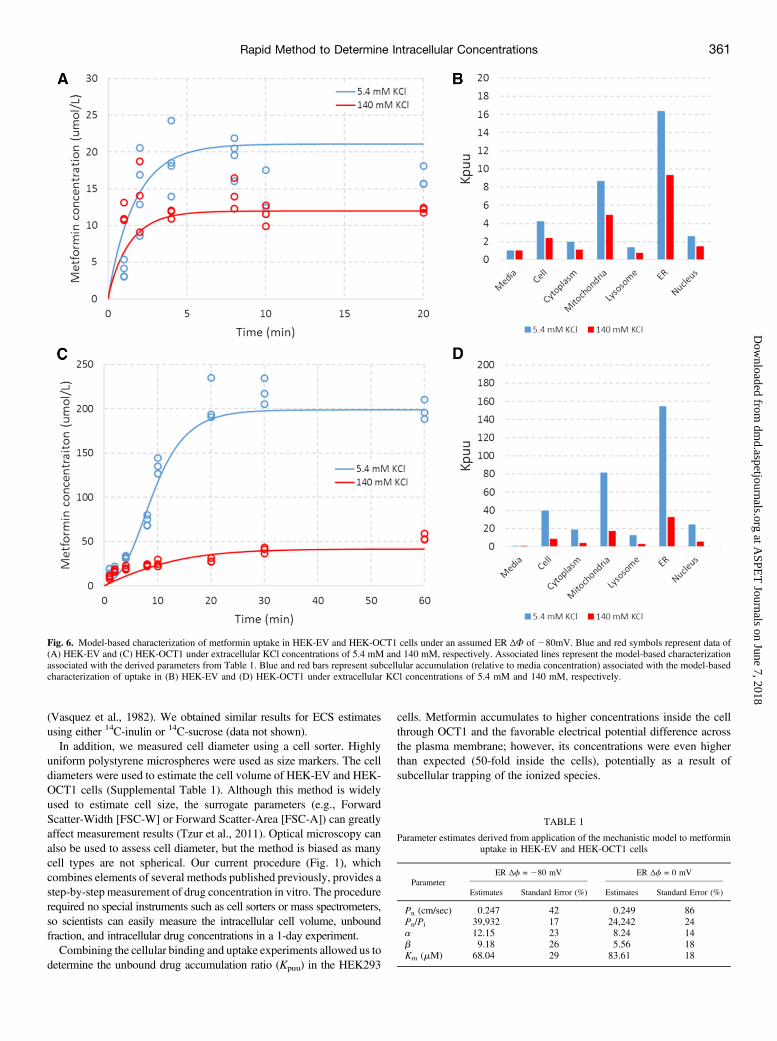
tured the uptake of metformin in HEK-EV cells well (Fig. 6A). Theresults are consistent with the contribution of ionized permeation to theoverall flux and accumulation of metformin in HEK-EV cells. Despitethe fact that Pn is estimated to be nearly 40,000-fold greater than Pi
(Table 1), the ionized form of metformin is expected to be in evengreater excess of the neutral form at pH 7.4 (i.e., 100,000-fold based onthe Henderson-Hasselbalch equation). As such, the difference in uptakebetween low and high extracellular KCl concentrations is attributed topermeation according to differential electrochemical potential under
these conditions. In addition, the steady-state accumulation of metfor-min in excess of that predicted by the Nernst equation with a 220 mVpotential difference is attributed to differential accumulation in organellesin accordance with the associated pH and membrane potential at thesesubcellular sites.Under the assumed ER Δf value of280 mV, the model suggests that
metformin accumulates to particularly high levels (relative to themedium) in both the mitochondria and ER (Fig. 6B). The proposedmechanistic model also captures the uptake of metformin in HEK-OCT1cells well with the addition of four parameters (one fixed, three estimated)serving as modifiers to the ionized permeability (Fig. 6C). The effect ofOCT1 is parameterized as a nonlinear function with a single Km, but adifferential directional capacity. This parameterization was chosen as itrepresents the simplest biologically plausible codification that providedan adequate characterization of the data (Table 1, Fig. 6C).As expected, the model suggests an even greater accumulation in
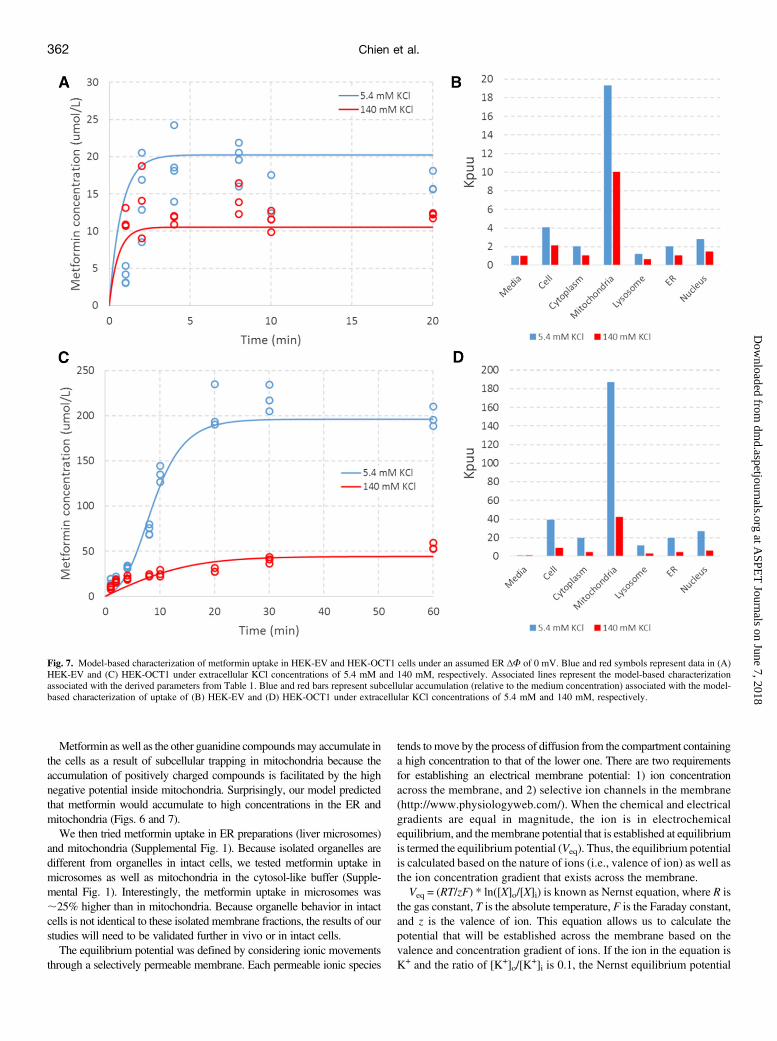
subcellular locations in the presence of OCT1 due to the multiplicativenature of accumulation across the cytosol and organelles (Fig. 6D). Thedata were equally well characterized under the assumed ER Δf value of0 mV (Fig. 7, A and C). Under this assumption, the parameters governingthe distribution of ionized species (e.g., Pi, a, b, and Km) changed byapproximately 20% to 40% (Table 1). Under this condition, the ER andcytosol concentrations (relative to the medium) are comparable, andsubcellular accumulation is most significant in mitochondria (Fig. 7, Band D). These results indicate that, although the implications for the siteof accumulation differ, the data characterization and derived parametersare relatively insensitive to the assumed ER Δf value. This is most likelythe result of the relatively small volume of the ER (i.e., 10% of cell) andthe presence of another strongly electronegative organelle capable ofaccounting for the observed net uptake with minor changes to estimatedparameters (i.e., mitochondria Δf = 2180 mV).Metformin Uptake in ER (Microsomes) and Mitochondria. The
mechanistic model proposes that metformin accumulates to highlevels in the ER and mitochondria (Figs. 6 and 7). To assess thevalidity of the model, we determined the metformin uptake in mouseliver microsomes and mitochondria (Supplemental Fig. 1). We triedthe uptake experiment in a “cytosol-like” buffer (see the Supple-mental Methods). The data showed that metformin accumulated in
Fig. 2. Cellular space measurement of human HEK cells. (A) TWS, ECS, and ICSof HEK-EV and HEK-OCT1 cells. Intracellular space was calculated from thedistribution volume of [14C]-urea (20 minutes) and [3H]-inulin (5 minutes) inmonolayers of cells. (B) ICS of HEK-OCT1 cells at different cell densities. Data arepresented as mean 6 S.E.M.
Fig. 3. Unbound fraction of metformin of human HEK cells. (A) Unbound fractionsof metformin in HEK-EV and HEK-OCT1 cells determined by dialysis using a rapidequilibrium device (see Materials and Methods). No significant difference wasfound between HEK-EV and HEK-OCT1. (B) Equilibrium (1 hour) uptake ofmetformin as a function of inverse osmolarity of sucrose (OSM-1) in HBSS buffer.Each point represents the mean 6 S.E. of data obtained from uptake values in threewells. The line was generated by linear regression. Membrane binding wasdetermined to be 2.5% 6 0.1%, as calculated by (Intercept � 100)/(Uptake in theabsence of sucrose).
Rapid Method to Determine Intracellular Concentrations 359
at ASPE
T Journals on June 7, 2018
dmd.aspetjournals.org
Dow
nloaded from
microsomes and mitochondria. Furthermore, with the pore-formingreagent alamethicin, metformin accumulation in both organelles wasdramatically reduced.
Discussion
The estimated ICS for HEK-EV and HEK-OCT1 cells was 1.21 and1.25ml/106 cells, respectively, at 37�C, suggesting that OCT1 expression
does not affect intracellular volume. Thesemeasured volumes are similarto the values estimated previously using 4/3 pr3 = cell volume, and r =6.95 mm or 6.5 mm for HEK293 cells (Mateus et al., 2013; Zhang et al.,2015). It should be noted, however, that all measurements ofintracellular volume that are derived from distribution volumes ofmarker compounds yield average values and do not permit identifica-tion of subpopulations of cells of different sizes within the culture. ForECS estimates, in addition to inulin, sucrose may be used as a marker
Fig. 4. Intracellular concentrations of guanidinecompounds in human cells in HBSS buffer. Timecourse of intracellular concentration of (A) guani-dine, (B) aminoguanidine, and (C) metformin inHEK-EV (d) and HEK-OCT1 (j) cells. Weincubated 5 mM extracellular drug concentrationwith the cells. Cell binding of the compoundswas determined by dialysis using a rapid equi-librium device (RED). Intracellular space ofHEK-EV (1.21 ml/106 cells) and HEK-OCT1(1.25 ml/106 cells) were used to calculate the un-bound intracellular concentrations of three guanidinecompounds. Data are presented as mean 6 S.E.M.*P , 0.05.
Fig. 5. Intracellular metformin concentration in humanHEK cells in different buffers. Time course of intracellularmetformin concentrations in HEK-EV (d) and HEK-OCT1 (j) in (A) low K+, 5.4 mM KCl buffer, and(B) high K+, 140 mM KCl buffer. The ICS of HEK-EV(1.21 ml/106 cells) and HEK-OCT1 (1.25 ml/106 cells) wasused to calculate the metformin unbound intracellularconcentrations in two different buffers. Data are presentedas mean 6 S.E.M. *P , 0.05.
360 Chien et al.
at ASPE
T Journals on June 7, 2018
dmd.aspetjournals.org
Dow
nloaded from
(Vasquez et al., 1982). We obtained similar results for ECS estimatesusing either 14C-inulin or 14C-sucrose (data not shown).In addition, we measured cell diameter using a cell sorter. Highly
uniform polystyrene microspheres were used as size markers. The celldiameters were used to estimate the cell volume of HEK-EV and HEK-OCT1 cells (Supplemental Table 1). Although this method is widelyused to estimate cell size, the surrogate parameters (e.g., ForwardScatter-Width [FSC-W] or Forward Scatter-Area [FSC-A]) can greatlyaffect measurement results (Tzur et al., 2011). Optical microscopy canalso be used to assess cell diameter, but the method is biased as manycell types are not spherical. Our current procedure (Fig. 1), whichcombines elements of several methods published previously, provides astep-by-step measurement of drug concentration in vitro. The procedurerequired no special instruments such as cell sorters or mass spectrometers,so scientists can easily measure the intracellular cell volume, unboundfraction, and intracellular drug concentrations in a 1-day experiment.Combining the cellular binding and uptake experiments allowed us to
determine the unbound drug accumulation ratio (Kpuu) in the HEK293
cells. Metformin accumulates to higher concentrations inside the cellthrough OCT1 and the favorable electrical potential difference acrossthe plasma membrane; however, its concentrations were even higherthan expected (50-fold inside the cells), potentially as a result ofsubcellular trapping of the ionized species.
Fig. 6. Model-based characterization of metformin uptake in HEK-EV and HEK-OCT1 cells under an assumed ER ΔF of 280mV. Blue and red symbols represent data of(A) HEK-EV and (C) HEK-OCT1 under extracellular KCl concentrations of 5.4 mM and 140 mM, respectively. Associated lines represent the model-based characterizationassociated with the derived parameters from Table 1. Blue and red bars represent subcellular accumulation (relative to media concentration) associated with the model-basedcharacterization of uptake in (B) HEK-EV and (D) HEK-OCT1 under extracellular KCl concentrations of 5.4 mM and 140 mM, respectively.
TABLE 1
Parameter estimates derived from application of the mechanistic model to metforminuptake in HEK-EV and HEK-OCT1 cells
ParameterER Δf = 280 mV ER Δf = 0 mV
Estimates Standard Error (%) Estimates Standard Error (%)
Pn (cm/sec) 0.247 42 0.249 86Pn/Pi 39,932 17 24,242 24a 12.15 23 8.24 14b 9.18 26 5.56 18Km (mM) 68.04 29 83.61 18
Rapid Method to Determine Intracellular Concentrations 361
at ASPE
T Journals on June 7, 2018
dmd.aspetjournals.org
Dow
nloaded from
Metformin as well as the other guanidine compoundsmay accumulate inthe cells as a result of subcellular trapping in mitochondria because theaccumulation of positively charged compounds is facilitated by the highnegative potential inside mitochondria. Surprisingly, our model predictedthat metformin would accumulate to high concentrations in the ER andmitochondria (Figs. 6 and 7).We then tried metformin uptake in ER preparations (liver microsomes)
and mitochondria (Supplemental Fig. 1). Because isolated organelles aredifferent from organelles in intact cells, we tested metformin uptake inmicrosomes as well as mitochondria in the cytosol-like buffer (Supple-mental Fig. 1). Interestingly, the metformin uptake in microsomes was;25% higher than in mitochondria. Because organelle behavior in intactcells is not identical to these isolated membrane fractions, the results of ourstudies will need to be validated further in vivo or in intact cells.The equilibrium potential was defined by considering ionic movements
through a selectively permeable membrane. Each permeable ionic species
tends tomove by the process of diffusion from the compartment containinga high concentration to that of the lower one. There are two requirementsfor establishing an electrical membrane potential: 1) ion concentrationacross the membrane, and 2) selective ion channels in the membrane(http://www.physiologyweb.com/). When the chemical and electricalgradients are equal in magnitude, the ion is in electrochemicalequilibrium, and themembrane potential that is established at equilibriumis termed the equilibrium potential (Veq). Thus, the equilibrium potentialis calculated based on the nature of ions (i.e., valence of ion) as well asthe ion concentration gradient that exists across the membrane.Veq = (RT/zF) * ln([X]o/[X]i) is known as Nernst equation, where R is
the gas constant, T is the absolute temperature, F is the Faraday constant,and z is the valence of ion. This equation allows us to calculate thepotential that will be established across the membrane based on thevalence and concentration gradient of ions. If the ion in the equation isK+ and the ratio of [K+]o/[K
+]i is 0.1, the Nernst equilibrium potential
Fig. 7. Model-based characterization of metformin uptake in HEK-EV and HEK-OCT1 cells under an assumed ER ΔF of 0 mV. Blue and red symbols represent data in (A)HEK-EV and (C) HEK-OCT1 under extracellular KCl concentrations of 5.4 mM and 140 mM, respectively. Associated lines represent the model-based characterizationassociated with the derived parameters from Table 1. Blue and red bars represent subcellular accumulation (relative to the medium concentration) associated with the model-based characterization of uptake of (B) HEK-EV and (D) HEK-OCT1 under extracellular KCl concentrations of 5.4 mM and 140 mM, respectively.
362 Chien et al.
at ASPE
T Journals on June 7, 2018
dmd.aspetjournals.org
Dow
nloaded from
forK+will be261.5mV (whenT= �C+273.15K,R=8.314 J.K21.mol21,F = 96,485 C.mol21, and z = 1). So, at an extracellular K+ concentrationof 5.4 mM, a large electrochemical difference (inside negative) acrossthe plasma membrane is created, which in turn triggers more metforminto accumulate in the cells. Conversely, at an extracellular K+ concen-tration of 140 mM, the membrane potential difference is minimized,which restricts metformin uptake into cells.Interestingly, at physiologic pH of 7.4, the valences of guanidine,
aminoguanidine, and metformin are all +1, but the Kpuu of metformin islarger than the other two compounds. Because the pKas of metformin,aminoguanidine, and guanidine are similar (12.4, 12.0, and 12.5[DrugBank: (http://www.drugbank.ca]), respectively), it seems un-likely that differences in the subcellular compartment pH would resultin differences in subcellular accumulation of these three guanidinecompounds.It has long been known that basic molecules become highly
concentrated in organelles, such as lysosomes (Dollery, 2013) ormitochondria (Durazo et al., 2011). Furthermore, mitochondrialrespiratory chain complex I is the primary target of metformin(Viollet et al., 2012). These data collectively suggest that metforminis concentrated in a subcellular compartment(s) in comparison with theother two compounds. The differences between the compounds couldbe due to differences in Pn/Pi for the compounds (which the model isusing to drive the subcellular accumulation of metformin). Our modelsuggests that metformin will accumulate to high levels in ER and/or themitochondria (depending upon the assumed value of Δf for the ER).Ideally, methods in intact cells rather than isolated subcellular fractionswill reflect the in vivo situation more accurately. However, suchprocedures are fraught with technical difficulties. Our results usingisolated mitochondria and microsomes (Wells, 2005) show thatmetformin accumulates in both organelles.Our results indicate that OCT1 transport is saturable (Km = 68–84mM)
and that the capacity to accentuate ionized permeability is about 30% to50% greater in the direction of uptake over efflux (Table 1). Though theestimated Km of metformin for OCT1 is considerably lower than the Km
values in the literature (1.47 mM; Kimura et al., 2005), this is likelyattributable to the application of a mechanistic model (e.g., Fick-Nernst-Planck versus Eadie-Hofstee) to a different set of experimental condi-tions (time course of metformin to steady-state versus concentrationdependent initial uptake). These two methods rely on different as-sumptions. For example, the traditional method assumes that there arenegligible intracellular concentrations of metformin under initial con-ditions, but our mechanistic model does not make this assumption.Further application of this model framework to standard initial rates ofuptake experiments (in concert with equilibrium studies) is warranted tobetter understand these apparent differences. There are other factorssuch as pH and temperature, with or without inhibitor (e.g., ions), thatmay have affected our Km determinations. However, it is not possible todiscern which factor caused the large difference.Although the significance and mechanistic implications of this
apparent relative directional capacity remain to be determined, theresults are generally consistent with OCT1-mediated metformin uptakebeing a function of cell physiology (e.g., pH, electrochemical potential,subcellular volumes, transport capacity), the physiochemical propertiesof metformin (e.g., pKa, Pn, and Pi), and the interaction betweenmetformin and OCT1 (e.g., Km).In vitro assays are frequently used to assess the transmembrane flux
of drugs to predict clinical pharmacokinetic parameters (in vitro/in vivocorrelations). However, to obtain reliable in vitro/in vivo correlations, itis critical to accurately determine the intracellular concentrations invitro (Houston and Galetin, 2003). The procedure we have presentedshould be applicable to the measurement of ICS as well as the
intracellular compound concentration of drugs and other solutesunder steady-state conditions in a variety of adherent cultured cells.Our procedure, coupled with a mechanistic model, provides a novelmethod for predicting subcellular compartment accumulation ofdrugs.
Acknowledgments
The authors thank Jennifer Liras for her sponsorship of the collaborationbetween Pfizer and UCSF.
Authorship ContributionsParticipated in research design: Chien, Zur, Maurer, Scott, Giacomini.Conducted experiments: Chien, Zur, Maurer, Tolsma, Jasper.Performed data analysis: Chien, Zur, Maurer, Yee, Tolsma, Jasper,
Giacomini.Wrote or contributed to the writing of the manuscript: Chien, Zur, Maurer,
Yee, Giacomini.
References
Burdakov D, Petersen OH, and Verkhratsky A (2005) Intraluminal calcium as a primary regulatorof endoplasmic reticulum function. Cell Calcium 38:303–310.
Chen L, Shu Y, Liang X, Chen EC, Yee SW, Zur AA, Li S, Xu L, Keshari KR, and Lin MJ, et al.(2014) OCT1 is a high-capacity thiamine transporter that regulates hepatic steatosis and is atarget of metformin. Proc Natl Acad Sci USA 111:9983–9988.
Chu X, Korzekwa K, Elsby R, Fenner K, Galetin A, Lai Y, Matsson P, Moss A, Nagar S,and Rosania GR, et al.; International Transporter Consortium (2013) Intracellular drug con-centrations and transporters: measurement, modeling, and implications for the liver. ClinPharmacol Ther 94:126–141.
Dollery CT (2013) Intracellular drug concentrations. Clin Pharmacol Ther 93:263–266.Durazo SA, Kadam RS, Drechsel D, Patel M, and Kompella UB (2011) Brain mito-chondrial drug delivery: influence of drug physicochemical properties. Pharm Res 28:2833–2847.
Eyal S, Easterling TR, Carr D, Umans JG, Miodovnik M, Hankins GD, Clark SM, Risler L, WangJ, Kelly EJ, Shen DD, and Hebert MF (2010) Pharmacokinetics of metformin during preg-nancy. Drug Metab Dispos 38:833–840.
Ghosh A, Maurer TS, Litchfield J, Varma MV, Rotter C, Scialis R, Feng B, Tu M, GuimaraesCRW, and Scott DO (2014) Toward a unified model of passive drug permeation II: thephysiochemical determinants of unbound tissue distribution with applications to the design ofhepatoselective glucokinase activators. Drug Metab Dispos 42:1599–1610.
Giacomini KM, Huang S-M, Tweedie DJ, Benet LZ, Brouwer KLR, Chu X, Dahlin A, Evers R,Fischer V, and Hillgren KM, et al.; International Transporter Consortium (2010) Membranetransporters in drug development. Nat Rev Drug Discov 9:215–236.
Gisclon LEE, Wong FEEMI, and Giacomini M (1987) Cimetidine transport in isolated luminalmembrane vesicles from rabbit kidney. Am J Physiol 253:F141–F150.
Houston JB and Galetin A (2003) Progress towards prediction of human pharmacokinetic pa-rameters from in vitro technologies. Drug Metab Rev 35:393–415.
Kimura N, Masuda S, Tanihara Y, Ueo H, Okuda M, Katsura T, and Inui K (2005) Metformin is asuperior substrate for renal organic cation transporter OCT2 rather than hepatic OCT1. DrugMetab Pharmacokinet 20:379–386.
Klapperstück T, Glanz D, Klapperstück M, and Wohlrab J (2009) Methodological aspects ofmeasuring absolute values of membrane potential in human cells by flow cytometry. CytometryA 75:593–608.
Li Q, Yang H, Peng X, Guo D, Dong Z, Polli JE, and Shu Y (2013) Ischemia/reperfusion-inducible protein modulates the function of organic cation transporter 1 and multidrug andtoxin extrusion 1. Mol Pharm 10:2578–2587.
Mateus A, Matsson P, and Artursson P (2013) Rapid measurement of intracellular unbound drugconcentrations. Mol Pharm 10:2467–2478.
Overington JP, Al-Lazikani B, and Hopkins AL (2006) How many drug targets are there? Nat RevDrug Discov 5:993–996.
Qin Y, Dittmer PJ, Park JG, Jansen KB, and Palmer AE (2011) Measuring steady-state anddynamic endoplasmic reticulum and Golgi Zn2+ with genetically encoded sensors. Proc NatlAcad Sci USA 108:7351–7356.
Shu Y, Sheardown SA, Brown C, Owen RP, Zhang S, Castro RA, Ianculescu AG, Yue L, Lo JC,and Burchard EG, et al. (2007) Effect of genetic variation in the organic cation transporter 1(OCT1) on metformin action. J Clin Invest 117:1422–1431.
Søgaard R, Ljungstrøm T, Pedersen KA, Olesen S, Jensen BOS, Ljungstrøm T, Angelo K, OlesenS, and Skaaning B (2001) KCNQ4 channels expressed in mammalian cells functional char-acteristics and pharmacology. Am J Physiol Cell Physiol 280:859–866.
Somlyo AV, Gonzalez-Serratos HG, Shuman H, McClellan G, and Somlyo AP (1981) Calciumrelease and ionic changes in the sarcoplasmic reticulum of tetanized muscle: an electron-probestudy. J Cell Biol 90:577–594.
Tang JM, Wang J, and Eisenberg RS (1989) K+-selective channel from sarcoplasmic reticulum ofsplit lobster muscle fibers. J Gen Physiol 94:261–278.
Trapp S and Horobin RW (2005) A predictive model for the selective accumulation of chemicalsin tumor cells. Eur Biophys J 34:959–966.
Trapp S, Rosania GR, Horobin RW, and Kornhuber J (2008) Quantitative modeling of selectivelysosomal targeting for drug design. Eur Biophys J 37:1317–1328.
Tzur A, Moore JK, Jorgensen P, Shapiro HM, and Kirschner MW (2011) Optimizing optical flowcytometry for cell volume-based sorting and analysis. PLoS One 6:e16053.
Rapid Method to Determine Intracellular Concentrations 363
at ASPE
T Journals on June 7, 2018
dmd.aspetjournals.org
Dow
nloaded from

Tzvetkov MV, Vormfelde SV, Balen D, Meineke I, Schmidt T, Sehrt D, Saboli�c I, Koepsell H,and Brockmöller J (2009) The effects of genetic polymorphisms in the organic cation trans-porters OCT1, OCT2, and OCT3 on the renal clearance of metformin. Clin Pharmacol Ther 86:299–306 Nature Publishing Group.
Vasquez B, Ishibashi F, and Howard BV (1982) Measurement of intracellular volume inmonolayers of cultured cells. In Vitro 18:643–649.
Viollet B, Guigas B, Sanz Garcia N, Leclerc J, Foretz M, and Andreelli F (2012) Cellular andmolecular mechanisms of metformin: an overview. Clin Sci (Lond) 122:253–270.
Wang D-S, Jonker JW, Kato Y, Kusuhara H, Schinkel AH, and Sugiyama Y (2002) Involvementof organic cation transporter 1 in hepatic and intestinal distribution of metformin. J PharmacolExp Ther 302:510–515.
Wells WA (2005) The discovery of synaptic vesicles. J Cell Biol 168:12–13 DOI: 10.1083/jcb1681fta2.
Yamada A, Gaja N, Ohya S, Muraki K, Narita H, Ohwada T, and Imaizumi Y (2001) Usefulnessand limitation of DiBAC4(3), a voltage-sensitive fluorescent dye, for the measurement of
membrane potentials regulated by recombinant large conductance Ca2+-activated K+ channelsin HEK293 cells. Jpn J Pharmacol 86:342–350.
Zhang X, Scialis RJ, Feng B, and Leach K (2013) Detection of statin cytotoxicity is increased incells expressing the OATP1B1 transporter. Toxicol Sci 134:73–82.
Zhang X, Wang R, Piotrowski M, Zhang H, and Leach KL (2015) Intracellular concentrations determinethe cytotoxicity of adefovir, cidofovir and tenofovir. Toxicol In Vitro 29:251–258.
Address correspondence to: Dr. Kathleen M. Giacomini, Department of Bioengineer-ing & Therapeutic Sciences, Schools of Pharmacy andMedicine, University of CaliforniaSan Francisco. 1550 4th Street, Mission Bay, RH 584, MB2911, San Francisco, CA94158. E-mail: [email protected]
364 Chien et al.
at ASPE
T Journals on June 7, 2018
dmd.aspetjournals.org
Dow
nloaded from