probe sensitivity to cortical versus intracellular ...intracellular intracellular). please cite this...
TRANSCRIPT
Please cite this article in press as: Vahabikashi et al., Probe Sensitivity to Cortical versus Intracellular Cytoskeletal Network Stiffness, Biophysical Journal(2019), https://doi.org/10.1016/j.bpj.2018.12.021
Article
Probe Sensitivity to Cortical versus IntracellularCytoskeletal Network Stiffness
Amir Vahabikashi,1 Chan Young Park,2 Kristin Perkumas,3 Zhiguo Zhang,2 Emily K. Deurloo,2 Huayin Wu,4
David A. Weitz,4,5,6 W. Daniel Stamer,3,7 Robert D. Goldman,8 Jeffrey J. Fredberg,2 and Mark Johnson1,9,10,*1Department of Biomedical Engineering, Northwestern University, Evanston, Illinois; 2Department of Environmental Health, Harvard T.H. ChanSchool of Public Health, Boston, Massachusetts; 3Department of Ophthalmology, Duke University, Durham, North Carolina; 4School ofEngineering and Applied Sciences, Harvard University, Cambridge, Massachusetts; 5Wyss Institute for Biologically Inspired Engineering,Harvard University, Cambridge, Massachusetts; 6Department of Physics, Harvard University, Cambridge, Massachusetts; 7Department ofBiomedical Engineering, Duke University, Durham, North Carolina; 8Department of Cell and Molecular Biology, Feinberg School of Medicine,Northwestern University, Chicago, Illinois; 9Department of Ophthalmology, Feinberg School of Medicine, Northwestern University, Chicago,Illinois; and 10Department of Mechanical Engineering, Northwestern University, Evanston, Illinois
ABSTRACT In development, wound healing, and pathology, cell biomechanical properties are increasingly recognized asbeing of central importance. To measure these properties, experimental probes of various types have been developed, buthow each probe reflects the properties of heterogeneous cell regions has remained obscure. To better understand differencesattributable to the probe technology, as well as to define the relative sensitivity of each probe to different cellular structures, herewe took a comprehensive approach. We studied two cell types—Schlemm’s canal endothelial cells and mouse embryonic fibro-blasts (MEFs)—using four different probe technologies: 1) atomic force microscopy (AFM) with sharp tip, 2) AFM with round tip,3) optical magnetic twisting cytometry (OMTC), and 4) traction microscopy (TM). Perturbation of Schlemm’s canal cells withdexamethasone treatment, a-actinin overexpression, or RhoA overexpression caused increases in traction reported by TMand stiffness reported by sharp-tip AFM as compared to corresponding controls. By contrast, under these same experimentalconditions, stiffness reported by round-tip AFM and by OMTC indicated little change. Knockout (KO) of vimentin in MEFs causeda diminution of traction reported by TM, as well as stiffness reported by sharp-tip and round-tip AFM. However, stiffness reportedby OMTC in vimentin-KO MEFs was greater than in wild type. Finite-element analysis demonstrated that this paradoxical OMTCresult in vimentin-KO MEFs could be attributed to reduced cell thickness. Our results also suggest that vimentin contributes notonly to intracellular network stiffness but also cortex stiffness. Taken together, this evidence suggests that AFM sharp tip and TMemphasize properties of the actin-rich shell of the cell, whereas round-tip AFM and OMTC emphasize those of the noncorticalintracellular network.
INTRODUCTION
Biomechanical properties of cells influence a variety of basiccellular behaviors, including migration, proliferation,contraction, elongation, adhesion, cytokinesis, and apoptosis(1–3). These behaviors in turn impact tissue morphogenesis,cancer metastasis, bronchospasm, vasospasm, systemic hy-pertension, glaucoma, and atherosclerosis (4–10). Earlystudies of cellular biomechanics considered the cell to beeither a homogeneous structure or a fluid-like cytoplasm sur-rounded by a cortical elastic shell. It is now clear, however,that the mechanical behavior of a cell is determined by thestructure of the cortical, intracellular (noncortical) cytoskel-
Submitted May 16, 2018, and accepted for publication December 20, 2018.
*Correspondence: [email protected]
Editor: Jochen Guck.
https://doi.org/10.1016/j.bpj.2018.12.021
� 2019 Biophysical Society.
etal, and nuclear networks (11,12), their distribution in space,and the complex rheology of the cytoplasm and cytosol (13).How these factors are reflected by different experimentalprobes, however, remains unclear.
We examine here the cytoskeletalmechanics of endothelialcells of the inner wall of Schlemm’s canal (SC) cells, withpossible relevance to glaucoma (14,15). To expand the gener-ality of the results and to focus on the role of vimentin, we alsoconsider mouse embryonic fibroblasts (MEFs). Experimentsemployed atomic force microscopy (AFM) with both sharpand round tips, optical magnetic twisting cytometry(OMTC), and traction microscopy (TM). Each of theseprobes provides complementary characterization of themate-rial properties of these cells, with AFM tips measuring resis-tance to indentation (12), OMTCmeasuring the resistance ofthe cells to applied torque (16), and TM characterizing the
Biophysical Journal 116, 1–12, February 5, 2019 1

Vahabikashi et al.
Please cite this article in press as: Vahabikashi et al., Probe Sensitivity to Cortical versus Intracellular Cytoskeletal Network Stiffness, Biophysical Journal(2019), https://doi.org/10.1016/j.bpj.2018.12.021
active tensile component in the cells (17). These are surfaceprobes thatwouldbe expected to be influenced by the stiffnessof the F-actin dense cortical region of the cell, which we referto here as the cortex, and by the intracellular cytoskeleton butnot by the much softer cytoplasm/cytosol (11,18).
We found that for all manipulations to both cell types,sharp-tip AFM probes and TM gave similar characterizationof cell biomechanical behavior and were sensitive primarilyto the cortical region of the cell. In contrast, larger round-tipAFMprobes andOMTCwere sensitive to both the corticaland intracellular network but primarily the latter. Finally, theabsence of vimentin caused a reduction in stiffness of both thecortical and intracellular networks and in cellular traction.
MATERIALS AND METHODS
Cell isolation and culture
SC cells were isolated and cultured from postmortem enucleated human
eyes within 36 h of death with enucleation occurring less than 6 h after
death (15). Eyes with history of trabeculoplasty, anterior segment surgery,
or any ocular disease (except cataract) were excluded. SC cells between
passages three and five were used for all experiments. SC cells were char-
acterized by established procedures (expression of vascular endothelial cad-
herin, net transendothelial electrical resistance of 10U , cm2 or greater, and
lack of myocilin induction by dexamethasone (15)). SC cells were cultured
in Dulbecco’s modified Eagle’s medium/low glucose (Life Technologies,
Grand Island, NY) with 10% fetal bovine serum (Atlanta Biologicals,
Norcross, GA) and 1% penicillin/streptomycin (Life Technologies).
Wild-type (WT) and vimentin knockout (KO) MEFs were originally
extracted from mouse embryo and immortalized as discussed previously
(19). MEFs were cultured in Dulbecco’s modified Eagle’s medium/high
glucose (Life Technologies) supplemented with 10% fetal calf serum
(Atlanta Biologicals), 5 mM nonessential amino acids (Life Technologies),
and 1% penicillin/streptomycin (Life Technologies). MEFs were either
sparsely seeded or confluent when tested.
All cell cultures were maintained in a humidified incubator at 5% CO2
and 37�C, and media were changed every other day. Cells were passaged
when they were around 80% confluent. For passaging, cells were washed
with phosphate-buffered saline (PBS) (Life Technologies) to remove the
serum, then treated with trypsin-EDTA 0.25% (Thermo Fischer Scientific,
Grand Island, NY) and passaged at a ratio of 1:3.
Cell cultures were examined under various conditions of confluency:
superconfluent, confluent, or sparsely confluent.
Dexamethasone studies
Stock solutions of dexamethasone (0.01, 0.1, and 1mM; SigmaAldrich,Mil-
waukee,WI)were prepared in ethanol as thevehicle and thendilutedwith cul-
ture medium to final concentrations of 0.01, 0.1, and 1 mM dexamethasone.
Control studies used the same ethanol concentration (1%) as used in the dexa-
methasone solutions. Two normal SC cell strains (SC71, SC76) were treated
with dexamethasone or control solutions for 7 days because it takes this long
to get a reliable dexamethasone response (20). Media were replaced every
other day. Cells were superconfluent at the end of the treatment.
Overexpression of a-actinin and RhoAexpression
Four normal (SC69, SC71, SC73, SC76) cell strains were transduced with
1) an adenovirus encoding a ubiquitin promoter driving GFP, 2) a ubiquitin
2 Biophysical Journal 116, 1–12, February 5, 2019
promoter driving a-actinin with a GFP tag, or 3) a ubiquitin promoter
driving RhoA with a GFP tag; a fourth group 4) consisting of non-trans-
duced cells (no virus) was also used. Groups 1 and 4 served as controls.
Cells were confluent when tested.
AFM measurements
AllAFMmeasurements weremadewith cells inmediawith 10% fetal bovine
serum. AFM measurements were made on a BioScope II with Nanoscope V
controller (Bruker, Santa Barbara, CA) coupled to an inverted fluorescent mi-
croscopewith 10� (NA¼ 0.3) and20� (NA¼ 0.8) objective lens (CarlZeiss,
Thornwood, NY). Sharp tips were pyramidal cantilevers mounted on a trian-
gular cantilever with a length of 200 mm, a nominal tip radius of 20 nm, a tip
half angle of 20� (as measured using scanning electron microscopy), and a
nominal spring constant of 0.02 N/m (Olympus TR400PSA; Asylum
Research, Goleta, CA). We note that the tip half angle was less than the nom-
inal value reported by the manufacturer (36�). Round tips were spheres of 10mm diameter mounted on silicon nitride cantilevers with nominal spring con-
stant of 0.01 N/m (Novascan Technologies, Ames, IA). Indentation depths
were between 100 and 400 nm, which we have previously shown to give
values of cellular Young’s modulus (E) that were relatively independent of
indentation (12)while also avoiding any substrate effects (21).Measurements
were done on regions well away from both nucleus and cell edges. Young’s
modulus was determined as described in the Supporting Materials and
Methods (12). AFM measurements are done in this study with a ramp of
800 nm/s; we have previously shown (12) that this speed is sufficiently
slow such that our measurements are not rate dependent, and that with the al-
gorithm used (21), elastic modulus is relatively independent of indentation
and load (12). The spring constant was calibrated before each experiment us-
ing the thermal fluctuations function of the nanoscope, which measures the
motion of cantilever in response to thermal noise.Typically, 10–40AFMmea-
surements were made per each experimental condition. For AFM measure-
ment of cells transduced with a-actinin, the microscope fluorescent mode
was used to locate transduced cells with the GFP tag, followed by AFMmea-
surements on those cells; for cells transduced with RhoA, the fluorescent tag
was difficult to visualize in our AFM system, and thus this step was not taken
before AFMmeasurements. However, transfection was separately confirmed
using fluorescent microscopy and Western blotting (22).
OMTC measurements
Cells were seeded to 96-well plates (Corning, Corning, NY) in the presence
of 10% serum. Ferromagnetic beads (4.5 mm in diameter), coated with poly-
L-lysine, were allowed to attach to the cells for 20–30 min (14). The beads
were then magnetized with a strong magnetic pulse in the horizontal direc-
tion and twisted with a much weaker oscillatory magnetic field (0.77 Hz) in
the vertical direction. The torque on the bead was automatically adjusted to
achieve a median bead translation of �40 nm, and bead motion was quan-
tified by image analysis. The ratio of magnetic torque to bead motion
was used to determine complex shear modulus of cells, and the elastic
modulus, g0, which has units of pascals per nanometer, was used as a
measure of cell stiffness as previously described (14,23).
TM measurements
Cells were seeded on collagen-coated acrylamide gels in 96-well plates or
35 mm glass-bottomed dishes in the presence of 10% serum (media for each
cell type as described above) throughout the experiments. The gels were
prepared as previously described (24) and had a Young’s modulus of
8 kPa for SC cells and confluent MEFs and 2.4 kPa for sparsely seeded
MEFs. A Leica epifluorescence microscope (Leica, Wetzlar, Germany)
was used to take images of fluorescent microparticles on acrylamide
gels. Based upon these images, displacements made by cells on gel were

Probe Sensitivity to Cortical Stiffness
Please cite this article in press as: Vahabikashi et al., Probe Sensitivity to Cortical versus Intracellular Cytoskeletal Network Stiffness, Biophysical Journal(2019), https://doi.org/10.1016/j.bpj.2018.12.021
calculated using particle image velocimetry (25), and from the displace-
ment fields, traction was retrieved using Fourier transform TM (25,26).
For confluent and superconfluent cells, root mean-square traction was
used as a measure of average cellular contractile force (24), and for sparsely
seeded cells, the contractile moment was used as a measure of average
cellular contractile force (26).
Confocal imaging
Cells were seeded onto glass cover slips 48 h before fixation and stained for
confocal experiments. 100% methanol (Sigma) was used as the fixative for
experiments in which vimentin was the only cytoskeletal filament to be
stained (Mendez et al. (27)). For all other experiments, 4% paraformalde-
hyde (Electron Microscopy Sciences, Hatfield, PA) was used (pH 7.4).
Methanol fixation was done by incubating cells with precooled methanol
for 10 min inside a�20�C freezer, and for paraformaldehyde fixation, cells
were fixed for 10 min at room temperature. For cases in which the second-
ary antibody was raised in goat (p-myosin and vimentin staining), samples
were blocked in 10% normal goat serum (Life Technologies) for 20 min to
block for the nonspecific binding before incubation with primary antibody.
For all other cases, cells were incubated with Image-iT FX Signal Enhancer
(Life Technologies) for 20 min before incubation with primary antibody.
For dexamethasone experiments, cells were stained for F-actin (30 min
incubation with Alexa Fluor 568 Phalloidin; Life Technologies), vimentin
(30 min incubation with Alexa Fluor 488 Conjugated Vimentin (D21H3)
XP Rabbit monoclonal antibody; Cell Signaling Technology, Danvers,
MA), the nucleus (15 min incubation with Hoechst 33342 (1:10,000);
Thermo Fischer Scientific), and p-myosin (overnight incubation at 4�Cwith Phospho-Myosin Light Chain 2, Ser19 (1:100), followed by two
washes with PBS and 1 h incubation with goat anti-rabbit IgG (H þ L)
Alexa Fluor 488 (1:400); Cell Signaling Technology). For RhoA and
a-actinin experiments, cells were stained for F-actin (30 min incubation
with Alexa Fluor 568 Phalloidin) and the nucleus (15 min incubation
with Hoechst 33342 (1:10,000)).
A Zeiss 510 laser scanning microscope inverted two-photon confocal
microscope equipped with 10� (NA ¼ 0.3), 20� (NA ¼ 0.8), 40� (water
immersion, NA¼ 1.2), and 63� (oil immersion, NA¼ 1.4) objective lenses
and excitation sources of Ar (458, 488, 514 nm), HeNe (543 nm), HeNe
(633 nm), and 2-photon (690–1024 nm) was used to create confocal images
from the samples (Carl Zeiss). Thickness of MEFs and fluorescent intensity
for the peripheral F-actin and p-myosin for SC cells were measured using
Fiji image processing software.
Bead-embedding depths were examined in WTand KO MEFs by using a
confocal microscope (Leica TSC SP5, 63�/1.2 NA water immersion lens;
Leica) after staining cytoplasm with a fluorescent dye (Cell-Tracker Green;
Thermo Fisher) (28). Using ImageJ, the percentage of bead embedding was
quantified (29).
SIM
MEFs were fixed with 3% paraformaldehyde, permeabilized with 0.1%
Triton-X100 (Sigma Aldrich) in PBS for 10 min at room temperature,
and then rinsed briefly in PBS. The samples were subsequently incubated
in chicken anti-vimentin antibody (1:2000; Biolegend, San Diego, CA) in
PBS containing 5% normal goat serum (Jackson Immuno Research, West
Grove, PA) for 30 min at room temperature, followed by washing with
PBS containing 0.05% Tween 20 twice for 3 min, and finally washed
with PBS for 3 min. The slides were then incubated in goat anti-chicken
antibody (Alexa Fluor 488, 1:400; Life Technologies) and Alexa Fluor
568 Phalloidin (1:400; Life Technologies) for 30 min. Slides were then
washed with PBS containing 0.05% Tween 20 twice for 3 min and finally
washed with PBS for 3 min. The cover slips were mounted using Prolong
Diamond (Thermo Fischer Scientific). Three-dimensional structured
illumination microscopy (SIM) was carried out with a Nikon Structured
Illumination Super-Resolution Microscope System (Nikon N-SIM; Nikon,
Tokyo, Japan) using an oil immersion objective lens CFI SR (Apochromat
TIRF100�, 1.49 NA; Nikon).
Statistical analysis
Because measurements of cell stiffness are not normally distributed
(11,12,30,31), data were logarithmically transformed for statistical analysis
and determined as geometric means5 standard error around the geometric
mean (15) for each cell strain, unless otherwise indicated; averages taken
over cell strains were arithmetic. Statistical significance of the effect of
drug concentration (dexamethasone) on log cell stiffness or log cell traction
was examined using linear regression. Analysis of variance was used to
compare the effects of inductions of GFP, a-actinin, or RhoA on log cell
stiffness and to compare vimentin-KO MEFs with controls, allowing for
unequal variance between groups and using Tukey to account for multiple
comparisons. JMP was used for these analyses with a significance level of
0.05; the minimal reported p-value is 10�4. Details of which JMP routines
were used are found in the Supporting Materials and Methods.
FEM
Finite-element modeling (FEM) was used to model the influence of the cell
cortex on AFM and OMTC measurements of cell modulus, following the
approaches of Vargas-Pinto et al. (12) and Mijailovich et al. (32), respec-
tively. The cell was modeled as a cylinder of radius 10 mm (AFM) or
22.5 mm (OMTC) and a range of cell thickness from 2.75 to 15 mm, with
a nominal thickness of 5 mm. The radius of the cell was chosen to be suf-
ficiently large such that the strains at the edge of the domain were less
than 0.1% of the maximal strain near the probes, and a 50% increase in
radius did not significantly affect the results (<0.1% difference in all pa-
rameters for AFM and <0.13% for OMTC). Except for very small or nar-
row cells, the assumed shape of the cells would therefore have little effect
on the results.
The cortex of the cell was on its upper surface and had a thickness of
400 nm (12) in all cases, with no slip between the cortex and internal cyto-
skeleton (32); we have previously examined the effect of variations in cor-
tex thickness and found that the modeling results are not particularly
sensitive to this parameter (12). The intracellular cytoskeleton and cortex
are each modeled as homogeneous elastic materials, with the cortex having
a modulus that ranged from 1 to 100 times the modulus of the intracellular
cytoskeleton. Although the material was assumed to be incompressible, a
Poisson’s ratio of 0.49 was used for numerical stability. The AFM round
tips and OMTC probes were modeled as rigid spheres (12,32). The bottom
surface of the cell for both AFM and OMTC was pinned for zero displace-
ment; the other surfaces were stress free except where the probes contacted
the cell, as discussed below. Stress, strain, and deformation fields were
determined using ABAQUS/CAE 6.13 finite-element software (Simulia,
Providence, RI) with an explicit solver (33). An apparent modulus
(Eapparent) of an equivalent single-layer, homogeneous cell was computed
that would deform to the same extent as the two-layer cell model for the
same external torque (OMTC) or force (AFM).
Model of AFM tip
A two-dimensional axisymmetric model was used (12). The indentation is
assumed to be frictionless, consistent with the Hertz model (12), and the
apical surface of the cortex was assumed to remain in contact with the
AFM tip throughout the deformation process (34). The diameter of AFM
rounded probes investigated varied from 0.8 to 10 mm and had an indenta-
tion into the cell of 400 nm. For the AFM sharp tip, a conical shape was
assumed with a tip radius of 20 nm and a tip half angle of q ¼ 20�. Inden-tation of the sharp tip into the cell was limited to 80 nm because higher
indentations caused excessive numerical element distortion, and even
with remeshing, the model did not converge to a solution, a limitation noted
Biophysical Journal 116, 1–12, February 5, 2019 3
Vahabikashi et al.
Please cite this article in press as: Vahabikashi et al., Probe Sensitivity to Cortical versus Intracellular Cytoskeletal Network Stiffness, Biophysical Journal(2019), https://doi.org/10.1016/j.bpj.2018.12.021
in other such studies (12,35). This is also the reason that round-tip probes
smaller than 0.8 mm in diameter could not be modeled for a 400 nm inden-
tation. We note that the behavior for progressively smaller round tips,
indenting 400 nm into a cell, are consistent with our results for a sharp
tip indented 80 nm into a cell (e.g., Figs. 6, S4, and S5). Nonetheless, it
is a limitation of this study that we were not able to model sharp-tip inden-
tations greater than 80 nm.
To calculate Eapparent for AFM, the reaction force for the given indenta-
tion of the AFM tip into the cell were determined using ABAQUS for
each case and matched to that of a homogenous case (cortex and internal
cytoskeleton with equal modulus) that gave the same force for the same
indentation.
OMTC model
For OMTC modeling, a full three-dimensional geometry model was used.
A no-slip boundary condition was applied between the probe (4.5 mm in
diameter) and cell cortex (32). The magnetic field applied in OMTC was
modeled as a torque per unit volume (60 Pa (32)) applied to the center of
the bead, causing the bead to rotate around its central axis. Depth of the
bead embedding was varied from 10 to 50% of the bead diameter
(36,37). To calculate Eapparent for each case, the horizontal displacement
of the OMTC probe for the given torque was determined using ABAQUS
and matched to that of a homogenous case (cortex and cytoskeleton with
same modulus) that had the same torque. To validate our model, we fol-
lowed Mijailovich et al. (32,33) and defined a parameter b that allowed
an effective shear modulus (Gd ¼ bG) to be determined based on bead-
embedding depth:
b ¼�Ts R
6 d
��G;
where Ts is the torque applied per unit bead volume, R is the bead radius,
d is the bead linear translation caused by the applied torque, and G is the
shear modulus of the homogenous medium in which the bead is embedded.
b can be thought of as the effective stiffness of the cell (torque required for a
given bead rotation) at a given bead-embedding depth relative to the stiff-
ness that would be seen for a homogenous cell with Ecortex ¼ Eintracellular
and a bead-embedding depth of 50% in an infinite medium. We found
values of b that were in good agreement with those found by Mijailovich
et al. for the case they examined (Ecortex ¼ Eintracellular) (see Fig. S10).
RESULTS
Alterations induced by dexamethasone, a-actinin,and RhoA
The monolayer of endothelial cells lining the inner wall ofSC in the eye is subject to a pressure gradient, and the me-chanical properties of these cells have been shown to beimportant to their biological barrier function (15). UsingAFM, TM, and OMTC, here we further characterized themechanical properties of these cells before and after treat-ment with dexamethasone or transduction with adenovirusencoding for RhoA or a-actinin. Dexamethasone can causeglaucoma and is known to generate cytoskeletal changesin SC cells (38); RhoA is a cytoskeletal regulator (39),and a-actinin is an actin cross-linker (40).
Figs. 1 and S11 shows the distribution of filamentousactin (F-actin) and phosphorylated myosin light chain(p-myosin) in confluent SC cells treated with dexametha-sone (1 mM) as compared with controls. In both control
4 Biophysical Journal 116, 1–12, February 5, 2019
and treated cells, we found stress fibers distributedthroughout the cells, particularly along the cell peripheries(Fig. 1, A and D). The distribution of p-myosin was similarto that of F-actin (Fig. 1, B and E). Compared to controltreatment, we found that dexamethasone-treated cells haddenser stress fibers and p-myosin at the periphery of thecells. Fluorescent intensity measurements confirmed theseconclusions, showing that the dexamethasone-treated group(1 mM) had higher cortical F-actin (p < 10�4) and p-myosin(p ¼ 0.0002) as compared with control.
Increasing concentrations of dexamethasone causeddosage-dependent increases in both SC cell stiffness (withsharp-tip AFM) and cell traction (TM), respectively(Fig. 2 A; linear regression: p < 10�4). In contrast, dexa-methasone had either no effect on SC cell stiffness asmeasured with AFM round tips (p z 1) or a small statisti-cally significant decrease in cell stiffness as measuredwith OMTC (Fig. 2 B; p < 10�4).
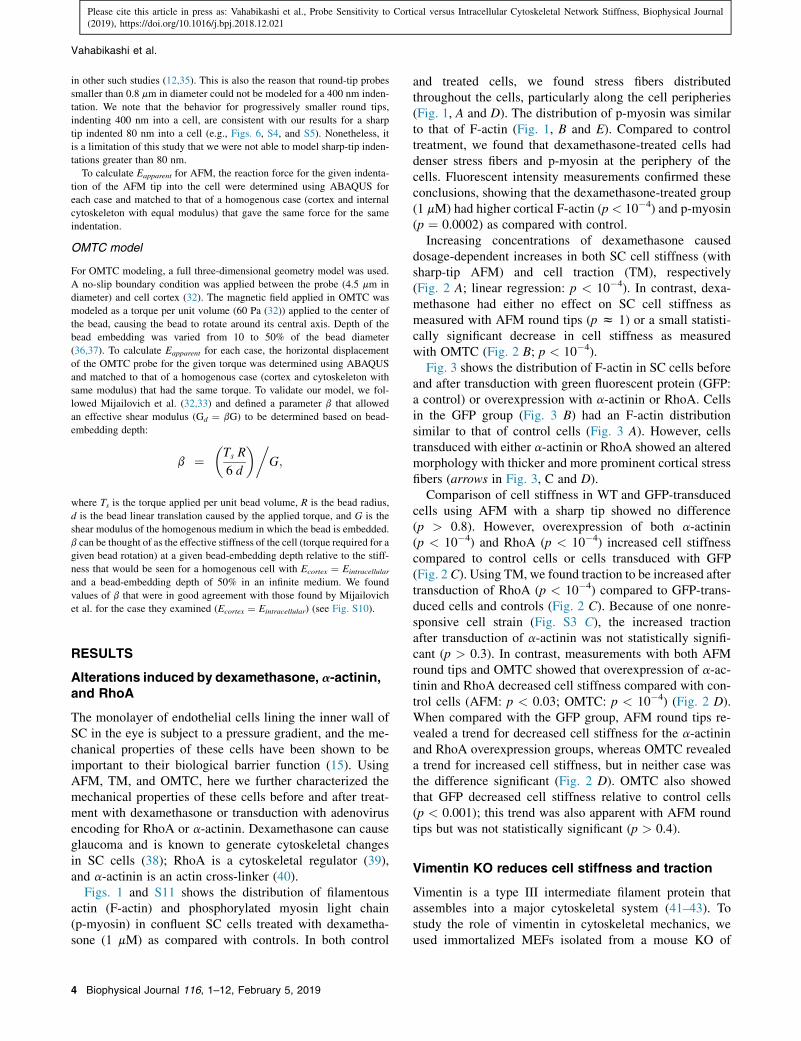
Fig. 3 shows the distribution of F-actin in SC cells beforeand after transduction with green fluorescent protein (GFP:a control) or overexpression with a-actinin or RhoA. Cellsin the GFP group (Fig. 3 B) had an F-actin distributionsimilar to that of control cells (Fig. 3 A). However, cellstransduced with either a-actinin or RhoA showed an alteredmorphology with thicker and more prominent cortical stressfibers (arrows in Fig. 3, C and D).
Comparison of cell stiffness in WT and GFP-transducedcells using AFM with a sharp tip showed no difference(p > 0.8). However, overexpression of both a-actinin(p < 10�4) and RhoA (p < 10�4) increased cell stiffnesscompared to control cells or cells transduced with GFP(Fig. 2 C). Using TM, we found traction to be increased aftertransduction of RhoA (p < 10�4) compared to GFP-trans-duced cells and controls (Fig. 2 C). Because of one nonre-sponsive cell strain (Fig. S3 C), the increased tractionafter transduction of a-actinin was not statistically signifi-cant (p > 0.3). In contrast, measurements with both AFMround tips and OMTC showed that overexpression of a-ac-tinin and RhoA decreased cell stiffness compared with con-trol cells (AFM: p < 0.03; OMTC: p < 10�4) (Fig. 2 D).When compared with the GFP group, AFM round tips re-vealed a trend for decreased cell stiffness for the a-actininand RhoA overexpression groups, whereas OMTC revealeda trend for increased cell stiffness, but in neither case wasthe difference significant (Fig. 2 D). OMTC also showedthat GFP decreased cell stiffness relative to control cells(p < 0.001); this trend was also apparent with AFM roundtips but was not statistically significant (p > 0.4).
Vimentin KO reduces cell stiffness and traction
Vimentin is a type III intermediate filament protein thatassembles into a major cytoskeletal system (41–43). Tostudy the role of vimentin in cytoskeletal mechanics, weused immortalized MEFs isolated from a mouse KO of

FIGURE 1 Confocal images of confluent monolayer of vehicle-only control (top row) as compared with 1-mM-dexamethasone-treated (bottom row) SC
cells; F-actin (red) (A andD), phosphorylated myosin (green) (B and E), nucleus (blue). Cortex and stress fibers are seen in both groups, but the cortex is more
prominent in treated SC cells (white arrows in (D)). Also, although p-myosin is present in both groups, it is more concentrated at the cortex of treated cells
(white arrows in (E)). (C) and (F) are overlaid images.
Probe Sensitivity to Cortical Stiffness
Please cite this article in press as: Vahabikashi et al., Probe Sensitivity to Cortical versus Intracellular Cytoskeletal Network Stiffness, Biophysical Journal(2019), https://doi.org/10.1016/j.bpj.2018.12.021
the intermediate filament gene encoding vimentin (19).In vimentin-KO MEFs, there was no vimentin, as expected,and in WT MEFs, there was a robust network of vimentinintermediate filaments throughout the cell body (Fig. 4, Cand D). In WT cells, vimentin filaments were mostly foundin the intracellular region but also within close proximity tothe actin-rich cortex (Fig. 4, E–G). No obvious differencewas seen in the F-actin distribution between the WT andvimentin-KO MEFs (Fig. 4, A and B).
We compared the mechanical behavior of vimentin-KOMEFs to WT MEFs using both confluent and sparselyconfluent seeding conditions. Vimentin-KO MEFs weregenerally softer than WT MEFs (using AFM sharp tips:confluent monolayers, p < 0.03, Fig. 2 E; sparsely cultured,p < 0.01, Fig. 2 G) and exerted less traction (using TM:confluent monolayers, p < 0.03, Fig. 2 E; sparsely cultured,p < 0.01, Fig. 2 G). Using AFM round tips, we also foundthat vimentin-KO MEFs were softer than WT MEFs, butthe differences did not reach statistical significance foreither confluent monolayers (p < 0.3) or sparsely culturedcells (p < 0.07) (Fig. 2, F and H).
Unexpectedly, when we measured stiffness using OMTC,the vimentin-KO MEFs were stiffer than WT MEFs
(confluent monolayers, p < 0.0001; sparsely cultured cells,p < 0.02) (Fig. 2, F and H). These observations were incontrast to the measurements taken using AFM sharp tips,AFM round tips, and TM. To understand why the resultsobtained by OMTC differed from those obtained by AFMand TM in MEFs, we measured the bead-embeddingdepth and cell thicknesses, both of which impact stiffnessmeasured by OMTC (32). We found that the bead-embed-ding depth was similar in both cell types, with no significantdifference between WT and vimentin-KO MEFs (mean of63%, n ¼ 14–18; p > 0.6). However, the thickness of thevimentin-KO MEFs (3.2 5 0.4 mm, mean 5 SD; n ¼ 20)was significantly smaller than that of the WT MEFs(4.2 5 0.5 mm, mean 5 SD; n ¼ 30) (Fig. 5) (p < 10�4).As shown below, FEM reconciles these observations.
FEM shows that the cell cortex differentiallyaffects differing measurements of cell stiffness
To model OMTC, we followed the approach of Mijailovichet al. (32) but allowed for a cell cortex that was significantlystiffer than the underlying intracellular network. To modelAFM, we extended the approach of Vargas-Pinto et al.
Biophysical Journal 116, 1–12, February 5, 2019 5

FIGURE 2 Measurements of cell biophysical properties of SC cells after (A and B) treatment with varying concentrations of dexamethasone as compared
with vehicle alone or (C and D) overexpression of a-actinin or RhoA as compared with GFP or control. (E)–(H) show comparison of wild-type (WT) MEFs
with vimentin KO. Superconfluent monolayers were used for the dexamethasone studies on SC cells (A and B), confluent for the a-actinin or RhoA expres-
sion studies on SC cells (C and D), and both confluent (E and F) and sparsely seeded (G and H) cells for the MEF studies, as described in the Materials and
Methods. Geometric mean5 standard error about geometric means is shown. Curves shown in (A) and (B) are best regression fits to the data; the equations
are given in Supporting Materials and Methods. Data for individual cell strains are found in Figs. S2 and S3. To see this figure in color, go online.
Vahabikashi et al.
Please cite this article in press as: Vahabikashi et al., Probe Sensitivity to Cortical versus Intracellular Cytoskeletal Network Stiffness, Biophysical Journal(2019), https://doi.org/10.1016/j.bpj.2018.12.021
(12) to determine the effect of AFM tip size. We modeled acell as a thin cylinder with a nominal thickness of 5 mm thathad two layers: a 400 nm thick cortex and an underlyingintracellular network. Embedded in the top of the cell waseither a sharp or round AFM tip that exerted a vertical forceon the cell or a round OMTC probe that exerted a torque onthe cell. Details are in the Materials and Methods.
We first examined the strain-energy density distributioncaused by AFM tips or the OMTC probe when the cortexhas the same stiffness (Ecortex) as the intracellular cytoskel-eton (Eintracellular) and when it is 50 times stiffer(Fig. 6; Supporting Materials and Methods). For the AFMsharp tip, strain energy is largely confined to the cortex(Fig. 6, A and B), consistent with the previous findings(12). For the smallest AFM round-tip probe (0.8 mm), strainenergy is also largely confined to the cortex but extendsappreciably into the intracellular network as well, particularfor the case of a stiff cortex (Fig. 6, C and D). For the largestAFM round-tip probe (10 mm), strain energy extendsthroughout the cell beneath the probe but is somewhatbroader for the case of a stiff cortex (Fig. 6, E and F).Finally, for OMTC, the strain-energy distribution isintermediate between the cases of the small and largerAFM tips but is more similar to the latter, with the strainenergy spread out more broadly for the case of a stiff cortex(Fig. 6, G and H).
These results suggest that when the size of probe exceedsthe thickness of cortex, strain energy spreads out of thecortex, particularly when the cortex is much stiffer thanthe intracellular network.
6 Biophysical Journal 116, 1–12, February 5, 2019
The effect of cortex stiffness on measurements by AFMand OMTC was quantified by computing an apparentmodulus (Eapparent) for an equivalent single-layer, homoge-neous cell that deformed to the same extent as the cell modelwith cortex as a function of Ecortex/Eintracelluar (see Materialsand Methods). For AFM sharp tips, Eapparent ranged from65 to 100% of Ecortex (Fig. 7 A, inset), whereas for AFMround tips, Eapparent was less than 10% of Ecortex. For anAFM tip diameter of 10 mm, Eapparent was nearly indepen-dent of Ecortex and near the value of Eintracelluar (Fig. 7 A).
For OMTC, the predictions were similar to those of AFMround tips, with Eapparent much closer to Eintracelluar than toEcortex (Fig. 7 B). These results were very different thanthose of AFM sharp tips and show that the stiffnessmeasured by OMTC is largely characteristic of the intracel-lular network, although it is still somewhat affected by cor-tex stiffness. Interestingly, embedding depth does not have amonotonic effect on Eapparent but decreases with embeddingdepth for shallow embedding and then reversing this trendfor deeper embedding (Figs. 7 B and S7). This is causedby the distal cortex (the cortex that is not surrounding thebead) that becomes somewhat more important for deeplyembedded beads (Fig. S8), and by a substrate effect (insertin Fig. 7 B; Supporting Materials and Methods).
The effect of decreased KO MEF cell thickness onOMTC and AFM measurements
Our OMTC measurements suggested that vimentin-KOMEFs were stiffer than WT MEFs, in contrast with the
FIGURE 3 Confocal images of SC cells. (A) WT-
non-transduced, (B) GFP-transduced, (C) a-actinin-
transduced, and (D) RhoA-transduced cells are
shown; F-actin (red), nucleus (blue). Control and
GFP groups had similar F-actin distribution and
cortex structure (A and B). The a-actinin-trans-
duced cells showed an altered morphology and
had a relatively thicker cortex (white arrow in
(C)). The RhoA-transduced cells showed significant
accumulation of stress fibers at peripheral regions
and a more prominent cortex (white arrow in (D)).
Probe Sensitivity to Cortical Stiffness
Please cite this article in press as: Vahabikashi et al., Probe Sensitivity to Cortical versus Intracellular Cytoskeletal Network Stiffness, Biophysical Journal(2019), https://doi.org/10.1016/j.bpj.2018.12.021
measurements using the other techniques (Fig. 2, E–H).Because we found that vimentin-KO MEFs are thinnerthan WT MEF, we examined whether this thickness differ-ence might explain the discrepancy, particularly in thecontext of deeply embedded OMTC beads. For cells thinnerthan 5 mm, the modulus rises rapidly with decreasing cellthickness (inset, Fig. 7 B; Fig. S6), which is a behaviorthat would explain why the OMTC showed KO MEFs tobe stiffer than WT. The effect of decreased thickness ofKO MEFs on Eapparent (Fig. S9) would also explain whythe AFM round-tip results were lower in KOs than WTsbut did not reach statistical significance.
DISCUSSION
Here, we have examined how the choice of surface probeimpacts the measurement and interpretation of cell biome-chanical properties. In response to a panel of interventionsand in both cell types investigated, cell stiffness measuredusing AFM sharp tips and contractile forces measured usingTM tracked similarly to one another (Fig. 2, A and C). How-ever, these measures did not track with cell stiffnessmeasured by OMTC or with AFM round tips. To explainthese differential responses, we turned to FEM simulations.Simulations of AFM round tips (5 mm or larger) and OMTCwere sensitive to stiffness of the intracellular network but
relatively insensitive to stiffness of the cell cortex (Fig. 7,A and B); these results also showed that OMTC is particu-larly sensitive to cell thickness. Simulations of AFM sharptips, by contrast, were more sensitive to the stiffness ofthe cell cortex, with values of Eapparent comparable to cortexstiffness (Fig. 7 A, inset). Taken together, these findings sug-gest that measurements using AFM sharp tips and TM tendto emphasize biomechanical properties of the cell cortex,whereas measurements using OMTC and AFM round tipstend to emphasize stiffness of the intracellular network.
OMTC measurements on cells previously have been sug-gested to characterize cortical stiffness (11,18,28,44). Therelative insensitivities of OMTC to cortex stiffness foundin our simulations were due to the large size of these probesas compared to the thickness of the cortex, leading to sub-stantial strain energy in the intracellular network. Ourfinding that OMTC is sensitive to intracellular network stiff-ness is consistent with studies of molecular crowding causedby cellular volume reduction, showing increased cell stiff-ness as measured using OMTC but no change in cellularcontractile force as measured by TM (23,28).
We note that the FEM used here greatly simplifies cyto-skeletal mechanics by treating the cortical and intracellularnetworks as two homogeneous, linearly elastic materials.The goal of these models was not to replicate the complexgeometry of the cytoskeleton but instead to evaluate how
Biophysical Journal 116, 1–12, February 5, 2019 7

FIGURE 4 Confocal images showing F-actin (red), nucleus (blue) (A and B), and vimentin intermediate filaments (green) (C andD) ofWTMEFs (A andC)
and vimentin-KO MEFs (B and D). (D) shows no staining in a vimentin-KO MEF. (E) shows a merged image of (A) and (B). (F) is a structured illumination
micrograph (SIM) of a WT MEF at the basal cortex level, showing the close association between actin stress fibers and vimentin intermediate filaments.
A magnified image of the inset in (F) showing vimentin intermediate filaments surrounding and interconnecting actin stress fibers is given (G).
Vahabikashi et al.
Please cite this article in press as: Vahabikashi et al., Probe Sensitivity to Cortical versus Intracellular Cytoskeletal Network Stiffness, Biophysical Journal(2019), https://doi.org/10.1016/j.bpj.2018.12.021
a stiff cortex may affect measurements of cell stiffness usingdifferent probes. Because these measurements are conven-tionally interpreted using models of cells that are homoge-neous and linearly elastic (21,32,45,46), examining theeffect of a stiff cortex on these stiffness measurementsnecessarily required use of a similar model, modified toinclude a cortex. A more realistic FEM model of the cellwould likely further strengthen our conclusions becausethe intracellular cytoskeletal network is connected to thecortical network, and this will induce propagation ofapically applied force or torque from OMTC beads or largerAFM rounded probes to deeper cytoskeletal structures oreven basal regions of the cell (47,48).
Vimentin is a structural protein that polymerizes intoa major intermediate filament cytoskeletal system(27,41,49,50). Our imaging studies showed a network of vi-mentin intermediate filaments in WT MEFs that wereentirely absent in vimentin-KO MEFs (Fig. 4, C and D).We also saw evidence of vimentin in the actin-rich corticalregion of the WTMEFs (Fig. 4, F andG), in agreement withprevious findings in chicken embryonic fibroblasts (51) andbovine pulmonary artery endothelial cells (52). We usedAFM sharp tip and TM to measure cell stiffness and con-tractile state of the cortex of the cells and found both signif-
8 Biophysical Journal 116, 1–12, February 5, 2019
icantly reduced in vimentin-KO MEFs as compared to WTMEFs (Fig. 2, E and G), leading us to conclude that vimen-tin intermediate filaments contribute to or influence corticalstiffness and cellular contractile force. Measurements usingAFM round tips allowed us to conclude that the intracellularnetwork of vimentin-KOMEFs also has reduced stiffness ascompared to WT MEFs (Fig. 2, F and H).
Guo et al. (18) used optical tweezers and found that thecytoplasmic stiffness of vimentin-KO MEFs was reducedas compared to WT MEFs, consistent with our finding ofreduced intracellular stiffness. They also used OMTC andconcluded that vimentin does not influence cortical stiff-ness, in contrast to our AFM sharp-tip and TM findings.However, we found decreased thickness in vimentin-KOMEFs relative to WT MEFs (Fig. 5), consistent with a pre-vious report (53), and were able to show that these cellthickness differences would substantially impact OMTCmeasurements of cell stiffness (Fig. 7 B, inset). Thus,OMTC measurements of vimentin-KO MEFs’ stiffnessmay not be reflective of the cells’ intrinsic mechanics.
Wang and Stamenovi�c (54) found that at low levels ofstrain, the stiffness of WT and vimentin-KO MEFs asmeasured using OMTC were similar to one another,whereas at higher strain levels, the stiffness of WT cells
FIGURE 5 Confocal cross-sectional representa-
tive images of typical WT (A) and vimentin-KO
(B) MEFs show that the vimentin-KO MEFs are
thinner than the WT MEFs.

FIGURE 6 Strain-energy distribution (log scale) for indentation into a cell of a sharp AFM tip (A and B), a 0.8 mm diameter rounded AFM tip (C and D),
a 10 mm diameter rounded AFM tip (E and F), and a 4.5 mm OMTC bead (G and H). The indentation is smaller in cases (A) and (B) (80 nm) because of
numerical limitations, as discussed in the Materials and Methods, than for the other AFM tips (400 nm). The OMTC bead is embedded 25% of its diameter
into the cell and twisted by a torque of 60 Pa applied in a counterclockwise fashion. (A), (C), (E), and (G) are for cases with Ecortex¼ Eintracellular; (B), (D), (F),
and (H) are for Ecortex¼ 50� Eintracellular. The cortex in each panel is the narrow region between the two horizontal black lines and has a thickness of 400 nm
before indentation. The strain-energy distribution in each panel is normalized to the maximal strain energy in that panel, and a log scale is used. Cell thickness
is 5 mm.
Probe Sensitivity to Cortical Stiffness
Please cite this article in press as: Vahabikashi et al., Probe Sensitivity to Cortical versus Intracellular Cytoskeletal Network Stiffness, Biophysical Journal(2019), https://doi.org/10.1016/j.bpj.2018.12.021
was greater than that of vimentin-KO cells. Mendez et al. re-ported similar results using AFM round tips (55), and theseinvestigators concluded that the vimentin network contrib-utes to cell stiffness when the cytoskeleton is under highlevels of strain. Our studies are consistent with this finding,showing that WT cells had a higher cell stiffness than vi-mentin-KO cells when measured with sharp AFM tips thatgenerate high levels of strain as compared with AFM roundtips and OMTC that generate much lower levels of strain(Figs. 2 and S4).
Our studies focused on examining regional differences incytoskeletal structure and how these differences affect mea-
surements of cell mechanics by external probes. We exam-ined the effect of several agents that were anticipated toaffect cellular mechanics and found that they affected thecortical regions differently than the intracellular network.RhoA regulates cytokinesis (3), causing stiffening of thecell cortex (3) and retraction of the vimentin intermediatefilament network (56–58). This is consistent with our find-ings that RhoA overexpression increases cortical cell stiff-ness and traction as measured by AFM sharp tips and TM,respectively, and somewhat reduces intracellular networkcell stiffness as measured by AFM round tips (seeFig. 2). This may also relate to our finding that a-actinin
Biophysical Journal 116, 1–12, February 5, 2019 9

FIGURE 7 (A) Eapparent/Eintracellular as a function
of Ecortex/Eintracellular for an AFM round tip of diam-
eter 0.8–10 mmwith an indentation of 400 nm. Inset
shows result for AFM sharp tip with indentation
of 80 nm. Cell thickness is 5 mm. (B) Eapparent/
Eintracellular as a function of Ecortex/Eintracellular for
an OMTC probe of diameter 4.5 mm for embedding
depths of 10, 25, or 50% of bead diameter is shown.
Cell thickness is 5 mm. Inset shows results for
an OMTC probe embedded 50% into a cell with
Ecortex/Eintracellular ¼ 50 for cell thicknesses ranging
from 2.75 to 30 mm. To see this figure in color,
go online.
Vahabikashi et al.
Please cite this article in press as: Vahabikashi et al., Probe Sensitivity to Cortical versus Intracellular Cytoskeletal Network Stiffness, Biophysical Journal(2019), https://doi.org/10.1016/j.bpj.2018.12.021
overexpression causes similar changes (59,60). These re-sults also show that overexpression of regulatory factorssuch as RhoA and a-actinin can be transduced into cellsto alter their cortical stiffness.
We also found that dexamethasone caused an increase inthe cortical stiffness of SC cells (Fig. 2 A), along withincreased density of cortical F-actin and p-myosin (Fig. 1)with little effect on the intracellular network (Fig. 2 B).Dexamethasone induces RhoA activation (61) and is associ-ated with elevated stress fiber formation in human trabecularmeshwork cells (62,63), decreased hydraulic conductivityof SC and trabecular meshwork cell monolayers (64), andincreased traction in alveolar epithelial cells (65). Thismay be related to the vasoconstriction that steroids areknown to promote (66). Corticosteroids such as dexametha-sone are widely used to offset allergies, asthma, and skinrashes, but their ocular use is known to elevate intraocularpressure in some individuals and can cause glaucoma (67).Our studies here, when considered with our previous workshowing glaucomatous SC cells to have increased stiffness(15), provide a mechanism by which dexamethasone couldcause the elevated intraocular pressure characteristic ofglaucoma.
Our AFM measurements, combined with FEM, suggestthat the stiffness of the intracellular network is roughly0.25–1 kPa (Figs. 2, B, D, F, and H and 7 A), whereas thatof the cortical cytoskeleton is at least one order of magni-tude higher (Figs. 2, A, C, E, and G and 7 A, inset). As ex-pected, both values are much higher than the reportedstiffness of cytoplasm (0.005–0.01 kPa) measured using
TABLE 1 Summary of Findings from Experimental Measurements
Technique Typical Modulusþ/Stress*
AFM sharp tip 5–20 kPaD
AFM 1.5 mm rounded tip 0.5–4 kPaD
AFM 10 mm rounded tip 0.25–1.5 kPaD
OMTC 0.5–2 kPaD
TM 0.02–0.5 kPa*
10 Biophysical Journal 116, 1–12, February 5, 2019
optical tweezers (18), and thus no conclusions can be drawnfrom our studies with respect to the cytoplasm (11). Table 1shows a summary of our findings regarding the behavior ofthe different measurement techniques on the cells consid-ered in this study. A recent report by Wu et al. (68) usingMCF-7 cells is consistent with these findings.
Our studies show that measurements of cell mechanics bydifferent external probes are differentially sensitive to regionaldifferences in cytoskeletal structure. Although stiffnessesmeasured by AFM sharp tips characterize the stiff cortical re-gion of the cells, which is under active traction, similar trendsare observed in cellular contractile force measurements byTM; this suggests that cells modulate both cortical stiffnessand traction force through a similar mechanism. In contrast,AFM round tips and OMTC are both less influenced by thecortex and instead probe the stiffness of the noncortical intra-cellular network. These interpretations are supported by ourFEM studies, which also demonstrate that probe sensitivityto cell thickness can explain theOMTC trends.Byconsideringthe regional emphasis of each probe type, our results addition-ally show that vimentin intermediate filaments play significantmechanical roles in both the intracellular and cortical domainsof cells. Taken together, these results highlight the importanceof probe choice in the interpretation of cellular mechanicsmeasurements.
SUPPORTING MATERIAL
Supporting Materials and Methods and 11 figures are available at http://
www.biophysj.org/biophysj/supplemental/S0006-3495(19)30018-9.
and FEM
Measurement Locus Sensitivity to Cell Thickness
cortical insensitive
cortical and intracellular relatively insensitive
intracellular network sensitive
cortical and intracellular sensitive
cortical not investigated

Probe Sensitivity to Cortical Stiffness
Please cite this article in press as: Vahabikashi et al., Probe Sensitivity to Cortical versus Intracellular Cytoskeletal Network Stiffness, Biophysical Journal(2019), https://doi.org/10.1016/j.bpj.2018.12.021
AUTHOR CONTRIBUTIONS
A.V., M.J., C.Y.P, K.P., W.D.S., and C.Y.P. designed the experiments. A.V.,
C.Y.P., Z.Z., E.K.D., and H.W. performed the experiments. A.V., M.J.,
C.Y.P., J.J.F., and D.A.W. designed and evaluated the model. A.V. imple-
mented the model and performed the simulations. K.P., W.D.S., and
R.D.G. supplied the cell lines. A.V., M.J., C.Y.P., J.J.F., R.D.G., K.P.,
W.D.S., D.A.W., and H.W. analyzed the data and wrote the manuscript.
ACKNOWLEDGMENTS
We acknowledge support from National Institutes of Health EY019696
(M.J., W.D.S., and J.J.F.), P01HL120839 (J.J.F. and D.A.W.),
P01GM096971 (R.D.G., D.A.W.), and U54 CA193419 (R.D.G.), North-
western University Atomic and Nanoscale Characterization Experimental
Center Center, Center for Advanced Molecular Imaging, and the National
Natural Science Foundation of China (11472062, Z.Z.).
REFERENCES
1. Wang, J., X. Liu, and Y. Zhong. 2013. Rho/Rho-associated kinasepathway in glaucoma (Review). Int. J. Oncol. 43:1357–1367.
2. Wang, S. K., and R. T. Chang. 2014. An emerging treatment option forglaucoma: Rho kinase inhibitors. Clin. Ophthalmol. 8:883–890.
3. Chircop, M. 2014. Rho GTPases as regulators of mitosis and cytoki-nesis in mammalian cells. Small GTPases. 5:e29770.
4. Lecuit, T., and P. F. Lenne. 2007. Cell surface mechanics and the con-trol of cell shape, tissue patterns and morphogenesis. Nat. Rev. Mol.Cell Biol. 8:633–644.
5. An, S. S., T. R. Bai, ., L. Wang. 2007. Airway smooth muscle dy-namics: a common pathway of airway obstruction in asthma. Eur. Re-spir. J. 29:834–860.
6. Hoffman, B. D., and J. C. Crocker. 2009. Cell mechanics: dissecting thephysical responses of cells to force.Annu.Rev. Biomed. Eng. 11:259–288.
7. Salbreux, G., G. Charras, and E. Paluch. 2012. Actin cortex mechanicsand cellular morphogenesis. Trends Cell Biol. 22:536–545.
8. Agus, D. B., J. F. Alexander, ., P. H. Wu; Physical Sciences -Oncology Centers Network. 2013. A physical sciences network charac-terization of non-tumorigenic and metastatic cells. Sci. Rep. 3:1449.
9. Stamer, W. D., S. T. Braakman,., M. Johnson. 2015. Biomechanics ofSchlemm’s canal endothelium and intraocular pressure reduction.Prog. Retin. Eye Res. 44:86–98.
10. Ratz, P. H. 2011. Mechanics of vascular smooth muscle. Compr. Phys-iol. 6:111–168.
11. Hoffman, B. D., G. Massiera, ., J. C. Crocker. 2006. The consensusmechanics of cultured mammalian cells. Proc. Natl. Acad. Sci. USA.103:10259–10264.
12. Vargas-Pinto, R., H. Gong, ., M. Johnson. 2013. The effect of theendothelial cell cortex on atomic force microscopy measurements.Biophys. J. 105:300–309.
13. Guo, M., A. J. Ehrlicher,., D. A. Weitz. 2014. Probing the stochastic,motor-driven properties of the cytoplasm using force spectrum micro-scopy. Cell. 158:822–832.
14. Zhou, E. H., R. Krishnan, ., M. Johnson. 2012. Mechanical respon-siveness of the endothelial cell of Schlemm’s canal: scope, variabilityand its potential role in controlling aqueous humour outflow. J. R. Soc.Interface. 9:1144–1155.
15. Overby, D. R., E. H. Zhou, ., M. Johnson. 2014. Altered mechanobi-ology of Schlemm’s canal endothelial cells in glaucoma. Proc. Natl.Acad. Sci. USA. 111:13876–13881.
16. Fabry, B., G. N. Maksym, ., J. J. Fredberg. 2001. Selected contribu-tion: time course and heterogeneity of contractile responses in culturedhuman airway smooth muscle cells. J. Appl. Physiol. 91:986–994.
17. Munevar, S., Y. Wang, and M. Dembo. 2001. Traction force micro-scopy of migrating normal and H-ras transformed 3T3 fibroblasts. Bio-phys. J. 80:1744–1757.
18. Guo, M., A. J. Ehrlicher, ., D. A. Weitz. 2013. The role of vimentinintermediate filaments in cortical and cytoplasmic mechanics. Biophys.J. 105:1562–1568.
19. Shabbir, S. H., M. M. Cleland, ., M. Mrksich. 2014. Geometric con-trol of vimentin intermediate filaments. Biomaterials. 35:1359–1366.
20. Mao, W., T. Tovar-Vidales, ., A. F. Clark. 2011. Perfusion-culturedbovine anterior segments as an ex vivo model for studying glucocorti-coid-induced ocular hypertension and glaucoma. Invest. Ophthalmol.Vis. Sci. 52:8068–8075.
21. Rico, F., P. Roca-Cusachs, ., D. Navajas. 2005. Probing mechanicalproperties of living cells by atomic force microscopy with bluntedpyramidal cantilever tips. Phys. Rev. E. Stat. Nonlin. Soft MatterPhys. 72:021914.
22. Stamer, W. D., K. M. Perkumas, ., B. S. McKay. 2006. Coiled-coiltargeting of myocilin to intracellular membranes. Exp. Eye Res.83:1386–1395.
23. Zhou, E. H., X. Trepat, ., J. J. Fredberg. 2009. Universal behavior ofthe osmotically compressed cell and its analogy to the colloidal glasstransition. Proc. Natl. Acad. Sci. USA. 106:10632–10637.
24. Park, C. Y., E. H. Zhou, ., R. Krishnan. 2015. High-throughputscreening for modulators of cellular contractile force. Integr. Biol(Camb). 7:1318–1324.
25. Trepat, X., M. R. Wasserman, ., J. J. Fredberg. 2009. Physical forcesduring collective cell migration. Nat. Phys. 5:426–430.
26. Butler, J. P., I. M. Toli�c-Nørrelykke, ., J. J. Fredberg. 2002. Tractionfields, moments, and strain energy that cells exert on their surround-ings. Am. J. Physiol. Cell Physiol. 282:C595–C605.
27. Mendez, M. G., S. Kojima, and R. D. Goldman. 2010. Vimentin in-duces changes in cell shape, motility, and adhesion during the epithelialto mesenchymal transition. FASEB J. 24:1838–1851.
28. Guo, M., A. F. Pegoraro, ., D. A. Weitz. 2017. Cell volume changethrough water efflux impacts cell stiffness and stem cell fate. Proc.Natl. Acad. Sci. USA. 114:E8618–E8627.
29. Laurent, V. M., S. H�enon, ., F. Gallet. 2002. Assessment of mechan-ical properties of adherent living cells by bead micromanipulation:comparison of magnetic twisting cytometry vs optical tweezers.J. Biomech. Eng. 124:408–421.
30. Park, C. Y., D. Tambe, ., J. J. Fredberg. 2010. Mapping the cytoskel-etal prestress. Am. J. Physiol. Cell Physiol. 298:C1245–C1252.
31. Cai, P., Y. Mizutani, ., T. Okajima. 2013. Quantifying cell-to-cellvariation in power-law rheology. Biophys. J. 105:1093–1102.
32. Mijailovich, S. M., M. Kojic,., J. J. Fredberg. 2002. A finite elementmodel of cell deformation during magnetic bead twisting. J. Appl.Physiol. 93:1429–1436.
33. Vahabikashi, A. 2017. Altered mechanics of Schlemm’s canal endothe-lial cells and trabecular meshwork in glaucoma. Northwestern Univer-sity, PhD thesis.
34. Harris, A. R., and G. T. Charras. 2011. Experimental validationof atomic force microscopy-based cell elasticity measurements.Nanotechnology. 22:345102.
35. Ng, L., H. H. Hung,., A. Grodzinsky. 2007. Nanomechanical proper-ties of individual chondrocytes and their developing growth factor-stimulated pericellular matrix. J. Biomech. 40:1011–1023.
36. Fabry, B., G. N. Maksym, ., J. J. Fredberg. 2001. Scaling the micro-rheology of living cells. Phys. Rev. Lett. 87:148102.
37. Zeng, D., T. Juzkiw, ., M. Johnson. 2010. Young’s modulus ofelasticity of Schlemm’s canal endothelial cells. Biomech. Model.Mechanobiol. 9:19–33.
38. Clark, A. F., D. Brotchie, ., I. Grierson. 2005. Dexamethasonealters F-actin architecture and promotes cross-linked actin network for-mation in human trabecular meshwork tissue. Cell Motil. Cytoskeleton.60:83–95.
Biophysical Journal 116, 1–12, February 5, 2019 11

Vahabikashi et al.
Please cite this article in press as: Vahabikashi et al., Probe Sensitivity to Cortical versus Intracellular Cytoskeletal Network Stiffness, Biophysical Journal(2019), https://doi.org/10.1016/j.bpj.2018.12.021
39. Bustelo, X. R., V. Sauzeau, and I. M. Berenjeno. 2007. GTP-bindingproteins of the Rho/Rac family: regulation, effectors and functionsin vivo. BioEssays. 29:356–370.
40. Otey, C. A., and O. Carpen. 2004. Alpha-actinin revisited: a fresh lookat an old player. Cell Motil. Cytoskeleton. 58:104–111.
41. Goldman, R. D., S. Khuon, ., P. M. Steinert. 1996. The function ofintermediate filaments in cell shape and cytoskeletal integrity. J. CellBiol. 134:971–983.
42. Zhong, M., W. Tian, ., J. I. Epstein. 2015. Distinguishing nested var-iants of urothelial carcinoma from benign mimickers by TERT pro-moter mutation. Am. J. Surg. Pathol. 39:127–131.
43. Fuchs, E., and D. W. Cleveland. 1998. A structural scaffolding of inter-mediate filaments in health and disease. Science. 279:514–519.
44. Coughlin, M. F., M. Puig-de-Morales,., J. J. Fredberg. 2006. Filamin-a and rheological properties of cultured melanoma cells. Biophys. J.90:2199–2205.
45. Dimitriadis, E. K., F. Horkay,., R. S. Chadwick. 2002. Determinationof elastic moduli of thin layers of soft material using the atomic forcemicroscope. Biophys. J. 82:2798–2810.
46. Charras, G. T., and M. A. Horton. 2002. Determination of cellularstrains by combined atomic force microscopy and finite elementmodeling. Biophys. J. 83:858–879.
47. Hu, S., J. Chen,., N. Wang. 2003. Intracellular stress tomography re-veals stress focusing and structural anisotropy in cytoskeleton of livingcells. Am. J. Physiol. Cell Physiol. 285:C1082–C1090.
48. Tajik, A., Y. Zhang,., N. Wang. 2016. Transcription upregulation viaforce-induced direct stretching of chromatin. Nat. Mater. 15:1287–1296.
49. Gruenbaum, Y., and U. Aebi. 2014. Intermediate filaments: a dynamicnetwork that controls cell mechanics. F1000Prime Rep. 6:54.
50. Huber, F., A. Boire, ., G. H. Koenderink. 2015. Cytoskeletal cross-talk: when three different personalities team up. Curr. Opin. CellBiol. 32:39–47.
51. Green, K. J., J. C. Talian, and R. D. Goldman. 1986. Relationship be-tween intermediate filaments and microfilaments in cultured fibro-blasts: evidence for common foci during cell spreading. Cell Motil.Cytoskeleton. 6:406–418.
52. Pesen, D., and J. H. Hoh. 2005. Micromechanical architecture of theendothelial cell cortex. Biophys. J. 88:670–679.
53. Eckes, B., D. Dogic,., T. Krieg. 1998. Impaired mechanical stability,migration and contractile capacity in vimentin-deficient fibroblasts.J. Cell Sci. 111:1897–1907.
12 Biophysical Journal 116, 1–12, February 5, 2019
54. Wang, N., and D. Stamenovi�c. 2000. Contribution of intermediate fila-ments to cell stiffness, stiffening, and growth. Am. J. Physiol. CellPhysiol. 279:C188–C194.
55. Mendez, M. G., D. Restle, and P. A. Janmey. 2014. Vimentin enhancescell elastic behavior and protects against compressive stress. Biophys.J. 107:314–323.
56. Sin, W. C., X. Q. Chen, ., L. Lim. 1998. RhoA-binding kinase alphatranslocation is facilitated by the collapse of the vimentin intermediatefilament network. Mol. Cell. Biol. 18:6325–6339.
57. Goto, H., H. Kosako,., M. Inagaki. 1998. Phosphorylation of vimen-tin by Rho-associated kinase at a unique amino-terminal site that is spe-cifically phosphorylated during cytokinesis. J. Biol. Chem. 273:11728–11736.
58. Inada, H., H. Togashi,., M. Inagaki. 1999. Balance between activitiesof Rho kinase and type 1 protein phosphatase modulates turnover ofphosphorylation and dynamics of desmin/vimentin filaments. J. Biol.Chem. 274:34932–34939.
59. Foley, K. S., and P. W. Young. 2014. The non-muscle functions of ac-tinins: an update. Biochem. J. 459:1–13.
60. Kao, H. Y. 2015. The actinin family proteins: biological function andclinical implications. Cell Biosci. 5:48.
61. Inoue, T., and H. Tanihara. 2013. Rho-associated kinase inhibitors: anovel glaucoma therapy. Prog. Retin. Eye Res. 37:1–12.
62. Clark, A. F., K. Wilson, ., W. Howe. 1994. Glucocorticoid-inducedformation of cross-linked actin networks in cultured human trabecularmeshwork cells. Invest. Ophthalmol. Vis. Sci. 35:281–294.
63. Raghunathan, V. K., J. T. Morgan,., P. Russell. 2015. Dexamethasonestiffens trabecular meshwork, trabecular meshwork cells, and matrix.Invest. Ophthalmol. Vis. Sci. 56:4447–4459.
64. Underwood, J. L., C. G. Murphy, ., J. A. Alvarado. 1999. Glucocor-ticoids regulate transendothelial fluid flow resistance and formation ofintercellular junctions. Am. J. Physiol. 277:C330–C342.
65. Puig, F., N. Gavara, ., D. Navajas. 2009. Stiffening and contractioninduced by dexamethasone in alveolar epithelial cells. Exp. Mech.49:47–55.
66. Shah, V. P., C. C. Peck, and J. P. Skelly. 1989. ‘Vasoconstriction’–skinblanching–assay for glucocorticoids–a critique. Arch. Dermatol.125:1558–1561.
67. Becker, B. 1965. Intraocular pressure response to topical corticoste-roids. Invest. Ophthalmol. 4:198–205.
68. Wu, P. H., D. R. Aroush,., D. Wirtz. 2018. A comparison of methodsto assess cell mechanical properties. Nat. Methods. 15:491–498.