rationale, evidence, and future direction - toeic.co.nz · pdf filerationale, evidence, and...
TRANSCRIPT

The Redesigned TOEIC® Test: Rationale, Evidence, and Future Direction
Listening. Learning. Leading.

Copyright © 2005 by Educational Testing Service. All rights reserved. ETS, the ETS logo, TOEFL and TOEIC are registered trademarks of Educational Testing Service.1
Th e Redesigned TOEIC® Test: Rationale, Evidence, and Future Direction
Introduction
Th e current Test of English for International Communication™ (TOEIC) test has been a valuable asset in helping companies in Japan, Korea, and elsewhere to make decisions regarding hiring, job assignments, promotion, placement in English-language training programs, and monitoring progress in those programs. In meeting these needs, the test has provided useful information about the everyday English skills of people working in an international business environment. In order to make sure that the TOEIC test continues to be the leading test of English-language profi ciency for use by international businesses, TOEIC program staff and ETS are dedicated to improving the quality of the tests so that they can better meet the needs of test users.
Part of best testing practices is to revise tests to refl ect advances and increased understanding in the fi eld or domain addressed by the test. Th is is the case for the new TOEIC test. New models of language profi ciency and communicative competence have evolved and the value of greater authenticity in language testing is clearly recognized. Th e revisions to the TOEIC test better align the test with these recent developments and acknowledgements.
In the eff ort to improve the TOEIC test, several activities have recently been undertaken, such as revising the Listening Comprehension(LC) and Reading Comprehension(RC) sections for a Spring 2006 launch and investigating possible Speaking and Writing modules that might be available at a later date. Th is brief paper is organized around the major issues most recently raised by TOEIC representatives about the redesign of the TOEIC test. Th e questions raised by this group are likely to be asked by clients before the introduction of the new TOEIC test.
Th e paper will describe the reasons a decision was reached to revise the TOEIC test; it will summarize evidence demonstrating the measurement quality of the new TOEIC test; and it will outline areas of future research on the new test.
Why is a new test being developed?
One of the primary reasons for revising the current TOEIC test is to align the test with current theories of language profi ciency. Current language theory recognizes the complexity of authentic language contexts; in these contexts it is oft en necessary for the learner to use multiple abilities and strategies in order to comprehend and connect information that is heard and read. Communication in authentic situations usually requires the simultaneous engagement of lexical, grammatical, phonetic, and pragmatic language abilities. While the existing TOEIC test includes a number of brief spoken and written text samples, it also includes some very short, single-sentence contexts that focus on discrete language abilities. Th e new TOEIC test will contain a larger proportion of authentic language contexts in both the Reading and Listening sections.

Copyright © 2005 by Educational Testing Service. All rights reserved. ETS, the ETS logo, TOEFL and TOEIC are registered trademarks of Educational Testing Service.2
Th e authentic language modifi cations in the new TOEIC test will be evidenced in the following ways:
1. Lengthening some of the listening and reading stimuli
With longer stimuli, the test will broaden the measurement of examinee abilities. An additional advantage of using longer stimuli with more questions per stimulus is that the number of diff erent topics examinees would need to process would be reduced.
2. Varying the accents in the recorded stimuli in the listening test
Because the TOEIC test is a test of international English, examinees will need to communicate with a variety of English speakers. Th erefore, the new TOEIC test will refl ect the varieties of standard English that are taught and that are spoken in the international workplace.
3. Including passage-based sentence completions
Th e new TOEIC test will include a passage format for half of the Sentence Completion items. Th is format will require examinees to demonstrate authentic interrelated language abilities more typical of the abilities necessary in the real world.
4. Including some reading sets of items based on two interrelated passages
Th e inclusion of linked reading passages in the new TOEIC test will improve the measurement of examinees’ reading abilities. Th ese linked passages will be on a related topic and might consist of two e-mail exchanges, or an advertisement and a business letter. Questions will be asked about both texts and some questions will require connecting information from both texts.
5. Reducing the number of photograph items and eliminating the error recognition items
In order to provide testing time for more authentic items, the number of photograph items will be reduced in the Listening section and error recognition items will be eliminated from the Reading section. Error recognition items test a skill that is seen as less authentic than other item types.
Although increasing the authentic nature of the test was a primary goal in revising the TOEIC test, there was another major reason for improving the test: the opportunity to incorporate evidence-centered design (ECD) principles and practices. ECD is a test-design process that begins with a discussion of the kinds of information that would be valuable to provide to test score users about the abilities examinees have, or do not have, based on their test performance. Value is defi ned in terms of the information needed to support the decisions made from the test scores. Test designers decide what information about examinee abilities is important to provide and consider what evidence would support this information and how to obtain the evidence in the test. Test items are then designed so that evidence can be collected based on examinees’ performance on the items. How examinees perform on items designed to provide specifi c evidence about their abilities is then used to characterize their performance. Using this ECD approach, performance on the test items is directly linked to evidence about language abilities. In addition to making explicit the rationale for selecting what abilities to measure, evaluating what evidence to collect about these abilities, and

Copyright © 2005 by Educational Testing Service. All rights reserved. ETS, the ETS logo, TOEFL and TOEIC are registered trademarks of Educational Testing Service.3
determining the types of items that will allow evidence to be collected, ECD also allows for an opportunity in the future to produce diagnostic profi ciency information.
With these changes, the new TOEIC test represents a positive change in English-language testing for business and industry. However, these changes are only part of an ongoing process. As ETS’s understanding of language learning grows and develops, these advances will be introduced into future ETS assessments. In this regard, the evolution and continual improvement of the new TOEIC test are part of good testing practices.
What evidence exists regarding the measurement quality of the new TOEIC test?
Although the new TOEIC test is not yet operational, some research supporting the quality of the test has already been conducted.
• Information from current and potential clients about their needs can be found in a recent survey of businesses. Th is global survey conducted by ETS in 2004 documented the need for communication skills in English in many countries, including Japan and Korea.1
• Th e foundation of improvements to the test is contained in current language theory about language acquisition. Th e current theoretical underpinnings of language profi ciency are available in the new Internet-based Test of English as a Foreign Language™(TOEFL® iBT) frameworks and other publications.2 Although the new TOEIC test is a diff erent test than TOEFL iBT, the same basic profi ciency model applies in both tests. Th e diff erences in the two arise from the diff erent contexts in which the examinees demonstrate their profi ciency.
• Th e development eff orts for the new TOEIC test involved defi ning and documenting the language constructs to be measured as well as planning multiple data-collection eff orts to evaluate what changes to test items were needed and to obtain empirical evidence of measurement quality. Th e initial phase of development involved reviewing current language-profi ciency models and identifying the language profi ciencies needed to be measured by the revised TOEIC test to ensure better alignment with these models; the intended uses and purposes of the TOEIC test served to frame the context for this initial stage of conceptualization. ECD practices formalized the process whereby test developers made explicit linkages between the test content and the profi ciency claims they intended to measure.
• Aft er the initial conceptualization, several data collection eff orts were conducted. First, prototypeitems were tried in the United States and Japan. Th e goal of these tryouts was to collect information about the reactions of test users to the new item types and to confi rm that the directions were clear enough to be used in subsequent pilot testing with large numbers of
_____________________________________________________________________________________________________________________________________________________
1 Global Survey of Business and Professional English. Prepared by Daniel Hough, ETS Business Development & Strategic Marketing Department (September 2004).2 Building a Validity Argument for the Test of English as a Foreign Language, ed. Carol Chapelle, Mary K. Enright, and Joan Jamieson (Mahwah: Lawrence Erlbaum Associates, in press).Isaac Bejar, Dan Douglas, Joan Jamieson, Susan Nissan, and Jean Turner, TOEFL 2000 Listening Framework: A Working Paper, MS-19 of TOEFL Monograph Series (Princeton: Educational Testing Service, 2000).Mary K. Enright, William Grabe, Keiko Koda, Peter Mosenthal, Patricia Mulcahy-Ernt, Mary Schedl, TOEFL 2000 Listening Framework: A Working Paper, MS-17 of TOEFL Monograph Series (Princeton: Educational Testing Service, 2000).

Copyright © 2005 by Educational Testing Service. All rights reserved. ETS, the ETS logo, TOEFL and TOEIC are registered trademarks of Educational Testing Service.4
participants. Aft er prototype testing indicated no major problems, pilot testing was conducted in Japan and Korea in February 2004. Th is tryout of two parallel test forms provided information about the diffi culty, reliability, and scaling of the new item types. Finally, fi eld testing was held in Japan and Korea in November 2004, the results of which are discussed below. Th ese development eff orts linked the theoretical concept of the test to the empirical performance of examinees on test questions.
• With the administration of two fi eld-test forms, the TOEIC program was able to evaluate the psychometric quality of the proposed design via comparison of the new test with the current test. Each examinee in the fi eld test was randomly assigned to one of two groups, and each group took one current TOEIC test form (Form A9) and one of the two new TOEIC test forms (either Form C or Form D). A total of 1958 examinees from Japan (N = 1356) and Korea (N = 602) participated in the fi eld test. A counter-balanced design was used in Japan to control for potential unwanted eff ects due to the order in which the tests, current TOEIC (A9) or new TOEIC forms (C or D), were taken. In sum, 1008 examinees and 950 examinees — across Japan and Korea —took new TOEIC Forms C and D, respectively, along with the current TOEIC form (A9).
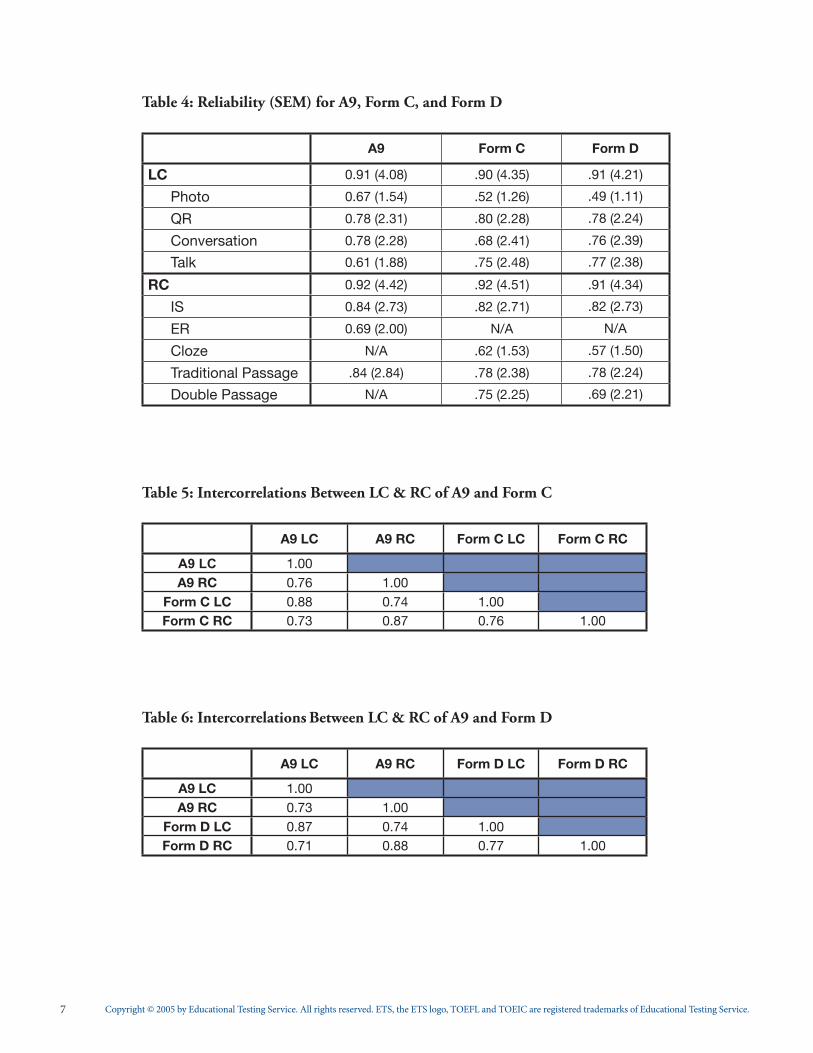
• Descriptive statistics for various examinee samples are contained in Tables 1–2 in the Appendix and the means for each section on each form are shown in Table 3. Evaluation of the results show that, for the most part, the psychometric quality of the new TOEIC test is comparable to that of the current TOEIC test. Specifi cally, the tests are similarly reliable and meet a standard of reliability appropriate for high-stakes decisions (see Table 4). Th e two tests measure the same major constructs, as shown in the correlations between the tests (see Tables 5–6). In addition, the new TOEIC test is not speeded (see Table 7). However, there is evidence that the Listening Comprehension section of the new TOEIC test is more diffi cult than the existing TOEIC Listening Comprehension section (see Tables 8 –10) whereas Reading Comprehension performance on the two fi eld test forms is similar to the operational test (see Tables 11–13). Th e diffi culty level of the new TOEIC LC will need to be brought more in line with that of the current Listening Comprehension section to maintain the same reporting scale.
• In addition to providing psychometric information, fi eld test results enabled analyses to be made of the ECD claims associated with the test items. Th ese results demonstrated an appropriate reliability level for the claims (see Tables 14 –15).3
_____________________________________________________________________________________________________________________________________________________
3 The initial analyses of the claims found that the reliabilities of some claims were too low due to an insuffi cient number of items in the claims. The ETS Content Team then combined some of the claims by grouping together items measuring the similar underlying abilities.
Copyright © 2005 by Educational Testing Service. All rights reserved. ETS, the ETS logo, TOEFL and TOEIC are registered trademarks of Educational Testing Service.5
What other types of research are planned for the new TOEIC test?
Although some information documenting the validity and reliability of the new TOEIC test has been collected, the TOEIC program anticipates conducting additional analyses and studies. In these eff orts, consultation and feedback from the representatives will be a valuable part of the planning process. Some of the anticipated activities include:
• A factor analysis of fi eld-test data to verify the construct validity (underlying structure) of the test.
• Additional analyses of fi eld-test data to examine if the new TOEIC test rank orders candidates in the same order as the current TOEIC test. Th is will help to establish the construct validity of the new test.
• Additional analyses of fi eld-test data to determine if the new TOEIC test is a more eff ective diff erentiator of English-language profi ciency than the current test, and at what points on the reporting scale this occurs.
• Studies to collect information from industries in Japan and Korea to address the authenticity (occupational relevance or relatedness) of the tasks/item contexts of the new TOEIC test.
• Studies to verify the fairness of the new test.
• Studies to collect information supporting the purported intended uses of the test scores, such as placement and progress in English-language learning classes and hiring and promoting employees.
Summary
Based on current theories of language profi ciency, existing evidence, and the plan for additional future research, ETS is focused on providing improvements that will ensure that the test is even more helpful to the test users.

Copyright © 2005 by Educational Testing Service. All rights reserved. ETS, the ETS logo, TOEFL and TOEIC are registered trademarks of Educational Testing Service.6
Table 1: LC - A9 Descriptive Statistics by Various Samples
Statistics KOR_CD KOR_C KOR_D JPN_CD JPN_C JPN_D C D
N 602 312 290 1,356 696 660 1,008 950Mean 69.4 68.2 70.7 69.6 69.4 69.9 69.0 70.1
SD 12.2 12.1 12.2 13.8 14.1 13.5 13.5 13.1Min 35 35 41 20 20 25 20 25Max 97 97 96 99 99 98 99 98
Table 2: RC - A9 Descriptive Statistics by Various Samples
Statistics KOR_CD KOR_C KOR_D JPN_CD JPN_C JPN_D C D
N 602 312 290 1,356 696 660 1,008 950Mean 61.4 60.5 62.5 56.5 56.4 56.6 57.6 58.4
SD 13.8 14.1 13.5 15.7 15.7 15.6 15.3 15.2Min 29 29 34 7 7 16 7 16Max 94 93 94 99 97 99 97 99
Table 3: Mean (SD) of LC and RC for Form C and Form D
Form C Form D
N=1008 N=950
LC 56.5 (14.0) 62.9 (14.1)RC 56.6 (15.5) 59.0 (14.5)
Appendix
Copyright © 2005 by Educational Testing Service. All rights reserved. ETS, the ETS logo, TOEFL and TOEIC are registered trademarks of Educational Testing Service.7
Table 4: Reliability (SEM) for A9, Form C, and Form D
A9 Form C Form D
LC 0.91 (4.08) .90 (4.35) .91 (4.21)
Photo 0.67 (1.54) .52 (1.26) .49 (1.11)
QR 0.78 (2.31) .80 (2.28) .78 (2.24)
Conversation 0.78 (2.28) .68 (2.41) .76 (2.39)
Talk 0.61 (1.88) .75 (2.48) .77 (2.38)
RC 0.92 (4.42) .92 (4.51) .91 (4.34)
IS 0.84 (2.73) .82 (2.71) .82 (2.73)
ER 0.69 (2.00) N/A N/A
Cloze N/A .62 (1.53) .57 (1.50)
Traditional Passage .84 (2.84) .78 (2.38) .78 (2.24)
Double Passage N/A .75 (2.25) .69 (2.21)
Table 5: Intercorrelations Between LC & RC of A9 and Form C
A9 LC A9 RC Form C LC Form C RC
A9 LC 1.00 A9 RC 0.76 1.00
Form C LC 0.88 0.74 1.00 Form C RC 0.73 0.87 0.76 1.00
Table 6: Intercorrelations Between LC & RC of A9 and Form D
A9 LC A9 RC Form D LC Form D RC
A9 LC 1.00 A9 RC 0.73 1.00
Form D LC 0.87 0.74 1.00 Form D RC 0.71 0.88 0.77 1.00

Copyright © 2005 by Educational Testing Service. All rights reserved. ETS, the ETS logo, TOEFL and TOEIC are registered trademarks of Educational Testing Service.8
Table 7: Speededness Data for Reading Comprehension*
4AIC9 FORM C FORM D
Item # % Reached % Reached % Reached101 100 100 100
: : : :105 100 100 100
: : : :: : : :
145 100 100 100: : : :
150 100 100 100: : : :
155 100 99.9 100: : : :
160 100 99.8 99.8: : : :
165 99.9 99.4 99.7: : : :
170 99.7 98.5 99.6: : : :
175 99.5 97.4 99.1: : : :
180 99.1 96.2 98.1: : : :
185 98.2 95.1 97.1: : : :
190 97.3 92.8 94.2: : : :
195 96.5 89.3 91.6: : : :
200 95.3 84.7 88.2 # of Candidates 1958 1008 950 % Reaching all items 95.3 84.7 88.2 % Reaching 75% of items 99.5 97.4 99.1 # of Items Reached by 80% 100 100 100 # of Items 100 100 100 Ratio of N.R Variance/Total Variance 0.05 0.18 0.12
* Criteria frequently used in judging speededness include: a) percentage of examinees completing the whole section, b) percentage of examinees completing 75 percent of the section, c) number of items reached by 80 percent of the examinees, and d) ratio of the not reached variance to the total score variance (i.e., the speededness index). No one criterion should be used alone. As a rule of thumb, a test is essentially unspeeeded if at least 80 percent of the test takers reach the last question and if everyone reaches 75% of the items. Furthermore, a speededness index less than .15 indicates an unspeeded test, while an index greater than .25 indicates a speeded test. Values between .16 and .25 generally indicate a moderately speeded test. Note that lack of motivation in examinees may make the test appear more speeded than it actually is.

Copyright © 2005 by Educational Testing Service. All rights reserved. ETS, the ETS logo, TOEFL and TOEIC are registered trademarks of Educational Testing Service.9
Table 8: LC Item Statistics of A9
A9 Avg. Item Diffi culty Mean Delta Mean R-Bis
# of Items 100 100 100 Mean 0.70 10.6 0.43 SD 0.17 2.30 0.13 Min - Max 0.23 - 0.99 5.9 - 16.0 -0.01 - 0.66 75th % 0.84 12.3 0.53 Median 0.69 11.0 0.45 25th % 0.57 9.0 0.35
Table 9: LC Item Statistics of Form C
Form C Avg. Item Diffi culty Mean Delta Mean R-Bis
# of Items 100 100 100 Mean 0.57 12.2 0.42 SD 0.20 2.40 0.15 Min - Max 0.14 - 0.97 5.9 - 17.3 -0.05 - 0.70 75th % 0.73 13.8 0.52 Median 0.56 12.5 0.43 25th % 0.42 10.4 0.32
Table 10: LC Item Statistics of Form D
Form D Avg. Item Diffi culty Mean Delta Mean R-Bis
# of Items 100 100 100 Mean 0.63 11.4 0.44 SD 0.20 2.4 0.13 Min - Max 0.10 - 0.96 6.0 - 18.1 0.07 - 0.71 75th % 0.81 13.3 0.53 Median 0.62 11.8 0.46 25th % 0.47 9.6 0.35

Copyright © 2005 by Educational Testing Service. All rights reserved. ETS, the ETS logo, TOEFL and TOEIC are registered trademarks of Educational Testing Service.10
Table 11: RC Item Statistics of A9
A9 Avg. Item Diffi culty Mean Delta Mean R-Bis
# of Items 100 100 100 Mean 0.58 12.0 0.43 SD 0.18 2.10 0.12 Min - Max 0.19 - 0.97 5.9 - 16.5 0.00 - 0.70 75th % 0.76 13.8 0.52 Median 0.59 12.2 0.44 25th % 0.42 10.3 0.38
Table 12: RC Item Statistics of Form C
Form C Avg. Item Diffi culty Mean Delta Mean R-Bis
# of Items 100 100 100 Mean 0.58 12.1 0.43 SD 0.18 2.0 0.13 Min - Max 0.20 - 0.93 7.1 - 16.4 -0.08 - 0.67 75th % 0.73 13.7 0.51 Median 0.58 12.2 0.42 25th % 0.43 10.5 0.36
Table 13: RC Item Statistics of Form D
Form D Avg. Item Diffi culty Mean Delta Mean R-Bis
# of Items 100 100 100 Mean 0.60 11.9 0.42 SD 0.19 2.2 0.14 Min - Max 0.18 - 0.98 5.9 - 16.7 -0.08 - 0.71 75th % 0.74 13.5 0.52 Median 0.61 12.0 0.42 25th % 0.45 10.4 0.33

Copyright © 2005 by Educational Testing Service. All rights reserved. ETS, the ETS logo, TOEFL and TOEIC are registered trademarks of Educational Testing Service.11
Table 14: Descriptive Statistics of ECD Claims – Form C
Form CLC RC
Claim 1 Claim 2 Claim 3 Claim 4 Claim 1_6 Claim 2_3 Claim 4_10 Claim 7 Claim 8
# of items 19 18 21 42 31 18 13 29 25
Mean 12.6 10.4 13.8 19.8 17.3 9.0 6.4 15.9 16.0
% Mean 0.66 0.58 0.66 0.47 0.56 0.50 0.49 0.55 0.64
SD 3.63 2.99 3.30 6.15 5.57 3.40 2.84 5.11 4.12
Min - Max 2 - 19 2 - 18 0 - 21 6 - 39 0 - 31 0 - 18 0 - 13 3 - 28 4 - 25
Reliability 0.75 0.63 0.68 0.77 0.82 0.69 0.67 0.78 0.75
Est. Reliability 0.63 0.62 0.65 0.79 0.74 0.62 0.54 0.72 0.69
Table 15: Descriptive Statistics of ECD Claims – Form D
Form DLC RC
Claim 1 Claim 2 Claim 3 Claim 4 Claim 1_6 Claim 2_3 Claim 4_10 Claim 7 Claim 8
# of items 20 18 20 42 27 16 14 27 26
Mean 12.2 11.5 14.5 24.7 17.3 7.5 6.7 16.0 16.5
% Mean 0.61 0.64 0.72 0.59 0.64 0.47 0.48 0.59 0.63
SD 3.46 2.83 2.91 6.93 4.45 3.03 2.83 4.66 4.15
Min - Max 2 - 20 3 - 18 4 - 20 8 - 42 1 - 27 0 - 15 0 - 14 2 - 27 5 - 26
Reliability 0.70 0.60 0.69 0.83 0.76 0.64 0.64 0.78 0.74
Est. Reliability 0.64 0.62 0.64 0.79 0.71 0.59 0.56 0.71 0.70