ray-tracing urban picocell 3d propagation statistics for ... · ray-tracing urban picocell 3d...
TRANSCRIPT

Ray-Tracing Urban Picocell 3D Propagation Statistics for LTE Heterogeneous Networks
Evangelos Mellios, Geoffrey S. Hilton and Andrew R. Nix Centre for Communications Research, University of Bristol, United Kingdom
Abstract — This paper combines measured 3-Dimensional (3D) basestation (BS) and user handheld antenna radiation patterns with a state-of-the-art 3D ray-tracing software tool in order to derive a set of urban 3D picocell propagation statistics suitable for Long Term Evolution (LTE) Heterogeneous Network (HetNet) planning. Results are presented as Cumulative Distribution Functions (CDFs) and as a function of distance from the BS. Best-fit normal and lognormal distribution parameters are also presented.
I. INTRODUCTION Wireless data traffic demands in cellular networks are
growing rapidly and significant improvements are now required in spectral efficiency. As illustrated in Figure 1, mobile data traffic for laptops, mobile phones and tablets is expected to grow at a Compound Annual Growth Rate (CAGR) of 92% from 2010 to 2015, reaching 6.3 Exabytes per month by 2015 [1].
Figure 1. The global mobile traffic forecast [1].
One solution is to complement the traditional Long Term
Evolution (LTE) macrocell basestations (BSs), which provide basic coverage, with a number of lower power picocell basestations in areas of high data traffic demands, thereby creating a Heterogeneous Network (HetNet) [2]. Figure 2 shows a schematic description of a HetNet topology.
In order to achieve high capacities in an LTE HetNet, the propagation statistics have to be carefully considered. These include the impact of the wireless channel, the BS and the user equipment (UE) antennas. Urban macrocell 3-Dimensional
(3D) propagation statistics have been presented in [3]. However, propagation in picocells is very different to macrocells and we therefore need accurate statistics in order to design efficient picocellular networks.
Figure 2. Heterogeneous network topology utilising a mix of a high
power macrocell basestation and lower power picocells
This paper combines measured 3D BS and user handheld antenna radiation patterns with a state-of-the-art 3D ray-tracing software tool in order to derive a set of urban 3D picocell propagation statistics suitable for LTE HetNet planning. The rest of the paper is organised as follows. Section II describes the system modelling parameters and Section III presents the results as Cumulative Distribution Functions (CDFs). Best-fit normal and lognormal distribution parameters are also derived. Section IV demonstrates the propagation statistics as a function of the distance from the BS and Section V concludes the paper.
.
II. SYSTEM MODELLING PARAMETERS The radiation patterns of two picocell BS antennas (a
patch in slant polarisation and a vertical dipole) and a UE antenna (a common mobile phone) were measured in an anechoic chamber. All patterns are 3D and include full power, phase, and polarisation information. Figure 3 shows the antennas and the measured total power radiation patterns. Table I specifies the pattern statistics. In order to evaluate the random user handset orientation sensitivity, the UE is tilted in elevation (x-z plane) at 0ο, 45ο, and 90ο. For each case it is then rotated in azimuth (x-y plane) through 360ο in steps of 90ο, resulting in 12 different UE orientations in total. It has been shown in [4] that the user handset rotation has significant impact on the propagation statistics.
978-88-907018-3-2/13 ©2013 IEEE
2013 7th European Conference on Antennas and Propagation (EuCAP)
4015

(a) Pico BS (dipole) (b) Pico BS (patch) (c) UE handset
Figure 3. Measured antennas and total power radiation patterns
.
TABLE I. ANTENNA RADIATION PATTERN STATISTICS
Antenna Power in each
polarisation (%) Maximum directivity in each polarisation (dBi)
Vertical Horizontal Vertical Horizontal Pico BS (dipole) 90 10 5.0 -11.4 Pico BS (patch) 40 60 7.0 5.9
UE handset 43 56 6.8 6.3
The propagation channel between each BS and UE is modelled as the spatial convolution of the polarmetric antenna patterns with the spatial and temporal multipath ray components from a 3D outdoor ray-tracer [5]. The ray-tracing engine identifies all possible ray paths between the transmitter and the receiver in 3D space. The database includes terrain, buildings and foliage.
Two different urban environments have been studied; a 17.6 km2 area in the city centre of Bristol, UK, and a 143 km2 area in the centre of London, UK. A large number of picocell BSs and users were randomly scattered in both cities (30,000 BS-user links in total for each one of the two cities). The users were all located within a radius of 150m from the associated BS at a height of 1.5m above ground level. Two different picocell BS antenna mounting options were modelled; on external walls of buildings and on lamp-posts, at a height of 5m above ground level in both cases. As mentioned in the previous section, two different picocell BS antenna types were considered; directional patch antennas that illuminate a sector and omnidirectional dipoles that illuminate a circular area around the BS. The omnidirectional dipoles were used only for the BSs mounted at lamp-post height. It should be noted that all users were located within the pico BS antenna 3dB beamwidth. All analysis was performed at 2.6GHz with a transmit power of 30dBm. Figure 4 shows some examples of picocells in Bristol. Figure 5 demonstrates an example of a coverage map (based on received signal strength at the user) for a picocell BS mounted on the side of a building and employing a directional patch antenna. Table II summarises the system modelling parameters.
Figure 4. Picocell examples in Bristol.
Figure 5. Coverage map example of a picocell basestation mounted on the
external wall of a building employing a directional patch antenna.
TABLE II. RAY-TRACING SYSTEM MODELLING PARAMETERS
BS mounting On external walls of buildings and on lamp-posts
BS antenna type Wall: Patch
Lamp-post: Patch / Dipole Number of BSs
and users Patch: 600 BSs (50 users per BS)
Dipole: 200 BSs (150 users per BS)
User locations 5-150m from BS within the BS antenna 3dB
beamwidth (within a sector for the patch, within a circular area around the BS for the dipole)
Frequency 2.6GHz BS transmit
power 30dBm
BS / User height 5m / 1.5m above ground level
III. PROPAGATION STATISTICS This section presents the propagation statistics as CDFs,
together with best-fit normal and lognormal distribution parameters. Figures 6 and 7 illustrate the CDFs of the
2013 7th European Conference on Antennas and Propagation (EuCAP)
4016
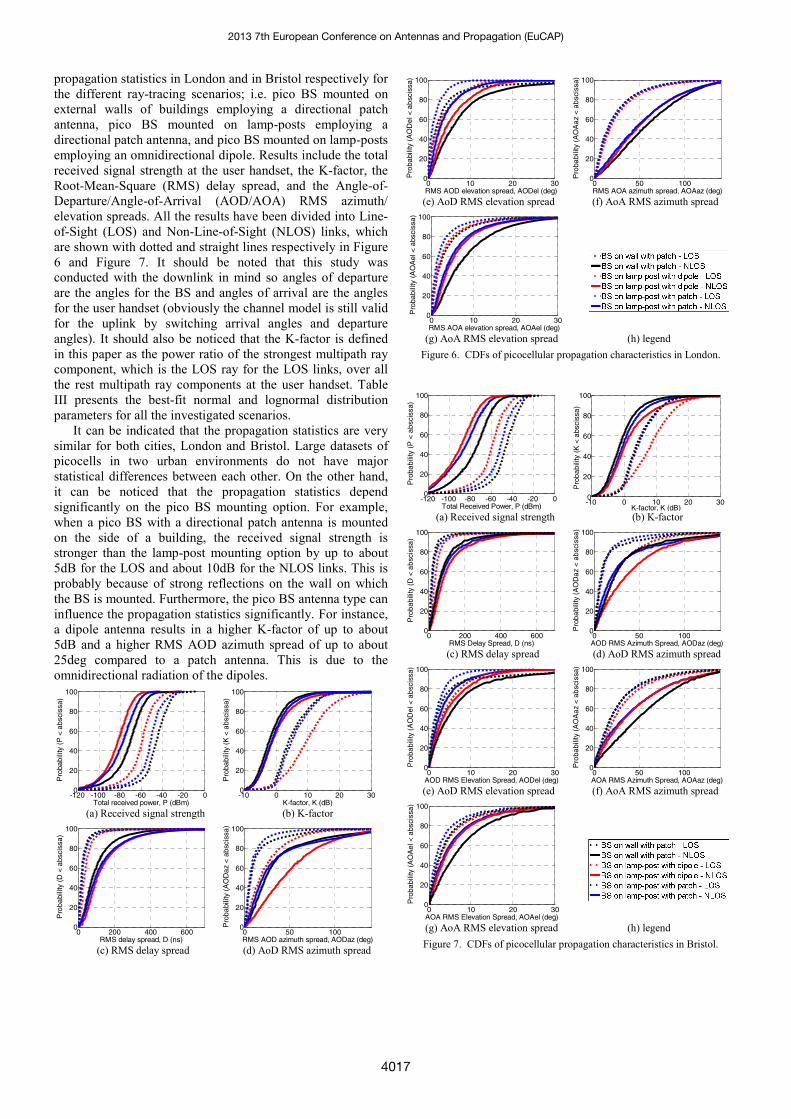
propagation statistics in London and in Bristol respectively for the different ray-tracing scenarios; i.e. pico BS mounted on external walls of buildings employing a directional patch antenna, pico BS mounted on lamp-posts employing a directional patch antenna, and pico BS mounted on lamp-posts employing an omnidirectional dipole. Results include the total received signal strength at the user handset, the K-factor, the Root-Mean-Square (RMS) delay spread, and the Angle-of-Departure/Angle-of-Arrival (AOD/AOA) RMS azimuth/ elevation spreads. All the results have been divided into Line-of-Sight (LOS) and Non-Line-of-Sight (NLOS) links, which are shown with dotted and straight lines respectively in Figure 6 and Figure 7. It should be noted that this study was conducted with the downlink in mind so angles of departure are the angles for the BS and angles of arrival are the angles for the user handset (obviously the channel model is still valid for the uplink by switching arrival angles and departure angles). It should also be noticed that the K-factor is defined in this paper as the power ratio of the strongest multipath ray component, which is the LOS ray for the LOS links, over all the rest multipath ray components at the user handset. Table III presents the best-fit normal and lognormal distribution parameters for all the investigated scenarios.
It can be indicated that the propagation statistics are very similar for both cities, London and Bristol. Large datasets of picocells in two urban environments do not have major statistical differences between each other. On the other hand, it can be noticed that the propagation statistics depend significantly on the pico BS mounting option. For example, when a pico BS with a directional patch antenna is mounted on the side of a building, the received signal strength is stronger than the lamp-post mounting option by up to about 5dB for the LOS and about 10dB for the NLOS links. This is probably because of strong reflections on the wall on which the BS is mounted. Furthermore, the pico BS antenna type can influence the propagation statistics significantly. For instance, a dipole antenna results in a higher K-factor of up to about 5dB and a higher RMS AOD azimuth spread of up to about 25deg compared to a patch antenna. This is due to the omnidirectional radiation of the dipoles.
-120 -100 -80 -60 -40 -20 00
20
40
60
80
100
Total received power, P (dBm)
Pro
babi
lity
(P <
abs
ciss
a)
-10 0 10 20 300
20
40
60
80
100
K-factor, K (dB)
Pro
babi
lity
(K <
abs
ciss
a)
(a) Received signal strength (b) K-factor
0 200 400 6000
20
40
60
80
100
RMS delay spread, D (ns)
Pro
babi
lity
(D <
abs
ciss
a)
0 50 1000
20
40
60
80
100
RMS AOD azimuth spread, AODaz (deg)
Pro
babi
lity
(AO
Daz
< a
bsci
ssa)
(c) RMS delay spread (d) AoD RMS azimuth spread
0 10 20 300
20
40
60
80
100
RMS AOD elevation spread, AODel (deg)
Pro
babi
lity
(AO
Del
< a
bsci
ssa)
0 50 1000
20
40
60
80
100
RMS AOA azimuth spread, AOAaz (deg)
Pro
babi
lity
(AO
Aaz
< a
bsci
ssa)
(e) AoD RMS elevation spread (f) AoA RMS azimuth spread
0 10 20 30
0
20
40
60
80
100
RMS AOA elevation spread, AOAel (deg)
Pro
babi
lity
(AO
Ael
< a
bsci
ssa)
(g) AoA RMS elevation spread (h) legend
Figure 6. CDFs of picocellular propagation characteristics in London.
-120 -100 -80 -60 -40 -20 00
20
40
60
80
100
Total Received Power, P (dBm)
Pro
babi
lity
(P <
abs
ciss
a)
-10 0 10 20 300
20
40
60
80
100
K-factor, K (dB)
Pro
babi
lity
(K <
abs
ciss
a)
(a) Received signal strength (b) K-factor
0 200 400 6000
20
40
60
80
100
RMS Delay Spread, D (ns)
Pro
babi
lity
(D <
abs
ciss
a)
0 50 1000
20
40
60
80
100
AOD RMS Azimuth Spread, AODaz (deg)
Pro
babi
lity
(AO
Daz
< a
bsci
ssa)
(c) RMS delay spread (d) AoD RMS azimuth spread
0 10 20 300
20
40
60
80
100
AOD RMS Elevation Spread, AODel (deg)
Pro
babi
lity
(AO
Del
< a
bsci
ssa)
0 50 1000
20
40
60
80
100
AOA RMS Azimuth Spread, AOAaz (deg)
Pro
babi
lity
(AO
Aaz
< a
bsci
ssa)
(e) AoD RMS elevation spread (f) AoA RMS azimuth spread
0 10 20 300
20
40
60
80
100
AOA RMS Elevation Spread, AOAel (deg)
Pro
babi
lity
(AO
Ael
< a
bsci
ssa)
(g) AoA RMS elevation spread (h) legend
Figure 7. CDFs of picocellular propagation characteristics in Bristol.
2013 7th European Conference on Antennas and Propagation (EuCAP)
4017

TABLE III. BEST-FIT NORMAL AND LOGNORMAL PROPAGATION STATISTICS IN LONDON / BRISTOL
BS on wall with patch BS on lamp-post with dipole BS on lamp-post with patch
LOS NLOS LOS NLOS LOS NLOS
Path loss equation 25log10d+34 / 26log10d+34
25log10d+55 / 29log10d+51
27log10d+41 / 29log10d+39
32log10d+50 / 39log10d+42
27log10d+33 / 28log10d+33
29log10d+51 / 37log10d+41
Shadowing [dB] μ 0 / 0 0 / 0 0 / 0 0 / 0 0 / 0 0 / 0
σ 9.04 / 9.67 13.88 / 15.80 11.13 / 11.62 12.47 / 15.23 10.41 / 11.28 14.06 / 16.95
K-factor [dB] μ 5.14 / 4.89 -1.40 / -0.54 9.96 / 8.36 0.07 / 2.06 5.84 / 5.20 -0.52 / 0.59
σ 5.15 / 5.19 4.84 / 5.12 7.20 / 6.89 6.08 / 7.33 5.09 / 5.15 5.11 / 5.83
RMS delay spread log10[s] μ -7.74 / -7.79 -7.12 / -7.26 -7.51 / -7.47 -6.97 / -7.12 -7.71 / -7.69 -7.05 / -7.26
σ 0.44 / 0.47 0.41 / 0.47 0.43 / 0.36 0.36 / 0.49 0.49 / 0.43 0.45 / 0.61
RMS AOD azimuth spread log10[ο] μ 0.84 / 0.82 1.34 / 1.24 1.16 / 1.25 1.55 / 1.38 0.75 / 0.85 1.29 / 1.14
σ 0.53 / 0.57 0.48 / 0.55 0.52 / 0.45 0.42 / 0.58 0.53 / 0.49 0.52 / 0.69
RMS AOD elevation spread log10[ο] μ 0.21 / 0.21 0.67 / 0.53 0.23 / 0.38 0.56 / 0.45 -0.06 / 0.10 0.38 / 0.26
σ 0.65 / 0.68 0.52 / 0.65 0.63 / 0.55 0.46 / 0.58 0.61 / 0.55 0.53 / 0.70
RMS AOA azimuth spread log10[ο] μ 1.14 / 1.19 1.62 / 1.52 1.18 / 1.30 1.56 / 1.37 1.11 / 1.20 1.50 / 1.27
σ 0.50 / 0.56 0.47 / 0.58 0.49 / 0.46 0.64 / 0.90 0.55 / 0.53 0.81 / 1.01
RMS AOA elevation spread log10[ο] μ 0.26 / 0.33 0.74 / 0.67 0.22 / 0.41 0.59 / 0.51 0.06 / 0.24 0.50 / 0.40
σ 0.57 / 0.62 0.48 / 0.59 0.57 / 0.54 0.62 / 0.92 0.59 / 0.58 0.75 / 0.97
Probability of LOS 57% / 50% 55% / 41% 54% / 41%
IV. ANALYSIS OF PROPAGATION STATISTICS AS A FUNCTION OF DISTANCE FROM BASESTATION
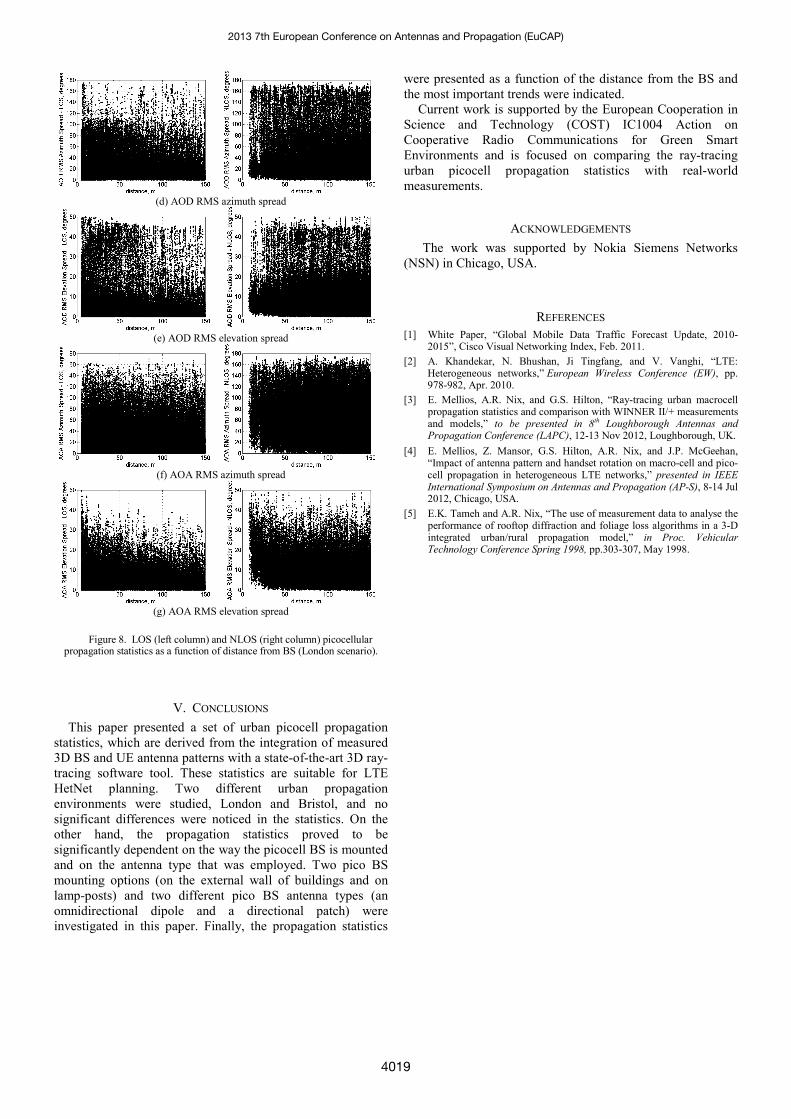
This section analyses the ray-tracing propagation statistics as a function of the distance from the BS. Figure 8 presents the propagation statistics in London for pico BSs mounted on the external wall of buildings. The results are divided into LOS (left column) and NLOS (right column) links. The propagation statistics in Bristol and for different pico BS mounting options and antenna types follow similar trends but are not presented here due to the size restriction of this paper.
As expected, the received signal strength decays with distance and the shadowing is greater for the NLOS links. The K-factor seems to be higher in the first 20m and then distance-independent for the LOS links, and increases with distance for the NLOS cases. The RMS delay spread increases with distance and is higher for the NLOS links. The AOD RMS azimuth and elevation spreads for the LOS links decrease as the UE moves away from the BS, while they both increase with distance for the NLOS links. The AOA RMS azimuth spread decreases slightly with distance for both the LOS and the NLOS links, whereas the AOA RMS elevation spread seems to follow an exponentially decay with distance trend for both LOS and NLOS cases.
(a) Total received power at UE
(b) K-factor
(c) RMS delay spread
2013 7th European Conference on Antennas and Propagation (EuCAP)
4018
(d) AOD RMS azimuth spread
(e) AOD RMS elevation spread
(f) AOA RMS azimuth spread
(g) AOA RMS elevation spread
Figure 8. LOS (left column) and NLOS (right column) picocellular
propagation statistics as a function of distance from BS (London scenario).
V. CONCLUSIONS This paper presented a set of urban picocell propagation
statistics, which are derived from the integration of measured 3D BS and UE antenna patterns with a state-of-the-art 3D ray-tracing software tool. These statistics are suitable for LTE HetNet planning. Two different urban propagation environments were studied, London and Bristol, and no significant differences were noticed in the statistics. On the other hand, the propagation statistics proved to be significantly dependent on the way the picocell BS is mounted and on the antenna type that was employed. Two pico BS mounting options (on the external wall of buildings and on lamp-posts) and two different pico BS antenna types (an omnidirectional dipole and a directional patch) were investigated in this paper. Finally, the propagation statistics
were presented as a function of the distance from the BS and the most important trends were indicated.
Current work is supported by the European Cooperation in Science and Technology (COST) IC1004 Action on Cooperative Radio Communications for Green Smart Environments and is focused on comparing the ray-tracing urban picocell propagation statistics with real-world measurements.
ACKNOWLEDGEMENTS The work was supported by Nokia Siemens Networks
(NSN) in Chicago, USA.
REFERENCES [1] White Paper, “Global Mobile Data Traffic Forecast Update, 2010-
2015”, Cisco Visual Networking Index, Feb. 2011. [2] A. Khandekar, N. Bhushan, Ji Tingfang, and V. Vanghi, “LTE:
Heterogeneous networks,” European Wireless Conference (EW), pp. 978-982, Apr. 2010.
[3] E. Mellios, A.R. Nix, and G.S. Hilton, “Ray-tracing urban macrocell propagation statistics and comparison with WINNER II/+ measurements and models,” to be presented in 8th Loughborough Antennas and Propagation Conference (LAPC), 12-13 Nov 2012, Loughborough, UK.
[4] E. Mellios, Z. Mansor, G.S. Hilton, A.R. Nix, and J.P. McGeehan, “Impact of antenna pattern and handset rotation on macro-cell and pico-cell propagation in heterogeneous LTE networks,” presented in IEEE International Symposium on Antennas and Propagation (AP-S), 8-14 Jul 2012, Chicago, USA.
[5] E.K. Tameh and A.R. Nix, “The use of measurement data to analyse the performance of rooftop diffraction and foliage loss algorithms in a 3-D integrated urban/rural propagation model,” in Proc. Vehicular Technology Conference Spring 1998, pp.303-307, May 1998.
2013 7th European Conference on Antennas and Propagation (EuCAP)
4019