re-examination of the psychometric properties of...
TRANSCRIPT

Re-examination of the Psychometric Properties of the
Preschool Wide Evaluation Tool(Steed & Pomerleau, 2012)
Sharon Bohjanen
Jennifer Catalano
University of Arizona

Where we began
• Early childhood environments that support the development of social skills

PBS in Early Childhood
The Teaching Pyramid: A model for promoting children’s social emotional development and preventing challenging behavior. Center on the Social and Emotional Foundations for Early Learning (2008).

Background
The Preschool Wide Evaluation Tool (Steed, Pomerleau, & Horner, 2008)
Manual (Pre-SET; Steed & Pomerleau, 2012)
• Positive Behavior Intervention Support (PBIS)
– nurturing and responsive relationships
– high quality supportive environments

Studies that used the Pre-SET
• Benedict, Horner and Squires (2007)– Teacher implementation of defined teaching
strategies
– Student problem behavior
• Carter and Van Norman (2011)– Teacher implementation of defined teaching
strategies
– Student engagement
• Steed and Pomerleau (2012)– Steed and Webb (2013)

Benedict, Horner and Squires (2007)Teachers Students

Carter and Van Norman (2011)
Teachers Students
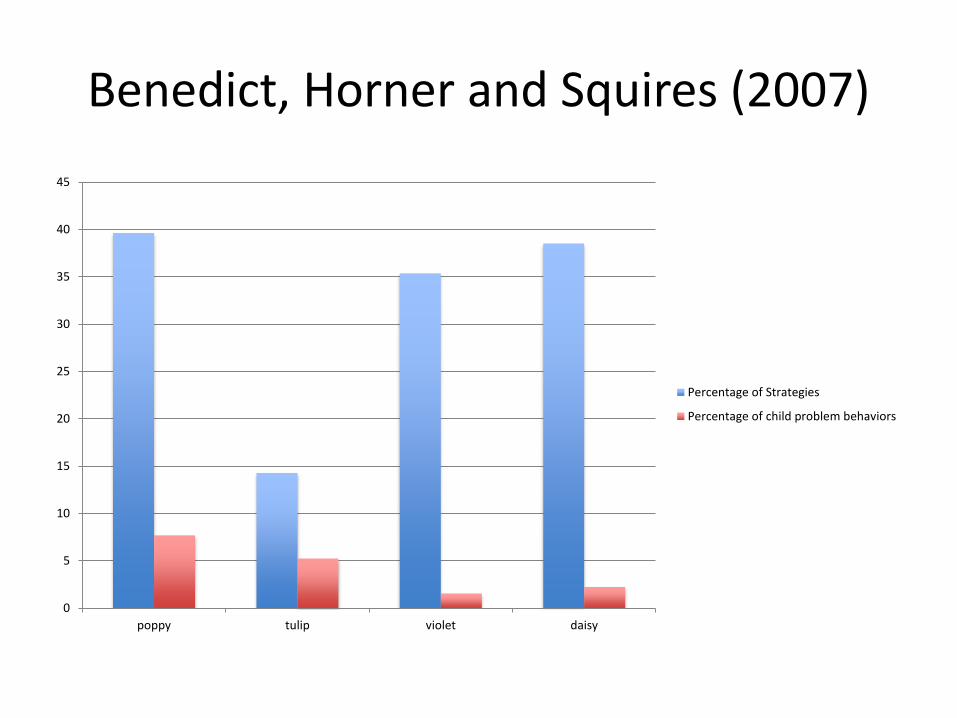
Benedict, Horner and Squires (2007)
0
5
10
15
20
25
30
35
40
45
poppy tulip violet daisy
Percentage of Strategies
Percentage of child problem behaviors

Carter and Van Norman (2011)
0
20
40
60
80
100
120
red blue green yellow
Percentage of strategies
Percentage of children engaged

Personal Use of the Pre-SET
• Several subscales troublesome
– Organized and predictable environment
– Behavioral expectations taught
– Responses to appropriate behavior

the Pre-SET

Start by Examining the SET

SET Sub-scales to measure SW-PBIS
• 7 subscales with 28 items
– expectations defined
– expectations taught
– acknowledgement procedures
– correction procedures
– monitoring and evaluation
– management
– district level support
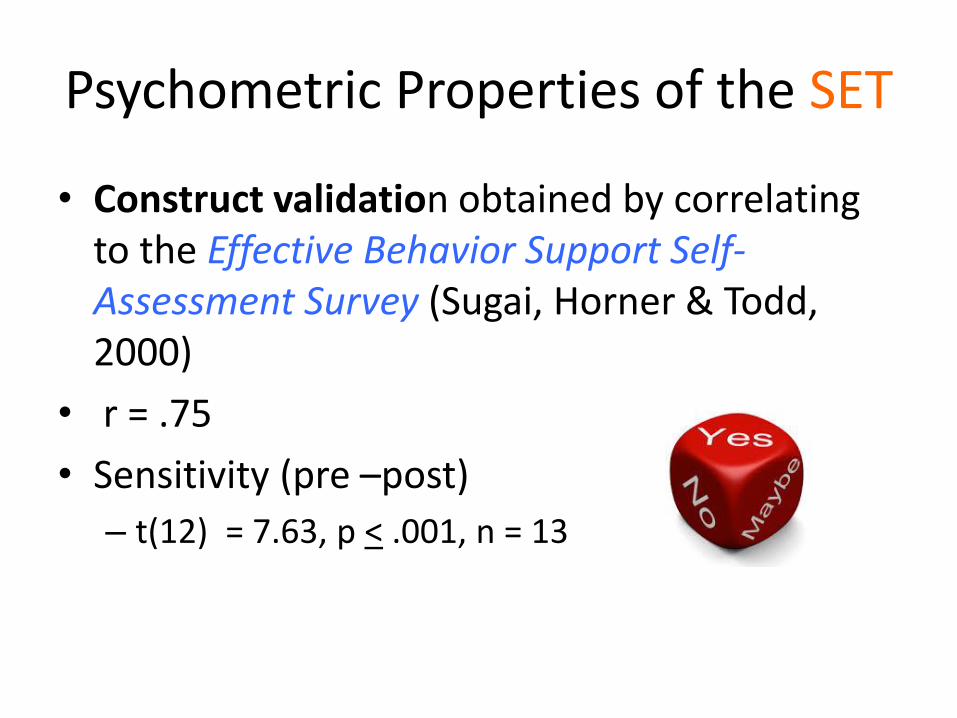
Psychometric Properties of the SET
• Construct validation obtained by correlating to the Effective Behavior Support Self-Assessment Survey (Sugai, Horner & Todd, 2000)
• r = .75
• Sensitivity (pre –post)
– t(12) = 7.63, p < .001, n = 13

Psychometric Properties of the SET
• Criterion related validity was reported based on the reduction of school-wide discipline referral measures as indices of SW-PBIS status
– (Irvin, Tobin, Sprague, Sugai & Vincent, 2004, Irvin, et al., 2006).

Psychometric Properties of the SET
• Reliability Analysis (Horner et al., 2004)
• Internal consistency = .95 for total scale, n = 45
• test-rest reliability r = .97 for total scale , n = 8
• inter-observer agreementaverage across items and school
99%, n = 17

Re-evaluation of the SET
• Vincent, Spaulding and Tobin (2010)
• Internal consistency
– Violation of assumptions
– Interpretations of coefficient alpha
• Standard Error of Measurement (SEM) Analysis
• Principal Components Analysis (PCA)

Violation of Assumptions (SET)
• Random Sampling of the Population
• Random Sampling of Items
• Independence of Items
• Differential decision making
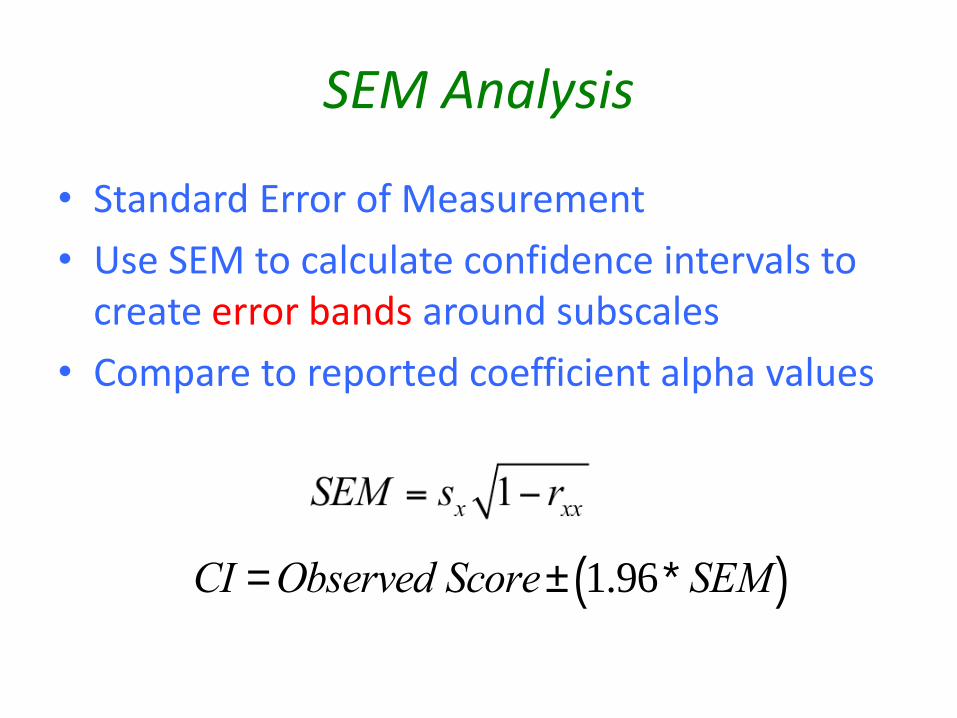
SEM Analysis
• Standard Error of Measurement
• Use SEM to calculate confidence intervals to create error bands around subscales
• Compare to reported coefficient alpha values
CI =Observed Score± 1.96*SEM( )
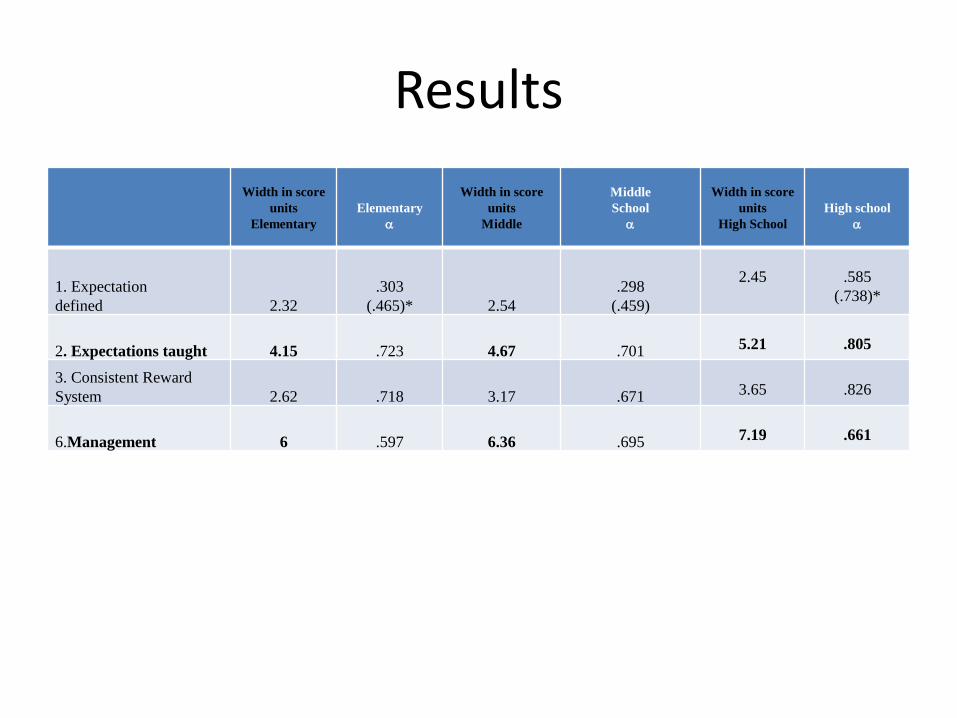
Results
Width in score
units
Elementary
Elementary
Width in score
units
Middle
Middle
School
Width in score
units
High School
High school
1. Expectation
defined 2.32
.303
(.465)* 2.54
.298
(.459)
2.45 .585
(.738)*
2. Expectations taught 4.15 .723 4.67 .701 5.21 .805
3. Consistent Reward
System 2.62 .718 3.17 .671 3.65 .826
6.Management 6 .597 6.36 .695 7.19 .661
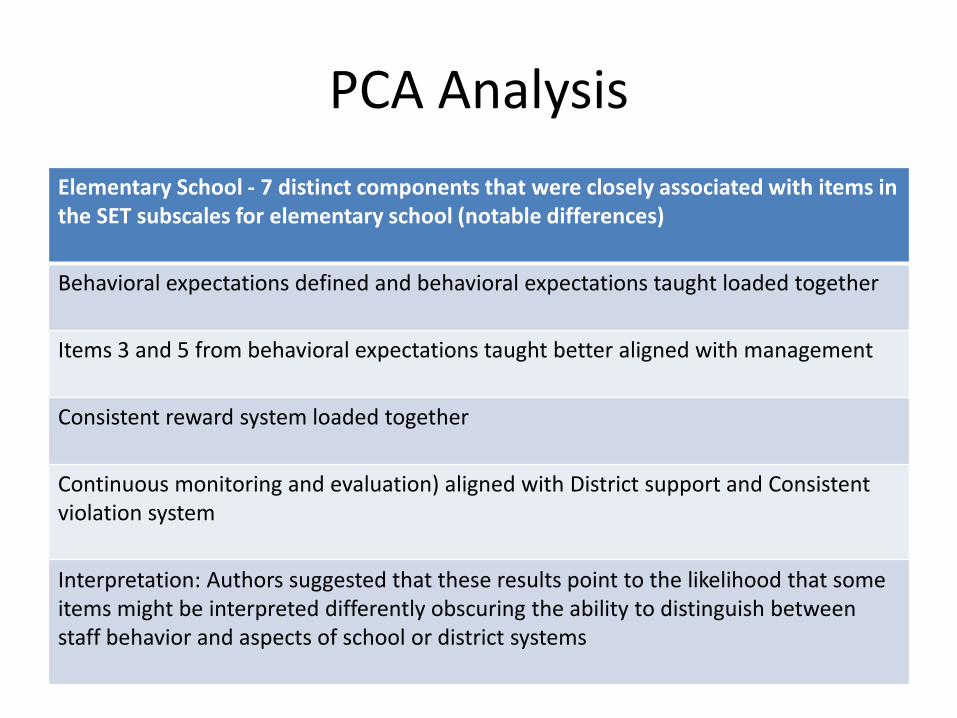
PCA Analysis
Elementary School - 7 distinct components that were closely associated with items in the SET subscales for elementary school (notable differences)
Behavioral expectations defined and behavioral expectations taught loaded together
Items 3 and 5 from behavioral expectations taught better aligned with management
Consistent reward system loaded together
Continuous monitoring and evaluation) aligned with District support and Consistent violation system
Interpretation: Authors suggested that these results point to the likelihood that some items might be interpreted differently obscuring the ability to distinguish between staff behavior and aspects of school or district systems

PCA Analysis
Middle School - 8 distinct components
Subscale 1 through 3 combined into one component,
Subscale 5 aligned similarly to the SET. In addition, item 5 from subscale 2 (behavioral expectations taught aligned with these items.
Subscale 6 (management) aligned with 2 different components identified as “crisis response” and “handling of problem behavior.”
Continuous monitoring and evaluation aligned with District support and Consistent violation system
Three additional items aligned as a previously unidentified “system” component
One item did not align with any of the other items.

PCA & SEM Summary for SET
• PCA analysis for elementary and middle school This evidence along with SEM analysis
– “behavioral expectations taught”
– “management”

BUT….WHAT ABOUT THE PRE-SET?

What about the Pre-SET?
• Additional analysis used to interpret coefficient alpha for the Pre-SET?

Pre-SET Subscales to measure PW-PBIS
8 Subscales with 38 items– Defined expectations in the classroom
– Behavioral expectation instruction
– Appropriate responses to behavior
– Presence of an organized and predictable environment
– Use of data collection for monitoring and decision making
– Family involvement
– Management
– Program Support

Pre-SET Reliability Analysis
Subscale Item M SD ritem total rsubscale rsubscale-total SEM
Expectations
defined
M= 62.79
SD = 35.77
1
2
3
* 1 item
missing
1.51
1.39
.86
.79
.80
.95
.44
.62
.73
.66
.73
.57
.67 .80 .96
Behavioral
expectations
taught
M = 59.74
SD = 35.99
1
2
3
1.37
1.39
.83
.92
.82
.85
.68
.42
.40
.64
.58
.63
.56 .78 1.01

Pre-SET Reliability Analysis
Subscale Item M SD ritem total rsubscale rsubscale-total SEM
Responses to
appropriate
and
challenging
behavior
M = 64.20
SD = 26.63
1
2
3
4
5
*2 items
missing
1.38
1.38
1.30
1.36
1.01
.90
.93
.76
.94
.95
.12
.22
.36
.41
.25
.23
.33
.34
.43
.26
.39 .55 1.78
Organized
and
predictable
environment
M = 74.49
SD = 26.42
1
2
3
4
5
1.37
1.89
1.29
1.42
1.48
.84
.34
.87
.90
.88
.57
.24
.35
.44
.50
.52
.34
.33
.54
.56
.59 .69 1.47

Pre-SET Reliability Analysis
Subscale Item M SD ritem total rsubscale rsubscale-total SEM
Monitoring
and Decision
Making
M = 42.28
SD = 37.03
1
2
3
*1 item
missing
.94
.93
.67
.89
1.00
.87
.49
.64
.62
.32
.72
.64
.71 .72 1.18
Family
Involvement
M= 38.86
SD = 31.49
1
2
3
*2
items
missing
1.11
.70
.53
.96
.80
.78
.34
.61
.33
.53
.58
.16
.54 .59 1.21

Pre-SET Reliability Analysis
Subscale Item M SD ritem total rsubscale rsubscale-total SEM
Management
M= 33.91
SD = 4.09
1
2
3
4
5
*1 Item
Missing
.77
.66
.65
.83
.49
.98
.88
.93
.97
.83
.57
.61
.53
.62
.64
.89
.83
.82
.90
.69
.52 .94 1.00
Program
support
M= 57.58
SD = 41.21
1
2
3
* 1 item
missing
.90
1.29
1.27
.10
.95
.94
.75
.62
.54
.71
.64
.65
.71 .82 1.05
Total Score 30 items/
* 8 items
missing
53.86 24.73 .91 4.25

Pre-SET Reliability Analysis
• Violation of the same assumptions
•Random Sampling of the Population
•Random Sampling of Items
• Independence of Items
•Differentiated decision making

95% Confidence Intervalcomparisons to coefficient values

Discussion• It is likely that revision to the Pre-SET is necessary based on
SEM analysis alone.
• Further analysis using PCA could provide more information to support cohesiveness and dimensionality among the current subscales

Summary
• Based on this analysis:
– Improving the Pre-SET could provide a reliable tool to establish PW-PBIS strategies as a valid practice in preschools
• If so, documenting change in student behavior might be possible

ReferencesAmerican Educational Research Association, & National Council on Measurement in Education. (2004). Standards for educational and psychological tests and manuals. American Psychological Association (Ed.). American Psychological Association.Benedict, E. A., Horner, R. H., & Squires, J. K. (2007). Assessment and implementation of positive behavior support in preschools. Topics in Early Childhood Special Education, 27(3), 174-192. doi:10.1177/02711214070270030801Carter, D. R., & Van Norman, R. K. (2010). Class-wide positive behavior support in preschool: Improving teacher implementation through consultation. Early Childhood Education Journal, 38(4), 279-288.Cronbach, L. J., & Shavelson, R. J. (2004). My current thoughts on coefficient alpha and successor procedures. Educational and psychological measurement, 64(3), 391-418.Horner, R. H., Sugai, G., & Anderson, C. M. (2010). Examining the evidence base for school-wide positive behavior support. Focus on Exceptional Children, 42(8), 1-14. Horner, R. H., Todd, A. W., Lewis-Palmer, T., Irvin, L. K., Sugai, G., & Boland, J. B. (2004). The School-Wide Evaluation Tool (SET) A Research Instrument for Assessing School-Wide Positive Behavior Support. Journal of Positive Behavior Interventions, 6(1), 3-12.Irvin, L. K., Horner, R. H., Ingram, K., Todd, A. W., Sugai, G., Sampson, N. K., & Boland, J. B. (2006). Using Office Discipline Referral Data for Decision Making About Student Behavior in Elementary and Middle Schools An Empirical Evaluation of Validity. Journal of Positive Behavior Interventions, 8(1), 10-23.Irvin, L. K., Tobin, T. J., Sprague, J. R., Sugai, G., & Vincent, C. G. (2004). Validity of office discipline referral measures as indices of school-wide behavioral status and effects of school-wide behavioral interventions. Journal of Positive Behavior Interventions, 6(3), 131-147.Messick, S. (1995). Validity of psychological assessment: validation of inferences from persons' responses and performances as scientific inquiry into score meaning. American psychologist, 50(9), 741.Nunnally, J. C., (1975) Psychometric theory 25 years ago and now, Educational Researcher, 4, 7-20 as cited in Steed, E. A., & Mi-young, L. W. (2013) The Psychometric Properties of the Preschool-Wide Evaluation Tool (PreSET). Journal of Positive Behavior Interventions, 15(4), 231-241.Nunnally, J. C. & Bernstein. I.H. (1994). Psychometric theory as cited in Vincent, C., Spaulding, S., & Tobin, T. J. (2009). A reexamination of the psychometric properties of the school-wide evaluation tool (SET). Journal of Positive Behavior Interventions. 12, 161-79.Steed, E.A. & Pomerleau, T.M. (2012). Pre-school wide evaluation tool (Pre-SET) manual, Research edition, Baltimore: Brookes Publishing,Steed, E. A., Pomerleau, T., & Horner, R. H. (2012). Preschool-wide Evaluation Tool: Research edition. Baltimore, MD: Paul Brookes.Steed, E. A. & Webb, M.L. (2013). The Psychometric Properties of the Preschool-Wide Evaluation Tool (PreSET). Journal of Positive Behavior Interventions, 15(4), 231-241.Sugai, G., & Horner, R. R. (2006). A promising approach for expanding and sustaining school-wide positive behavior support. School psychology review, 35(2), 245.Sugai, G., Horner, R. H., & Todd, A. W. (2000). Effective behavior support: Self-assessment survey. Eugene, OR: University of Oregon, Educational and Community SupportsSugai, G., Lewis-Palmer, T., Todd, A., & Horner, R.H. (2001). The school-wide evaluation tool (SET). Eugene: University of OregonVincent, C., Spaulding, S., & Tobin, T. J. (2010). A reexamination of the psychometric properties of the school-wide evaluation tool (SET). Journal of Positive Behavior Interventions. 12, 161-79.Williams, B., Brown, T., & Onsman, A. (2012). Exploratory factor analysis: A five-step guide for novices. Australasian Journal of Paramedicine, 8(3), 1.